Watch the Market tutorial videos on YouTube
How to buy а trading robot or an indicator
Run your EA on
virtual hosting
virtual hosting
Test аn indicator/trading robot before buying
Want to earn in the Market?
How to present a product for a sell-through
Expert Advisors and Indicators for MetaTrader 5 - 36
Deriv Volatility Bot is a powerful and easy-to-use trading algorithm designed specifically for Deriv’s Volatility Index assets . After extensive backtesting and real-market use, this EA has been fine-tuned to handle the unique characteristics of synthetic indices . While it is optimized for Deriv's Volatility Index assets , it can also be used for other instruments like currency pairs and gold . However, due to its specialized design, it performs best on Deriv’s synthetic indices. The EA is extr

Aurum Synergy – The Dual-Engine Trend Master for XAUUSD (Gold) Aurum Synergy is a sophisticated, non-Martingale, non-Grid Expert Advisor designed to methodically capitalize on prevailing trends in the XAUUSD (Gold) market. We believe in quality over quantity, focusing on capturing high Risk-Reward Ratio (RR) trades by riding sustained trends. Live signal MT5 : Click Here
Usage Recommendations: Symbol: XAUUSD Timeframe: Attach to the H1 chart. Leverage: A leverage of 1:100 or higher is reco

GRAVOTA - Professional Momentum Spike Scalping Expert Advisor Product Overview Gravota is an advanced momentum-based scalping Expert Advisor developed by Sapplanta Enterprise. This sophisticated trading bot specializes in detecting and capitalizing on rapid price movements (spikes) in real-time, executing trades with precision timing and professional-grade risk management. VERSION 1.10 - Universal Broker Compatibility Update Now featuring automatic adaptation to any broker's lot size requiremen

BUILD YOUR GRID
The expert is a system to help any trader to make a grid of orders (without martingale, lite martingale, or full martingale) easy and simple. Please make your test to find your settings. Default settings are just to take an idea of how the expert works. The expert can make according or contrary grid of orders. You can set the expert to work in hedge mode if the losses are huge. The system uses a high-risk strategy. It's better to test it first in a demo account. Version for MT4:
FREE

Expert Advisor Duplicator repeats trades/positions a preset number of times on your account MetaTrader 5 . It copies all deals opened manually or by another Expert Advisor. It is possible to increase the lot size of the signals. Copies signals and increases the lot from signals! MQL5 Signal Lot Increase; The following functions are supported: custom lot for copied trades, copying StopLoss, TakeProfit, use of trailing stop and much more. MT4 version
Full Description +DEMO +PDF How To

Are you tired of traditional trading approaches that rely on risky strategies like martingale or grid systems? Look no further! Welcome to the world of Fimath, a revolutionary and sophisticated trading system that uses the power of Fibonacci analysis. About the strategy: Fimath is a momentum based strategy based on market structure. This tool allows us to place lines at points of support and resistance. Thereafter Fimath will automatically adjust, extend and trade these levels. If you prefer to

Volume Profile Indicator – User Guide Description: The Volume Profile Indicator is a powerful tool designed for MetaTrader 5. It visualizes market activity using volume distribution across price levels, showing: Histogram of volume at each price bin POC (Point of Control) – the price with the highest traded volume Value Area – the range covering a configurable percentage of volume (e.g. 70%) Support levels: Min, Max, and Pivot Average tick size for BUY and SELL movements Inputs and Parameters:
FREE
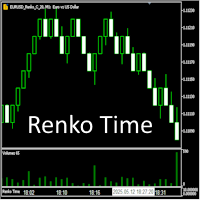
Индикатор предназначен для работы с ренко-графиками, построенными Renko Maker PRO или Renko Maker DEMO . Особенность реализации ренко-баров в терминале MetaTrader 5 такова, что из-за их вневременной природы (формирование новых баров зависит исключительно от изменения цены, а не от временных интервалов), время открытия каждого ренко-бара в истории оказывается искусственно сдвинутым в прошлое. Поэтому, чтобы видеть время открытия ренко баров, нужно воспользоваться этим индикатором Renko Time.
FREE

This powerful tool automatically identifies trend lines, helping you streamline your trading strategy and make more informed decisions. MT4 Version
Key Features Automatic Trend Line Detection : The "Basic TrendLine" indicator scans the market for potential trend lines and displays them on your chart instantly. This saves you valuable time and ensures you never miss an important trend. User-Friendly Panel : Our indicator comes with a beautiful, intuitive panel that allows you to easily draw a v

"BIG FIGURE INDICATOR" automatically identifies and draws horizontal lines on price charts at specific levels, such as whole numbers or half-numbers (e.g., 1.0000 or 1.5000 in currency trading). These levels are considered psychologically significant because they represent round numbers that big traders and investors may focus on, leading to potential support or resistance levels. The big figure indicator can help traders identify important price levels and make trading decisions based on these
FREE

GOLDEN VENOM SMC EA
Elite Institutional Trading Logic — Fully Automated & Validation-Safe
Unlock institutional-grade trading with the Golden Venom SMC EA, a precision-engineered automated system built to dominate XAUUSD and perform powerfully across all forex pairs. Designed using pure price action and Smart Money Concepts (SMC), this bot eliminates lagging indicators and trades using the same logic used by professional proprietary desks.
Whether you're an experienced trader or a beginner

The " YK Find Support And Resistance " indicator is a technical analysis tool used to identify key support and resistance levels on a price chart. Its features and functions are as follows:
1. Displays support and resistance levels using arrow lines and colored bands, with resistance in red and support in green.
2. Can be adjusted to calculate and display results from a specified timeframe using the forced_tf variable. If set to 0, it will use the current timeframe of the chart.
3. Uses th
FREE

HIGHLINDEREA EA - MQL MARKET DESCRIPTION
TITLE: Highlinderea EA - Multi-Timeframe Trading System with Advanced Risk Management
SHORT DESCRIPTION (max 120 characters):
Professional multi-timeframe EA with RSI, MACD, BB signals and advanced risk management. "There can be only one!"

Fully automated Expert Advisor for intraday trading using breakout and trend logic. It provides risk-management tools and trading-hours controls. Operation Signal generation on breakout/trend per user settings. Trading window to enable/pause execution. News filter to suspend trading around economic releases. Configurable Stop Loss and Take Profit (fixed or percentage). Optional trailing stop and break-even; daily close at profit/loss targets. Configurable daily drawdown limit. Execution control
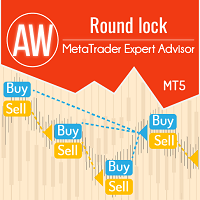
Round Lock is a smart advisor with dynamic position locking. Round Lock is an intelligent advisor with the function of dynamic position locking, an advanced trading advisor that implements a two-way order locking strategy with a gradual position growth and dynamic adaptation to the market . Advantages of Round Lock: Risk control through position locking, Dynamic growth of volumes in trending areas of the market, Flexible behavior settings depending on limits, Suitable for flat and trend phases,

Quant PRO is a professional automatic trading system designed and optimized for the MT5 platform and multi currency pair. Uses genetic optimizations and all its settings are adjusted on an ongoing basis to this it does not require optimization, During its operation all parameters are adjusted to current trends and market volatility. EA automatically selects the currency pairs it works on, You only need to run them on AUDCAD symbol and you don't have to adjust anything. Tested in sample and in o

This indicator is a simple tool to spot a possible trend.
When the ribbon below the price bars, It will turn to Green color and the trend is seen to be bullish When the ribbon above the price bars, it will turn to Red color and the trend is seen to be bearish. It can be used a either Entry Signal Exit Signal or trailing stop, so it is very versatile. By default color : Green is UP trend and Red is Down trend and this work perfect with Bar4Colors.ex5
FREE
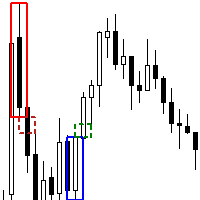
The Order Block FVG Box indicator for MetaTrader 5 is a powerful tool designed for discerning traders looking to identify and capitalize on high-probability trading opportunities. This indicator excels at pinpointing valid Order Blocks that are immediately followed by Fair Value Gaps (FVG), enhancing your trading strategy with precise visual cues. Key Features: Order Block Identification : Detects valid Order Blocks, which are significant areas where institutional buying or selling has occurred,
FREE

Chanlun Master: A Fusion of Eastern Market Philosophy and Neural Networks Chanlun Master is a professional trading robot that combines the legendary Chinese theory of price movement with modern Deep Learning technologies.
History: What is Chanlun? In 2006, a mysterious trader appeared in the Chinese segment of the internet under the pseudonym Chan Shi ("Zen Master"). He published a series of articles describing a unique mathematical structure of the market, which he called "Chanlun" . Unlike

This comprehensive technical indicator calculates and plots up to 3 moving averages with 3 different periods. By employing three moving averages of distinct lookback periods, the trader can confirm whether the market has indeed experienced a change in trend or whether it is merely pausing momentarily before resuming its prior state. SX Golden MA Pack for MT4 is available here . The shorter the moving average period, the more closely it tracks the price curve. When a security initiates an upt
FREE

SwissProEAfree - Automated Trading Robot What Does This Bot Do? The SwissProEA is a fully automated trading robot based on proven technical indicators that searches for profitable trading opportunities 24/7. Main Features Intelligent Signals Moving Average Crossover : Detects trend changes through fast and slow moving average crossovers RSI Filter : Avoids trades in overbought/oversold conditions Price Action : Confirms signals through candlestick patterns ATR Volatility : Adjusts Stop-Lo
FREE

通貨ペア XAUUSD(GOLD) 時間足 H1 推奨証拠金 $1,000(0.01lots) ドローダウン 286.93 (6.30%) 保有期間 Minimal position holding time: 0:51:00 Maximal position holding time: 249:59:59 Average position holding time: 18:27:34 【概要】 Catboostを用いた機械学習EAです。 特徴量には短期・中期・長期のトレンド、オシレーター、ボリュームインジケーターなど88個を使用。 特に、時間的特徴を強調させました。 最終の学習期間は2003.1.1-2024.12.31を使用しています。 テスト期間は2025.1.1-としています。 目的変数は3クラス、Buy,Sell,Holdを分類学習しています。 6分割のCPCVでハイパーパラメーターの検証を行いイレギュラーに最も強い性能を発揮したモデルを採用しました。 カーブフィッティングEAとは違い、長期的に運用が期待できるAIトレードを実現しています。 Catb

GoldHunter EA – Precise Gold Trading with Fixed TP/SL GoldHunter EA is a fully automated Expert Advisor, specially designed to trade XAUUSD (gold). It uses a strategy based purely on price action—no indicators, no grid, no martingale. Each trade follows a strict risk management model with fixed levels of Take Profit (TP) and Stop Loss (SL) for maximum consistency. GoldHunter was created by a young 17-year-old developer with no initial capital, driven by passion and precision. This EA aims to mak
Introducing Machine Wizard, the ultimate solution for mastering the complexities of forex trading. This cutting-edge Expert Advisor (EA) is meticulously designed to enhance your trading strategy through its unique structure—leveraging the power of 11 fully independent baskets of trades, each with a distinct magic number for precision and control.
What truly sets Machine Wizard apart is the strategic use of these 11 baskets: •Five baskets are designed to trade against the trend, giving you the f

Get alerts when a trend is breaking out. This indicator signals when price makes a large move in the direction of the dominant trend. These signals can serve as entry points, or points to add to an existing position in a trend. Note: Trend following has a low win rate (less than 50 percent), but the return of the average winning trade is typically 3 to 5 times larger than the average losing trade. Simple Setup Drag and drop onto any chart, at any timeframe. Enable alerts (optional) And you're d
FREE

MAFX Trading Manager Professional Manual Trade Management Panel for MetaTrader 5
Product Overview MAFX Trading Manager is a professional manual trade management panel for MetaTrader 5, designed to help traders execute and manage trades more efficiently. It provides fast order execution and essential trade management tools in a compact and user-friendly interface. This product is intended for manual traders who want greater control, speed, and consistency when managing their trades, without r
FREE

TrendMaster XAU Pro EA
Precision in Gold. Power in Silence. Overview:
TrendMaster XAU Pro EA is a sophisticated trend-following system engineered for trading XAUUSD (Gold) across all timeframes. Built on a foundation of convergence logic and multi-indicator validation, this EA adapts fluidly to market shifts—quietly navigating the chaos with purpose and precision. Strategic Essence:
While the full logic remains proprietary, TrendMaster XAU Pro EA operates through a layered synergy of mome
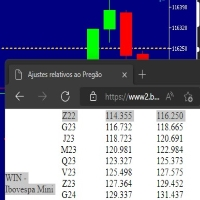
Este script marca no gráfico do ativo BRA50 da active trades o ponto de ajuste do contrato futuro do Mini Índice Brasileiro (WIN),
***ATENÇÃO*** para este script funcionar é necessário autorizar a URL da BMF Bovespa no Meta Trader. passo a passo: MetaTrader 5 -> Ferramentas -> Opções -> Expert Adivisors * Marque a opção "Relacione no quadro abaixo as URL que deseja permitir a função WebRequest" e no quadro abaixo adicione a URL: https://www2.bmf.com.br/ este indicador usa a seguinte página par
FREE

This is the Volume Avarage Weighted Price (VWAP) it's a indicator that shows where is the avarage of the current volumes and the levels at which the price is considered premium, above the second upper band, or discount, under the second lower band, it's also very usefull to use the VWAP level as a target for operations since it's a very liquid level so the price it's attracted to it. feel free to leave a feedback either positive or negative based on your expereince with this indicator, enjoy the
FREE

LL High Frequency HFT EA is a High Frequency Trading Expert Advisor that uses a very fast and high-performance proprietary execution code capable of executing high-frequency and low-latency opening tasks.
It also integrates within its code an instant closing system for all orders , unlike systems that close orders in a loop, losing precious milliseconds that are essential in HFT systems. Please read the guide carefully before you start using EA, so you can know all the features and my suggesti

The Range Filter Buy and Sell indicator is a trend-following technical analysis tool designed to identify optimal entry and exit points in the market. It filters out market noise by creating dynamic bands around price movements, generating clear buy and sell signals when price breaks through these bands. Key Features Dynamic Range Filtering : Uses a sophisticated algorithm to calculate adaptive bands that adjust to market volatility Trend Identification : Clearly visualizes the current trend dir
FREE

Cryptocurrency analysis has never been easier with Crypto Charts for MetaTrader 5. Unlock the power of cryptocurrency trading with Crypto Charts for MetaTrader 5. Analyze data from Bitcoin to altcoins effortlessly, leveraging thousands of MQL5 indicators and Expert Advisors. Key Features: Real-Time Data : WebSocket support for Binance Spot and Futures for high-frequency trading Comprehensive Data : Access OHLC, Ticks, and Depth of Market. Seamless Integration : Operates as a background service,
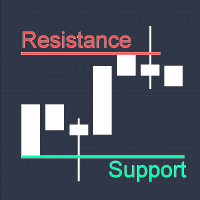
True Support Resistance Indicator: Your Ultimate Tool for Precise Trading Decisions Quick Overview It's a simple indicator that elevates your trading strategy. True Support Resistance Indicator is a powerful tool designed to identify key support/resistance levels in real-time. Experience clean visuals, instant alerts on breakouts, and dynamic updates that keep you ahead of market movements. Why Choose True Support Resistance Indicator? 1. Simplicity Meets Precision - Two clearly colored
FREE

GOLD GRABBER Israel L. MT5 Grid-Hedge EA. WARNING: EA has Optimised sets for GOLD (XAUUSD) ONLY (Minimum Capital: $1000) Download sets below:
Use these sets for XAUUSD: https://drive.google.com/drive/folders/1FBfc-eE7B7APhZ-P754R76d3xih8OnXX?usp=sharing
Professional Grid-Hedge Trading System with Advanced Risk Management This sophisticated Expert Advisor employs a dual-directional grid strategy designed for consistent performance in volatile markets. The system opens positions in both directi

Idea extracted from the books by Anna Coulling and Gavin Holmes using Volume and Spread Analysis (VSA) techniques coupled with Al Brooks' expertise with Price Action these candles are magical, identify the exact moment
of the performance of the big players are acting in the market represented by the colors:
1) Red Candles we have an Ultra High activity,
2) Candles Orange we have a Very High Activity
3) Candles Yellow we have one High Activity
4) White Candles represent normal activity in
FREE

Gold is Hot EA is based on the author’s personal WAT indicator which is a combination of volatility and MACD indicator. The EA will accurately detect the beginning of uptrends with blue arrow and downtrends with red arrow, and will control open trades in a martingale/grid style until it hits TP. Recommended pairs: All major pairs like xauusd; eurusd; audusd; gbpusd; nzdusd and also minor pairs like audcad; nzdcad; eurnzd and eurcad on m15 or higher time frames. Settings: Start Hour – Startin

Identify key turning points with reliable fractal analysis
This indicator examines the price structure of fractals of different periods to determine possible reversal points in the market, providing timing to positional traders that already have a fundamental or technical valuation model. Unlike its younger brother, Reversal Fractals , this indicator won't miss reversals because of the period selected, and will find reversal fractals on a zig-zag fashion, ignoring those reversals which do not

CPR Pivot Lines It Will Draw Pivot Point R1,R2,R3 S1,S2,S3 Tc Bc Best Part Is That You Can Even Add Values Of High,Low,Close Manually Also To Get Your All Levels On Chart.So If Your Broker Data Of High ,Low ,Close Is Incorrect Then You Don’t Have To Depend On Them Anymore. You Can Even Modify All Lines Style. It Will Show Line In Floting Style And Not Continues Mess.
FREE

Dark Support Resistance is an Indicator for intraday trading. This Indicator is programmed to identify Support and Resistance Lines , providing a high level of accuracy and reliability.
Key benefits
Easily visible lines Only the most important levels will be displayed Automated adjustment for each timeframe and instrument Easy to use even for beginners Never repaints, never backpaints, Not Lag 100% compatible with Expert Advisor development All types of alerts available: Pop-up, Email, Push
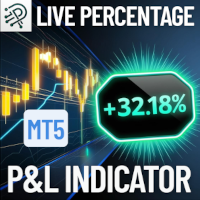
Quickly monitor your floating profit or loss as a percentage of your account balance live and always visible right on your chart! Key Features: Real-Time Calculation: Instantly calculates the combined floating profit or loss from all open trades as a percentage of your current account balance. Easy On-Chart Display: The result is conveniently shown as a label in the lower-right corner of your chart no distractions, always visible. Clear Color Coding: Green for profit, red for loss for immediate
FREE

Display rectangles and trendlines list from Trading box Technical analysis tool. Objects are ordered in the list by pip distance that is difference between object price and Bid price. With this tool you will know which chart to look for next trading opportunity. No more switching between charts and searching for trades where price is close to rectangle zone or trendline support resistance level. Sorted Rectangles and Trendlines by pip distance - If you are trading on multiple charts, the
FREE

Easily get all relevant economic events of the current day right into your chart, as markers. Filter what kind of markers do you want: by country (selected individually) and by Importance (High relevance, Medium, Low or any combination of these). Configure the visual cues to your liking. If there is more than one event set to the very same time, their Names will be stacked and you will see the messages merged with the plus (+) sign on the marker. Obviously that long or too much events on the sam
FREE

This is the famous Sunflower indicator for Metatrader5. This indicator marks possible tops and bottoms on price charts. The indicator identifies tops and bottoms in the asset's price history, keep in mind that the current sunflower of the last candle repaints, as it is not possible to identify a top until the market reverses and it is also not possible to identify a bottom without the market stop falling and start rising. If you are looking for a professional programmer for Metatrader5, please
FREE

SuperTrend Gold MT5 V3.1 – Gold Spot EA Based on SuperTrend Indicator The Supertrend Gold EA MT5 is the automated trading version of our popular Supertrend Line for MT5 indicator.
It follows the same proven trend logic, but with the added benefit of fully automatic trade execution and management. The EA enters trades based on SuperTrend signal changes and closes them either when a user-defined Take Profit is reached or when an opposite signal appears. No Stop Loss is used , and all risk is cont
FREE

G-Labs Market Maker Dashboard - Exclusive Seasonal Offer Elevate your trading with the original G-Labs Market Maker Dashboard, available for a limited time at just $70 USD. Ideal for starter traders, this dashboard has been enhanced with new features and now includes a comprehensive training video. This indicator is for people trading the market makers method and is the entry level dashboard for that strategy is available for both mt4 and mt5. its a market scanner in real time showing peak forma

Overview: The US Dollar Index (DXY) is a key financial indicator that measures the strength of the US Dollar against a basket of six major world currencies. This index is crucial for traders and investors as it provides a comprehensive view of the overall market sentiment towards the US Dollar and its relative performance. All Products | Contact Composition: The DXY's composition is as follows: Euro (EUR): 57.6% Japanese Yen (JPY): 13.6% British Pound (GBP): 11.9% Canadian Dollar (CAD): 9.1%
FREE
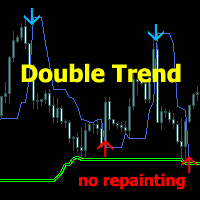
Trading System Double Trend MT5 - an independent trading system consisting of several indicators. Determines the direction of the general trend and gives signals in the direction of price movement.
Can be used for scalping, intraday or weekly trading.
Features
Works on any time frames and trading instruments (forex, cryptocurrencies, metals, stocks, indices.) Simple visual reading of information that does not load the chart The indicator does not repaint and does not complete signals Works onl

Headline: Ultimate Account Protection for Prop Firm Traders! Are you afraid of hitting your Daily Drawdown? Titanium Prop Guard Pro is your professional silent partner that monitors your equity 24/7. It is specifically designed for traders who want to secure their funded accounts and never worry about breaching Prop Firm rules again. Main Features: ️ Smart Daily Loss Limit: Automatically closes all trades if your loss hits the limit. Target Profit Locker: Reach your daily goal? The EA will
BRAIN Indicator – Smart Buy & Sell Signal Tool (MT5) BRAIN Indicator is a powerful signal generator designed to detect high-probability trade setups based on smart combinations of momentum and price behavior. Built for precision, it displays clear BUY/SELL arrows directly on your chart — no repaint, no confusion. Fully compatible with Volatility Indices (e.g., V75), Forex, Crypto, and more.
Fast. Focused. Built to trade smart — like a brain.
Key Features: Clean signal

Risk Reward Tool – Smart Trade Planning Indicator The Risk Reward Tool is a simple yet powerful indicator designed to help traders plan every trade with confidence .
It instantly calculates and displays your Entry, Stop Loss, Take Profit, and Risk : Reward Ratio (RR Ratio) directly on the chart. With just a few clicks, you’ll know: How much you risk if your Stop Loss is hit How much you can earn if your Take Profit is reached ️ The exact Risk : Reward Ratio so you can decide if the trade
FREE

This SMT (Smart Money Technique) divergence indicator identifies discrepancies in price movement between two different trading symbols, helping traders detect potential market reversals. This tool compares the price action of two correlated assets, such as two currency pairs or indices, to spot divergences where one asset's price moves in the opposite direction of the other. For example, while one symbol may be making higher highs, the other might be making lower highs, signaling a divergence. T
FREE

Quantum DCA Trader is a powerful, automated trading tool for MetaTrader 5 (MT5), designed to manage trades efficiently with a focus on Dollar Cost Averaging (DCA) strategies, risk control, and performance optimization. Built on advanced algorithms, it combines auto-entry mechanisms, grid trading, trailing stops, and news filters to adapt to volatile markets while protecting your capital. The EA supports both automated and manual orders, making it suitable for novice and experienced traders alike
FREE

Candle Number Indicator for MetaTrader 5 The Candle Number Indicator displays a numeric label on each candlestick, starting from the most recent bar. This tool assists traders in visually tracking candle progression, which may support strategies based on time, structure, or pattern identification.
Features: Numbers each candle from the current bar backward Allows custom color, horizontal or vertical text orientation, and label offset Option to limit display to recent candles (e.g., last 10 bar
FREE

BTC Ultra Scalp Pro – Professional Bitcoin Trading Solution BTC Ultra Scalp Pro is a fully automated Expert Advisor specifically engineered for the high-volatility Bitcoin (BTCUSD) market. Unlike risky martingale or grid systems, this EA utilizes a logic-based trend-following strategy protected by advanced volatility filters. The system identifies high-probability breakout and trend-continuation setups using a combination of Moving Averages, SuperTrend, and Momentum indicators. Crucially, it emp

BBMA by RWBTradeLab is a clean chart-plotting indicator for MetaTrader 5 that combines Bollinger Bands , Linear Weighted Moving Averages (LWMA) on High/Low , and an EMA on Close to help traders read market structure visually. What it plots Bollinger Bands (Upper / Basis / Lower) LWMA on Low : 5 & 10 periods LWMA on High : 5 & 10 periods EMA on Close : default 50 periods Key features Plot-only indicator (no alerts, no trade execution) Non-repainting calculations (standard indicator plotting) Opti
FREE

This indicator combines TRIX (Triple Exponential Moving Average) with a Moving Average, which can be simple, exponential, smoothed or weighted.
This combination is very useful to identify the main trend and when it is changing to a new direction.
The indicator also has signals on the chart that indicates the TRIX crossing with the Moving Average, as well as pop-up alerts and push (in the MT5 app).
Enjoy it!
FREE

In order for Trailing Money Python to work more efficiently, it was designed to be quite simple and plain and optimized by adding the Trailing Stop. The robot only trades in a 5 minute time frame. There is a saying that brokers often use: "Earnings are worthy of the wallet!" Here, we see this word as a philosophy of trade. Therefore, we developed this robot.
** Timeframe: 5 Minutes
** Supported: ***Especially Stocks at Futures
** The minimum amount depends on the margin requirement of the
Discover the Simplicity of Trading Correlated Symbols with Easy Correlations
Have you ever wanted to effortlessly master trading correlated symbols? Meet 'Easy Correlations' - your new best friend in navigating the intricate world of market correlations. Our tool is designed to simplify the complexities of trading, turning a challenging strategy into an accessible and profitable experience. The Concept Made Simple : At its core, 'Easy Correlations' revolves around a straightforward idea. Find
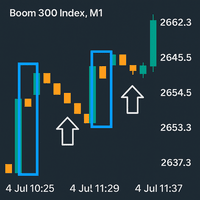
boom Spike Mitigation Zone Pro
A professional spike pattern indicator built for synthetic traders who scalp and swing Boom 500/300/1000/600/900with precision.
This indicator: Detects powerful 3-candle spike formations (Spike → Pullback → Spike) Automatically draws a clean box around the pattern Marks the entry price from the middle candle Extends a horizontal mitigation line to guide perfect sniper entries Automatically deletes & redraws the line once price touches it (mitiga
FREE
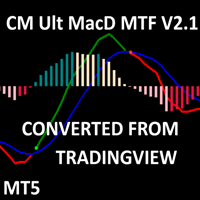
CM MACD Custom Indicator - Multiple Time Frame (V2.1) This advanced MT5 indicator, adapted from ChrisMoody’s TradingView script, delivers a powerful Multi-Timeframe MACD with customizable visuals and alerts. Plotting MACD lines, signal line, and a color-coded histogram, it highlights trend direction and momentum with distinct colors for growing/falling histograms above/below zero. Cross signals are marked with arrows, and users can enable alerts, email, or mobile notifications for buy/sell oppo
FREE

Display Order box list from Trading box Order Management tool. Find contacts and manual links on my profile . This dashboard gives you an edge in forex trading because in few seconds you can decide which pair and timeframe is worth to watch more closely. This is how you will not be distracted by all other forex pairs that you trade, and you will not miss great opportunities to trade the best price.
Trading Dashboard (order box overview panel and Trading box Order management extension) Tra
FREE

BUY INDICATOR AND GET EA FOR FREE AS A BONUS + SOME OTHER GIFTS! ITALO TREND INDICATOR is the best trend indicator on the market, the Indicator works on all time-frames and assets, indicator built after 7 years of experience on forex and many other markets. You know many trend indicators around the internet are not complete, does not help, and it's difficult to trade, but the Italo Trend Indicator is different , the Italo Trend Indicator shows the signal to buy or sell, to confirm the signal t

BUY INDICATOR AND GET EA FOR FREE AS A BONUS + SOME OTHER GIFTS! ITALO VOLUME INDICATOR is the best volume indicator ever created, and why is that? The Indicator works on all time-frames and assets, indicator built after 7 years of experience on forex and many other markets. You know many volume indicators around the internet are not complete, does not help, and it's difficult to trade, but the Italo Volume Indicator is different , the Italo Volume Indicator shows the wave volume, when market

AP Fibonacci Retracement PRO (MT5) Overview AP Fibonacci Retracement PRO is a trend-continuation pullback EA. It waits for a confirmed swing, calculates the Fibonacci retracement zone, and looks for entries in the direction of the original move.
No grid, no martingale. Strategy logic Detects the last valid swing high/low using Fractals on the selected signal timeframe. Calculates the retracement zone between 38.2% and 61.8% (configurable). On a closed bar, if price is inside the zone (with opti
FREE

The Anchored VWAP is a variation of the traditional VWAP, where the indicator's calculation starts from a specific point in time (the anchor), rather than being calculated from the start of the trading session or a fixed time interval. This can be useful for traders who wish to assess price behavior in relation to volume from specific events, such as major news, the start of a trend, or a technical event like the break of a support or resistance level. The indicator works on Forex, stocks, and i
FREE
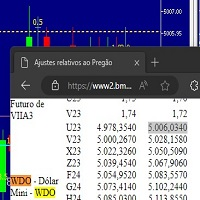
Este script marca no gráfico do ativo MINDOL da activ trades o ponto de ajuste do contrato futuro do Mini Dolar (WDO),
***ATENÇÃO*** para este script funcionar é necessário autorizar a URL da BMF Bovespa no Meta Trader. passo a passo: MetaTrader 5 -> Ferramentas -> Opções -> Expert Adivisors * Marque a opção "Relacione no quadro abaixo as URL que deseja permitir a função WebRequest" e no quadro abaixo adicione a URL: https://www2.bmf.com.br/ este indicador usa a seguinte página para buscar o a
FREE

Professional Percentage Levels Indicator Precision-engineered percentage levels based on period opening prices This professional trading tool automatically plots symmetrical percentage levels from Daily, Weekly, or Monthly opening prices, providing traders with clear reference zones for intraday and swing trading strategies. Note: As part of our initial release, this indicator is being made available at no cost for the first 100 users, or until 15 January 2025. Standard pricing of $49.00 applies
FREE

Daily Break & Retest Strategy (1D/1H Pattern) This Expert Advisor is a fully automated implementation of the "1D Pattern Nobody Talks About" strategy, popularized by RamtinFX . It is designed to capture high-probability continuations by utilizing the Daily (D1) range and executing precise entries on the Hourly (H1) timeframe. Original Strategy Source: Watch the Strategy Video by RamtinFX How It Works The strategy is based on a mechanical "Break and Retest" logic: Daily Range Analysis: The EA

INFOPad is an information panel that creates information on the selected currency pair in the MetaTrader 5 terminal. There are 5 functions of this indicator: Shows the main and main information on the selected symbol: Ask BID, Spread, Stop Level, Swap, Tick value, Commission prices; Shows the future targets of SL target and TP Target (The number of points of the established stop loss and take profit, the dollar amount); It shows the profit received for the periods: Today, Week, Month, Year, Tot
FREE

Fractal Model Indicator for Metatrader , meticulously crafted around the renowned Fractal Model by TTrades. This powerful tool empowers traders to navigate price action with precision, leveraging multi-timeframe analysis to anticipate momentum shifts, swing formations, and trend continuations. Designed for MetaTrader , the Fractal Model Indicator combines advanced algorithmic insights with customizable features, making it an essential addition for traders seeking to capitalize on expansive mar
MetaTrader Market - trading robots and technical indicators for traders are available right in your trading terminal.
The MQL5.community payment system is available to all registered users of the MQL5.com site for transactions on MetaTrader Services. You can deposit and withdraw money using WebMoney, PayPal or a bank card.
You are missing trading opportunities:
- Free trading apps
- Over 8,000 signals for copying
- Economic news for exploring financial markets
Registration
Log in
If you do not have an account, please register
Allow the use of cookies to log in to the MQL5.com website.
Please enable the necessary setting in your browser, otherwise you will not be able to log in.