适用于MetaTrader 5的EA交易和指标 - 41

BREAKOUT-SESSION-BOX LONDON EU US ASIA Open
watch the expectation of a volatile movement above or under the opening range We take the high of the range as Entry for a long trade and SL will be the low of the range and vice versa the low of the range as Entry for a short trade and the high for SL The size of the range is the distance to the TP (Take Profit) The range of the opening hours should not be larger than about 1/3 of the average daily range 4 breakout examples are already predefined: A
FREE

通过 Close Manager MT5 优化您的交易关闭流程,这是一款强大的专家顾问(EA),专为 MetaTrader 5 上的手动或 EA 开立的交易自动执行退出操作,为交易者提供对退出策略的精确控制。在 MQL5、Forex Factory 和 Reddit 的 r/Forex 上广受好评,因其多样化且可定制的关闭标准而备受推崇,这款 EA 深受外汇、指数和加密货币等波动市场中的剥头皮交易者、日内交易者和波段交易者的青睐。用户报告称,手动交易管理时间减少了 30-50%,风险控制得到改善,许多人指出通过遵循严格的退出规则提高了盈利能力。Close Manager MT5 非常适合希望在无需持续监控的情况下优化风险管理和退出效率的交易者,支持新手和经验丰富的交易者采用多样化的交易策略。 Close Manager MT5 提供了一套强大的可定制参数,用于根据利润/损失金额(PROFIT_AMOUNT: 0, LOSS_AMOUNT: 10)、百分比(PROFIT_PERCENT: 0, LOSS_PERCENT: 0)、K 线数量(CLOSE_AFTER_N_CANDLE: 0)
FREE
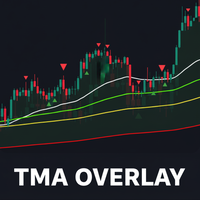
TMA Overlay Indicator for MT5 - User Guide 1. Introduction TMA Overlay is a versatile technical analysis indicator for the MetaTrader 5 platform. The indicator's goal is to provide traders with a comprehensive overview of the trend, potential entry signals, and key trading sessions, all integrated into a single chart. This is not a trading system, but a comprehensive analysis tool designed to help you make more informed decisions. 2. Core Indicator Components The indicator consists of multiple c
FREE

Welcome to the future of algorithmic trading.
The Nascore Scalper EA is a precision-engineered, AI-inspired scalping robot built exclusively for trading NAS100 (US Tech 100 Index) . It analyzes smart money footprints, breakout zones, and high-timeframe bias to capture high-probability scalping entries. Key Features: Optimized for NAS100 (US100) – Fast-moving Nasdaq-based index trading Smart Money Concepts – Integrates structure, breakout logic, and bias Minimal Margin Usage – Ideal for traders
FREE

Cloud DCA Pro EA - 高级Ichimoku DCA交易系统 产品概述 Cloud DCA Pro是一款复杂的智能交易顾问,结合了Ichimoku Kinko Hyo分析与智能美元成本平均法(DCA)策略。专为寻求系统化、无情绪交易且不使用传统止损的交易者设计。 主要功能 无止损策略 - 使用智能DCA级别代替硬止损 Ichimoku云图分析 - 专业趋势检测和过滤 智能DCA系统 - 使用乘数进行渐进式仓位平均 双向交易 - 管理买入和卖出DCA序列 智能状态管理 - 基于趋势变化暂停和恢复 可视化盈利跟踪 - 图表上的标签监控表现 Ichimoku设置 Tenkan-sen周期 (默认: 9) - 用于短期趋势检测的转换线 Kijun-sen周期 (默认: 26) - 用于中期趋势分析的基准线 Senkou Span B周期 (默认: 52) - 控制云图形成宽度 启用详细日志 (默认: 是) - 交易决策的全面日志 DCA设置 初始手数 (默认: 0.01) - 第一笔交易的起始仓位大小 DCA手数乘数 (默认: 1.5) - 在每个DCA级别乘以手数 最大DCA级
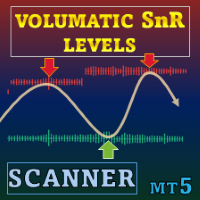
特别优惠 : ALL TOOLS ,仅 $35 一个! 新工具 将以 $30 在 第一周 或 前 3 笔购买 销售! Trading Tools Channel on MQL5 : 加入我的 MQL5 频道获取最新动态 Volumatic Support/Resistance Levels Scanner 是一款支撑/阻力指标,为价格结构加入成交量背景。通过显示交易活动在近期转折点附近的聚集情况,它帮助用户了解买入或卖出兴趣最活跃的位置。 查看 MT4 版本: Volumatic Support Resistance Levels MT4 Scanner 查看更多产品: All P roducts 1 · 概览 该指标从最近的高点和低点绘制价格区间,并为每个区间叠加成交量直方图。直方图厚度会随当前市场活动而扩展或收缩,使用户能够衡量市场对特定价格水平的关注度。 2 · 关键概念 价格区间 — 在最近价格转折点绘制的水平带。 成交量直方图 — 根据区间附近成交量百分位变化宽度的填充带。 高成交量标记 — 当区间成交量超过用户设定阈值时出现的圆圈。 Bars

BTC Reflexion ATR H2 Master is a fully automated trading system designed exclusively for BTCUSD on the H2 timeframe. It combines a directional model powered by ReflexPeriod, OSMA, and Bollinger Bands, with a dynamic risk-management algorithm based on ATR, allowing efficient operation under high-volatility market conditions. The EA is optimized for IC Markets but remains fully adaptable to any broker with reasonable spreads.
Main Features 1. Entry logic based on ReflexPeriod + OSMA + Bollinger B
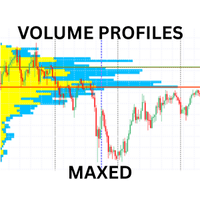
Advanced Volume Profile Indicator for MT5
Transform your trading with professional-grade volume analysis. This comprehensive volume profile indicator delivers institutional-quality market insights with multiple profile types, advanced alert system, and customizable display options.**
Key Features
**Multiple Profile Types** - **Visible Range Profile** : Analyzes volume within the current chart window - **Fixed Range Profile** : Custom date range analysis with visual markers - **Sessio

多货币和多时间框架指标 MACD。 仪表板可以显示传统(真实)MACD 和 MetaTrader 中内置的 MACD。
在面板上,您可以看到指标的当前状态 - MACD 线的移动方向、它们的交点以及带有指标图表的弹出窗口。 在参数中,您可以指定任何所需的交易品种和时间范围。 扫描仪还可以发送有关线相互交叉以及线穿过零电平的通知。 通过单击单元格,将打开给定的符号和句点。
您还可以看到价格和 MACD 线之间的差异(常规和隐藏),以及价格和直方图之间的差异。 因此,您可以轻松扫描所有时间范围的所有货币对和交易品种,以找到 MACD 主线和信号线或零水平的交叉点。
显示/隐藏仪表板的热键默认为“D”。 默认情况下,启用/禁用弹出图表的热键为“C”。 用于切换图表“1”和“2”上的箭头的热键. MACD(移动平均收敛/发散)指标(或“振荡指标”)是根据历史价格数据(最常见的是收盘价)计算得出的三个时间序列的集合。 这三个系列是:MACD 系列本身、“信号”或“平均”系列以及“背离”系列(两者之间的区别)。 MACD 系列是价格系列的“快速”(短期)指数移动平均线 (EMA) 和“慢速

Another request from my brotherhood was putting the name of the Symbol being seen - a little bigger - on the Chart, just to get sure that they are seeing the correct one... Mistakes pay a high price on the market... It is a very effective, and almost resource-null-consuming indicator that displays the current Symbol Name and Timeframe in almost any position of your Chart, with any color, and any Font Size... And also you can change the divisor character that is presented between the Symbol Name
FREE
Introducing the BB Trader EA, an advanced trading tool harnessing insights from the Bollinger Band indicator. This expert advisor strategically makes use of the upper and lower bollinger bands. Key Features: Flexible trade options: Set the maximum number of trades for single or multiple entries. Optional ATR-adjusted system: Manage multiple trades while dynamically making adjustments for volatility. Versatile grid lot sizing: Choose between static or automatically increasing (non-martingale) op
FREE
This indicator provides a clear, at-a-glance dashboard for monitoring both the Relative Strength Index (RSI) and Stochastic Oscillator on any instrument or timeframe.
Whenever both RSI and Stochastic %K simultaneously exceed their respective overbought or oversold levels, the indicator displays an arrow signal in the indicator window.
These signals highlight strong momentum and can help traders quickly identify high-probability reversal zones. As with all my free tools, the arrow symbol can be e
FREE

Professional-Grade Chart Analysis – AI-Powered & Visually Enhanced The AInalyzer is an Expert Advisor for MetaTrader 5 that leverages artificial intelligence to analyze market structures and automatically places visual objects directly on your charts. Instead of spending hours manually examining charts, you'll get a clear overview of support levels, resistance zones, trend structures, and potential trading opportunities in no time – all logically presented, visually marked, and available at you

This indicator displays buy or sell signals according to Bill Williams' definition of the Trading Zone. [ Installation Guide | Update Guide | Troubleshooting | FAQ | All Products ] Easy to use and understand Avoid trading flat markets Deterministic indicator with clear rules The indicator is non-repainting It implements alerts of all kinds It has straightforward trading implications. A blue arrow is a buy signal A red arrow is a sell signal According to Bill Williams trading in the zone helps t
FREE

Accurate Buy Sell System is a clean and reliable swing-based indicator designed to identify trend reversals and entry zones with high precision. The algorithm follows the original “Accurate Swing Trading System” concept from TradingView (by ceyhun) and has been fully re-engineered for MetaTrader 5. 1:1 match with TradingView behavior
Works on all symbols and timeframes
Clean non-repainting signals when used after candle close
Visual BUY/SELL arrows + colored dynamic trendline
Popup al
FREE

KDJ Indicator for MT5 The KDJ Indicator for MT5 is a professional-grade momentum and trend analysis tool designed to help traders identify trend reversals , overbought/oversold conditions , and entry or exit opportunities with high accuracy. Originally developed as an enhancement of the Stochastic Oscillator , the KDJ adds a powerful J-line that reacts faster to price movement, giving traders earlier warnings of potential reversals. Key Features Three-Line System (K, D, J):
The K and D lines r
FREE
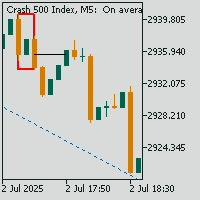
Crash Spike Mitigation Zone Pro
A professional spike pattern indicator built for synthetic traders who scalp and swing Crash 500/300/1000 with precision.
This indicator: Detects powerful 3-candle spike formations (Spike → Pullback → Spike) Automatically draws a clean box around the pattern Marks the entry price from the middle candle Extends a horizontal mitigation line to guide perfect sniper entries Automatically deletes & redraws the line once price touches it (mitigation)
FREE

DawnDuskDynamics EA DawnDuskDynamics is a sophisticated trading algorithm that leverages the well-known Morning Star and Evening Star candlestick patterns to identify potential market reversals. This Expert Advisor is designed for traders looking to automate their trading strategies on major currency pairs, ensuring a systematic approach to forex trading. Key Features: Trading Strategy : Utilizes the Morning Star and Evening Star patterns to determine entry points, enhancing the probability of
FREE

LHN Bitcoin Mining: Client Overview LHN Bitcoin Mining is a specialized MQL5 Expert Advisor (EA) engineered for high-precision Bitcoin scalping on the 5-Minute (M5) timeframe. Unlike "noisy" bots that trade every small movement, LHN is a Level Breaker —it hunts for specific structural breakouts in Support and Resistance. ️ Proper Risk Management The bot is built with a "Safety-First" architecture to protect your capital: Hard Stop Loss & Take Profit: Every trade is protected immediately upo
FREE

The Donchian Channel Channels are among the most popular tools of technical analysis, as they visually convey to the analyst the limits within which most price movement tends to occur. Channel users know that valuable information can be obtained at any time, whether prices are in the central region of a band or close to one of the border lines.
One of the best known techniques to explore these concepts is Bollinger Bands. However, John Bollinger was not the only one to research the application
FREE
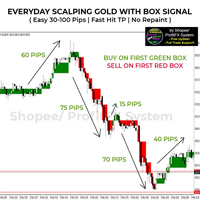
Always getting MARGIN CALLS again and again? Still haven’t found an indicator or technique that DELIVERS CONSISTENT DAILY PROFIT ? Tired of depositing funds and desperately wishing you could FINALLY WITHDRAWING ?
Don’t worry. I’m a REAL FULL TIME TRADER and I’ll share with you the very indicator I'VE BEEN USING MYSELF to successfully become a full-time trader.
STOP WASTING time with indicators that aren’t created by real traders and have no proven track record!
Start today with th
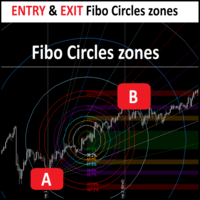
FiboCircles Zones — The Ultimate Price-Time Fibonacci Suite for MT5 Professional Geometry | Context-Aware Momentum | Cross-Timeframe Precision Elevate Your Analysis to Institutional Standards FiboCircles Zones is more than just a drawing tool; it is a high-precision Professional Analytical Framework for MetaTrader 5. It bridges the gap between classic technical analysis and advanced market geometry, allowing traders to identify "Price-Time Confluence" —those rare moments where geomet

Candle Close Timer Matrix – MT5 Candle Countdown Indicator Candle Close Timer Matrix is a lightweight and powerful MetaTrader 5 (MT5) candle countdown indicator that shows exactly how many minutes and seconds are left before the current candle closes on any symbol and any timeframe. Live Signals & Products Whether you are a scalper , intraday trader or swing trader , knowing the exact candle close time helps you: Time your entries on candle close Avoid impulsive mid-candle decisions Sync your tr
FREE

Ice Scalper Pro 是一款全自动剥头皮机器人,它采用高效的突破策略、先进的资金管理、概率分析和先进技术,能够及早发现趋势变化。 前一百(100)名购买者的当前价格为 55 美元,最终价格为 9999 美元。 MT4 版本 : https://www.mql5.com/en/market/product/94060
该策略通过挂单执行,一旦价格越过指定水平,挂单就会自动触发。对于买入订单,挂单设置在前一个高点的水平;对于卖出订单,挂单设置在前一个低点的水平。 不过,应该注意的是,该策略通过每次交易积累小额收益来执行。因此,选择一家提供低点差、低佣金和快速订单执行的经纪商非常重要。 不使用马丁格尔或网格交易策略或其他危险方法,这些方法最终会使您的账户爆仓。 截图中的回溯测试是使用我的个人设置进行的,但请记住,可能还有更好的设置。请下载免费演示版进行测试。过去的测试和实时表现都不能保证未来的结果。风险设置不应基于回溯测试。较低的风险意味着较低的可能回报。 参数:
1. 主要参数 时间框架:用于识别高点和低点的时间段; Start_Bars:开始寻找前高和前低的蜡烛图数量

This Quarter Levels Indicator for MQL5 is a sophisticated technical analysis tool designed to capitalize on "Psychological Levels" or "Round Numbers" in financial markets. It operates on the principle that institutional order flow, stop-losses, and take-profit targets tend to cluster at specific mathematical intervals—specifically the whole numbers ( 00 ), midpoints ( 50 ), and quarter points ( 25 and 75 ). By dividing price action into these four distinct quadrants, the indicator provides a cle
FREE

EA 交易在完成 MA 的冲动性反弹后的长期价格回报至平均水平。如有必要,可以使用平均。有一个高级面板和所有类型的通知。 问题解决 -> HERE / MT4版 -> HERE 好处: 篮子订单的高级过滤
全自动交易系统,能够添加手动订单
简单的设置和直观的面板界面
强大的交易潜力和简单的设置
内置自动槽
输入设置: . Main settings Size_of_the_first_order - 开第一个订单的交易量。如果启用 Autolot 计算被禁用,则使用。 Enable_Autolot_calculation - 启用自动抽签。如果您使用 autolot,则不能使用第一个订单的大小。用于第一个订单。 Autolot_deposit_per_0.01 手 - 使用自动手时每 0.01 手的存款金额 Orders_Magic_number - 顾问订单的主要标识符。主要用于识别顾问订单 Comments_of_the_EA's_orders - 对顾问开立的订单的评论 Allow_to_open_OP_BUY_orders - 一个变量,允许您选择是启用还是禁用
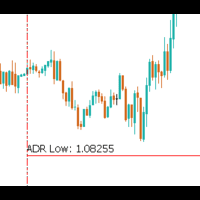
The Average Daily Range (ADR) is a powerful tool for traders, especially those focused on intraday and scalping strategies. It provides valuable insights into the expected price movement for the day and how price action is behaving relative to historical trends. The ADR indicator shows the following key information: Today's ADR : The typical range of price movement for the current trading day, based on historical data. 3x Today's ADR : Three times the current ADR, showing potential price moveme
FREE

Gold AI Machine – Advanced Automated Trading System Gold AI Machine is a professional, fully automated trading robot developed exclusively for XAUUSD (Gold) .
The system is optimized for the M5 timeframe and is designed to capture high-quality short-term market opportunities using advanced artificial intelligence–driven logic and disciplined trade management. Key Features Optimized exclusively for XAUUSD (Gold) Recommended timeframe: M5 Recommended minimum capital: 200 units For 3-digit Gold
FREE

指标简介: 该指标来自网络,相对RSI或CCI更加稳定; 该指标绘制趋势线和高低价格区域,它可以用来分析市场趋势并根据趋势设计新的交易系统; 该趋势指标适用于 M1 及以上时间范围; 指标的简单实用方法:如果指标下跌出现橙黄色区域,则可以选择开多或平仓空头,若指标上涨到蓝色区域,则可以选择开空或平仓多头,当出现上或下箭头信号时候可以开启消息提醒功能,前两个参数框“UpMessages/DownMessages”用于修改邮件消息提醒文字; 需要特别说明的是:任何指标都不是万能的,指标是否有用取决于对指标的使用,而不是试图寻找到一个完美无暇的指标,然后凭借这种指标一劳永逸,那是不可能的。 我的其他指标和 EA 可以在这里找到 : https://www.mql5.com/zh/users/hzx/seller
FREE
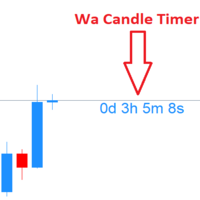
Wa Candle Timer MT5 是一个功能强大且用户友好的指标,旨在在您的 MT5 图表上显示当前蜡烛结束前的剩余时间。此工具帮助交易者时刻关注蜡烛的关闭时间,从而更好地执行交易并做出决策。现在,您还可以根据设定的百分比设置提醒,使时间控制更精确。
主要功能: 显示当前蜡烛的倒计时。 当剩余时间低于用户定义的百分比时变色。 蜡烛到达指定百分比时触发提醒。 支持字体和颜色的完全自定义。 提高交易中的时间管理和精确度。
可自定义设置: 1️⃣ 高于阈值的计时颜色 2️⃣ 低于阈值的计时颜色 3️⃣ 字体大小 4️⃣ 字体样式 5️⃣ 提醒触发百分比设置(例如:95%、80% 等)
这是所有依赖精准时间控制的交易者的理想工具。使用 Wa Candle Timer MT5,掌握市场节奏,先人一步做出交易决策。
FREE

Live trade TEST ICT EA VS ICT manual: https://www.youtube.com/live/uKa9YD40Kn4
Introducing: Gold ICT EA 1.0 – Precision-Engineered for XAUUSD Scalping Built with purpose. Tuned for gold. Trusted by precision. Gold ICT EA 1.0 is an advanced automated trading system specially crafted for XAUUSD . Designed to operate on the M5 chart, it’s a no-nonsense solution for gold traders who value capital protection and consistent growth.
No unnecessary complications – just stability, discipline, and prec
FREE

Introduction
The PF Maximizer is a game-changing non-repainting technical tool engineered to help traders distinguish genuine trend signals from erratic market fluctuations. By employing sophisticated algorithms and cutting-edge data analysis, this indicator efficiently filters out unwanted noise, empowering traders to identify the precise starting and ending points of substantial market moves.
Signal
Potential buy signal is generated when moving average is going up and the blue line cross a
FREE
Название советника : Survivor (есть расширенная версия: https://www.mql5.com/ru/market/product/36530 ) Валютные пары : USDJPY, EURUSD, GBPUSD, AUDUSD, GBPJPY, XAUUSD, EURCHF Рекомендованная валютная пара : USDJPY Таймфрейм : М5 Время торговли : круглосуточно Описание : Трендовый советник с возможностью мартингейла и построением сетки ордеров. В советнике используются три группы аналогичных сигналов для открытия, закрытия и дополнительных сделок. При наличии тренда(определяется МА) ловится отс
FREE

WaveTrendPro Arrow – Adaptive Cross Signal with Smart Alerts Description WaveTrendPro Arrow is a clean and powerful visual indicator designed to detect trend-reversal points using the classic WaveTrend oscillator (WT1/WT2 cross) , enhanced with intelligent on-chart arrows , real-time alerts , and mobile push notifications . Unlike traditional WaveTrend indicators that display signals in a subwindow, this version shows precise entry arrows directly on the main chart , positioned adaptively
FREE

With Break Even Trader placed onto your chart, it will automatically place the stop loss and take profit levels when you open a buy or sell order. And when you are in profit by the amount defined in user settings, it will automatically move your stop loss to that break even level, thereby protecting your trade from a loss. Features :
Simple to trade with you just enter your trade it will place the stop loss and take profit as input in user inputs. Sends you an alert when your trade is in profit
FREE

Supply and Demand indicator does not repaint as it counts the number of tests/retests occurred in the past x number of times. As a trader you need a path to be able to place your buy and sell trades such as: Supply and Demand, Falling & raising channels . Experienced trades will draw the key levels and channels around the timeframes. But, they will not be able to draw them on the small time frames as the price changes too frequent. This indicator is based on Shved supply and demand indicator, b
FREE

This indicator shows colored candles when price are strongly distorted in relation to their averages.
A good time for buy can be seen after the closing of a silver candle. The pattern becomes more reliable if the purchase is opened when the price of the candle after the silver candle is above the maximum price of the silver candle.
A good time for sell can be seen after the closing of a pink candle. The pattern becomes more reliable if the sale is opened when the price of the candle after
FREE
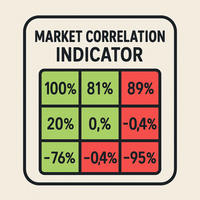
总体描述
该指标实时计算多个金融工具之间的皮尔逊相关系数。它显示一个动态相关性矩阵,用于展示货币、指数、股票和大宗商品之间关系的强度和方向。 主要参数 SymbolsList : 需要比较的工具列表(用逗号分隔) BarsToAnalyze : 用于计算的历史K线数量 TimeFrame : 相关性分析的时间周期 相关性解释 接近 +1.00 的值表示强正相关 接近 -1.00 的值表示强负相关 接近 0.00 的值表示弱相关或无相关 交易优势 监控持仓之间的相关性以降低过度暴露风险 识别投资组合中的多样化机会 支持对冲和套利策略 通过跨市场分析验证交易信号 重要提示
该指标适用于交易终端中的所有金融工具,支持日内、日线及更高级别的时间周期。内置的颜色编码系统可帮助快速识别强相关、弱相关和负相关。 关键词
mt5相关性指标, 外汇相关性, 相关性矩阵, 跨市场分析, 货币对相关性, 市场相关性, 多资产交易, 风险管理, 投资组合多样化, 外汇对冲, 套利交易, 指数相关性, 股票相关性, 大宗商品相关性, 负相关性, 正相关性, 皮尔逊系数, 金融工具相关性, 交易相关性分析
FREE

Why Secutor and If It Can Be Used With Prop Trading Challenges? The SECUTOR EA is a sophisticated quantile-based trading system that uses statistical percentile analysis combine d with volatility filtering through the Ulcer Index. The strategy identifies market extremes by comparing current price levels to historical quantile distributions and enters positions when specific percentile thresholds are breached One of the dirty truths of financial markets is that reliable scalping and high f
FREE

Real Quants Forex Volatility Catcher for MT5 Introduction Real Quants Forex Volatility Catcher is a cutting-edge automated trading system designed specifically for MetaTrader 5. Developed through advanced machine learning and exhaustive data mining techniques, this system offers traders a robust strategy for navigating the complex terrains of the forex markets. With a commitment to rigorous testing that includes Monte Carlo simulations, walk-forward matrix optimization, and live execution valida
FREE

Weis Waves(魏斯波浪) 是由大卫·魏斯 (David Weis) 开发的技术指标,灵感来源于理查德·威科夫 (Richard Wyckoff) 的原理。
与传统逐根显示的成交量不同,Weis Waves 将成交量累积为连续的上涨或下跌“波浪”,当价格方向反转时重新开始计算。 这种方法使交易者能够清晰地看到市场运动的 真实力度 ,因为每一波浪都反映了支撑一系列K线的成交量强度。 主要特点: 将成交量分组为买入波浪和卖出波浪。 突出显示市场的主导力量(买方或卖方)。 有助于识别 趋势延续 或 潜在反转 。 基于威科夫方法论,被广泛应用于成交量与资金流分析。 Weis Waves 被众多专业交易者使用,用于分析价格与成交量之间的平衡,提供更深入的市场动态视角。
FREE

Start earning profits by copying All trades are sent by our successful Forex trader & are extremely profitable. You can earn profits by copying trades daily Trial Period included You'll also get access to extremely powerful trading education which is designed in a simple way for you to become a profitable trader, even if you have no trading experience. https://ec137gsj1wp5tp7dbjkdkxfr4x.hop.clickbank.net/?cbpage=vip
FREE
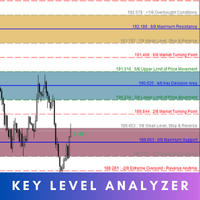
Key Level Analyzer – Know Better, Trade Smarter Key Level Analyzer is a powerful trading tool designed to provide precise market insights by identifying high-probability price zones , market turning points , and key decision areas . Unlike traditional indicators, it uses a smart algorithm to dynamically calculate support, resistance, and balance zones, helping traders make informed, data-driven decisions . MT4 Version - https://www.mql5.com/en/market/product/132809/ With real-ti

Daily session open lines shows the traders three important trading session opens. By default it is set up to show you: Zero GMT Open Line London Open Session Line New York Open Session Line The default times are set according to GMT+2 and as such you are able to change and customise according to your specific time zone. The Indicator is usefull specially for the trader who trades the London and NewYork sessions.
FREE

Majestic — Premium Trend-Swing EA for XAUUSD
Majestic is a directional swing-trading algorithm designed exclusively for trading GOLD , identifying high-probability trend moves based on a dynamic combination of Risk/Reward ratios, ADR-based volatility filters, and a custom scoring system to confirm trade setups. The EA features both fixed and adaptive stop levels based on real-time market volatility conditions and it can operate with or without stops, allowing for strategic exits either on oppo

EMA Crossover Expert Advisor The EMA Crossover Expert Advisor (EA) is a fully automated trading system designed for MetaTrader 5.
It uses a fast/slow EMA crossover strategy combined with configurable risk management tools to identify potential trading opportunities. This EA is ideal for traders who prefer systematic execution without manual intervention, with built-in parameters to fine-tune performance according to different market conditions. Key Features: EMA Crossover Logic – Detects bulli

中文说明(MT5) 暗影轨道专业版 – MT5 高级均值回归系统 本 MT5 版本针对 MT5 的 64 位多线程架构 做了优化,计算更流畅、回测更方便、可选周期更丰富。
依旧保持「收盘不重绘」的特点,并在此基础上加入实体突破逻辑、动态轨道算法和更严格的统计评估模式。 核心功能 针对 MT5 优化:计算更快、适合多品种、多周期同时运行 收盘不重绘:信号在 K 线收盘后锁定,便于回测与策略复盘 动态三层轨道:基于均线 + ATR 波动率构建上轨 / 中轨 / 下轨 买卖箭头 + 冷却机制:避免短时间内密集信号干扰判断 自动绘制 TP/SL 盈亏线:TP1–TP3、SL1–SL3,多层级风险收益结构一目了然 严格模式统计面板:统计胜率、盈利信号数、亏损信号数,用「数据」说话 图表皮肤选项:一键切换红涨绿跌样式,提升整体可读性 全参数可调:轨道周期、宽度系数、ATR 周期、价格类型、均线算法、TP/SL 启用开关等 完整中英双语界面,方便不同语言交易者使用 使用思路 将指标加载到 MT5,选择语言(English / 中文),设定轨道周期、ATR 周期及 TP/SL 倍数。 在趋势尾部或极端
FREE

Infinity Predictor MA
Infinity Predictor MA is a next‑generation forecasting indicator that transforms the traditional Moving Average into a powerful predictive tool. Unlike standard MAs that only smooth past data, this indicator projects the moving average line up to 40 bars into the future, giving traders a unique perspective on potential market direction.
The engine behind Infinity Predictor MA combines multiple advanced regression models to capture both smooth trends and sudden market shi
FREE

I think you all know Donchian Channels. so I am not going to write about it.
With this indicator I tried to create Donchian Trend Ribbon by using Donchian Channels.
How it works ?
- it calculates main trend direction by using the length that is user-defined. so you can change it as you wish
- then it calculates trend direction for each 9 lower lengths. if you set the length = 20 then the lengths are 19, 18,...11
- and it checks if the trend directions that came from lower lengths is same
FREE

发现BollingerBandsEA:简化您的外汇交易体验 BollingerBandsEA是一款专家顾问,利用著名的布林带策略,将技术分析与自动执行相结合。该产品为所有经验水平的交易者设计,提供了一个实用的方法来优化您的金融市场交易活动。 为什么选择BollingerBandsEA? 基于策略的方法: 使用布林带逻辑,通过可靠的技术标准识别交易机会。 智能自动化: 支持自动买卖操作,减少持续监控的需求。 风险管理: 包含可调选项,用于止损和获利保护您的资金。 易于使用: 提供用户友好的界面,适合各种经验水平的交易者。 要求和兼容性 作为已编译文件( EX4/EX5 )提供,适用于MetaTrader 4/5平台。 不使用外部库(DLL),确保最高安全标准。 探索BollingerBandsEA的潜力,使您的交易过程更加高效和有条理。
FREE

风险控制顾问
“风险控制”是一款MetaTrader 5平台的高级仓位管理工具,它基于设定的风险参数和盈亏比 (RR) 自动执行部分仓位平仓。该EA帮助交易者有效管理持仓,最大限度地降低风险并最大化潜在利润。 其他产品 -> 这里 主要特点: - 基于指定参数的自动部分仓位平仓; - 风险水平和盈亏比 (RR) 的灵活调整; - 直观的用户界面,方便参数 настройка; - 一键隐藏/显示EA面板的能力; - 在图表上可视化显示部分平仓水平; - 可视化显示点差水平及其在进场时的考虑。 更详细的说明:
https://maks-haven.notion.site/Trade-Manager-for-Metatrader-5-c43cd84a0a174f23ac3829110b255110
程序操作热键: "1" - 设置虚拟入场位 (开仓价)。线条放置在按下按键时鼠标光标所在的位置。 "2" - 设置虚拟止损水平 "3" - 设置虚拟止盈水平 "Space" (空格键) - 根据预设的虚拟线向服务器发送交易订单 "Esc" - 取消操作并从图表上删除所有虚拟线 "5"
FREE

Because worrying about optimization settings or particularities of the order to operate, let the system pilot for you.
This system makes all the adjustments automatically, analyzing the pair and the market to decide which is the most efficient step to reach your destination.
You just sit in the passenger seat and watch the scenery while the robot takes you to your destination.
Autopilot is a multiple trade and multiple lot system, adjusting these parameters within the algorithm to get you t

- Displays horizontal lines for Previous Day High (PDH) and Previous Day Low (PDL) on the chart. - Customizable line colors via input parameters. - Sends sound alerts, pop-up notifications, and mobile push notifications upon the initial crossover of PDH or PDL. - Alerts are triggered only once per crossover event; they re-trigger only if the price moves away and re-crosses after a specified minimum interval. - Automatically updates the PDH/PDL levels at the start of each new day. - All indicator
FREE

Description This technical indicator is designed to automate the analysis of market structure based on price action concepts. It identifies and labels key structural points, including Higher Highs (HH), Lower Lows (LL), Lower Highs (LH), and Higher Lows (HL), to assist traders in visualizing market trends. The indicator uses a configurable "Swing Strength" logic, checking a user-defined number of bars to the left and right of a pivot to confirm its validity. It also identifies Break of Structure
FREE

Daily Weekly Monthly High Low - Your Ultimate Tool for Precision Market Analysis
The 200 free download promotion has ended. The price has now been updated. Thank you, everyone!
Love it? Hate it? Let me know in a review! Feature requests and ideas for new tools are highly appreciated. :)
Try "The AUDCAD Trader":
https://www.mql5.com/en/market/product/151841 Overview:
Elevate your trading strategy with Daily Weekly Monthly High Low , a sophisticated MQL5 indicator designed to pinpoint c

Genaral: Not martingale, not a grid; Use on EURUSD Use on M5
Signals: There is a good rational algorithm. Work of two indicators: Chaikin and DeMarker (from 2 timeframes) (you can set a separate Timeframe for each indicator)
Stop Loss/Take Profit: There is a good money management system (there are several type for trailing stop loss); There is virtual levels of Stop Loss / Take Profit; There is smart lot (percent by risk) or fix lot
Important: EA can work on closed candles, and on curr
FREE

BEHOLD!!!
One of the best Breakout Indicator of all time is here. Multi Breakout Pattern looks at the preceding candles and timeframes to help you recognize the breakouts in real time.
The In-built function of supply and demand can help you evaluate your take profits and Stop losses
SEE THE SCREENSHOTS TO WITNESS SOME OF THE BEST BREAKOUTS
INPUTS
MaxBarsback: The max bars to look back
Slow length 1: Period lookback
Slow length 2: Period lookback
Slow length 3: Period lookback
Slow leng
FREE

| Seamless portfolio of trading systems in your palm - Powered by ONNX Neural network | Built by a grid trader >> for grid traders. This is MT5 version, click here for Blue GAIA MT4 (settings and logics are same in both versions) Real monitoring signal --> Cosmic 2 | GAIA Intro Blue GAIA EA (' GAIA ') - is the latest edition of BlueAlgos family, uniting all the best algos and features under one-roof. Its is the true 4xMulti Systems: +------------------------------------------------
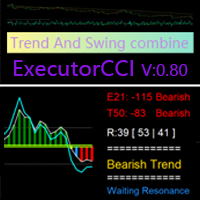
基于CCI的顺势原理,改良使其成为即可辨别趋势的反转,即在配合 ( Executor Trend Indicator ) 指标趋势行情识别后用来确认走势的指标。
特征 绿色 、红色立柱体部分为当前周期下的趋势头发展或空头发展. 蓝色线与绿柱同上为多头:蓝色线上达 100 绿柱上行过零轴,确认多头发展. 蓝色线与红柱同下为空头:蓝色线下达-100 红柱下行过零轴,确认空头发展. 右侧看板,给出的是当前走位数字提醒,同时给出了当前趋势是涨、是跌的提醒,以及给出了可入场的区域提醒。 使用 作趋势交易者建议在1H周期下使用 ; 作快进快出震荡交易者建议在1M、5M周期下使用 ; 配合使用 与 ( Executor Trend Indicator ) 指标联合使用,确认趋势反转走势, ( Executor Trend Indicator ) 多头走势时确认 ExecutorCCI 的绿柱是否 上行过零轴。空头反之。
这一改进后的基于CCI的指标能够清晰地展示趋势发展和反转,使其成为趋势跟踪和反转交易策略中的宝贵工具。
FREE

VR 网格指示器 设计 用于创建具有用户定义设置的图形网格。与 标准网格 不同,VR 网格用于构建 圆形关卡 。根据用户的选择,轮次级别之间的步长可以是任意的。此外,与其他指标和实用程序不同,即使时间段发生变化或终端重新启动,VR Grid 也能保持网格的位置 。 设置、设置文件、演示版本、说明、问题解决,可以从以下位置获取 [博客]
您可以在以下位置阅读或撰写评论 [关联]
版本为 [MetaTrader 4] 垂直级别 基于实际时间间隔并 忽略缺失 或不存在的周期。因此,级别之间的步长严格对应于用户选择的值。 使用 VR 网格指标时,交易者 可以更改任何级别的垂直线和水平线的样式 、颜色和粗细。这使您可以控制金融工具的 回合水平 。 整数位是 以两个或多个零结尾 的价格(例如:1.23500、5.65900、1923.200)。人们相信,这样的水平 经常充当 作为支撑或阻力的强点。 Horizontal line settings Horizontal line step Horizontal line color Horizontal line style Horizonta
FREE

Scalping Trade Panel – Fast and Precise Trading Control for MT5
Scalping Trade Panel is a professional trading panel designed for MetaTrader 5, offering traders lightning-fast access to market and pending orders directly from the chart. Optimized for scalping strategies, it combines precision, speed, and simplicity in one compact interface.
Key Features:
Market Orders: Execute BUY and SELL orders instantly with a single click.
Stop Losses : You can add a stop loss for any market or pending
FREE

AstroCycles: Advanced Financial Astronomy Indicator Overview AstroCycles is a sophisticated technical analysis tool developed for the MetaTrader 5 (MQL5) platform. It bridges the gap between orbital mechanics and financial market analysis by calculating precise astronomical cycles and visualizing them directly on your trading chart. Unlike standard indicators that rely on past price data, AstroMaster utilizes high-precision astronomical algorithms (Keplerian Elements and Brown’s Lunar Theory)
FREE
The Ultimate Signal Builder Basic combines the features of other 3 expert advisors, providing all their trading signals in one single place: 1. the Price Action Builder Basic ; 2. the Bollinger Bands Builder Basic ; 3. the Chart Patterns Builder Basic .
The Ultimate Signal Builder Basic expert advisor shares the same characteristics as the 3 underlying experts: usage of stop loss orders, maximum 1 managed open trade, automatic trade closure and configurable validation mechanism. While being ess
FREE

DaySpread MinMax — 带日内最小/最大值的点差指标
显示内容: 当前点差(Cur) 当日最小点差(Min.day) 当日最大点差(Max.day) 工作原理: 指标每 1 秒读取当前品种的 Bid/Ask 报价。 当前点差计算公式:(Ask − Bid)/ Point(以点为单位)。 Min.day/Max.day 在当天持续更新;当进入新的交易日(按 D1)时自动重置。 以图表上的文字面板形式显示信息。 面板可用鼠标拖动;位置按图表保存,并可在切换周期后恢复。 优势: 快速查看当前交易成本以及当日点差范围。 便于监控新闻时段或低流动性时点差扩大。 轻量不打扰:不绘制线条/缓冲区,仅显示信息面板。 适用于任何品种与周期。 输入参数: Screen corner — 面板锚定的屏幕角。 Offset X (px) — X 方向像素偏移。 Offset Y (px) — Y 方向像素偏移。 Font size — 字体大小。 Text color — 文字颜色。 Background color — 面板背景颜色。 Show background — 显示/隐藏背景。 Sh
FREE

Scalping Emas Mini Konsisten
Gold Scalping Mini Consistent adalah EA scalping intraday untuk XAUUSD (Emas) yang fokus pada keuntungan kecil tetapi sering dengan risiko rendah. Strategi Utama Gold Scalping Mini Consistent dirancang untuk XAUUSD (Emas) dengan target tetap sekitar 100 poin (10 pip) per perdagangan. Strategi ini fokus pada entri short, keluar cepat, dan meminimalkan paparan volatilitas tinggi.
Fitur Utama
Performa Konsisten – keuntungan kecil tapi sering
Manajemen Uang Aman

Turn Gold Volatility into Profits — 24/7.
AI-powered XAUUSD bot with multi-strategy engine, precision SL/TP, and 10+ years of trading experience behind it.
Grew a 10K USC account to 50K USC — now it’s your turn.
Minimum Investment: $300 or 10000 USC Timeframe: H1 Symbol: Only Gold / XAUUSD We have clubbed all strategies and fine tuned the target levels. We use AI to calculate target & stop levels. We convert all indicators pattern trading signals into profit making trades. It has to be connec

UV Gold:产品说明 使用 UV Gold 照亮黄金市场中隐藏的机遇——专为 XAUUSD H1 图表设计的顶级交易解决方案。您是否厌倦了那些对市场潜在暗流视而不见的标准EA? UV Gold 在不同的光谱上运作,使用先进的人工智能来检测传统指标无法察觉的盈利模式。 UV Gold 的核心是其先进的神经网络,并通过与 OpenAI 和 Google Gemini 的直接集成得到极大增强。这个强大的双核AI引擎如同图表上的紫外光,揭示真实的市场结构。它分析H1的价格行为,同时咨询大型语言模型以进行新闻和市场情绪的背景验证,从而以无与伦比的清晰度发现高概率的波段和日内交易。这不仅仅是自动化,这是 市场洞察之光 。 体验与您的 MetaTrader 4 或 MetaTrader 5 平台的无缝集成。UV Gold 智能交易系统可在几分钟内安装完成,让您在图表上部署卓越的分析视野。我们的技术使复杂的人工智能集成变得简单而强大,为您提供驾驭黄金市场细微差别所需的 机构级优势 。 选择 UV Gold,开始看到别人都错过的交易。 主要特点与 SEO 重点 专业的 XAUUSD H1 交易系统

ChannelRSI5 具有超买和超卖区域动态水平的相对强弱指数 (RSI) 指标。
动态水平随指标和价格的当前变化而变化和调整,代表一种通道。
指标设置 period_RSI - 计算 RSI 指数的平均周期。 Applied_RSI - 应用价格。它可以是任何价格常数:PRICE_CLOSE - 收盘价,PRICE_OPEN - 开盘价,PRICE_HIGH - 期间的最高价,PRICE_LOW - 期间的最低价,PRICE_MEDIAN - 中间价(高 + 低) / 2, PRICE_TYPICAL - 典型价格(最高价 + 最低价 + 收盘价)/ 3, PRICE_WEIGHTED - 加权平均价,(最高价 + 最低价 + 收盘价 + 收盘价)/ 4。
period_channel - 超买超卖区域动态通道的计算周期。
FREE

AI Forecasts MT5指标:
基于人工智能与深度学习(AI + ML)的未来预测系统
_ 主要特点: 基于动态数据分析,最多可预测未来20根K线 适用于剥头皮交易 多色预测图表反映置信度,当前买卖状态旁显示白色点计数器 概率区间显示预期价格路径及其概率变化范围与方向 主要基于Shock Pullback指标的多变量分析,包括: 回调区域、缺口开盘与收盘的计算研究 黄色箭头生成的斜率、加速、减速与反弹信号 曲折指标角度与突破/上升趋势区域计算 旗形与模式图谱等模型分析 累积区域与缺口的建模分析及其对未来走势影响 图表形态在预测计算中的整合 人工智能:
采用MQL5结构与环境设计的先进神经网络架构"注:学习与AI系统为内置式,不依赖Python等外部环境" _ 5层深度神经网络:
• 第一层:32个神经元(24个特征输入)
• 第二层:16个神经元
• 第三层:8个神经元
• 第四层:4个神经元
• 第五层:2个神经元(预测值与置信度输出) 智能注意力机制:
动态聚焦关键特征 基于集成计算与模型表现的权重自动更新系统 _ 分析特征(24项进阶特征): 订单流与多

Elastic Grid MT5 is a multifunctional grid Expert Advisor designed to fully or partially automate various ideas related to grid trading (on a hedging account) . The Expert Advisor can trade on any timeframe, on any currency pair, on several currency pairs, on any number of signs. It does not interfere with manual trading, trading of other Expert Advisors, or the operation of any indicators.
It allows you to adjust your settings on the fly, works only with your own positions and orders, and for
MetaTrader市场是一个简单方便的网站,在这里开发者可以出售自己的交易应用程序。
我们将帮助您发布您的产品,并向您解释如何为市场准备您的产品描述。市场上所有的应用程序都是加密保护并且只能在买家的电脑上运行。非法拷贝是不可能的。
您错过了交易机会:
- 免费交易应用程序
- 8,000+信号可供复制
- 探索金融市场的经济新闻
注册
登录