Conheça o Mercado MQL5 no YouTube, assista aos vídeos tutoriais
Como comprar um robô de negociação ou indicador?
Execute seu EA na
hospedagem virtual
hospedagem virtual
Teste indicadores/robôs de negociação antes de comprá-los
Quer ganhar dinheiro no Mercado?
Como apresentar um produto para o consumidor final?
Indicadores Técnicos para MetaTrader 5 - 29

Have you ever wondered which currency is the strongest at any particular time? Or which currency pair is trending the most. Well, the currency strength meter helps with just that. It compares USD , EUR , AUD , CHF , GBP , CAD and NZD depending on the timeline you have chosen in settings, and ranks them on the number of pips each has moved compared to the rest. N/B: All currency charts of the above pairs must have loaded. You can do this by highlighting all major and minor currencies in
FREE

Indicador que usa ATR e desvio padrão para calcular a tendência do momento. Possui a linha de cima e de baixo. A linha de cima é mostrada quando está em alta, e a linha de baixo quando está em baixa. O indicador não desenha trend line ou mostra a tendência do dia, ou de um determinado período. Ele tem a função de indicar a tendência do momento, podendo indicar uma reversão.
use-o com prudência e por sua conta e risco.
FREE

An indicator for visualizing time ranges of key trading sessions: Asian, European, and American. The indicator features functionality for setting the start and end times of each trading session, as well as an adjustable timezone of the trading server. The main advantages of the indicator include the ability to operate with minimal CPU load and memory usage. Moreover, it offers the option to specify the number of displayed historical days, providing the user with flexible market dynamics analysis
FREE
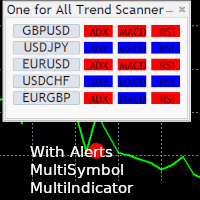
One for All Trend Scanner is a trend following multi-symbol indicator that can be used with any input: forex, stocks, commodities,... The panel shows three indicators and six symbols with the trend for every pair (symbol/indicator): up, down or no trend. The indicators are: Average Directional Movement Index (ADX) Moving Average Convergence Divergence (MACD) Relative Strength Index (RSI) You can choose which indicators will use for entry/exit and can adjust the parameters of each indicator sepa
FREE

HTF Vision - Higher Timeframe Candle Display Free now, celebrating release of Live Chart Viewer utility https://www.mql5.com/en/market/product/158488
HTF Vision provides traders with an intuitive way to visualize higher timeframe price action directly on their current chart. This powerful indicator overlays candlestick data from selected higher timeframes (H1, H4, or Daily) as customizable boxes, giving you instant context of larger market movements without switching charts. Key Features: Mult
FREE

Descubre el poderoso aliado que te guiará en el laberinto de los mercados financieros. Este indicador revolucionario te llevará de la incertidumbre a la claridad, permitiéndote identificar con precisión los puntos de inflexión del mercado. Mejora tus decisiones de entrada y salida, optimiza tus operaciones y ¡multiplica tus ganancias con confianza.
¡Para más información, te invitamos a unirte a nuestro canal de Telegram en https://t.me/Profit_Evolution ¡Allí encontrarás contenido exclusivo, an
FREE
MSX Hybrid Heiken Scalper v1.00 Elevate Your Scalping Precision with a Next-Generation Non-Repaint Heiken Ashi Indicator The MSX Hybrid Heiken Scalper is a scientifically designed, non-repainting Heiken Ashi indicator optimized for M5 to H1 scalping on MetaTrader 5. It introduces a robust closed-bar smoothing method that preserves trend clarity while filtering minor price noise — all without using traditional EMA/WMA/HMA smoothing that causes repainting. Reliable Closed Candle Logic
Each can
FREE

QuantumAlert Stoch Navigator is a free indicator available for MT4/MT5 platforms, its work is to provide "alerts" when the market is inside "overbought and oversold" regions in the form of "buy or sell" signals. This indicator comes with many customization options mentioned in the parameter section below, user can customise these parameters as needful. Join our MQL5 group , where we share important news and updates. You are also welcome to join our private channel as well, contact me for the p
FREE

BUY INDICATOR AND GET A PIVOT POINT EA FOR FREE AS A BONUS + SOME OTHER GIFTS! Attention, the MT5 version of this application does not work on strategy tester, only on live accounts or demo accounts on live market. If you need an MT5 demo version of the Indicator send me a private message here: https://www.mql5.com/en/users/italobr ITALO PIVOTS INDICATOR is the best pivot point indicator for strong price reversals and continuations of price movements ever created, and why is that? You

O Painel de Análise é um indicador que analisa as suas negociações passadas e presentes e prepara um painel analítico que pode visualizar com gráficos de pizza adicionais para uma visão detalhada.
São consideradas quatro categorias principais de análise: 1) Métricas de desempenho; 2) Métricas de comportamento negocial; 3) Métricas de qualidade de execução; e 4) Métricas de nível de posição.
As quatro métricas analíticas genéricas foram subdivididas em métricas mais específicas, conforme descr
FREE

Very simple, yet powerful, indicator that helps you get notified every time a candle touches your trend line, horizontal line, and/or your rectangular. Powerful indicator yet very simple to use! All you need to do is draw your MT5 trend lines, horizontal lines, and/or rectangles and SmartLine takes care of notifying you the moment the current price touches one of your key levels! No brainer If you like the indicator, please leave a review and share the tool with your peers. WARNING: Please use t
FREE

https://www.mql5.com/en/users/gedeegi/seller
The design features a bold orange countdown timer icon set against a dark gray background, with the clock hands pointing toward the upper right. Below the timer, a candlestick chart displays green and red bars that represent price movements across different time periods, with sharp detailing and balanced composition. The countdown time of "05:17" is prominently displayed next to the clock, adding a dynamic and informative element to the image.
FREE

[ Meu Canal ] , [ Meus Produtos ]
Visão Geral
O Classificador de Distância Lorentziana é um indicador de trading baseado em aprendizado de máquina que utiliza a distância de Lorentz como métrica principal dentro da estrutura de Vizinhos Mais Próximos Aproximados (ANN). Em vez de depender da distância euclidiana tradicional, ele trata a ação do preço financeiro como se ocorresse em um espaço preço-tempo “distorcido” (semelhante a como objetos massivos curvam o espaço-tempo na relatividade). Essa

StrikeZone ATR is a professional-grade ATR-based volatility indicator designed for precision intraday trading.
It visualizes volatility strength using a dynamic histogram and smoothed deviation line, helping traders instantly identify expansion, contraction, trend strength, and reversal zones. Key Features TradingView-style ATR histogram (Up/Down bars with multi-color levels) Smoothed deviation line for clearer volatility trend Instant detection of volatility spikes and quiet zones Color-coded b
FREE

Se você gosta deste projeto, deixe uma revisão de 5 estrelas. Como as instituições comercializam grandes volumes, não é incomum que eles
tentem tentar
defender sua posição em níveis específicos de porcentagem. Estes níveis servirão como um suporte natural e resistência que você pode usar
ou para entrar em um comércio ou estar ciente de possíveis perigos contra sua
posição. Este oscilador irá mostrar-lhe a variação percentual para o: Dia. Semana. Mês. Quarto. Ano. Em uma subjanela onde você ras
FREE

Detect divergence (classic, hidden) price and all oscillator indicator include: RSI, CCI, MACD, OSMA, Stochastic, Momentum, Awesome Oscillator (AO), Accelerator Oscillator (AC), Williams Percent Range (WPR), Relative Vigor Index (RVI), Rate of Change (ROC). Confirm reversal with dochian channel for to improve signal quality. Divergence is when the price of an asset is moving in the opposite direction of a technical indicator , such as an oscillator, or is moving contrary to other data. Diverge
If you like this product, please give it a 5 star rating as a token of appreciation.
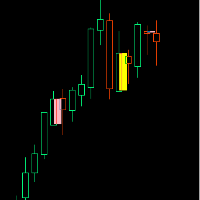
Inside Bar: A candle that is completely contained within the high-low range of the previous candle
Outside Bar: A candle that completely engulfs the high-low range of the previous candle (also called an "Engulfing Bar")
Inside Bars Consolidation Signals : Indicates market indecision/compression Breakout Setup : Often precedes significant price moves Continuation Patterns : Can signal pause in trend before con
FREE

Você já se sentiu perdido no meio de uma operação, sem saber exatamente qual é sua exposição ao risco? Já tomou decisões emocionais que custaram caro porque não tinha uma visão clara do seu plano de trading? A disciplina no gerenciamento de risco é o que separa os traders consistentes dos que ficam pelo caminho. No entanto, calcular e monitorar o risco em tempo real pode ser complexo e estressante. Apresentamos o Risk Matrix, o indicador de painel visual definitivo para o MetaTrader 5, projetado
FREE

English
VWAP Daily (Clean) is a simple and lightweight indicator that plots the classic Daily VWAP (Volume Weighted Average Price) directly on your MT5 chart. Features: Classic Daily VWAP calculation Supports real volume (if available) or tick volume Timezone offset option to match your broker’s server time Weekend merge option (merge Saturday/Sunday data into Friday) Clean version → no arrows, no alerts, only VWAP line VWAP is widely used by institutional traders to identify fair value, su
FREE

Análise de derrapagem projetada para negociação de alta precisão e todo o mercado Ele funciona em contas ativas e demo e permite que você analise todas as suas posições com take profit e stop loss, para que você possa analisar a derrapagem do seu corretor.
O que é Slippage no comércio? O slippage ou deslizamento é a diferença de preço que pode ocorrer entre o momento em que uma ordem de negociação é colocada e sua efetiva execução no mercado.
Isso porque, a partir do momento em que a ordem é
FREE
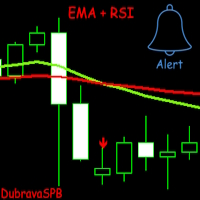
Introducing EMA + RSI – A Trading Indicator Combining Exponential Moving Average (EMA) and Relative Strength Index (RSI) Analysis. The indicator signals trade entries with arrows on the chart when two EMAs cross and the RSI meets the specified conditions.
It is initially optimized for the GBPUSD currency pair on the 1H timeframe, but users can customize it to fit their strategy. Key Features: Flexible settings: Users can adjust EMA length, choose the price for calculation, and configure RSI para
FREE
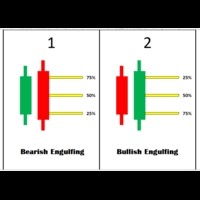
Engulfing Levels Indicator – Smart Entry Zones for High-Probability Trades Overview:
The Engulfing Levels Indicator is designed to help traders identify key price levels where potential reversals or trend continuations can occur. This powerful tool combines Engulfing Candle Patterns , Percentage-Based Levels (25%, 50%, 75%) , and Daily Bias Analysis to create high-probability trading zones . Key Features:
Engulfing Pattern Detection – Automatically identifies Bullish and Bearish Engulf
FREE

MTF Levels And Moving Averages is a professional indicator designed to identify key support and resistance levels across multiple timeframes. The tool helps traders locate precise entry and exit points by analyzing market structure and price action patterns. Key Features The indicator provides multi-timeframe analysis covering H1, H4, D1, and W1 periods simultaneously. It identifies supply and demand zones where price typically reacts, using color-coded visualization to distinguish between dif

Este indicador desenha o Canal Donchian, preenchendo o fundo com cores. A cor da linha do meio é alterada seguindo a tendência atual, com base na interpretação padrão do Canal Donchian.
Parâmetros de Entrada: Period of the Channel (padrão é 20) Validate Signals (valor booleano para filtrar falsos rompimentos, padrão é false) Background Settings Show Background ( padrão é true) U ptrend Color ( padrão é DodgerBlue ) Downtrend Color (padrão é Orchid) Background Transparency (padrão é 90%)
FREE

Este indicador é uma porta em linha reta de um conhecido indicador MetaTrader 4 que está disponível gratuitamente na Internet. Ele não redesenha. Ele implementa um tipo de estratégia de fuga. As setas indicam a direção do mercado. Use o indicador em gráficos M15 e superior.
FREE

EMA SMA Gold Scalper is a precision scalping indicator developed for XAUUSD (Gold) traders. It combines the dynamic responsiveness of the 55 EMA (High/Low) with the broader market direction filter of the 200 SMA , delivering clean and actionable Buy/Sell signals. The indicator also includes real-time "Live Blue Arrows" , which notify traders when an entry setup is forming—giving you a critical edge before the candle closes. This tool is optimized and recommend for M5 scalping a
FREE

This is a free version of the indicator, the period between the vertical lines is always 30 bars. In the paid version the period can be set by user, so a configuration with many ThreePointsChannel indicators with different periods is possible.
The principle of construction - on top of any number of bars set by the user, a channel is constructed with maximum and minimum lines so that the bars touch the maximum and minimum of the channel at exactly three points. The name of the indicator follows
FREE

Introduction
The RSI Plus is an innovative technical analysis tool designed to measure the strength and direction of the market trend. Unlike the traditional RSI indicator, the RSI Plus boasts a distinctive ability to adapt and respond to market volatility, while still minimizing the effects of minor, short-term market fluctuations.
Signal
Buy when the RSI plus has been in the oversold (red) zone some time and it crosses above the 20 level on previous candle close
Sell when the RSI plus ha
FREE

Imagine: você está à beira de lucros enormes, mas o mercado muda de repente e você perde a chance. Ou pior ainda, você obtém perdas em vez de lucros. E se você tivesse um aliado confiável que sussurra com antecedência: "prepare – se-as ondas estão chegando!"? Conheça o Harbinger , um indicador revolucionário para MetaTrader 5, especialmente projetado para traders que estão cansados do caos e querem antecipar as mudanças do mercado! Harbinger é um algoritmo inteligente que analisa padrões de vola

O Indicador TRIXs é a combinação do indicador TRIX (Triple Exponential Moving Average) com adição de um sinal tipo SMA (Simple Moving Average). Fornece sinais de continuidade de tendência e inicio de uma nova tendência. Os pontos de entrada e saída de operações ocorrem quando as curvas do indicador se cruzam. Tem melhor desempenho quando combinado com outros indicadores.
FREE

This tool is useful for indicating resistance and support levels It bases on zone in setting to identify top/bottom of candles and and draw rectangle according to those resistance/support level Beside user can edit the zone via dialog on specific timeframe and that value will be saved and loaded automatically. User can determine what strong resistance and support and make the order reasonably.
FREE

Title: Price Time Pro Monitor – The Ultimate Multi-Dimensional Chart Guardian Stop cluttering your screen with basic labels. Price Time Pro Monitor is not just another price and countdown tool; it is a sophisticated data engine designed for professional traders who demand precision and multi-timeframe awareness at a single glance. Why is this different from standard indicators? Smart RSI Engine (Multi-TF): Monitor RSI levels for M15, H1, and H4 directly on your current chart. No more switc
FREE

StopLevel O medidor controla o nível STOPLEVEL. Quando o nível muda, ele sinaliza com um alerta. STOPLEVEL - o deslocamento mínimo em pontos do preço de fechamento atual para colocar ordens Stop ou o nível mínimo de stop loss / take profit permitido em pontos. Um valor zero de STOPLEVEL significa a ausência de uma restrição na distância mínima para stop loss / take profit, ou o fato de que o servidor de negociação usa mecanismos externos para controle de nível dinâmico que não podem ser tran
FREE

This indicator is very useful in observing the direction of the market. It allows users to enter multiple MA lines with specific display method. In addition, it is also possible to change the candle color same to color of the background of chart, so that we only focus on the MA lines. When a signal appears, represented by a red or green dot, we can consider opening a sell (red dot) or buy (green dot) order. Note: it need to set stoploss at the highest value of MA lines (with sell order) or lowe
FREE
Session Bias This Strategy of bias useful for those who follow TRADESHARE on youtube. This script is designed by BokaroTraderFx for traders who want assistance in determining their session bias, particularly for those who trade within sessions typically represented by a single 4-hour candle. The method involves using price action to establish a daily bias, guiding decisions on whether to focus on buys, sells, or both. The analysis is based on the previous daily and 4-hour candle closes, fo
FREE

** All Symbols x All Timeframes scan just by pressing scanner button ** *** Contact me to send you instruction and add you in "ABCD scanner group" for sharing or seeing experiences with other users. Introduction This indicator scans AB=CD retracement patterns in all charts. The ABCD is the basic foundation for all harmonic patterns and highly repetitive with a high success rate . The ABCD Scanner indicator is a scanner reversal ABCD pattern that helps you identify when the price is about to cha

Powerful trend indicator provided with all necessary for trade and it is very easy to use. Everyone has probably come across indicators or Expert Advisors that contain numerous input parameters that are difficult to understand. But here, input parameters are simple and it is no need to configure anything — neural network will do all for you.
Difference from a classic version
The real-time multi time frame panel is added, so you can check a trend for other timeframes without switching the schedu
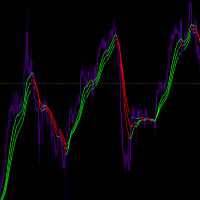
Input Parameters JawPeriod (default=9): Period for the blue line JawShift (default=0): Shift for the blue line TeethPeriod (default=7): Period for the red line TeethShift (default=0): Shift for the red line LipsPeriod (default=5): Period for the green line LipsShift (default=0): Shift for the green line Signals Bullish Conditions When price moves above all lines (all lines turn Lime) Potential buying opportunity Confirms upward momentum Bearish Conditions When price moves below all
FREE
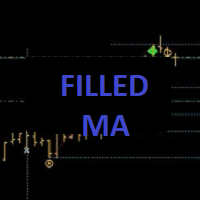
++++++++++++++++++++++++++++++++++ +++ Trend Tool ++++++++++++++++++++++++++++++++++ Hallo Trader, This is a trend tool that I use... based on four moving averages. Price below or above the EMA200 is indication for the long term trend. Also the direction of the slope counts. You can customise in settings if you want. The tool is aligned with my Forecast System and the Bounce Zones. - Forecast System --> https://www.mql5.com/en/market/product/156904 - Bounce Zones --> https://www.mql5.com/en/mar
FREE

The Volume Weighted ATR indicator is a helpful tool for measuring market activity. It is based on the idea of the Volume-Weighted ATR. Combining these two elements helps identify potential turning points or breakout opportunities. The indicator for the classification of the activity of the market uses the moving average and its multiples. Accordingly, where the VWATR bar is located (relative to the moving average), it is labelled as ultra-low, low, average, high, very high or ultra high. The Vo
FREE

Heiken Ashi Smoothed – The Ultimate Trend Filtering Indicator for MT5 Enhance Your Trading with Smoother Trends! The Heiken Ashi Smoothed indicator is a powerful tool designed for traders who want clearer trend signals while eliminating market noise. Unlike traditional Heiken Ashi candles, this smoothed version provides fluid, lag-free price action , making it perfect for swing trading, trend following, and long-term analysis. Key Features: Crystal-Clear Trends – Filters out market noise for

Moving Average Color
Moving Average (MA) is a trend indicator, which is a curved line that is calculated based on price changes. Accordingly, the moving average is the trader’s assistant, which confirms the trend. On the chart it looks like a bending line that repeats the price movement, but more smoothly. Moving Average Color it is a standard moving average indicator with a color change when the trend direction changes. The ability to set additional levels has also been added. It is a handy too
FREE

Excellent tracking performance and minimal noise! This trend detection indicator that avoids whipsaws and uncertain market noise and is also agile enough to react to changes in trend.
It is also designed to adapt to dynamic markets.
Functions mainly as a filter to help you trade in the direction of the trend.
Features.
Simple and easy to use. Low load and easy to try out The excellent tracking performance and smooth lines that make it ideal for market analysis Can be used as a trend filter for
FREE

This Indicator works as a momentum oscillator however it is most used to surf the trends. Despite of being an oscillator, MACD (Moving Average Convergence/Divergence) doesn't work with over limit conditions (such as OverBought or OverSold). Graphically it's shown as two lines and an histogram with the diference of them. Standard metatrader has this indicator, however with only the two lines and without the histogram. This way it is much easier to read and uderstand it.
FREE

If you like this project, leave a 5 star review. Often times we are using brokers that are outside of the GMT-0 timezone, this
not only complicates things, but, it can make seeing when a trading session starts
a bit more difficult than it should. This indicator allows you to set a timezone offset it will draw a vertical line for the: Day. Week. Month. Quarter. year.
FREE
A Renko Tick chart based on continuously adjusting percentage.
Live Renko bricks formed by tick data
Adjustable brick width expert for indicator attached Scalp with a Renko, get weird.
The settings can and will break the script if you turn them up too high. Turning off outline mode will not look as nice, but can potentially allow for a larger number of bricks.
FREE
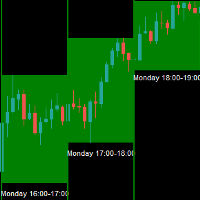
The Entry Signal Analyzer is a sophisticated MetaTrader 5 indicator designed to analyze and identify optimal trading hours based on price movement patterns. The indicator analyzes gold currency only a updated version is currently being developed for other symbol the indicator in the strategy tester is non-functional works on the real chart Statistical Analysis: Analyzes historical price movements for each hour of the trading day Tracks success rates and consistency of movements Calculates poi
FREE

Gatotkaca Support Resistance Trendline Indicator is a simple indicator that detects support, resistance and trendlines. It will helps you find breakout momentum based on lines calculated by this indicator. This is conceptually based on fractals, but with customizable periods. Compatible for any timeframes. You can customize how this indicator work by setting up the period input.
FREE
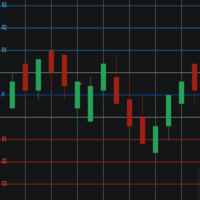
Pivot Points Levels Descrição O indicador Pivot Points Levels é uma ferramenta avançada e completa para análise técnica baseada em níveis de suporte e resistência calculados a partir de pontos de pivô. Este indicador gratuito combina 6 métodos diferentes de cálculo com suporte a múltiplos timeframes, oferecendo uma solução robusta para identificar áreas-chave de reversão e continuação de preço. Características Principais 6 Métodos de Cálculo : Tradicional, Fibonacci, Woodie, Clássico, DeMark (DM
FREE

O indicador ROMAN5 Time Breakout desenha automaticamente caixas de suporte e resistência diárias para rompimentos. Ajuda o usuário a identificar o momento de comprar ou vender. Vem com um alerta sonoro sempre que um novo sinal aparece. Ele também possui a facilidade de enviar e-mail. O seu endereço de e-mail e configurações do servidor SMTP devem ser especificados na janela de configurações do guia "Email" no seu MetaTrader 5. Seta para cima azul = Comprar Seta para baixo vermelha = Vender. Você
FREE
Fique à frente do impulso do mercado com o Pip Movement Alert MT5, um indicador versátil de múltiplas moedas projetado para rastrear e alertar traders sobre movimentos precisos em pips em vários símbolos, ideal para trading de forex, ações, criptomoedas e commodities. Elogiado em comunidades de trading como Forex Factory e Reddit’s r/Forex, e destacado em discussões no Investopedia e TradingView por sua capacidade de detectar mudanças repentinas no mercado, este indicador é indispensável para tr
FREE
Indicador com regra de coloração para estratégias que utilizam Inside Bar! Quando rompe a barra inside, se for para cima, compra e posiciona o stop loss na mínima da barra inside. Se romper para baixo, vende e posiciona o stop loss na máxima da barra inside. Pode ser aliada a tendências de outros tempos gráficos e outros filtros.
Grupo de sinais gratuito no telegram: https://t.me/InsideBarRST
FREE

The Stretch is a Toby Crabel price pattern which represents the minimum average price movement/deviation from the open price during a period of time, and is used to calculate two breakout levels for every single trading day. It is calculated by taking the 10 period SMA of the absolute difference between the open and either the high or low, whichever difference is smaller. This value is used to calculate breakout thresholds for the current trading session, which are displayed in the indicator as
FREE

Kindly rate and comment about the product for upgradation & Support
The 5 EMA is plotted in green color ( Lime ).
The 14 EMA is plotted in red color ( Red ).
The 20 EMA is plotted in blue color ( Blue ).
The 200 EMA is plotted in yellow color ( Yellow ).
The Quarter EMA that provided calculates and plots four Exponential Moving Averages (EMAs) on the chart using different periods: 5, 14, 20, and 200. Each EMA is represented by a different color on the chart. Here's a description of each EMA:
FREE
VWAP (Volume Weighted Average Price) is a technical analysis indicator that shows the average price of an asset, weighted by trading volume, over a specified time period. It is calculated by dividing the total dollar value traded (price × volume) by the total volume. Formula: VWAP = sum(PRICE*VOLUME)/sum(VOLUME)
MM vwap have 4 options to set anchor:
Month Week Day Session Indicator will be updated in future.
FREE

The Fair Value Gap Detector is a MetaTrader 5 indicator designed to identify and draw rectangles on the chart wherever fair value gaps (FVGs) are detected. Fair value gaps occur when there is a significant disparity between the current price and the fair value of an asset. These gaps can provide valuable insights into potential trading opportunities, as they often indicate overbought or oversold conditions in the market. Key Features: FVG Detection: The indicator utilizes a proprietary algorith
FREE

The name Aroon means “ Dawn's Early Light ” in Sanskrit. His creator Tushar Chande chose this name because the indicator is designed to catch the beginning of a new trend. At first sight it seems a little confusing all those jagged lines but after you understand the basics of it, you will find this indicator pretty cool and use it in a variety of ways, i.e.: Trigger, Trend Filtering System, and so on. The Aroon indicator was created in 1995 so it is a "modern" indicator compared to the Jurassic
FREE

Description :
Combination MT5 is a professional indicator based on the Stochastic Oscillator and Average True Range (ATR) technical indicators, thus, you can use it with any currency pair and any timeframe.Trade signals from Combination MT5 are drawn on the main chart in the form of arrows. When a blue arrow appears, then this is a signal to buy, when the red one appears then this is a signal to sell. You can set the alerts on/off. The Stochastic Oscillator and Average True Range (ATR) technica
FREE

XE Forex Strengh Indicator MT5 displays visual information about direction and strength of a signal for current pair and chosen timeframes (M5, M15, M30 and H1). Calculations are based on multiple factors and results are shown as a colored panel with scale bar, numerical values and arrows. There are also displayed values of current price and spread on the pair. There can be activated an alert (as a mail or pop-up window with sound) for each available timeframes which send a message when the dir
FREE

Smart Super Trend Indicator (Free) Turn volatility into opportunity — Catch trends early and trade smarter The Supertrend Indicator is one of the most trusted tools in technical analysis, designed to help traders quickly identify the prevailing market trend and spot potential entry and exit points with precision. Built on price action and volatility, this trend-following indicator adapts dynamically to market conditions, making it a powerful companion for both beginners and experienced traders.
FREE

What is this indicator? This indicator is for comparing multiple charts and verifying the chart pattern. Synchronize each chart position with the common vertical line. By changing the chart mode, you can also display the chart like a real trade.
How to set up
1. Scroll the chart of the target currency pair to the end in the past direction and download all the historical data of that currency pair. 2. Install this indicator in the main window of each chart. 3. Customize each parameter on the In
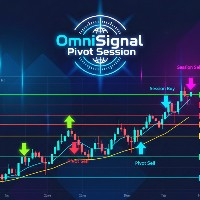
OmniSignal Pivot Session combines two powerful trading concepts— Daily Pivots and (NY, London and COMEX) Session Opening Levels —into one clean, intelligent signal indicator. It's designed to identify key market levels and provide clear, non-repainting entry signals based on a robust 3-candle confirmation pattern , helping you filter out market noise and trade with more confidence.
Suggested Symbols: XAUUSD, US30, DE40
(might have some bugs if you are using it with any Forex Pair!)
Core Fea
FREE

Apply to the 5 minute timeframe against the major USD forex pairs. AUDUSD EURUSD GBPUSD USDCAD USDCHF USDJPY Highlights the PropSense Book Levels Turn on/off for Sydney, Asia, London and New York Sessions Shows the Tokyo and London Fixes Turn on/off for Tokyo and London Configure how many historical fixes to show Shows the Sessions Turn on/off visible indication for sessions (supports 4 sessions) Visibly shows the sessions (out of the box configuration for Sydney, Tokyo, London and New York) Hig
FREE

The TrendOscillator Indicator is an upgraded version of the traditional Stochastic Oscillator. It comprises two lines: %K and %D. The %K line represents the current market position. In contrast, the %D line is a moving average of the %K line used to generate signals and identify potential entry or exit points. The good thing is the indicator works on all timeframes like the traditional Stochastic. However, to avoid any false signals, applying the indicator on longer timeframes is better
FREE

Currency Strength Meter is the easiest way to identify strong and weak currencies. This indicator shows the relative strength of 8 major currencies + Gold: AUD, CAD, CHF, EUR, GBP, JPY, NZD, USD, XAU. Gold symbol can be changed to other symbols like XAG, XAU etc.
By default the strength value is normalised to the range from 0 to 100 for RSI algorithm: The value above 60 means strong currency; The value below 40 means weak currency;
This indicator needs the history data of all 28 major currenc

True Days is a tool designed specifically for the trader who wants to catch intraday volatility in price charts. True day makes it easier for the trader to avoid trading in the dead zone - a period in time where markets are considered dead or non volatile. The trader can concentrate on finding opportunities only during periods of profound market movements. By default the indicator gives you a true day starting at 02:00 to 19:00 hours GMT+2. You can adjust according to your Time Zone. By deafult
FREE

Индикатор для синхронизации и позиционировании графиков на одном и более терминалах одновременно. Выполняет ряд часто необходимых при анализе графиков функций: 1. Синхронизация графиков локально - в пределах одного терминала при прокрутке, изменении масштаба, переключении периодов графиков, все графики делают это одновременно. 2. Синхронизация графиков глобально - тоже самое, но на двух и более терминалах, как МТ5, так и МТ4. 3. Позиционирование графика на заданном месте при переключении периодо
FREE

Do you find it difficult to track and manage your open positions across multiple different symbols in MetaTrader 5? Do you need a quick and comprehensive overview of your current market exposure and the performance of each symbol individually? The "Dynamic Exposure Table" indicator is your ideal tool! This indicator displays a clear and detailed table in a separate window below the chart, summarizing all your open positions and intelligently grouping them by symbol, giving you a complete view of
FREE

Purpose and functions of the indicator The indicator determines and marks the moments of trend change on the chart based on the theory of fractal levels breakout on any of the analyzed timeframes. If a breakout based on all rules is valid, a horizontal line with corresponding color will appear on the chart. If there is an uptrend, the line will be blue. In the descending trend, the line will be red. The blue line is a strong support level, the trader should look for buying opportunities above th
FREE

**“Multi Trendline Channel With Regression Bands” – Linear Regression Channel + Standard Deviation Band Indicator (MT5)**
This indicator automatically plots multi‑period linear regression channels together with standard deviation bands, giving traders instant clarity on trend direction, price dispersion, and key support/resistance zones. By turning complex analysis into simple, intuitive visuals, it provides discretionary traders with a clear market context at a glance.
### Key Features
FREE
O Mercado MetaTrader é o melhor lugar para vender robôs de negociação e indicadores técnicos.
Você apenas precisa desenvolver um aplicativo para a plataforma MetaTrader com um design atraente e uma boa descrição. Nós vamos explicar como publicar o seu produto no Mercado e oferecer a milhões de usuários MetaTrader.
Você está perdendo oportunidades de negociação:
- Aplicativos de negociação gratuitos
- 8 000+ sinais para cópia
- Notícias econômicas para análise dos mercados financeiros
Registro
Login
Se você não tem uma conta, por favor registre-se
Para login e uso do site MQL5.com, você deve ativar o uso de cookies.
Ative esta opção no seu navegador, caso contrário você não poderá fazer login.