MetaTrader 5용 기술 지표 - 29

Tick Velocity Pro — The Real-Time Market Pulse Indicator Tick Velocity Pro is a next-generation tick-based momentum analyzer that converts raw tick data into a live market energy visualization.
It tracks the speed and direction of every price tick — showing whether buyers or sellers dominate — and transforms this into a clean, easy-to-read histogram. ️ Core Concept Each incoming tick is analyzed in real time: Upward ticks → Buyer momentum Downward ticks → Seller momentum
These are accu
FREE

Initiated in 1995 by the physicist and technical analyst Paul Levine, PhD, and subsequently developed by Andrew Coles, PhD, and David Hawkins in a series of articles and the book MIDAS Technical Analysis: A VWAP Approach to Trading and Investing in Today's Markets.Latterly, several important contributions to the project, including new MIDAS curves and indicators, have been made by Bob English, many of them published in the book.
FREE
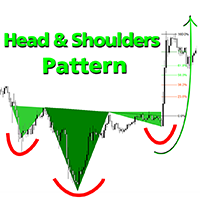
웰컴 가격: 35달러 헤드 앤 숄더 패턴 은 신뢰할 수 있는 패턴 인식을 원하는 트레이더에게 이상적입니다. 강세 및 약세 헤드 앤 숄더 형성을 포함하며, 통합된 피보나치 레벨, 목선 돌파 감지 및 조기 예측 기술이 적용되었습니다. 차트 구조와 추세 반전을 정확하게 식별하는 기술적 분석을 중시하는 분들을 위한 강력한 MT5 도구입니다. 이중 감지 방법 방법 1 - 클래식 패턴 감지
명확한 구조적 규칙을 사용하여 표준 헤드 앤 숄더 패턴(일반형, 역형, 비표준형)을 감지합니다.
이 방법은 다음을 강조합니다: 명확한 목선 돌파 대칭적인 패턴 형성 피보나치 되돌림 레벨 기반 즉각적인 반응 구역 방법 2 - 예측적 패턴 감지
오른쪽 숄더가 형성되기 전에도 왼쪽 숄더와 머리를 조기에 식별하는 혁신적인 접근법입니다.
예측 삼각형 을 사용하며 Early_Quick_Pips 라인 을 그려 더 빠른 진입 지점과 가격 움직임에 대비할 시간을 제공합니다. 이 방법에서는 피보나치 레벨이 다르게 계산

Strifor Pivot + ATR Target
Pivot Levels Indicator with ATR-Based Targets and Analytics Panel
for MetaTrader 5 Strifor Pivot + ATR Target is a tool for intraday and medium-term trading that combines classic pivot levels with dynamic ATR targets and an informational analytics panel. The indicator helps you assess the trading range in advance, identify likely price reaction zones, and estimate movement potential — eliminating manual calculations and subjective assumptions. Key Features Automatic c
FREE

This indicator marks the 50% mark of each candle. It will help you make profitable scalping trades. If the next candle opens above the 50% mark of the previous candle, you should open a BUY position, and if the next candle opens below the 50% mark of the previous candle, you should open a SELL position. This strategy is very profitable. To make the most of it, keep an eye on the candle contexts on the left. Good luck!
FREE

Currency Strength Chart is a powerful Forex indicator designed to track and visually represent the strength of individual currencies within a basket of the 8 major currencies: USD, EUR, GBP, JPY, AUD, NZD, CAD, and CHF. By calculating the relative strength of each currency, the indicator provides traders with a comprehensive overview of how each currency is performing against the others in real-time. This indicator helps traders identify potential trading opportunities by highlighting strong cur
FREE

https://www.mql5.com/en/users/gedeegi/seller
GEN (Trend Fib Zones) GEN (Trend Fib Zones) is a professional technical analysis indicator that automatically detects trend structure shifts using swing highs/lows and dynamically plots key Fibonacci retracement and extension zones. Key Features: Automatic Trend Structure Detection Identifies market structure changes using CHoCH (Change of Character) and BOS (Break of Structure) logic. Highlights trend direction based on real swing high/low pivo
FREE

Willkommen in einer neuen Ära des Tradings mit dem AI Moving Average Indikator, einem fortschrittlichen MetaTrader 5 Indikator, der Tradern prädiktive Einblicke in Marktbewegungen bietet. Dieses Tool kombiniert die Leistungsfähigkeit von KI mit der Zuverlässigkeit eines Zero-Lag-Exponentialgleitenden Durchschnitts, um präzise und zeitnahe Vorhersagen über zukünftige Preisentwicklungen zu liefern. Innovatives Lineares Regressionsmodell Der AI Moving Average nutzt ein maschinelles Lernmodell der l
FREE

The TrendOscillator Indicator is an upgraded version of the traditional Stochastic Oscillator. It comprises two lines: %K and %D. The %K line represents the current market position. In contrast, the %D line is a moving average of the %K line used to generate signals and identify potential entry or exit points. The good thing is the indicator works on all timeframes like the traditional Stochastic. However, to avoid any false signals, applying the indicator on longer timeframes is better
FREE

Synthetic Reverse Bar is an evolution of Reverse Bar indicator. It is well-known that candlestick patterns work best at higher timeframes (H1, H4). However, candlesticks at such timeframes may form differently at different brokers due to dissimilarities in the terminal time on the single symbol, while the history of quotes on M1 and M5 remains the same! As a result, successful patterns are often not formed at higher timeframes! Synthetic Reverse Bar solves that problem! The indicator works on M5

The HammerStar indicator is designed to search for the Hammer and Shooting Star patterns on charts of any currency pairs.
Hammer Downward trend.
The lower shadow is not less than 2 and no more than 3 times larger than the body.
There is no upper shadow, or it is very short (no more than 10% of the candlestick range).
The color of the body in the long game is not important, with the short - white hammer is much stronger than the black one.
Confirmation is suggested.
Shooting Star Uptrend.
The u
FREE
Simple SuperTrend indicator, similar to that of TradingView's.
It has buffers for buy and sell signal, if you want to integrate this into an EA.
It helps traders easily identify trends by providing clear buy and sell signals based on price movements. Designed for simplicity, it’s easy to use and integrates well with various trading strategies, making it a great option for traders of all levels.
Happy trading!
FREE

The Expert Advisor for this Indicator can be found here: https://www.mql5.com/en/market/product/116472 Introducing the Rejection Candle MT5 Indicator, a robust tool designed to revolutionize your trading experience on the MetaTrader 5 platform. Built to pinpoint potential reversals with precision, this indicator offers unparalleled insights into market sentiment shifts, empowering traders to seize profitable opportunities with confidence. Key Features: Advanced Rejection Candle Detection: Uncov
FREE

Necessary for traders: tools and indicators Waves automatically calculate indicators, channel trend trading Perfect trend-wave automatic calculation channel calculation , MT4 Perfect trend-wave automatic calculation channel calculation , MT5 Local Trading copying Easy And Fast Copy , MT4 Easy And Fast Copy , MT5 Local Trading copying For DEMO Easy And Fast Copy , MT4 DEMO Easy And Fast Copy , MT5 DEMO Fibo: from KTrade 1. Automatically calculate and analyze the band. -> Get the desired band 2.
FREE

The TickCounter indicator counts up and down ticks on each new bar.
The calculation starts from the moment the indicator is placed on the chart.
Histogram bars represent: Yellow bars - total number of ticks; Blue bars - ticks UP; Red bars - ticks DOWN. If the blue bar is not visible, then there are more down ticks and the red bar is displayed on top of the blue one (the red layer is above the blue one). MT4 version: https://www.mql5.com/en/market/product/82548
Each reinitialization of the i
Correlation Monitor 는 종목 간 관계를 빠르게 탐지하는 지표입니다 . 강한 양 / 음의 상관관계를 가진 페어를 찾고 , 다이버전스를 식별하며 , 헤지 · 페어 · 바스켓 트레이딩에서 보다 근거 있는 의사결정을 내리도록 돕습니다 . Meta traider 4. 주요 기능 • 상관관계 매트릭스와 컴팩트 리스트 : 선택한 심볼 간 관계의 강도를 즉시 보여 주며 , 색상 구분으로 가독성을 높입니다 . • 상관 심볼의 미니 차트 : 메인 차트의 가시 범위와 동기화되어 움직임을 직관적으로 비교할 수 있습니다 . • Top‑5 모드 : 가장 강한 양의 / 음의 관계를 강조 표시하여 빠르게 집중할 수 있습니다 . • 멀티 타임프레임 : 서로 다른 기간에서 평가하며 계산 창 ( 바 수 ) 을 설정할 수 있습니다 . • ‘ 시장 감시 (Market Watch)’ 의 모든 심볼을 지원하며 , 비표준 심볼도 가능합니다 . • 리소스 최적화 : 심볼 목록이 커도 불필요한 부하 없이 정교하게
FREE

AP VWAP Bands Pro (MT5) Volume-weighted average price with ±σ bands for clear intraday bias, mean-reversion zones, and dynamic support/resistance. Works on crypto (incl. BTC) , FX , indices , and metals . Uses tick-volume when real volume isn’t available. What it shows VWAP line (volume-weighted mean price). Two envelopes around VWAP (default ±1σ and ±2σ) to highlight balance vs. extension. Reset modes : Day , Week , or Anchor Time (HH:MM) to start VWAP where you need it (e.g., exchange open).
FREE

SMC Trend Momentum Signal Line
SMC Trend Momentum Signal Line is an MT5 indicator that draws a smoothed on-chart line and colors it in real time: lime for positive momentum, tomato for negative, derived from the “SMC Trend Momentum” subwindow oscillator. This gives you immediate momentum direction directly in the main chart. Note: You must purchase the “SMC Trend Momentum” to see the line. The SMC Trend Momentum Signal Line is and will remain free of charge for you. Key Features Colored On-Char
FREE

The Fair Value Gap Detector is a MetaTrader 5 indicator designed to identify and draw rectangles on the chart wherever fair value gaps (FVGs) are detected. Fair value gaps occur when there is a significant disparity between the current price and the fair value of an asset. These gaps can provide valuable insights into potential trading opportunities, as they often indicate overbought or oversold conditions in the market. Key Features: FVG Detection: The indicator utilizes a proprietary algorith
FREE

SilverTrend Signal Indicator (v4.0) Brief Description
The SilverTrend_Signal is a versatile, trend-following technical analysis indicator designed for MetaTrader 5. It identifies potential market reversal points by analyzing price action within a dynamic volatility-based channel. The indicator plots clear buy (up arrow) and sell (down arrow) signals directly on the chart and provides customizable audio/visual alerts to notify traders of new trading opportunities; helping traders quickly sp
FREE

Special Offer ... It is totally free for all. New one coming soon...................
About This Indicator: RSI vs SMA Indicator: A Comprehensive Technical Analysis Tool for Better for Identify the Short and Long Signals.
The RSI vs SMA Indicator is a powerful technical analysis tool designed to understanding Market Price Fluctuation for Long or Short signals. This user-friendly Indicator good for both novice and experienced traders, providing valuable indication in price chart and separate wind
FREE
AI Volatility Map The AI Volatility Map is a professional indicator designed to analyze market activity by measuring spread and tick velocity. It provides traders with a clear view of market energy levels, helping to identify periods of high volatility, low activity, or sudden changes in momentum. This indicator is especially useful for spotting potential breakouts, trend continuations, or dead market conditions. Key Features: Volatility Score (Blue Line): Represents the normalized market volat
FREE

MarketCrack – Whale Detector: 스마트 머니와 동조 MarketCrack – Whale Detector 는 '고래'로 알려진 대규모 시장 참여자들의 활동을 시각적으로, 그리고 미리 감지하도록 설계된 전문 지표입니다. 이 지표의 목적은 중요한 기관 투자자 압력의 핵심 순간을 식별하여 트레이더가 스마트 머니의 방향에 맞춰 전략적 결정을 더욱 자신감 있게 내릴 수 있도록 돕는 것입니다. 기능 및 목표 MarketCrack – Whale Detector 는 여러 핵심 시간대(H1부터 H12까지)의 가격 움직임과 거래량을 분석하여 기관 투자자 압력 패턴을 식별합니다. 이 시스템은 이러한 정보를 수집하여 컴팩트하고 전문적인 시각 패널에 표시하며, 각 시간대에서 '고래' 활동의 강도와 방향을 명확하게 보여줍니다. 여러 시간대가 일치하면 지표가 자동으로 강조하여 사용자가 대규모 운영자가 주도하는 추세를 감지하고 더 미리 정보에 입각한 결정을 내릴 수 있도록 합니다. 확인 및

Gann Box 지표는 트레이더가 시장의 핵심 수준을 식별하고 활용할 수 있도록 설계된 강력하고 다재다능한 도구입니다. 이 지표는 차트에 직사각형을 그릴 수 있게 해주며, 자동으로 전략적 수준인 0, 0.25, 0.50, 0.75, 1 로 여러 영역으로 나뉩니다. 가격이 이 중 하나의 수준에 도달하면 경고가 활성화되어 거래 결정을 내리는 데 귀중한 도움을 제공합니다. 그리신 영역에 대한 시장의 변화를 즉시 알 수 있습니다. 영역을 그리려면 간단한 직사각형을 그리고 이름을 GannBox 로 바꾸기만 하면 됩니다. 이 지표는 지지 및 저항 , 공급 및 수요 개념을 사용하는 트레이더, ICT 기술을 사용하는 트레이더, 또는 공정 가치 갭 (FVG) 전문가 등 모든 유형의 트레이더를 위해 설계되었습니다. 일일 거래자, 스윙 거래자 또는 포지션 거래자이든, Gann Box 는 시장의 움직임을 더 잘 이해하고 예측하는 데 도움을 주어 반응성과 성과를 향상시킵니다. MT4 버전
Gann Box

Hi Traders, Info Panel with PnL Coloring is a compact yet powerful on-chart dashboard for MT5.
It delivers real-time insights into Buy/Sell volume, symbol-based PnL, overall account performance, margin status, and detailed candle metrics.
With dynamic color-coding and a live candle countdown, this panel helps you monitor your essential trading information and market conditions instantly so that you can make decisions with greater clarity and precision. Abbreviations (current candle information)
FREE

MACD with 4-Color Histogram Overview MACD with 4-Color Histogram is a modern upgrade of the classic MACD indicator — redesigned for clarity, precision, and visual power .
It provides instant insight into market momentum , signal strength , and trend reversals using four distinct color zones that make trading decisions faster and more confident. Color Logic Color Condition Interpretation Green MACD > 0, Signal < MACD Bullish momentum strengthening Orange MACD > 0, Signal > MACD Bul
FREE

Multitimeframe Viewer HiddenEdge – HTF Realtime MiniChart A clear view of higher-timeframe structure — directly inside your main chart.
No need to switch timeframes anymore. HiddenEdge Multitimeframe Viewer shows the last candles of any higher timeframe in a compact, real-time panel — so you can see the bigger picture while staying focused on execution. Key Features Realtime update: the current higher-timeframe candle is drawn live, updating every second. Select how many candles to display:
FREE

## HiddenGapVolume Indicator Overview
**HiddenGapVolume** is a sophisticated MetaTrader 5 technical indicator designed to detect hidden market gaps and volume anomalies through statistical analysis. It combines rolling volume averages with dynamic color-coded visualization to identify potential trading opportunities.
### Core Features
- **Statistical Volume Analysis**: Calculates moving average and standard deviation bands around volume - **Dynamic Color Coding**: 6-color histogram signaling
FREE
VWAP 머신러닝 밴드: 트레이더를 위한 예측 우위 VWAP 머신러닝 밴드로 시장 분석의 다음 단계를 잠금 해제하세요. 이 혁신적인 MQL5 지표는 시장 트렌드, 동적 지지/저항, 그리고 높은 확률의 거래 신호에 대한 비교할 수 없는 통찰력을 제공하도록 설계되었습니다. 거래량 가중 평균 가격(VWAP)의 강력함과 통합된 독점적인 적응형 머신러닝 알고리즘을 활용하는 이 지표는 전통적인 분석을 뛰어넘습니다. 가격 움직임을 예측하고 시장 기회가 완전히 전개되기 전에 이를 포착하는 데 도움을 주어 진정한 예측 우위를 제공하도록 설계되었습니다. VWAP 머신러닝 밴드가 당신의 필수 지표가 될 이유: 지능형 적응형 ML-VWAP 핵심: 진정으로 동적인 VWAP 계산을 경험하세요. 당사의 독점적인 머신러닝 접근 방식은 실시간 변동성과 시장 상황에 따라 스무딩을 자동으로 조정하여 표준 VWAP보다 훨씬 더 반응적이고 정확한 추세 표현을 제공합니다. 독점적인 예측 메커니즘: "Forecast" 매개
Dynamic Swing Anchored VWAP 은 실시간 시장 상황에 맞게 설계된 정밀한 가격–거래량 도구입니다. 시간이 지남에 따라 멀어지는 고정 VWAP 과 달리, 이 지표는 새로운 스윙 고점과 저점에 앵커링하며, 변동성에 따라 반응 속도를 조정합니다. 결과 → 가격에 더 밀착된 공정가치 경로를 제공하여, 되돌림/재테스트/평균회귀 기회를 쉽게 식별할 수 있습니다. 핵심 기능
스윙 앵커링: 새로운 피벗마다 VWAP 재설정.
적응형 VWAP 엔진: 최근 데이터에 가중치, 오래된 데이터는 약화. APT 로 조절.
변동성 추적: 고변동 시 빠름, 저변동 시 부드러움. 장점
전통 VWAP 은 거래량 누적으로 가격과 괴리.
Dynamic Swing Anchored VWAP 은 피벗 기준 리셋 + 변동성 대응. 거래 활용
공정가치 가이드로 활용.
추세장에서는 매끄러운 되돌림 포착. 입력 값 Swing Period APT ATR 자동조절 Volatility

Mostra a média móvel quando ADX > 20 e pinta de verde ou vermelho quando os valores de ADX estão subindo indicando tendência. Quando o ADX é menor que 20 indica movimento lateral consolidado. O indicador não define pontos de entrada, somente mostra a média colorida quando a tendência está se fortalecendo. Faz parte do grupo de indicadores do Indicador Tavim.
FREE
If you love this indicator, please leave a positive rating and comment, it will be a source of motivation to help me create more products <3 Key Takeaways StochRSI is an oscillator that measures the RSI level relative to its high-low range over a period of time. It is more sensitive than the traditional RSI and can highlight overbought or oversold conditions in the market. StochRSI is typically used to generate more frequent and timely trading signals compared with the traditional RSI. StochRSI
FREE

The multi-timeframe indicator of the levels of the Pivot Points. Every closed daily period has its own so-called reference point - Pivot Point, which sets the levels for smaller intraday timeframes for the following day. The Pivot Points indicators existing in the codes have no method of showing the dynamics of the pivot point changes on the historical data of the price chart. Pivot Point calculation formula. Pivot=(High + Low + Close) /3 High — the maximum of the previous day; Low — the minimum
FREE
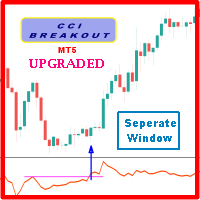
Probability emerges to record higher prices when Commodity Channel Index breaks out oscillator historical resistance level when exhibit overbought values. Since, oscillator breakout of support and resistance have similar effect as price breaks support and resistance levels, therefore, its highly advised to confirm price breakout with oscillator breakout; certainly, will have the same output in short trades. Concept is based on find swing levels which based on number of bars by each side of peak
FREE
Pip Movement Alert MT5로 시장 모멘텀을 앞서 나가세요. 이 다목적 다중 통화 인디케이터는 여러 심볼에서 정확한 핍 움직임을 추적하고 트레이더에게 알리기 위해 설계되었으며, 외환, 주식, 암호화폐, 상품 거래에 이상적입니다. Forex Factory와 Reddit의 r/Forex와 같은 거래 커뮤니티에서 찬사를 받고 있으며, Investopedia와 TradingView의 논의에서도 갑작스러운 시장 변화를 감지하는 능력으로 주목받고 있어, 빠른 가격 움직임을 활용하려는 트레이더에게 필수적인 도구입니다. 사용자들은 핍 기반의 중요한 움직임(예: 10핍 단위)을 최대 95%의 신뢰도로 식별하며, 실시간 알림을 활용하여 변동성 급등을 포착함으로써 거래 타이밍이 20-30% 개선되었다고 보고합니다. 주요 이점에는 다중 통화 모니터링, 사용자 정의 가능한 핍 임계값, 지속적인 차트 분석 없이 추적을 단순화하는 경량 디자인이 포함되어 스캘퍼, 데이 트레이더, 스윙 트레이더에게
FREE

알림 시스템(팝업, 소리, 이메일, 텔레그램, 왓츠앱)을 추가하려면 댓글에 요청해 주세요.
TrendPicoeur — 표시기 설명 및 사용법 TrendPicoeur 표시기 — Parabolic SAR(포물선 SAR) 알고리즘을 구현한 표시기이며, 재그리지 않음(Non-Repainting)입니다. 조건: SuperTrend(슈퍼트렌드) 알고리즘과 변동성 알고리즘을 결합하였습니다. 이 표시기는 트레일링 스탑, 신호 발생기 또는 추세 지표로 사용할 수 있습니다. 버퍼를 통해 전문가 어드바이저(EA)에 연결됩니다. 이 표시기에는 두 개의 버퍼가 있습니다: SetIndexBuffer(0, sarBuffer, INDICATOR_DATA); — 버퍼 (0): 차트 화살표의 가격 위치를 포함합니다. SetIndexBuffer(1, colorBuffer, INDICATOR_COLOR_INDEX); — 버퍼 (1): 화살표 색상을 정의합니다. 색상 버퍼 (1)는 다음 신호를 제공합니다:
FREE

这是一个组合指标分析趋势、支撑阻力、买卖点。运用了均线MA、布林带、KDJ、CCI、RSI。
主图上下线是布林带上下线,采用的是20周期和2.3标准差可以用来支撑阻力。 中间的是分析趋势的均线,趋势分析是用均线多周期: 为涨趋势,反之为下跌趋势。在同一种颜色,基本说明趋势没有发生变化。 子图是由 KDJ、CCI、RSI三个指标组成,大于70超买,小于30超卖, 智能提示是运用了算法,主要计算布林带, KDJ、CCI、RSI指标
有三个或四个指标超出市场常态就会发出提示行情可能反转。 子图指标运用了很多数据,刚刚开始加载会有点慢,耐心等待就可以 这个指标是子图指标,还要再下我发布的MMB分析,这样就刚刚好组成一套分析
电脑分辨率的文本大小请设置100%,不然字体会不一样
FREE

Magic Trend
This MT5 indicator is a Moving Average with 3 signal colors. The 3 input parameters on this Indicator give you a chance to set any Moving Average of choice. A combination of 2 different exponential moving averages, relative strength index, commodity channel index, and William's percent range provide the signals.
White color = Null/No/Exit Signal Green color = Buy Signal Red color = Sell Signal
Point To Note: Confirm the color change only after the current candle closes to avoid
FREE
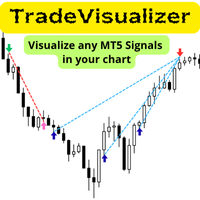
Trade Visualizer 지표는 거래 데이터를 시각화하여 MT5 차트에 전체 거래 내역을 직접 표시합니다. 자신의 성과를 분석하거나 MQL5 시그널 트레이더를 연구할 때, 이 도구는 원시 데이터를 직관적인 시각 자료로 변환합니다. 각 거래는 진입/청산 화살표, 연결선, 가격·수익·거래량·핍 수치 등의 정보로 표시됩니다. 참고: 인디케이터를 다운로드하셨다면 이메일 주소와 함께 메시지를 보내주시면 Trade Visualizer Template 무료 사본을 보내드립니다. 특징:
• 최신 ProTrading Analytics Excel Template v1.7 과 완벽히 통합.
• 여러 트레이더/전략을 동일 심볼에서 비교 가능.
• 매수·매도 색상, 선 스타일, 화살표 크기 완전 사용자 정의.
• GMT 기준 자동 시간대 조정.
• 다양한 브로커 심볼 접미사 지원.
• 전략 논리, 진입/청산 타이밍 분석에 이상적.
FREE
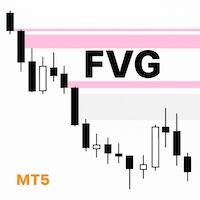
What Makes UTurn FVG indicator Unique I’m a trader, and I built a simple and clean FVG indicator that focuses on what traders actually need. Flexible color and transparency settings. The option to extend unmitigated and partially mitigated FVGs to the current price. Automatic removal of fully mitigated FVGs. Clear visual confirmation when an FVG has already been tested. A clean, professional look that helps traders make faster, more confident decisions. Overview UTurn FVG is a clean, efficient,
FREE
All-in-One Chart Patterns Professional Level: The Ultimate 36-Pattern Trading System All-in-One Chart Patterns Professional Level is a comprehensive 36-pattern indicator well known by retail traders, but significantly enhanced with superior accuracy through integrated news impact analysis and proper market profile positioning. This professional-grade trading tool transforms traditional pattern recognition by combining advanced algorithmic detection with real-time market intelligence. CORE FEATU
FREE

Seeing and interpreting a sequence of Candlesticks is easy to spot when you are a human... Higher Highs, Higher Lows, are the panorama of a Buying trend, at least in a short period of time... Seeing a current candlestick higher high and a lower candlestick low, as a human, you can immediately spot a "divergence", an "alert", a "starting range", but in the end and based on other analysis a human trader can understand and behave accordingly to this kind of candlestick data... But what about EAs (r
FREE
APICT Chart Patterns – Trend Line & Pattern Recognition for MT5 Enhance your technical analysis with the APICT Chart Patterns Indicator — an advanced tool for automatic pattern and trend line detection in MetaTrader 5. Key Features Automatic Pattern Detection: Identifies over 10 classic chart patterns, including pennants, wedges, channels, and double tops/bottoms. Real-Time Trend Lines: Draws support and resistance lines using smart algorithms. Custom Sensitivity: Adjust detection for major or
FREE

이 인디케이터는 불필요한 노이즈 없이 깨끗하고 정확한 신호를 원하는 트레이더를 위해 설계된, 간단하지만 매우 신뢰할 수 있는 추세 방향 예측 도구입니다。 주요 기능 추세 예측 화살표 – 명확한 Buy/Sell 신호。 적지만 매우 정확한 신호 – 하루 약 1회。 Exit 신호 포함 – 최적의 청산 시점 표시。 리페인트 없음 – 화살표는 한 번 표시되면 변하지 않음。 버퍼 포함 – EA 개발에 적합。 알림 기능 – 팝업, 사운드, 푸시 알림。 화살표 크기 조절 가능 – 시각적 요소 완전 커스터마이즈。 EA 개발에 최적 – SL/TP 필요 없음。
Exit 화살표만으로 긴 드로우다운을 방지。 11년 이상의 MQL 경험 기반 – 매우 뛰어난 보상비율 제공。
정확도: 약 70% 승리 / 30% 손실 。 허황된 약속 없음 – 과장 광고 없음。
직접 테스트해보세요。 추천 종목 AUDUSD, EURGBP, USDCHF, AUDJPY, EURUSD。 추천 시간 프레임 M5, M15. MT4 버전 또는

NtickChart-BVcandle Features This is a free version with limited functionality.
This is a tick chart indicator that displays in a sub-window. Inspired by Bob Volman's (BV) scalping method, it is designed as a tool for achieving simple and effective trading. It is a tick chart specifically for day trading and scalping, focusing even on 1 pipette changes. Instead of time-based candle bars, it generates candle bars for a specified number of ticks (ticks_in_candle). This allows for a more detailed
FREE

Highly configurable Bollinger Bands indicator. Features: Highly customizable alert functions (at levels, crosses, direction changes via email, push, sound, popup) Multi timeframe ability Color customization (at levels, crosses, direction changes) Linear interpolation option Works on strategy tester in multi timeframe mode (at weekend without ticks also) Parameters:
Bollinger Bands Timeframe: You can set the lower/higher timeframes for Bollinger Bands. Bollinger Bands Bar Shift: Y ou can set th
FREE
ATT 지지선과 저항선은 프랙탈 원리를 사용하여 실시간으로 지역적 고점과 저점을 찾고 이를 기반으로 주요 지지선과 저항선을 자동으로 표시하는 MetaTrader용 경량 지표입니다. 좁은 간격으로 배치된 선의 "노이즈"를 제거하고, 터미널에 불필요한 부하를 주지 않고 새로운 틱마다 영역을 업데이트합니다. 표시 영역 수를 쉽게 설정하고 조정할 수 있는 고전적인 표시기입니다. 또한 프랙탈 깊이의 복잡성을 조절함으로써도 가능합니다. 입력 설정에서 지정한 포인트 거리보다 레벨 간 거리가 더 가까워지지 않도록 레벨 간 거리를 조정할 수도 있습니다. 더 많은 제품: 여기 ATT 지지선과 저항선의 이점: 모든 기간의 주요 가격 구역을 빠르게 식별합니다. 마감 레벨의 자동 필터링 - 가장 중요한 라인만 필터링 지연 없이 새로운 바가 추가될 때마다 즉시 업데이트됩니다. 터미널 성능에 미치는 영향이 최소화됨 표준 MetaTrader 속성을 통한 편리한 모양 사용자 정의
이 제품에 관심을 가져주셔서
FREE

CustomRSI50 - 50 레벨 맞춤형 RSI 지표 설명 CustomRSI50은 인기 있는 상대강도지수(RSI)를 기반으로 한 맞춤형 기술 지표입니다. 이 지표는 많은 트레이더들이 모멘텀 분석에서 중요하게 여기는 50 레벨에 특별히 초점을 맞춰 RSI의 명확하고 사용자 정의 가능한 시각화를 제공합니다. 주요 특징 구성 가능한 RSI 기간 강조된 50 레벨 참조선 사용자 정의 가능한 적용 가격 유형 별도 창에서 표시 쉬운 해석을 위한 0에서 100까지의 고정 스케일 사용자 정의 가능한 매개변수 RSI_Period: RSI 계산을 위한 기간을 설정할 수 있습니다 (기본값: 14) applied_price: 계산에 사용할 가격 유형을 선택할 수 있습니다 (기본값: 종가) CustomRSI50 사용 방법 MetaTrader 5의 아무 차트에나 지표를 적용하세요. RSI 기간과 가격 유형을 선호에 따라 사용자 정의하세요. 50 레벨에 대한 RSI의 움직임을 관찰하세요: 50 이상의 값은
FREE

VeMAs는 거래량 역학 및 시장 구조를 분석하여 트레이딩 전략을 개선하도록 설계된 혁신적인 트레이딩 도구입니다. 초보자이든 숙련된 트레이더이든 VeMAs는 우위를 점할 수 있게 해줍니다. VeMAs 인디케이터는 단 $50 에 구입할 수 있습니다 . 인디케이터의 원래 가격은 299 달러입니다 . 기간 한정 혜택 . Version MT4
Here are some blogs on the VeMAs indicator
시장 규모와 구조는 주목해야 할 몇 가지 주요 사항 중 일부입니다.
VeMAs는 고급 알고리즘을 사용해 거래량 변화와 가격 변동을 평가합니다. 정확성과 효율성을 추구하는 트레이더를 위해 설계되었습니다. 이 지표는 자산의 거래량 가격의 움직임을 분석하고 이상적인 진입 시점을 결정합니다. 정확한 진입 지점을 확보하면 잠재적인 변화에 한발 앞서 대응할 수 있습니다.
VeMAs 적용 옵션 및 몇 가지 관찰 사항. 처음 사용하는 경우에도 인디케이터를 사용하는 방법을 이해하는

The Kijun-Sen Envelope is a powerful trend-following indicator based on the Kijun-Sen line from the Ichimoku Kinko Hyo system. This tool creates dynamic upper and lower bands around the Kijun-Sen, forming an envelope that helps traders identify market trends, potential reversals, and overbought/oversold conditions.
Key Features: • Trend Confirmation – Helps determine whether the market is in a strong uptrend, downtrend, or ranging phase. • Support & Resistance Zones – The envelope acts as
FREE

This Indicator represents the standard Heikin Ashi Candle converter from normal candles. They are applied on a different chart, so you can identify easily both prices. You can also change candles to your favourite colours. If you want to, you can use this indicator into an iCostum, so you can apply other indicators over this on, because there are excellent indicators combined with this type of candles
FREE
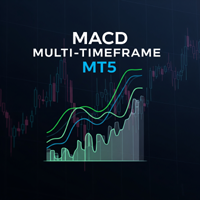
The Multi-Frame MACD Indicator is a robust MetaTrader 5 (MT5) indicator that utilizes the Moving Average Convergence Divergence (MACD) to analyze trends across multiple timeframes. This indicator synchronizes MACD-based trend signals from up to nine timeframes (M1, M5, M15, M30, H1, H4, D1, W1, MN1) and presents them with clear visual cues, including a colored MACD line, signal arrows, and a customizable dashboard. Perfect for traders seeking momentum and trend reversal insights. Features Multi-
FREE

If you are (or were) a fan of the RSI indicator will love Tushar Chande's Dynamic Momentum Index indicator, that simply put is a dynamic variable lenght RSI, so it is more powerful. The DMI indicator internally uses a variable number of bars in its calculations, taking into consideration the volatility levels of the current market you are analyzing. This way, the DMI indicator will use more bars as volatility decreases and less bars when volatility increases, giving you a more powerfull analysis
FREE

Investment Castle Indicator has the following features: 1. Dictates the direction of the trend in different Timeframes . 2. Shows the hit rate and winning rate on the chart. 3. This indicator does not repaint the chart. 4. This indicator is built-in the Support & Resistance based Investment Castle EA which works with Psychological Key Levels "Support & Resistance" Indicator.
FREE

Candle Countdown (MT5) — 현재 캔들 종료까지 남은 시간 Candle Countdown 는 MetaTrader 5용 경량 인디케이터로, 현재 캔들이 마감(종료)되기까지 남은 시간 을 실시간 카운트다운으로 표시합니다. 1초마다 업데이트되며, 차트를 지저분하게 만들지 않고 깔끔하게 보입니다. 주요 기능 실시간 캔들 카운트다운 (타임프레임에 따라 mm:ss 또는 hh:mm:ss) 3가지 표시 위치 가격 레벨 근처(TradingView 스타일) — 현재 가격 레벨 주변에 정렬 우측 상단 고정 — 차트 우측 상단에 고정 표시 스프레드/정보 위(우측 상단) — 스프레드/정보 텍스트와 겹치지 않도록 더 위에 표시 커스터마이징 가능 : 글꼴, 크기, 색상, 접두어(prefix), 여백 및 오프셋 MT5의 모든 종목 / 모든 타임프레임 에서 동작 작동 방식 현재 바(캔들)의 시작 시간과 타임프레임 길이를 이용해, 캔들 종료까지 남은 초를 계산하여 표시합니다.
가격 레벨(TV 스타일
FREE

O Indicador valida a força da tendência utilizando o volume negociado. Os candles são mostrados na cor verde indicando força compradora e cor vermelha na força vendedora. O movimento é encerrado pelo SAR parabólico. Vantagens: Filtra distorções de preço sem volume financeiro; Filtra consolidações e movimentos laterais; Filtra divergências de volume pelo indicador Money Flow. Desvantagens: Não filtra todos os falsos rompimentos, visto que rompimentos importantes geram altos volumes financeiros; N
FREE

HiperCube VIX에 오신 것을 환영합니다. 다윈엑스 제로 25% 할인 코드: DWZ2328770MGM 이 지표는 sp500/us500의 시장 거래량에 대한 실제 정보를 제공합니다.
정의 CBOE 변동성 지수로 알려진 HiperCube VIX는 널리 알려진 시장 공포 또는 스트레스 측정 지표입니다. S&P 500 지수를 광범위한 시장의 대리 지표로 사용하여 주식 시장의 불확실성과 변동성 수준을 나타냅니다. VIX 지수는 S&P 500 지수의 옵션 계약 가격을 기준으로 계산됩니다.
특징: 사용자 정의 색상 사용자 정의 차트 색상 주요 그래프를 명확하게 유지하기 위한 하위 창에 표시기 표시 해석하기 쉬움 완전한 사용자 정의 Chat gpt와 AI를 사용하여 개발되었습니다.
사용 예: VIX는 실제 시장에 대한 우수한 정보를 제공하는 볼륨 표시기이며, 이 표시기의 높은 값은 높은 변동성을 의미합니다. 높은 변동성은 시장 움직임에 접근하고 시장에 빠르게 진입하고 종료하기에 좋은
FREE

VM SuperAshi Trend Precision Trend Sniper using Smoothed Heiken Ashi, Supertrend and EMA Trend
Optimized for M1–M5 Scalping
Overview VM SuperAshi Trend is an indicator that combines a standardized Supertrend with smoothed Heiken-Ashi candles to deliver clear, confirmed, and non-repainting buy/sell signals directly on the chart. It automatically draws Buy/Sell arrows, displays Fast, Slow, and Trend EMA lines, and provides Popup, Email, and Push notifications.
Key Features Supertrend-based signal

MACD Pro – MACD Indicator for MetaTrader 5 Description
MACD Pro is a Moving Average Convergence Divergence (MACD) indicator for MetaTrader 5. It follows the standard MACD calculation method and displays trend direction and momentum in a separate indicator window. Indicator Elements MACD line based on the difference between fast and slow exponential moving averages Signal line calculated as an exponential moving average of the MACD line Histogram showing the difference between the MACD and signa
FREE

super trend version is to help you to have real time view of market move it will help you to get a live view of current market buy signal line and arrow to help you understand batter the direction sell signal line and arrow to help you understand batter the direction trade what you see not what you think this is an simple and best trading tool for our traders of any market crypto gold
FREE

Description This is an indicator for MT5 which has enhanced the "Fractals" indicator. "Fractals" indicator is included in MT5 by default but the draw line period is fixed at "5" and it cannot be modified. Thus I have reinvented the Fractals indicator with some useful function added. This tool will be useful especially for those who are learning how to draw good horizontal lines and wants to get some reference. Of course, those who are considering Fractals as an important horizontal line wil
FREE

Ever feel lost in a trade, unsure of your true risk exposure? Have emotional decisions and a lack of discipline cost you dearly? The line between consistent profit and a blown account is drawn by one thing: professional risk management. But calculating and monitoring that risk in real-time is stressful and complex. Introducing Risk Matrix, the definitive visual command center for MetaTrader 5, engineered to bring military-grade discipline and crystal-clear clarity to your trading. Risk Matrix is
FREE
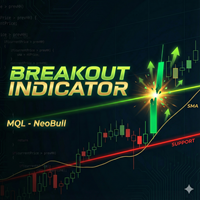
NeoBull Breakout Indicator - 전문적인 돌파 거래를 쉽게 NeoBull Breakout Indicator는 돌파 트레이더를 위해 특별히 설계된 MetaTrader 5용 강력한 기술 지표입니다. 검증된 최고가/최저가 수준과 SMA 200 추세 필터를 결합하여 높은 확률의 돌파 설정을 식별합니다. 주요 기능: * 계단식 최고가(20) 라인 - 지난 20주기의 최고가를 명확한 수평선으로 표시 (TradingView처럼) * 계단식 최저가(20) 라인 - 지난 20주기의 최저가를 명확한 수평선으로 표시 * SMA 200 추세 필터 - 더 정확한 신호를 위해 주요 추세 식별 * 지능형 돌파 알림: HH 돌파 알림 : 가격이 최고가를 돌파하고 SMA 200 위에 있을 때 발동 (상승 추세) LL 붕괴 알림 : 가격이 최저가를 붕괴하고 SMA 200 아래에 있을 때 발동 (하락 추세) * 모바일 푸시 알림 - 기회를 놓치지 마세요! 어디에 있든 스마트폰으로 직접 알림 수신
FREE

MT5용 Body Ratio Indicator – 캔들 강도 및 범위 압축 분석기 Body Ratio Indicator는 캔들의 구조를 분석하여, 캔들 몸통(시가–종가)과 전체 범위(고가–저가)의 비율을 기준으로 시장의 방향성, 불확실성 또는 범위 압축 상태를 식별하는 기술적 도구입니다.
이 간단하면서도 강력한 계산은 트레이더가 강한 모멘텀 캔들 , 우유부단한 캔들(Doji, 스피닝탑) , 폭발적 움직임 전의 압축 구간 을 식별하는 데 도움을 줍니다. 캔들은 실시간으로 세 가지 범주로 분류됩니다: 약한 캔들 (몸통이 전체 범위의 30% 미만): 불확실한 장 , 저거래량 세션 , 또는 Doji , Spinning Top 과 같은 우유부단한 패턴에 자주 나타납니다 중립 캔들 (몸통이 30~70%): 횡보장 , 범위 압축 , 변동성 수축 또는 NR4 , NR7 , 인사이드 바 와 같은 패턴에서 자주 발생합니다 강한 캔들 (몸통이 70% 이상): 강한 방향성 과 추세 지속 가능성이 높으며
FREE

AlphaWave 지표를 활용하여 거래의 잠재력을 발휘하세요! 거래에서 평온함을 가져다주기: AlphaWave 지표는 차트를 부드럽게 만들어 트렌드의 방향을 정확하게 파악하여 거래에 평온함을 제공하도록 설계되었습니다. 명확한 거래 의사 결정을 내리는 것이 이제까지보다 쉬워졌습니다. 10가지 모드를 갖춘 혁신적인 스무딩 기술: AlphaWave 지표를 사용하여 부드럽고 명확한 차트 표시를 경험해보세요. 혁신적인 스무딩 기술은 하나가 아니라 놀라운 10가지 모드를 제공하여 거래 경험을 새로운 차원으로 끌어올립니다! 당신의 거래 스타일에 가장 적합한 모드를 선택하세요. 모든 자산에 대응 가능: AlphaWave 지표는 모든 자산에 완벽하게 적응되며 다양한 시장에서 지원을 제공합니다. 모든 거래 도구에서 그 잠재력을 발휘하세요. 상승 및 하락 트렌드를 위한 맞춤형 경보: 큰 추가 혜택을 누리세요! AlphaWave 지표는 상승 및 하락 트렌드에 대한 맞춤형 경보를 제공합니다. 중요한 거래

ATR Moving Average draws a moving average of the standard Average True Range( ATR ) in the same window.
Settings Name Description ATR period
Set Price per iod for ATR calculation
ATR level Set ATR value for thresholding( only whole number, ignore leading zeros e.g. 0.00089 = 89 ) MA Period Set moving Average Period MA Method Set moving average method( Simple, Exponential, Smoothed and Linear Weighted ) MA Shift
Set moving average shift
Enable Alerts ? Generate Alert when ATR crosses Moving
FREE

The indicator displays divergence for any custom indicator. You only need to specify the indicator name; DeMarker is used by default. Additionally, you can opt for smoothing of values of the selected indicator and set levels whose crossing will trigger an alert. The custom indicator must be compiled (a file with ex5 extension) and located under MQL5/Indicators of the client terminal or in one of the subdirectories. It uses zero bar of the selected indicator with default parameters.
Input parame
FREE

A useful and convenient tool for traders when analyzing and making decisions.
Peculiarity
The main feature of this indicator is its fast algorithm . The gain in the speed of calculating the polynomial and its value of the standard deviation in comparison with classical algorithms reaches several thousand times. Also, this indicator includes a Strategy Tester with a clear visualization of transactions, an equity chart and simultaneous calculation and display of the following data in the form of
++++++++++++++++++++++++++++++++++ +++ Trend Tool ++++++++++++++++++++++++++++++++++ Hallo Trader, This is a trend tool that I use... based on four moving averages. Price below or above the EMA200 is indication for the long term trend. Also the direction of the slope counts. You can customise in settings if you want. The tool is aligned with my Forecast System and the Bounce Zones. - Forecast System --> https://www.mql5.com/en/market/product/156904 - Bounce Zones --> https://www.mql5.com/en/mar
FREE

Stochastic Color Alerts – 스마트 모멘텀 및 컬러 트렌드 지표 Stochastic Color는 클래식 스토캐스틱 오실레이터의 고급 시각적 버전으로, 동적인 색상 변화와 신뢰할 수 있는 알림을 통해 모멘텀과 추세 변화를 쉽게 식별할 수 있도록 설계되었습니다. 이 지표는 전통적인 %K 및 %D 스토캐스틱 로직에 색상이 변하는 메인 라인을 결합하여 시장 방향, 모멘텀 변화 및 잠재적인 반전 구간을 빠르게 파악할 수 있도록 도와줍니다. 주요 기능 동적 컬러 라인 (%K) 메인 스토캐스틱 라인은 자동으로 색상이 변경됩니다. 녹색 → 상승 모멘텀
빨간색 → 하락 모멘텀
주황색 → 현재 형성 중인 캔들 이 시각적 방식은 수치를 지속적으로 분석하지 않고도 빠른 결정을 가능하게 합니다. 클래식 스토캐스틱 계산 전통적인 %K, %D 및 Slowing 파라미터 기반
거래 스타일에 맞게 기간 완전 설정 가능
오실레이터 범위 0~100, 표준 레벨 20 / 80 매수 및 매도 알림 내장
FREE
MetaTrader 마켓 - 거래자를 위한 로봇 및 기술 지표는 거래 터미널에서 바로 사용할 수 있습니다.
The MQL5.community 결제 시스템은 MQL5.com 사이트의 모든 등록된 사용자가 MetaTrader 서비스에서 트랜잭션을 수행할 수 있습니다. 여러분께서는 WebMoney, 페이팔, 또는 은행 카드를 통해 자금을 예치하거나 인출하실 수 있습니다.
트레이딩 기회를 놓치고 있어요:
- 무료 트레이딩 앱
- 복사용 8,000 이상의 시그널
- 금융 시장 개척을 위한 경제 뉴스
등록
로그인
계정이 없으시면, 가입하십시오
MQL5.com 웹사이트에 로그인을 하기 위해 쿠키를 허용하십시오.
브라우저에서 필요한 설정을 활성화하시지 않으면, 로그인할 수 없습니다.