适用于MetaTrader 5的技术指标 - 29

该指标背后的想法是在所有时间范围内找到穆雷水平并将它们组合成组合水平,其中包括基于强穆雷水平 (+2, +1, 8, 4, 0, -1, -2). 时间范围越短,您立即看到组合级别的机会就越大。 它将以颜色突出显示。 当您将光标悬停在任何数字上时,将显示该级别所属的时间范围的提示。 但您将始终将当前时间范围视为最左边的时间范围。 智能警报可帮助您传达与信号组合级别相关的价格。
视频中的仪表板不是声明的功能,也不包含在此处! 仍在开发中。
交易建议。 不建议在没有额外技术分析的情况下交易组合水平的反弹。 从蓝色和红色水平反弹的概率较高。 价格被磁力吸引至组合水平,但价格尚未对其进行测试(128 根蜡烛前)。在这种情况下,建议使用趋势策略,并采取水平取向(高/低一个水平)。 当价格向红色或蓝色水平移动时,不要在沿途反弹时交易黄色(这会破坏势头)。 强烈建议初学者在组合水平反弹时进行交易,除非有相反的组合水平。 最好在趋势方向反弹时进行交易。
在博客链接阅读更多内容 - Murrey Math Trading with UPD1 .
设置说明。
主要设置。 Period -
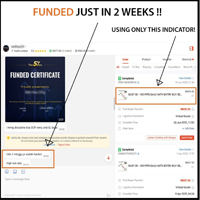
Your PROP FIRM account GOT BLOWN again and again? Still haven’t found an indicator or technique that DELIVERS CONSISTEN PROFITS and PASSING YOUR CHALLENGE ACCOUNT ? Tired of repeating the challenge again and again and desperately wishing you could FINALLY FUNDED and start WITHDRAWING ?
Don’t worry. I’m a REAL PROP FIRM and FULL TIME TRADER and I’ll share with you the very indicator I'VE BEEN USING MYSELF to successfully funded 500k accounts and become a full-time trader.
STOP WASTING time wit

市场步骤指标是基于江恩时间/价格相关性设计和建立的,并通过外汇市场的价格行动特定规则进行优化。它使用市场订单流的概念来预测潜在的高订单量的价格区域。
指标水平可用于交易本身,或作为一个组合来过滤其他策略/指标的错误信号。每个交易者都需要这样一个强大的工具,在图表上拥有多时间框架(TF)区域和价格运动的潜力。你可以在测试器模式下测试它的力量,看看它的水平如何支配图表上的价格。
指标的优势。
用两个不同的区域来标示图表,为不同的TFs指定趋势和范围市场。 价格行动交易者可以使用它来识别不同TFs/价格区的订单流,或验证FTR(失败返回)/FTC(失败继续)。 市场的波动区和流动区将出现在图表上,以便于未来的价格变动。 通过该指标,可以很容易地决定SL/TP、追踪、平衡和利润保存。 价格反转或延续可以很容易地被验证。 该指标的水平可以作为马丁格尔或网格水平使用,概率更高。
Gold Flux Signal Pro is an advanced MT5 Indicator with Multi-Timeframe Logic, Candle Timer & Structured Signal Panel Smart Scalping & Swing Indicator for MT5
This MT5 indicator is built for traders who value clarity, structure, and precision in decision-making. It provides clean buy and sell signal visualization using a stable logic system designed to maintain consistency after candle close. The interface includes a modern UI panel that displays a real-time candle timer, upcoming candle inform
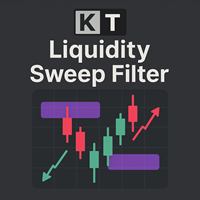
KT Liquidity Sweep Filter 能够识别并突出显示关键的流动性扫荡区域。它将这些区域与明确的价格行为反应以及自适应趋势过滤器相结合,从而生成符合市场趋势的精准买入和卖出信号。 该指标区分主要与次要的流动性扫荡区域。主要区域用大箭头标记,次要区域用小箭头标记,便于快速识别和理解。 大箭头: 表示来自主要流动性扫荡区域的强烈反转信号。 小箭头: 表示来自次要流动性扫荡区域的较弱反转信号。
功能特色 趋势友好信号: 提供多个入场机会,帮助交易者顺应趋势进行操作,尤其适用于像黄金这样的强趋势品种。 更多交易机会: 通过清晰标记强弱反转点,帮助交易者抓住更多基于流动性的交易机会。 可调趋势过滤器: 根据具体的品种和周期,灵活调整信号参数。 可调阈值设置: 可定制主要流动性扫荡信号的灵敏度,匹配个人交易风格。 防止假突破: 明确识别真实的流动性扫荡区域,避免因假突破而产生错误交易。 多周期适用: 适用于不同周期,短周期适合高频交易,长周期适合波段交易。 灵活提醒设置: 大箭头与小箭头的提醒可单独启用或禁用,完全自定义。
输入参数设置 趋势过滤器设置: 调整长度和倍数,以精准

Based on Brazilian trader André Moraes' Difusor de Fluxo theory, the indicator is a more reliable version of the original MACD. It is a great confirmation indicator for Swing Trading and also can be used as a Day Trading tool. If you are not familiar with the concept or André's trading strategies, I strongly recommend his excelent book named "Se Afastando da Manada" in which he explains in detail how this indicator is used. Even if you don't know the Portuguese language it is not difficult to un
FREE
WYSIWYG OPEN RANGE BREAKOUT - PRO EDITION
Ultra-precise ORB indicator with smart line-breaking, dynamic ATR-based targets, and multi-session adaptability. Perfect for day, swing, and algorithmic traders seeking clear visuals and actionable levels . Trade with confidence – see what you trade, trade what you see . "What You See Is What You Get" "What You See Is What You Get" – The ultimate ORB indicator delivering ultra-precise trading range visualization with a smart line-breaking system. Built
FREE

PipVenom - Advanced ATR Trailing Stop Signal Indicator for MT5 Professional Visual Trading System with Real-Time Dashboard OVERVIEW PipVenom is a sophisticated visual trading indicator designed for MT5 that combines ATR Trailing Stop methodology with EMA crossover signals to identify high-probability trade entries. Built with precision and clarity in mind, this indicator provides crystal-clear visual signals with automatic Stop Loss and Take Profit levels displayed directly on your chart. P
FREE

This indicator plots the calculated levels of the IBOV's "thousand" regions on the mini-index, where there is strong institutional commitment, based on their Options Lock positions. In this sense, players tend to defend their positions, acting on the mini-index. With these regions on the chart, you can use the concept of bipolarity to seek trades both in defense and in post-breakout testing. If you're interested, see the link where B3 provides information on options positions for these price lev
FREE
Hi Traders, The Volume Spike Alert Indicator is a lightweight, non-lagging tool designed to help traders identify unusual volume activity in real time . This indicator calculates the average tick volume over a user-defined number of previous bars and compares it with the current candle’s volume . When the current volume exceeds the average by a specified percentage, the indicator triggers alerts, allowing traders to quickly spot potential breakouts, institutional activity, or strong market inter
FREE

Buyer Seller Balance Analyzer 提供跨多个时间框架的买方与卖方力量的全面概览。 主要组件: 买方/卖方平衡表 显示买方与卖方的比例 覆盖从 M1 到 MN1 的时间框架 颜色区分(绿色 = 买方,红色 = 卖方) 关键指标: Buyers (%) – 买方百分比 Sellers (%) – 卖方百分比 ️ Balance – 买方与卖方的差值 Strength – 趋势强度 (STRONG/MEDIUM/WEAK) Volume – 交易量指示 (HIGH/normal) 附加功能: 移动平均线 (8, 21, 50, 100, 200) 当前价格水平线 高交易量高亮显示 信号解读: 强趋势: Balance 显著为正(强绿色) → 强劲上升趋势 Balance 显著为负(强红色) → 强劲下降趋势 反转: Balance 的突然变化可能预示趋势反转 趋势强度减弱 (STRONG → MEDIUM/WEAK) 可能先于趋势变化 盘整: B

Williams Fractals (v2 ) — 更干净的信号,更 少的噪音 这是一 款 经过 深 度 优化 的威 廉姆斯 分 形 指标,用 来 标 记 价格的 “已 确认 ”转 折 点 (潜 在 支 撑 /阻力 ) 。它 只 在 新 K 线上 计算 ,避免无 意义 的 重复运 算 ;箭 头 绘 制 清晰 ,支持 颜色、粗细与 间 距定 制 ;并 提供 可 选 的 高级 过滤 :基于 波 动率 的 ATR 间距 过滤 ,以及 “簇 内 择 优 ”的 分 形 聚类 检测 ,帮助 你在 嘈 杂 行情 中 聚焦 更 有意义 的 结构 点 位 。每个图表 /品 种 的 实例相互 独 立 ,不 会 影响 你的 其他 窗口 ;你 也可以 选择 在 当前 周期 或 指定周期 上 计算,从 而实现更灵活的 多 周期确认 。 为什么 更 可靠 分 形 按 经典 定义 确认 :中 间 高 点 高 于 两 侧 高 点 (看 跌 分 形 相 反 ) ,只有 在 左右 各 满足 既 定 根 数 后 才 会 标 记 ,因此 信 号 自 带 合理 延 迟 ,减少 “未 成熟 ”形 态 。 ATR 间 距 过滤 :
ICONIC TITAN SIGNAL v1.6 “别像人群那样交易——要像传奇一样交易。” ICONIC TITAN SIGNAL 不只是一个指标。
它是你的私人导师、你的扫描器、你的信号提供者。
融合了市场经验、数学逻辑与机构级精度的混合杰作——为那些不止想“参与交易”、而是想 主宰市场 的人而打造。 ICONIC TITAN 能做什么? 它 24/7 在全球 最具影响力的多个市场 中穿透噪音并筛选机会: XAUUSD EURUSD BTCUSD NAS100 US30 GER40 NDX100 GER30 采用 H4 市场结构 + M15 入场分析 的组合, 客观 评估是否正在形成 “ A+ 级 ”形态—— 仅当 强势行情的概率足够高时才给出。 不靠猜测,不看花里胡哨的闪灯,更不吸“希望剂(hopium)”。
只有当一切 完全对齐 时,ICONIC TITAN 才会把 精确的推送通知 发到你的手机上。 激发本系统的 5 位交易者 Mark Minervini – 动能为王
美国交易冠军 & 畅销书作者。
在 ICONIC TITAN 中: H4 上的 EMA 趋势过滤(50/1

The selective pin bar is designed to identify reversals. To use the selective pin bar effectively, traders typically look for Strong Rejection: The tail of the pin bar should extend significantly beyond the surrounding price action. It indicates that there was a sharp rejection of higher or lower prices during the trading period. A strong rejection suggests that the market sentiment may be changing.
FREE
Simple SuperTrend indicator, similar to that of TradingView's.
It has buffers for buy and sell signal, if you want to integrate this into an EA.
It helps traders easily identify trends by providing clear buy and sell signals based on price movements. Designed for simplicity, it’s easy to use and integrates well with various trading strategies, making it a great option for traders of all levels.
Happy trading!
FREE

Colored Moving Average – Visual Trend Clarity Made Simple The Colored Moving Average is a clean and effective trend visualization tool that enhances any trading strategy. Unlike standard moving averages, this indicator dynamically changes color based on the direction of the trend—green when rising, red when falling—making it easy to spot shifts in momentum at a glance. Perfect for scalping, day trading, or swing trading, this indicator helps you: Instantly identify bullish and bearish phases Fi
FREE
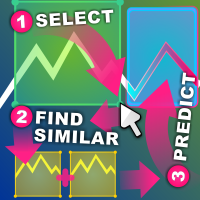
相似价格行为指标 相似价格行为将查找与您选择的图表区域尽可能相似的过去烛台图案序列。
该指标将从您选择的价格行为区域的第一个烛台之前开始搜索,直到图表的第一个最旧条。
评估两个序列之间的相似性有几个标准: 序列的长度必须相同,如果您选择的区域是 20 个烛台宽,那么任何匹配的结果也必须是 20 个烛台宽。您可以选择任意数量的蜡烛。 将根据序列的高低大小进行视觉比较 将根据序列的开盘价和收盘价大小和方向进行视觉比较。如果蜡烛图对一个序列来说是看涨的,而对另一个序列来说是看跌的,则得分设置为 0.0 序列有一组快速和慢速移动平均线,它们根据其增量进行比较。增量可以在该区域内相对比较,也可以在整个资产范围内绝对比较(相对和绝对模式) 序列有一组快速和慢速 ATR,用于比较其波动性。同样,比较可以是相对的,也可以是绝对的。 序列有一组快速和慢速 RSI,用于比较其局部强度。 以上所有内容混合在一起以获得最终评级,其中每个组件都由一个系数加权。指标的输入中提供了系数和比较方法。 指标的搜索引擎 simipac 将扫描过去所有可能的蜡烛图序列,而不会破坏蜡烛的顺序。
这些序列中的最佳序列将

The name Aroon means “ Dawn's Early Light ” in Sanskrit. His creator Tushar Chande chose this name because the indicator is designed to catch the beginning of a new trend. At first sight it seems a little confusing all those jagged lines but after you understand the basics of it, you will find this indicator pretty cool and use it in a variety of ways, i.e.: Trigger, Trend Filtering System, and so on. The Aroon indicator was created in 1995 so it is a "modern" indicator compared to the Jurassic
FREE

The market is unfair if only because 10% of participants manage 90% of funds. An ordinary trader has slim changes to stand against these "vultures". This problem can be solved. You just need to be among these 10%, learn to predict their intentions and move with them. Volume is the only preemptive factor that faultlessly works on any timeframe and symbol. First, the volume appears and is accumulated, and only then the price moves. The price moves from one volume to another. Areas of volume accumu

RQL Trend Board – Description RQL Trend Board is a simple but powerful multi-timeframe trend dashboard.
It shows the current market bias across several timeframes at the same time, using an internal trend-classification method. Each timeframe is displayed as a colored box: Green – bullish bias → look for long setups
Yellow – ranging / unclear → no trade zone
Red – bearish bias → look for short setups The indicator gives a clear overall picture of where the market wants to go, instead o
FREE

The indicator displays the size of the spread for the current instrument on the chart. Very flexible in settings. It is possible to set the maximum value of the spread, upon exceeding which, the color of the spread label will change, and a signal will sound (if enabled in the settings). The indicator will be very convenient for people who trade on the news. You will never enter a trade with a large spread, as the indicator will notify you of this both visually and soundly. Input parameters: Aler
FREE

该指标在图表上显示圆形水平。 它们也被称为心理、银行或主要参与者级别。 在这些水平上,多头和空头之间存在真正的斗争,许多订单的积累导致波动性增加。 该指标会自动调整到任何工具和时间范围。 当80水平被突破然后测试时,我们买入。当20级被突破然后测试时,我们卖出。目标是00。 注意力。由于强大的支撑 。 和阻力位,价格可能略低于 00 水平。
输入参数 。
Bars Count - 线条长度(以条为单位) 。 Show 00 Levels - 显示或不显示 00 级 。 Show 10, 90 Levels 。 Show 20, 80 Levels 。 Show 30, 70 Levels 。 Show 40, 60 Levels 。 Show 50 Levels 。 N Lines - 限制图表上级别数的参数 。 Distance 00 Levels - 层间距离(自动或手动) 。 Line Position - 图形前面或后面的线 。
Visual Button - 按钮显示(启用/禁用) 。 Corner - 按钮锚定角度 。 X indent - 以像素为单位的水平填充
FREE

El indicador "Time Broker Deriv" está diseñado específicamente para su uso en los índices sintéticos Boom y Crash, así como en otros pares de trading disponibles en la plataforma MT5. Su función principal es proporcionar la hora del broker en comparación con nuestra hora local. Es importante destacar que el indicador "Time Broker Deriv" solo muestra la hora del broker.
FREE

Session Bias This Strategy of bias useful for those who follow TRADESHARE on youtube. This script is designed by BokaroTraderFx for traders who want assistance in determining their session bias, particularly for those who trade within sessions typically represented by a single 4-hour candle. The method involves using price action to establish a daily bias, guiding decisions on whether to focus on buys, sells, or both. The analysis is based on the previous daily and 4-hour candle closes, fo
FREE

Detailed blogpost: https://www.mql5.com/en/blogs/post/766378
Key Features
Adaptive Upper/Lower bands Smooth Center Line Customizable Length (sensitivity) Non-Repainting (only current ongoing bar is updated every "Refresh After Ticks" number of ticks) Multiple Price Sources - Choose from close, open, high, low, median, typical, or weighted close Components:
The Basis Line The smooth center line represents the weighted average of price. Think of this as the "true" price level when all the noise
FREE
Linear Regression Channel (LRC) Indicator – Overview The Linear Regression Channel (LRC) indicator is a professional tool designed to display dynamic price channels around a regression trendline. It automatically adapts to market conditions, helping traders visualize price movement with clarity. Main Features : Regression-based central line with upper/lower channel boundaries. Fully customizable colors, styles, and levels. Optional labels and forward extensions for better chart visualizati
FREE

The script tries to determine the overall direction of the market, using smoothed Heiken Ashi candles. The coloring system (using bright and dark colors) is an attempt to detect strong market and weak market conditions. There's also an oscillator within the script
These are the features: Alert condition Features: You can now set alerts in the alert dialog for events like trend switch, trend strengthening and weakening; all for both Bullish and Bearish trend.
I also added the code for custom a
FREE

BUY INDICATOR AND GET A PIVOT POINT EA FOR FREE AS A BONUS + SOME OTHER GIFTS! Attention, the MT5 version of this application does not work on strategy tester, only on live accounts or demo accounts on live market. If you need an MT5 demo version of the Indicator send me a private message here: https://www.mql5.com/en/users/italobr ITALO PIVOTS INDICATOR is the best pivot point indicator for strong price reversals and continuations of price movements ever created, and why is that? You

This indicator displays volume delta (of either tick volume or real volume) encoded in a custom symbol, generated by special expert advisers, such as RenkoFromRealTicks . MetaTrader does not allow negative values in the volumes, this is why we need to encode deltas in a special way, and then use CustomVolumeDelta indicator to decode and display the deltas. This indicator is applicable only for custom instruments generated in appropriate way (with signed volumes encoded). It makes no sense to ap
FREE

Индикатор Trade in trend предназначен для торговли по тренду. Сила тренда определяется шириной линии. Узкая линия - начало или конец тренда. Широкая линия свидетельствует о высокой силе тренда. Резкая смена ширины линии свидетельствует, с большой вероятностью, об окончании тенденции. Сигналы индикатора Не против покупки: переход с красной линии в белую цена отразилась от белой линии индикатора цена находится выше белой линии индикатора Не против продажи: переход с белой линии в красную цена отр
FREE

The indicator plots two lines by High and Low prices. The lines comply with certain criteria. The blue line is for buy. The red one is for sell. The entry signal - the bar opens above\below the lines. The indicator works on all currency pairs and time frames It can be used either as a ready-made trading system or as an additional signal for a custom trading strategy. There are no input parameters. Like with any signal indicator, it is very difficult to use the product during flat movements. You
FREE

BB and EMA 50 This indicator merges BollingerBands and EMA50 to clarify trend strength, momentum shifts, volatility expansion, and directional bias, offering structured insights for breakout detection, pullback validation, and dynamic trend continuation across varied market conditions while improving precision in identifying reliable trade setups. It also includes an interactive hide-and-show line control using integrated buttons for flexible visual analysis.
FREE

"Envelope of Adaptive Moving Average" 指标是一种帮助您在金融市场做出明智决策的工具。它旨在为您提供清晰的趋势方向以及交易中可能的入场和出场点。
该指标基于自适应移动平均,这意味着它会自动调整以适应市场波动性的变化。这使其在既可能平静又可能波动的市场中特别有用。该指标显示两条包围自适应移动平均线的线条。这些线条有助于识别关键的支撑和阻力水平,从而使您更明智地决定何时买入或卖出资产。
尽管它是一种高级技术工具,但易于理解和使用,适用于新手和经验丰富的交易者。该指标能够适应不断变化的市场条件,使其在各种情况下都具备灵活性和有效性。它提供了市场趋势的清晰视觉表现,有助于避免冲动交易。该指标可以成为您交易工具箱中宝贵的工具。
FREE

Introduction Poppsir is a trend-range indicator for metatrader 5 (for now), which distinguishes sideways phases from trend phases.
With this tool it is possible to design a trend following-, meanreversion-, as well as a breakout strategy.
This indicator does not repaint!
The signal of the Poppsir indicator is quite easy to determine. As soon as the RSI and Popsir change their respective color to gray, a breakout takes place or in other words, the sideways phase has ended.
Interpretation
FREE

[ 我的频道 ] , [ 我的产品 ]
概述
Lorentz 距离分类器是一种基于机器学习的交易指标,在近似最近邻(ANN)框架下使用 Lorentz 距离作为核心度量。它不依赖传统的欧几里得距离,而是将金融价格行为视为发生在“扭曲的”价格-时间空间中(类似于相对论中质量弯曲时空的方式)。这种方法使分类器对市场噪声、异常值以及事件驱动的扭曲(如 FOMC、地缘政治冲击等)具有更强的鲁棒性,从而能够识别欧几里得方法随时间往往无法捕捉的历史相似价格行为。
该指标在已收盘的 K 线上提供清晰的 **不重绘** 信号,并提供可直接使用的缓冲区。
为什么在交易中使用 Lorentz 距离
研究多次表明,在噪声较大的环境中应用于时间序列分类时,Lorentz 距离优于欧几里得、曼哈顿、余弦等多种常用度量。在交易中,突发新闻事件会严重扭曲正常的价格关系;Lorentz 度量能够自然地考虑这种扭曲,即使事件发生在数周或数月前,且绝对价格水平差异很大,也能将历史上相似的事件后模式拉近。
使用方法 – 快速指南
该指标高度可定制,但在 4H–12H 图表上使用默认设置即可获得非常好的效果(在更低时间周期

This indicator show Gann Swing Chart (One Bar) with multi layer wave. 1. Wave layer F1: Gann waves are drawn based on candles. SGann wave(Swing of Gann) is drawn based on Gann wave of wave layer F1. 2. Wave layer F2: Is a Gann wave drawn based on the SGann wave of wave layer F1. SGann waves are drawn based on Gann waves of wave layer F2. 3. Wave layer F3: Is a Gann wave drawn based on the SGann wave of wave layer F2. SGann waves are drawn based on Gann waves of wave layer F3. ---------Vi
FREE

RITZ – 8 Main Market Zones & Smart Candle Timer is an advanced market-timing and session-analysis indicator designed to enhance intraday trading precision. The indicator features an adaptive candle countdown timer with dynamic time format, color warnings, blinking effects, size scaling, and multi-level sound alerts to help traders anticipate candle close and critical market moments accurately. It includes a global market session panel covering 8 major trading zones worldwide , displaying real-t
FREE

Detect divergence (classic, hidden) price and all oscillator indicator include: RSI, CCI, MACD, OSMA, Stochastic, Momentum, Awesome Oscillator (AO), Accelerator Oscillator (AC), Williams Percent Range (WPR), Relative Vigor Index (RVI), Rate of Change (ROC). Confirm reversal with dochian channel for to improve signal quality. Divergence is when the price of an asset is moving in the opposite direction of a technical indicator , such as an oscillator, or is moving contrary to other data. Diverge

Trendy Stock is a price following indicator that uses Stochastic to show when the price is out of the oversold or overbought areas. The algorithm allows you to stay longer in a trend where the bulls or bears are in control. The indicator changes color immediately the price exits oversold/overbought state. In short, the downtrend [red] bars start to paint when the buying pressure decreases while the uptrend [green] bars form as the buy pressure kicks in. For MT4 version, follow :: https://www
FREE

The Kijun-Sen Envelope is a powerful trend-following indicator based on the Kijun-Sen line from the Ichimoku Kinko Hyo system. This tool creates dynamic upper and lower bands around the Kijun-Sen, forming an envelope that helps traders identify market trends, potential reversals, and overbought/oversold conditions.
Key Features: • Trend Confirmation – Helps determine whether the market is in a strong uptrend, downtrend, or ranging phase. • Support & Resistance Zones – The envelope acts as
FREE

The indicator draws daily support and resistance lines on the chart, as well as the Pivot level (reversal level).
Adapted to work in MT5
The standard timeframe for calculating support and resistance levels is D1. You can choose other timeframes according to your strategy (for example, for M1-M15, the optimal timeframe for calculations is H1)
The function for calculating support and resistance levels has been updated; in this calculation option, fibonacci levels are taken into account, respec
FREE
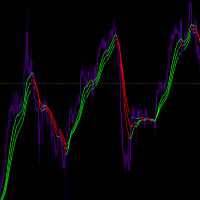
Input Parameters JawPeriod (default=9): Period for the blue line JawShift (default=0): Shift for the blue line TeethPeriod (default=7): Period for the red line TeethShift (default=0): Shift for the red line LipsPeriod (default=5): Period for the green line LipsShift (default=0): Shift for the green line Signals Bullish Conditions When price moves above all lines (all lines turn Lime) Potential buying opportunity Confirms upward momentum Bearish Conditions When price moves below all
FREE

Candle cross MA is an indicator that works "silently", that is, drawing only a moving average on the chart.
It alerts you when the last candle cross with a moving average that you set. Alert is given only when the candle closes.
The moving average settings are fully customizable.
The indicator sends popup, and push notifications. You can also deactivate alerts when the chart is inactive. Are you the trend type? Do not miss another opportunity!
FREE

The Keltner Channel is a volatility-based technical indicator composed of three separate lines. The middle line is an exponential moving average (EMA) of the price. Additional lines are placed above and below the EMA. The upper band is typically set two times the Average True Range (ATR) above the EMA, and the lower band is typically set two times the ATR below the EMA. The bands expand and contract as volatility (measured by ATR) expands and contracts. Since most price action will be encompasse
FREE

There is a science, named Quantitative Finance, that allows to study the financial derivative pricing models using the methods of theoretical and mathematical physics.
Lately I came across a paper that describes a new indicator for technical analysis that combines ideas from quantum physics and brings them to finance. I got interested in it and decided I would teach how to implement indicators based on a scientific papers in MQL5.
The original Moving Mini-Max paper [2] is written by Z.K. Silaga
FREE

This Indicator analyses the Trend and shows signals. When you open the Chart , Indicator shows you Buy or Sell Signal as Alert. Usage: Activate Algo Trading , Activate the Indicator and drag new currencies into chart. Indicator shows you Buy or Sell Signal as Alert.
Results
- Buy Signal
- Sell Signal
- No Signal For any question please don't hesitate to contact.
FREE

MTF Levels And Moving Averages is a professional indicator designed to identify key support and resistance levels across multiple timeframes. The tool helps traders locate precise entry and exit points by analyzing market structure and price action patterns. Key Features The indicator provides multi-timeframe analysis covering H1, H4, D1, and W1 periods simultaneously. It identifies supply and demand zones where price typically reacts, using color-coded visualization to distinguish between dif

Smart Risk Manager FOREX – Free On-Chart Lot Size Helper Smart Risk Manager Forex is the free & simplified edition of the Smart Risk Manager family. It helps you calculate your position size on Forex pairs using a clean drag-and-release workflow. Just drag on the chart and the indicator shows the recommended lot size based on your RiskUSD amount. It is small, fast and easy to use. Features ️ Drag-to-measure lot size directly on the chart ️ Clean & very lightweight – no panels, no clutter
FREE
Dual Time Frame RSI with Custom Alerts & Visuals Dual Time Frame RSI is an advanced RSI (Relative Strength Index) indicator designed for traders who want to monitor multiple timeframes simultaneously and customize alerts and visuals for better trading decisions. This tool allows you to combine two RSI readings from different timeframes, helping you identify stronger trends and overbought/oversold conditions across multiple time horizons. Key Features: Two Timeframes : The lower timeframe is alwa
FREE

Welcome to HiperCube VIX Discount code for 25% off at Darwinex Zero: DWZ2328770MGM This indicator provide you a real info of market of volume of sp500 / us500 Definition HiperCube VIX known as the CBOE Volatility Index, is a widely recognized measure of market fear or stress . It signals the level of uncertainty and volatility in the stock market, using the S&P 500 index as a proxy for the broad market. The VIX Index is calculated based on the prices of options contracts on the S&P 500 inde
FREE

The indicator looks for the "Fifth dimension" trade signals and marks them on the chart. A detailed description of the chart patterns that generate the trade signals can be found in Chapter 8 "The Balance Line Trades" in the book Williams' "New Trading Dimensions". Signal levels with indication of the position entry or stop loss placement price are indicated directly on the chart. This feature creates additional convenience for the trader when placing pending orders. A solid horizontal line is d
FREE
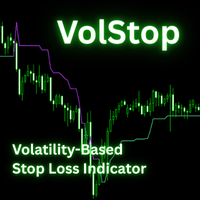
The VolStop Adaptive Volatility-Based Trailing Stop Indicator for MT5 VolStop is a precision volatility-stop indicator for MetaTrader 5, built for traders who want to stay in winning trades longer and exit with discipline. Instead of fixed pips or moving averages, VolStop dynamically tracks price action with ATR-based bands, automatically adapting to market turbulence. Key Features Adaptive Volatility Stops – Calculates a dynamic trailing stop using ATR and a user-set multiplier to match changi
FREE

Gina Dual TPO — Brief MQL5 indicator TPO + Volume profile overlaid on chart — fast, scalable, and beginner-friendly. Built for traders who read market structure by POC and Value Area. What it is An MQL5 indicator that overlays dual market profiles—Time-at-Price (TPO) and Volume-at-Price (VPO)—directly on your chart. It’s fast (pixel-based drawing), scalable, and beginner-friendly. Who it’s for Intraday and swing traders who read market structure via POC (Point of Control) and Value Area to spot
FREE

The Custom Alert Lines.mq5 Indicator is designed to create two horizontal lines on the chart that serve as levels for alerts when the price crosses them. Key Functions and Features Two Customizable Lines (L1 and L2): The indicator allows the user to set the color, style, and thickness for each of the two lines via input parameters. Crossing Alerts: The indicator monitors when the closing price of the current bar crosses the level of one of the lines. Upon crossing, a pop-up alert is generated a
FREE

1. Introduction The Market Squeeze Momentum Indicator (SQZMOM_LB) is a powerful technical analysis tool designed to help traders identify periods of low market volatility (the "squeeze" phase) and predict the direction and strength of price momentum after the squeeze ends. This indicator combines the principles of Bollinger Bands and Keltner Channels to detect changes in market volatility, along with a momentum oscillator to measure buying/selling pressure. 2. Key Components of the Indicator The
FREE

想象一下:你正处于巨额利润的边缘,但市场突然发生变化,你错过了机会。 或者更糟糕的是,你得到的是损失而不是利润。 如果你有一个可靠的盟友提前低语:"做好准备-海浪来了!"? 遇见 Harbinger,MetaTrader5 的革命性指标,专为厌倦混乱并希望预测市场变化的交易者而设计!
Harbinger 是一种智能算法,可以分析隐藏的趋势波动模式,以令人难以置信的准确性发出即将到来的回调,反转或累积的信号。 Harbinger mt4 version
如何使用Harbinger指标.
当指标 Harbinger 的信号出现在图表上时,这意味着信号之前的价格走势将被停止。 并且会有累积,回滚,或者一起回调的累积,或者趋势反转。 通常这两件事同时发生。 最主要的是要明白,如果一个信号出现,这意味着先前趋势的变化即将到来。 所有这些都让我们明白,我们需要重新考虑我们在这个工具市场上的未平仓头寸。 并采取必要的安全措施。 例如,您可以将其设置为盈亏平衡,或锁定部分利润,甚至完全锁定整个利润。
如果在指标 Harbinger 的信号出现后,市场的积累阶段已经开始,最好等待积累结束,然后
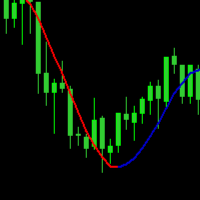
A moving average is simply a way to smooth out price fluctuations to help you distinguish between typical market “noise” and the actual trend direction . By “moving average”, we mean that you are taking the average closing price of a currency pair for the last ‘X’ number of periods. Like every technical indicator, a moving average (MA) indicator is used to help us forecast future prices.
FREE

** All Symbols x All Timeframes scan just by pressing scanner button ** *** Contact me to send you instruction and add you in "ABCD scanner group" for sharing or seeing experiences with other users. Introduction This indicator scans AB=CD retracement patterns in all charts. The ABCD is the basic foundation for all harmonic patterns and highly repetitive with a high success rate . The ABCD Scanner indicator is a scanner reversal ABCD pattern that helps you identify when the price is about to cha

Powerful trend indicator provided with all necessary for trade and it is very easy to use. Everyone has probably come across indicators or Expert Advisors that contain numerous input parameters that are difficult to understand. But here, input parameters are simple and it is no need to configure anything — neural network will do all for you.
Difference from a classic version
The real-time multi time frame panel is added, so you can check a trend for other timeframes without switching the schedu

Индикатор PivotPointSuperTrend отлично показывает данные Тренд на основе мат данных от Pivot и ATR и очень удобен для входа в сделку и выставления стопов. Если кто то сможет добавить в код мултитаймфрем, я и многие пользователи будут очень Благодарны, то есть чтобы ондикатор показывал значение старшего таймафрема на графике младшего таймфрема, Заранее Спасибо!
FREE

https://www.mql5.com/en/users/gedeegi/seller
GEN (Trend Fib Zones) GEN (Trend Fib Zones) is a professional technical analysis indicator that automatically detects trend structure shifts using swing highs/lows and dynamically plots key Fibonacci retracement and extension zones. Key Features: Automatic Trend Structure Detection Identifies market structure changes using CHoCH (Change of Character) and BOS (Break of Structure) logic. Highlights trend direction based on real swing high/low pivo
FREE

Heiken Ashi Smoothed – The Ultimate Trend Filtering Indicator for MT5 Enhance Your Trading with Smoother Trends! The Heiken Ashi Smoothed indicator is a powerful tool designed for traders who want clearer trend signals while eliminating market noise. Unlike traditional Heiken Ashi candles, this smoothed version provides fluid, lag-free price action , making it perfect for swing trading, trend following, and long-term analysis. Key Features: Crystal-Clear Trends – Filters out market noise for

The indicator shows your profit and loss (PnL) for the current day right on your trading chart. Anchored at the top-right corner, it displays "PnL: [amount]"—green if you’re up, red if you’re down, white if it’s zero. Every time you close a trade, it updates instantly, adding up your profits, commissions, and swaps from all buys and sells trades since midnight. No fuss, no extra charts—just real-time feedback on how your day’s going.
FREE
Pivot Points Indicator – a fast, reliable, and fully customizable pivot detection for MetaTrader 5. This indicator uses MetaTrader’s native iHighest and iLowest functions to identify pivot highs and lows by scanning for the highest and lowest prices within a user-defined window of bars. A pivot is confirmed only when the current bar is the absolute maximum or minimum within the selected range, ensuring accurate and timely signals based on robust built-in logic.
Key Features No Repainting : Onc
FREE

The Monthly Weekly Open Line is an indicator that plots: The current month open line that will extend till the last week on the month. Weekly lines that span the look back days period that you have set . Each line will extend from the respective weekly Monday zero GMT till friday of the respective week. Monthly and Weekly open lines can be used to build very powerfull anc consistent trading strategies. They act as natural S/R price barriers.
FREE
Build your professional trading suite for less: I believe in providing high-quality tools for the community. If you find value in this free indicator, please consider leaving a 5-star review to support my work. You can also explore my full catalog of professional EAs and specialized indicators on my profile to find the perfect 'trigger' for your strategy.
What is this indicator? This Basic Support and Resistance Indicator -Free- is designed to help traders automatically identify key market
FREE
Binary Prediction: The Ultimate Decision Support Tool for Binary Options Traders Binary Prediction is a meticulously developed indicator tailored specifically to meet the demands of Binary Options trading. It is designed to simplify complex market analysis, providing clear, reliable trading signals for both novice and experienced traders looking to enhance their decision-making process. Core Features & Advantages: Dedicated Binary Options Algorithm: The core logic is fine-tuned to capture c
FREE

MT4 version Overview The Lowess Channel indicator is a smoothed trend-following tool designed to help traders identify the direction of the trend , detect flat or ranging markets , and spot breakouts from consolidation zones. It creates a central smoothed line with upper and lower channel boundaries, adapting to market noise while maintaining clarity. How It Works The indicator builds a channel around a smoothed price line. The central line reflects the current trend. The upper and lower bounda
FREE
通过 Pip Movement Alert MT5 领先市场动能,这是一款多币种指标,专为跟踪和提醒交易者多个符号的精确点数移动而设计,适用于外汇、股票、加密货币和商品交易。在 Forex Factory 和 Reddit 的 r/Forex 等交易社区中备受赞誉,并在 Investopedia 和 TradingView 的讨论中因其检测突发市场变化的能力而受到关注,该指标是希望利用快速价格变化的交易者的必备工具。用户报告称,识别基于点数的重大移动(例如,10点增量)的可靠性高达95%,许多人指出通过利用实时警报捕捉波动性激增,交易时机提高了20-30%。主要优势包括多币种监控、可定制的点数阈值以及轻量级设计,无需持续分析图表即可简化跟踪,非常适合剥头皮、日内交易和波段交易者。 Pip Movement Alert MT5 监控用户定义的符号(默认:EURUSD、GBPUSD、USDJPY、USDCHF),并在价格移动指定点数值(默认:10点)时触发警报,检测绝对价格水平(例如,1.178500、1.178600)。它使用实时计算来识别上升或下降移动,通过弹出窗口、推送通知和电子邮件
FREE

。。。。。。。。。。。。。。。。。。。。。。。。。。。。。。。。。。。。。。。。。。。 This indicator is based on Bollinger Bands indicator. It helps user clearly know the Band is expand or contract.
The method of use is the same as the traditional Brin channel index. Users can use different color areas to distribute forest channel indicators in expansion or contraction stage. -------------------------------------------------------------------------------------------
FREE
MetaTrader市场是 出售自动交易和技术指标的最好地方。
您只需要以一个有吸引力的设计和良好的描述为MetaTrader平台开发应用程序。我们将为您解释如何在市场发布您的产品将它提供给数以百万计的MetaTrader用户。
您错过了交易机会:
- 免费交易应用程序
- 8,000+信号可供复制
- 探索金融市场的经济新闻
注册
登录