ChartBuilder MT5
- Indicators
- Version: 2.64
- Updated: 17 June 2020
- Activations: 5

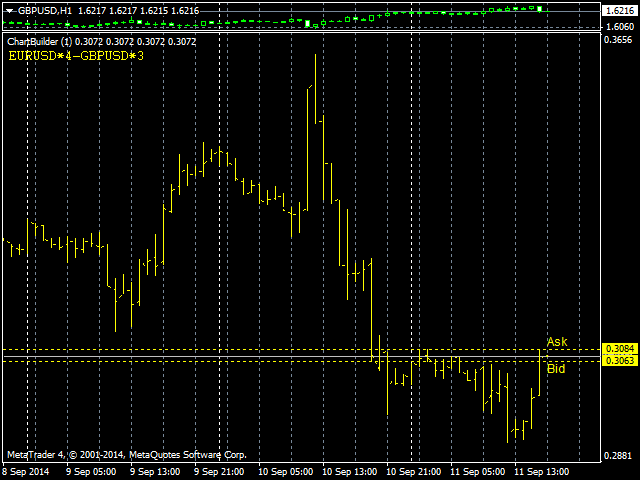
The indicator is designed for easy construction of synthetic charts based on data of various financial instruments. It will be useful both arbitrage and pair trading, as well as for analysis purposes. Its main advantage is simplicity and clarity. Each chart is given as a common mathematical formula. For example, if you want to plot the spread (difference) between EURUSD and GBPUSD with coefficients 4 and 3, then set the following formula:
EURUSD * 4 - GBPUSD * 3
The resulting chart is shown in the screenshot. But this is one of the simplest examples. Indicator allows you to draw charts of much more complex and interesting things. It also can monitor certain price levels set by the user, and generate a signal when price reaches the levels.
Please find the full description of the indicator on the Comments tab (Russian).
Indicator Parameters
- Formula1
- Formula2
- ...
- Formula12 - set formulas for each chart
- Precision - indicator precision after a decimal point
- TimeShift_minutes - time shift for all charts relative to the price scale (in minutes)
- TimeSnap_Mode - time snapping resulting values to the displayed bars of the indicator. It can be set in "bars" or in "minutes"
- TimeSnap_Size - maximum snapping size. If the time lag between the calculated bar and the actual bar exceeds this size, the bar will not be displayed on the screen. If set to -1, then there are no snapping limits
- OpenPrices_Synchronize - full synchronization of bar Open prices by time
- Draw Mode - chart drawing mode:
- LINE
- BARS
- CANDLE
- SECTION (sections between non-empty values)
- HISTOGRAM
- POINTS
- AUTO (selected automatically in accordance with the selected display mode in the main window)
- Interpolation Timeframe - the timeframe for the interpolation of intra-bar values when building synthetic bars. Default is M1
- RefreshRate_sec - chart update frequency in seconds
- Auto Scale - chart auto scale mode. Specify the number of the main chart; all other charts will be adjusted to the height of this chart
- Show Labels - choose location of names of formulas in the chart window (left or right)
- Show Bid/Ask - show synthetic Bid/Ask for each chart
- Signal_ChartNumber chart number for which signal values and signal lines are used.
- Signal_HighValue - the upper signal value, after reaching which a signal will be generated
- Signal_LowValue - the lower signal value
- Signal_HighLine - the name of the upper signal line, after reaching which a signal will be generated
- Signal_LowLine - the name of the lower signal line
- Signal_CrossCharts - chart numbers (separated by commas or spaces), when they are crossed a signal will be generated
- Signal_Pause - a pause between repetitions of the same signal (in seconds)
- Save_ChartNumber - the number of the chart, the values of which should be saved to a text file
- Save_FileName - the name of the text file to save chart values
- Save_FileDelimiter - text separator used in the file. If nothing is specified, the tab character will be used.