YouTube'dan Mağaza ile ilgili eğitici videoları izleyin
Bir alım-satım robotu veya gösterge nasıl satın alınır?
Uzman Danışmanınızı
sanal sunucuda çalıştırın
sanal sunucuda çalıştırın
Satın almadan önce göstergeyi/alım-satım robotunu test edin
Mağazada kazanç sağlamak ister misiniz?
Satış için bir ürün nasıl sunulur?
MetaTrader 5 için teknik göstergeler - 29
VWAP Makine Öğrenimi Bantları: Yatırımcıları İçin Tahminsel Avantaj Piyasa analizinde bir üst seviyeye geçmek için VWAP Makine Öğrenimi Bantlarını keşfedin – piyasa eğilimleri, dinamik destek/direnç bölgeleri ve yüksek olasılıklı işlem sinyalleri hakkında eşsiz içgörüler sağlamak üzere tasarlanmış yenilikçi bir MQL5 göstergesi. Hacim Ağırlıklı Ortalama Fiyat (VWAP) gücüyle entegre edilmiş tescilli uyarlanabilir makine öğrenimi algoritmasından yararlanan bu gösterge, geleneksel analizin ötesine g

Simple Horizontal Bollinger Bands with Squeeze Alert (HLINE BB Pro) Description This indicator draws horizontal Bollinger Band lines (Upper, Middle, and Lower) directly on the chart and updates them dynamically in real-time.
It provides a clear visual representation of market volatility, and helps traders easily identify potential breakout zones when the market transitions from low volatility (squeeze) to high volatility (expansion). The indicator is designed to be lightweight , visually simple
FREE

Smart Risk Manager FOREX – Free On-Chart Lot Size Helper Smart Risk Manager Forex is the free & simplified edition of the Smart Risk Manager family. It helps you calculate your position size on Forex pairs using a clean drag-and-release workflow. Just drag on the chart and the indicator shows the recommended lot size based on your RiskUSD amount. It is small, fast and easy to use. Features ️ Drag-to-measure lot size directly on the chart ️ Clean & very lightweight – no panels, no clutter
FREE

The Martinware Manual Trading Helper indicator is aimed at helping people start their lives in manual trading. It can be used to display both some generic images at the right side of the graph, where custom operational remarks may be displayed or just a blank rectangle hiding the chart while backtesting. Moreover, it can periodically play a list of sounds. To show a blank rectangle, let the first image name input field empty and select the desired color. To show one or more custom images inste
FREE

HTF Vision - Higher Timeframe Candle Display Free now, celebrating release of Live Chart Viewer utility https://www.mql5.com/en/market/product/158488
HTF Vision provides traders with an intuitive way to visualize higher timeframe price action directly on their current chart. This powerful indicator overlays candlestick data from selected higher timeframes (H1, H4, or Daily) as customizable boxes, giving you instant context of larger market movements without switching charts. Key Features: Mult
FREE

。。。。。。。。。。。。。。。。。。。。。。。。。。。。。。。。。。。。。。。。。。。 This indicator is based on Bollinger Bands indicator. It helps user clearly know the Band is expand or contract.
The method of use is the same as the traditional Brin channel index. Users can use different color areas to distribute forest channel indicators in expansion or contraction stage. -------------------------------------------------------------------------------------------
FREE
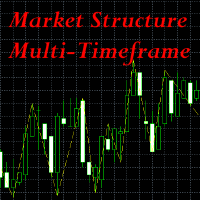
This indicator is extremely useful for traders who want to keep an eye on the market structure without wasting time drawing it manually. It also adds an important optional feature, which is MTF (Multi-Timeframe) analysis . Multi-Timeframe (MTF) analysis is a trading technique that consists of analysing the same financial instrument on different time intervals (charts) simultaneously, in order to gain a more complete view of the market. Starting with the analysis of higher timeframe charts to i
FREE

INTRODUCTION : The breakout strength meter is a trading tool that is used to identify which currencies are the strongest to breakout, and which currencies are the weakest to breakout. The settings for the indicator are easy, and if you cannot find the settings, please leave a comment The tools are completely free to use Please, if you like the indicator, please leave a comment and rate the indicator in order to develop it
FREE

**Experience Smarter Trading with FVG Super Signal**
Unlock simpler, more decisive trading with **FVG Super Signal**, an advanced MT5 indicator from the WinWiFi Robot Series. This powerful tool uniquely combines the Fair Value Gap (FVG) technique with robust trend-following logic.
* **Clear Signals:** Delivers intuitive Buy/Sell alerts, simplifying your trading decisions. * **Universal Compatibility:** Works seamlessly across all assets and timeframes. * **Highly Versatile:** Ideal for all tr
FREE

Mouse Calculation, farenin işaret ettiği fiyat seviyesinde kapatırsanız her bir emrin kâr/zararını hızlıca hesaplar. Grid, martingale ve kademeli giriş gibi çoklu emir yönetiminde hızlı karar vermek için idealdir. Break-even ve hedef fiyat seviyeleri bir bakışta. Temel Özellikler Mouse PnL (M) : Emir bazında ve toplam P/L önizlemesi (swap dahil). Break even Price (B) : Sepetin break-even fiyatını / break-even çizgisini gösterir. Time_Sync_Lines (T) : Son N günün aynı saatini hizalayarak karşılaş
FREE

Algoritma, Para Birimi Güç Ölçer göstergesi fikrine dayanmaktadır. Bu versiyonda, görüntülenen değerlerin sayısı sınırsızdır, kodu daha kompakt ve hızlıdır, mevcut çubuğun değerleri gösterge tamponları aracılığıyla elde edilebilir. Göstergenin gösterdiği şey : ince bir bant ve para biriminin önündeki üst sayı, son N saat için bağıl güç endeksini gösterir (N, 'Saat' değişkenindeki parametrelerde ayarlanır), daha geniş bir bant günlük endeksi gösterir. Giriş parametrelerinde bu para birimini ne
FREE

Bu gösterge, temiz ve doğru sinyalleri tercih eden traderlar için tasarlanmış, basit ama son derece güvenilir bir trend yönü tahmin aracıdır. Ana Özellikler Trend tahmin okları – fiyat hareketine göre Buy/Sell sinyalleri. Az ama yüksek doğrulukta sinyal – genelde günde 1 sinyal. Exit sinyalleri – en uygun kapanış zamanı için Exit okları. Repaint yok – oklar asla değişmez. Buffer desteği – özel araçlar veya EA için uygun. Uyarılar dahil – popup, ses ve push bildirimleri. Ayarlanabilir ok boyutu –

This is a usefull utility for monitoring spread and also for recording informations to a file. (Files will be placed into "Common\Files\Spread Monitor"). There is the possibility to let the indicator calculate high/low into the past thanks to downloading ticks. (It's a slow and approsimate thing! The best way to use it is to attach to a chart and let it recording spread in real time). There is also a buffer with the average of spread in latest X periods.
Easy and effective.
FREE

Burning Scalper - Advanced MFI Trading System
Indicator Description
Burning Scalper is a comprehensive trading system based on an enhanced Money Flow Index (MFI) indicator, designed for precise identification of market entry and exit points. The indicator combines volume and price analysis, providing traders with a complete picture of market dynamics.
Key Features
Intelligent Trading Signals
The indicator automatically identifies optimal market entry points by analyzing extre
FREE

Highly configurable Adx indicator.
Features: Highly customizable alert functions (at levels, crosses, direction changes via email, push, sound, popup) Multi timeframe ability Color customization (at levels, crosses, direction changes) Linear interpolation and histogram mode options Works on strategy tester in multi timeframe mode (at weekend without ticks also) Adjustable Levels Parameters:
ADX Timeframe: You can set the lower/higher timeframes for Adx. ADX Bar Shift: you can set the of
FREE

This indicator shows current major support and resistance, if one exists. And as a support or resistance is broken it shows the new current, if any. To identify support and resistance points it uses the high and low points identified on the current chart. Allows too you to inform the maximum number of bars used to consider a support or resistance point still valid.
FREE

Free version of the TickScalper indicator. The Tick Scalp indicator is a trading assistant for a scalping trader. Works in a separate window. Tracks the momentary activity of the market, shows the graph of the movement of ticks and the strength of bulls or bears. Sometimes it can anticipate the beginning of a strong movement before any other indicators. Helps the trader to make a decision to open the desired order. Designed to work on any instrument. Used timeframes from M1 to M15. Has simple a
FREE

Moving Average Convergence/Divergence — схождение/расхождение скользящих средних — технический индикатор, разработанный Джеральдом Аппелем (Gerald Appel), используемый в техническом анализе для проверки силы и направления тренда, а также определения разворотных точек. Встроенный в MetaTrader 5 индикатор MACD не соответствует задумке автора (Gerald Appel):
-линия MACD графически изображена в виде гистограммы, однако гистограммой отражается разница между линией MACD и сигнальной линией;
-сигнальн
FREE

In the world of finance, correlation is a statistical measure of how two securities move in relation to each other. Correlations are used in advanced portfolio management. This indicator measures how different securities move in relation to a reference one, thus making portfolio management easier. [ Installation Guide | Update Guide | Troubleshooting | FAQ | All Products ] Avoid concurrent trades in highly correlated instruments Find trading opportunities among highly correlated instruments Cor
FREE

VeMAs, hacim dinamiklerini ve piyasa yapısını analiz ederek ticaret stratejinizi geliştirmek için tasarlanmış yenilikçi bir ticaret aracıdır. İster yeni başlayan ister deneyimli bir tüccar olun, VeMAs size avantaj sağlar. VeMAs göstergesi sadece 50 $ karşılığında temin edilebilir. Göstergenin orijinal fiyatı 299 dolardır
SINIRLI SÜRELI TEKLIF. Kişiselleştirilmiş bir bonus için satın aldıktan sonra benimle iletişime geçin! Harika bir yardımcı program (VeMAs Utility MTF) tamamen ücretsiz alabilirs

The MP Andean Oscillator is used to estimate the direction and also the degree of variations of trends. It contains 3 components: Bull component, Bear component and Signal component. A rising Bull component indicates that the market is up-trending while a rising Bear component indicates the presence of down-trending market. Settings: Oscillator period: Specifies the importance of the trends degree of variations measured by the indicator. Signal line per: Moving average period of the Signal line
FREE
VWAP (Volume Weighted Average Price) is a technical analysis indicator that shows the average price of an asset, weighted by trading volume, over a specified time period. It is calculated by dividing the total dollar value traded (price × volume) by the total volume. Formula: VWAP = sum(PRICE*VOLUME)/sum(VOLUME)
MM vwap have 4 options to set anchor:
Month Week Day Session Indicator will be updated in future.
FREE

This Supertrend strategy will allow you to enter a long or short from a supertrend trend change. Both ATR period and ATR multiplier are adjustable. If you check off "Change ATR Calculation Method" it will base the calculation off the S MA and give you slightly different results, which may work better depending on the asset. Be sure to enter slippage and commission into the properties to give you realistic results. If you want automatic trade with Supertrend indicator, please buy following pr
FREE

This indicator extracts a trend from a price series and forecasts its further development. Algorithm is based on modern technique of Singular Spectral Analysis ( SSA ). SSA is used for extracting the main components (trend, seasonal and wave fluctuations), smoothing and eliminating noise. It does not require the series to be stationary, as well as the information on presence of periodic components and their periods. It can be applied both for trend and for another indicators.
Features of the me
FREE

If you like this product, please give it a 5 star rating as a token of appreciation.
This indicator calculates and draws pivot points and support/resistance levels for both daily and weekly timeframes: Pivot (central) level Support levels S1, S2, S3 Resistance levels R1, R2, R3 It allows showing daily, weekly, or both sets of pivots , giving traders visual references for potential support/resistance areas.
Pivot mode: Choose which pivots to display (weekly, daily, or both). Colors and style: C
FREE

The indicator looks for the "Fifth dimension" trade signals and marks them on the chart. A detailed description of the chart patterns that generate the trade signals can be found in Chapter 8 "The Balance Line Trades" in the book Williams' "New Trading Dimensions". Signal levels with indication of the position entry or stop loss placement price are indicated directly on the chart. This feature creates additional convenience for the trader when placing pending orders. A solid horizontal line is d
FREE
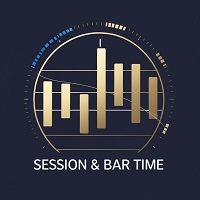
The Sessions and Bar Time indicator is a professional utility tool designed to enhance your trading awareness and timing precision on any chart. It combines two key features every trader needs — market session visualization and real-time bar countdown — in one clean, efficient display. Key Features: Candle Countdown Timer – Shows the remaining time before the current candle closes, helping you anticipate new bar formations. Market Session Display – Automatically highlights the four main trading
FREE

Session Range Lite is a free indicator for MetaTrader 5 (MT5) designed to automatically plot the Asian trading session High and Low on the chart. The indicator highlights the Asian session range and key price levels that are commonly used for breakout trading, retests, and intraday market structure analysis. Key features: Automatic calculation of Asian Session High and Low Clear session range visualization Horizontal High / Low levels Price labels with exact level values Stable behavior when scr
FREE

In which direction should I trade today? For “TREND followers”, we need to determine the TREND . This indicator determines the Trend based on the price High, Low and Close of every bar, for a given period and timeframe. Calculating and plotting the Trend UP and Trend DOWN lines. If the: “Trend UP” line (Green) is above the “Trend DOWN” line (Red), then it is a BULLISH Trend (see "Screenshots" tab). “Trend DOWN” line (Red) is above the “Trend UP” line (Green), then it is a BEARISH Trend (see "
FREE

Highly configurable RSI indicator. Features: Highly customizable alert functions (at levels, crosses, direction changes via email, push, sound, popup) Multi timeframe ability Color customization (at levels, crosses, direction changes) Linear interpolation and histogram mode options Works on strategy tester in multi timeframe mode (at weekend without ticks also) Adjustable Levels Parameters:
RSI Timeframe: You can set the current or a higher timeframes for RSI. RSI Bar Shift: you can set the
FREE
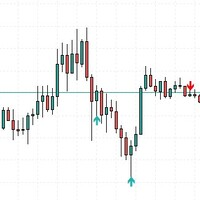
This indicator was creating a perfect structure to not re-paint or recalculate, all signals are accurate. I can create a robotic version of this indicator but I need more precision in the signals. So appreciate this work.
Tips to use when trading, do not buy at the top or sell at the bottom, always buy at the bottom and sell at the top. Risk 1 to 3.
In the settings you can adjust the size of the shadow or trail of the candle, you can change the colors and sizes of the arrows.
FREE

The Keltner Channel is a volatility-based technical indicator composed of three separate lines. The middle line is an exponential moving average (EMA) of the price. Additional lines are placed above and below the EMA. The upper band is typically set two times the Average True Range (ATR) above the EMA, and the lower band is typically set two times the ATR below the EMA. The bands expand and contract as volatility (measured by ATR) expands and contracts. Since most price action will be encompasse
FREE
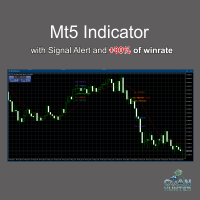
FREE VERSION FOR GOLD (XAUUSD) AND BTCUSD Dont forget to rate after use this indicator, Thanks.
Features: Clear Buy/Sell labels with directional arrows. Automatic Take Profit (TP) & Stop Loss (SL) labels for better risk management. Easy-to-read chart signals (no messy lines). Works on any timeframe and any asset (Forex, Gold, Indices, Crypto, Stocks). Compatible with MetaTrader 5 (MT5 desktop & mobile sync) . Perfect for: Beginner traders who need straightforward sign
FREE

VM SuperAshi Trend Precision Trend Sniper using Smoothed Heiken Ashi, Supertrend and EMA Trend
Optimized for M1–M5 Scalping
Overview VM SuperAshi Trend is an indicator that combines a standardized Supertrend with smoothed Heiken-Ashi candles to deliver clear, confirmed, and non-repainting buy/sell signals directly on the chart. It automatically draws Buy/Sell arrows, displays Fast, Slow, and Trend EMA lines, and provides Popup, Email, and Push notifications.
Key Features Supertrend-based signal

Core Purpose A permanent crosshair indicator designed exclusively for MetaTrader 5 (MT5). It addresses key limitations of MT5's default crosshair, including the need for manual activation, automatic disappearance on click, and solid lines obscuring price bars. This indicator optimizes chart analysis by delivering a smooth, professional-grade crosshair experience on MT5. Key Features Automatic activation: Enabled immediately after loading, replacing the default Ctrl+F function. The crossha
FREE
Engulfing Pattern is a free indicator available for MT4/MT5 platforms, its work is to provide "alerts" when a "Bullish" or "Bearish engulfing pattern forms on the timeframe. This indicator comes with alerts options mentioned in the parameter section below. Join our MQL5 group , where we share important news and updates. You are also welcome to join our private channel as well, contact me for the private link. Engulfing Pattern Indicator MT4 Other Products Try our Martini EA with 2 years of liv
FREE
Build your professional trading suite for less: I believe in providing high-quality tools for the community. If you find value in this free indicator, please consider leaving a 5-star review to support my work. You can also explore my full catalog of professional EAs and specialized indicators on my profile to find the perfect 'trigger' for your strategy.
What is this indicator? This Basic Support and Resistance Indicator -Free- is designed to help traders automatically identify key market
FREE
Identify trending and flat markets effortlessly
This indicator calculates how much has a symbol moved in relative terms to find trending or flat markets. It displays what percentage of the latest price range is directional. It can be used to avoid trading in flat markets, or to find flat markets to execute range-bound trading strategies. [ Installation Guide | Update Guide | Troubleshooting | FAQ | All Products ] A value of zero means the market is absolutely flat A value of 100 means the marke
FREE

PipVenom - Advanced ATR Trailing Stop Signal Indicator for MT5 Professional Visual Trading System with Real-Time Dashboard OVERVIEW PipVenom is a sophisticated visual trading indicator designed for MT5 that combines ATR Trailing Stop methodology with EMA crossover signals to identify high-probability trade entries. Built with precision and clarity in mind, this indicator provides crystal-clear visual signals with automatic Stop Loss and Take Profit levels displayed directly on your chart. P
FREE

Introduction Poppsir is a trend-range indicator for metatrader 5 (for now), which distinguishes sideways phases from trend phases.
With this tool it is possible to design a trend following-, meanreversion-, as well as a breakout strategy.
This indicator does not repaint!
The signal of the Poppsir indicator is quite easy to determine. As soon as the RSI and Popsir change their respective color to gray, a breakout takes place or in other words, the sideways phase has ended.
Interpretation
FREE

Gina Dual TPO — Brief MQL5 indicator TPO + Volume profile overlaid on chart — fast, scalable, and beginner-friendly. Built for traders who read market structure by POC and Value Area. What it is An MQL5 indicator that overlays dual market profiles—Time-at-Price (TPO) and Volume-at-Price (VPO)—directly on your chart. It’s fast (pixel-based drawing), scalable, and beginner-friendly. Who it’s for Intraday and swing traders who read market structure via POC (Point of Control) and Value Area to spot
FREE
The Vix_Fix indicator, or "Vix Fix," is a tool designed to identify potential market bottoms. It operates on the principle of measuring extreme fear or pessimism among the crowd, which are moments when the market often has a high probability of reversing to the upside. Main Purpose: To help traders find high-probability BUY (Long) entry points by identifying when the market is "oversold." How it Works In simple terms, the Vix Fix measures the distance between the current bar's Low and the Highes
FREE
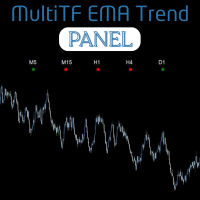
The MultiTF EMA Trend Panel is a clean, lightweight, and visually intuitive indicator designed to help traders quickly assess trend direction across multiple timeframes — all in one glance. It compares the relationship between two exponential moving averages (EMAs), typically the 50 EMA vs 200 EMA , across popular timeframes such as M5, M15, H1, H4, and D1 . You can customize the EMA settings and colors to match your own strategy or visual preferences. Key Features Multi-timeframe trend comparis
FREE

AlphaWave Göstergesi ile İşlemlerinizin Potansiyelini Serbest Bırakın! İşlemlerinize Huzur Katın: AlphaWave Göstergesi, grafikleri yumuşatarak ve trendin yönünü hassas bir şekilde okuyarak işlemlerinize huzur katmak için tasarlanmıştır. Net işlem kararları vermek hiç bu kadar kolay olmamıştı. 10 Modlu Devrim Niteliğinde Bir Düzeltme Teknolojisi: AlphaWave Göstergesi ile grafiklerin düzgün ve net bir şekilde görüntülenmesini keşfedin. Devrim niteliğindeki düzeltme teknolojisi, sadece bir değil, t

Ukeita Spike detector for All Gain and Pain Indices
Ukeita Spike Detector is a trend-sensitive indicator specially designed for Gain and Pain Indices
Gain and Pain synthetic indices are available 24/7 on Weltrade , similar to synthetic indices (Boom and Crash) offered by Deriv Broker .
This powerful tool helps detect incoming spike for Gain and Pain indices with high accuracy, making it a great addition to any strategy aimed at trading spikes safely.
Features
1) Detects incoming spikes f

A useful and convenient tool for traders when analyzing and making decisions.
Peculiarity
The main feature of this indicator is its fast algorithm . The gain in the speed of calculating the polynomial and its value of the standard deviation in comparison with classical algorithms reaches several thousand times. Also, this indicator includes a Strategy Tester with a clear visualization of transactions, an equity chart and simultaneous calculation and display of the following data in the form of
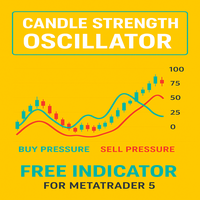
Candle Pressure Index (CPI) is a powerful yet easy-to-use indicator designed to reveal the hidden buying and selling pressure behind every candle. Instead of simply showing whether the price moved up or down, CPI digs deeper into how strongly buyers or sellers controlled the market within each candle. This makes it a unique tool for identifying trend strength, spotting reversals early, and confirming entry or exit points with higher accuracy.
Unlike traditional oscillators that only react to p
FREE

Purpose and functions of the indicator The indicator determines and marks the moments of trend change on the chart based on the theory of fractal levels breakout on any of the analyzed timeframes. If a breakout based on all rules is valid, a horizontal line with corresponding color will appear on the chart. If there is an uptrend, the line will be blue. In the descending trend, the line will be red. The blue line is a strong support level, the trader should look for buying opportunities above th
FREE

KMeans Price Zones Detector ile ticaretin geleceğine hoş geldiniz. Bu yenilikçi MetaTrader göstergesi, makine öğreniminin gücünü kullanarak önemli fiyat bölgelerini belirler. Bu araç, fiyat verilerinde dinamik olarak merkez noktaları tespit etmek için KMeans kümeleme algoritmasını kullanır ve fiyatların destek, direnç veya konsolidasyonla karşılaşma olasılığının yüksek olduğu alanları vurgular. Yenilikçi KMeans Algoritması KMeans Price Zones Detector, desen tanımada verimliliği ve doğruluğuyla b
FREE
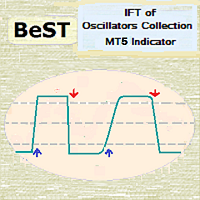
BeST_IFT of Oscillators Collection is a Composite MT4/5 Indicator that is based on the IFT ( Inverse Fisher Transformation ) applied to RSI , CCI , Stochastic and DeMarker Oscillators in order to find the best Entry and Exit points while using these Oscillators in our trading. The IFT was first used by John Ehlers to help clearly define the trigger points while using for this any common Oscillator ( TASC – May 2004 ). All Buy and Sell Signals are derived by the Indicator’s crossings of the Bu

The VWAP Level indicator is a technical analysis tool that calculates the weighted average price for the traded volumes of a specific asset. The VWAP provides traders and investors with the average price of an asset over a specific time frame.
It is commonly used by investors to compare data on "passive" trading operations, such as pension funds and mutual funds, but also by traders who want to check if an asset has been bought or sold at a good market price.
To calculate the VWAP level we us
FREE

A stochastic oscillator is a momentum indicator comparing a particular closing price of a security to a range of its prices over a certain period of time. The sensitivity of the oscillator to market movements is reducible by adjusting that time period or by taking a moving average of the result. It is used to generate overbought and oversold trading signals, utilizing a 0-100 bounded range of values. This indicator show 8 stochastic on one chart.
FREE

Value Chart indicator presents the Price evolution in a new form. This indicator, Price Momentum , was developed taking all the calculations presented in the book " Dynamic Trading Indicators " by Mark W. Helweg and David Stendahl (2002). The technique involves de-trended Prices from a user-defined Period of analysis and the addition of a Volatility index correction. The result is an Oscillator with 3 zones: Fair Price Value, Overbought/Oversold and Extremely Overbought/Oversold zones. Adding th
FREE

The "Standardize" indicator is a technical analysis tool designed to standardize and smooth price or volume data to highlight significant patterns and reduce market noise, making it easier to interpret and analyze.
Description & Functionality: Standardization : The indicator standardizes price or volume values by subtracting the mean and dividing by the standard deviation. This converts the data into a distribution with zero mean and standard deviation of one, allowing different data sets t
FREE

Logic Trade Solution Indicator (Standalone)
Idea by Suresh Dhuraisami | Code by Rafilathif Description The Logical Trading System (LTS) is a powerful multi-timeframe indicator for MetaTrader 5, designed around the concept of Valid Reversal Zones (VRZ). It generates precise trading signals and delivers comprehensive alerts, ideal for traders who value structured price action and zone-based strategies. Key Features VRZ Zone Detection: Identifies high-probability reversal zones using swing hig
FREE
Bu gösterge, TradingView'deki "ATR Based Trendlines - JD" by Duyck göstergesinin MetaTrader 5'e uyarlanmış versiyonudur. Çalışma Prensibi:
Bu gösterge, yalnızca fiyata değil aynı zamanda ATR tarafından algılanan volatiliteye dayalı olarak otomatik ve sürekli trend çizgileri çizer. Böylece trend çizgilerinin açısı, ATR'nin (belirli bir yüzdesi) tarafından belirlenir. Trend çizgilerinin açısı, pivot noktasının tespit edildiği andaki ATR'nin belirlediği fiyat değişimlerini takip eder. ATR yüzdesi,
FREE

Hız için biraz değişti. ilgilenen yeni bir danışman için test ediciler gereklidir, bana e-posta ile yazın 777basil@mail.ru
https://backoffice.aurum.foundation/u/DHXP1U
Gösterge, geçmişteki fiyat değişikliklerine göre hesaplanır ve matematiksel olarak hesaplanır, veriler her tekrar alındığında yeniden hesaplanır. Farklı zaman dilimlerinde kullanılabilir. Göstergenin sınırlarından% 70 oranında fiyat hareketi veya konsolidasyon yönünde bir değişiklik var. Bu şekilde, tekneyi trendde ve kanalın
FREE

Have you ever wondered which currency is the strongest at any particular time? Or which currency pair is trending the most. Well, the currency strength meter helps with just that. It compares USD , EUR , AUD , CHF , GBP , CAD and NZD depending on the timeline you have chosen in settings, and ranks them on the number of pips each has moved compared to the rest. N/B: All currency charts of the above pairs must have loaded. You can do this by highlighting all major and minor currencies in
FREE
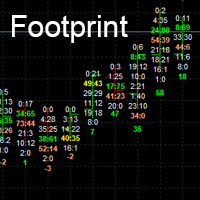
Footprint charts can add a level of depth to your visuals that standard charts cannot achieve.
Footprint charts are a powerful way to visualize the ups and downs of the market, helping you potentially to make better trading decisions. Orderflow Footprint in MT5. show # of market orders at each tick.
Inputs
Point Scale *1 to *10000
Number of candle to show. Font Size Max Bid Color (Top Seller) Max Ask Color (Top Buyer) Max Bid and Ask Color
Normal color

1. Overview Thank you for choosing the SuperTrend Suite for MT5. This package provides a set of powerful tools for trend analysis, designed to integrate seamlessly into your MetaTrader 5 platform. This suite includes two components: SuperTrend Indicator : A robust trend-following indicator that displays the current market trend directly on your chart, complete with entry signals and alerts. SuperTrend Screener EA : A multi-symbol dashboard that scans a user-defined list of instruments in the bac
FREE

MonsterDash Harmonics Indicator is a harmonic pattern dashboard. It recognizes all major patterns. MonsterDash is a dashboard that displays all detected patterns for all symbols and (almost) all timeframes in sortable and scrollable format. Users can add their own user defined patterns . MonsterDash can open and update charts with the pattern found.
Settings MonsterDash's default settings are good enough most of the time. Feel free to fine tune them to your needs. The color settings are for tho

The traditional Money Flow Index indicator, this time, EA friendly . There are 3 buffers exposed that can be used by EAs to automatically analyze the Overbought and Oversold conditions of the quote. Just use the traditional iCustom() function to get these signals. This Money Flow Index calculation is based on the traditional Metaquote's MFI indicator.
SETTINGS
MFI Period Volume type to analyze (Real Volume or Ticks) Starting Overbought region Starting Oversold region
USING WITH EAs
Buffer #0:
FREE

My other indicators https://www.mql5.com/en/market/product/156702 https://www.mql5.com/en/market/product/153968 (FREE) https://www.mql5.com/en/market/product/153960 (FREE)
MyFXRoom Vortex – Equal Highs & Lows Detector Recommended Settings Bars Between Touches: 6 Level Tolerance: 10
(A balanced starting point for most pairs/timeframes — adjust to match volatility and how you define “equal highs/lows.”) What it does
MyFXRoom Vortex automatically detects, validates, and draws Equal Highs and E
FREE
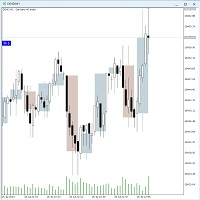
The Twotimeframe-Candles (RFrame) - Indicator for MT5 shows the candles of an higher, timeframe as an overlay on the current timeframe. You can choose the number of candles and color of the overlays. The indicator calculates the candle evevery tick. If you like the indicator, please left a comment. Version 1.1: The second time frame can now be set.
Keywords:
Candlestick, Multitimefram, Two Timeframes,
FREE
RSI Bollinger DualStrike Signals offers a clear and structured approach to identifying areas that may be favorable for potential trend reversals. By combining the RSI with Bollinger Bands, the indicator highlights moments when price shows signs of pressure or loss of momentum. The BUY/SELL signals help traders make more organized and disciplined decisions. It is a useful tool for scalping, day trading, or swing trading not to predict the market, but to improve the reading and understanding of pr
FREE

The Spider ZIGZAG is an algorithm to determine how critical the current peak is by spreading several lines with different parameters instead of one line between each 2 peaks. 1. The more zigzag's lines meet at a peak the higher probability the market will go for correction or change direction. 2. Usually when 3-4 zigzag's lines meet at a peak, the market enters a correction period, this don't happen instantly, it might take some time. 3. Usually when 5-6 zigzag's lines meet at a peak, th
FREE

Seeing and interpreting a sequence of Candlesticks is easy to spot when you are a human... Higher Highs, Higher Lows, are the panorama of a Buying trend, at least in a short period of time... Seeing a current candlestick higher high and a lower candlestick low, as a human, you can immediately spot a "divergence", an "alert", a "starting range", but in the end and based on other analysis a human trader can understand and behave accordingly to this kind of candlestick data... But what about EAs (r
FREE

Volatility Break Signals Description:
The Volatility Break Signals is an indicator designed to detect potential trend changes while partially filtering market noise. It uses an adaptive volatility measure based on the selected price (Close, Open, High, Low, etc.) and generates Buy and Sell signals when the price shows a reversal relative to the previous direction. How it works: Price Volatility Measurement The indicator calculates the absolute price changes from bar to bar ( |price - previous
FREE

MACD with 4-Color Histogram Overview MACD with 4-Color Histogram is a modern upgrade of the classic MACD indicator — redesigned for clarity, precision, and visual power .
It provides instant insight into market momentum , signal strength , and trend reversals using four distinct color zones that make trading decisions faster and more confident. Color Logic Color Condition Interpretation Green MACD > 0, Signal < MACD Bullish momentum strengthening Orange MACD > 0, Signal > MACD Bul
FREE

Bu projeyi seviyorsanız, 5 yıldız incelemesi bırakın. Kurumsal ticaret büyük hacimler olarak, onlar için nadir değildir
pozisyonlarını belirli oran seviyelerinde savunur. Bu seviyeler, kullanabileceğiniz doğal bir destek ve direniş olarak hizmet
edecektir
Ya bir ticarete girmek ya da pozisyonunuza karşı olası tehlikelerin farkında
olmak. Bu osilatör size yüzde varyasyonu gösterecektir: Gün. Hafta. Ay. Mahallesi. Yıl. Destek ve direnişlerinizi takip ettiğiniz bir subwindow'da.
FREE
MetaTrader mağazası, alım-satım robotları ve teknik göstergelerin benzersiz bir deposudur.
Yatırımcılara sunduğumuz benzersiz hizmetler hakkında daha fazla bilgi edinmek için MQL5.community - Kullanıcı notunu okuyun: alım-satım sinyallerini kopyalama, freelancerlar tarafından geliştirilen özel uygulamalar, ödeme sistemi aracılığıyla otomatik ödemeler ve MQL5 Bulut Ağı.
Alım-satım fırsatlarını kaçırıyorsunuz:
- Ücretsiz alım-satım uygulamaları
- İşlem kopyalama için 8.000'den fazla sinyal
- Finansal piyasaları keşfetmek için ekonomik haberler
Kayıt
Giriş yap
Gizlilik ve Veri Koruma Politikasını ve MQL5.com Kullanım Şartlarını kabul edersiniz
Hesabınız yoksa, lütfen kaydolun
MQL5.com web sitesine giriş yapmak için çerezlerin kullanımına izin vermelisiniz.
Lütfen tarayıcınızda gerekli ayarı etkinleştirin, aksi takdirde giriş yapamazsınız.