Watch the Market tutorial videos on YouTube
How to buy а trading robot or an indicator
Run your EA on
virtual hosting
virtual hosting
Test аn indicator/trading robot before buying
Want to earn in the Market?
How to present a product for a sell-through
Expert Advisors and Indicators for MetaTrader 4 - 67

What is a tool ? This indicator use for comparison of 8 major currency from 28 pairs and multiple timeframes and calculates a score of strength from 0-100. How to use Place the indicator on any pair any timeframe, And entering only the value of X Y position to be displayed in the graph. Pair : Any Timeframe : Any Input Parameter Start X Position : Value of X on chart Start Y Position : Value of Y on chart Visit my products Target Profit Magic Target Profit All The Profit Tracker Currency
FREE

Export Order History Free ! Meta Trader 4 script Please leave a review about this product to help other users benefit from it. Export trades history into a CSV file ( Excel sheet ) The summary is saved into a file in MQL4\Files folder. Choose / A ccount history / C ustom period from your MT4 Select period Click OK to Export file directory Open MT4 data folder CSV file ( Excel sheet ) Order > Open time > Close time > Type > Symbol > Size > Entry price > Exit price > T/P >
FREE

Discover our brand new trading robot, IT Fractals EA , a revolution in the world of automated trading. Our EA pushes the boundaries by utilizing the fractals indicator for exceptional performance.
Key Features :
Fractals Strategy : IT Fractals EA stands out by adopting an innovative strategy based on the fractals indicator. This clever approach allows you to pinpoint market reversal points with precision, thus identifying optimal trading opportunities. Advanced Management : Our EA comes equip
FREE

This script permits to delete the pending orders or close the market positions on platform. Very simple to use. Upload the script on the chart and the script will done the work for you following the input values.
An utility to manage very quickly your trading.
Input Values TypeOrders Only BUY (delete or close only BUY) Only SELL (delete or close only SELL) BUY and SELL (delete or close ALL) Type Positions (close only market orders) Only STOP (delete STOP pending orders) Only LIMIT (delete LIMIT
FREE
06/30/23 v1.1 New features.
Read before operate. Remarkable configurations: 1) "No close order", "Auto-Hedging" FALSE, "Close all" FALSE : You can transform this EA in a assistant that simply open orders. After you will be the mind of the operativity. Warning : find a good setting of "Pause in minute" and "Max alert" to delay the operativity and filter the wrong signals. These last parameters can change by market condition and asset.
2) "Breakeven and WPR inversion", "Auto-Hedging" FALSE, "Clo
FREE
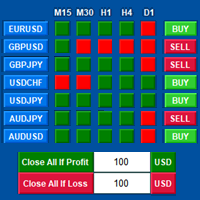
Tools designed for multi-currency trading.
You can customize which currency you want to trade, analyze up to 10 currencies by yourself. Note: This is demo version that you can test for free (Maximum Lot Size = 0.01) Full version can be found here: https://www.mql5.com/en/market/product/17793
Analysis method. (Refer to screenshot 1) Ultimate dashboard analyzes trend strength from six major time frames: M5, M15, M30, H1, H4, D1 Show the result in graphic format. You can identify which currencies
FREE

The GJ_H1_220100009_S_HD_CF_SQX_SL20 is an algorithmic trading strategy for MetaTrader, tested on GBPJPY using the H1 timeframe from April 1, 2004, to April 24, 2024. There is no need to set up parameters, all settings are already optimized and fine-tuned.
Recommended broker RoboForex because of EET timezone.
You can find the strategy source code for StrategyQuant at the link: https://quantmonitor.net/gbpjpy-macd-trader/
Key details are:
Parameters
MagicNumber: 220100009
Main Chart: Cu
FREE

CCFp (Complex_Common_Frames percent) is a measure of currency strength.
Shows the total rate of change of “short-term moving average” and “long-term moving average” for each currency.
Supports eight major currencies: USD, EUR, JPY, CHF, GBP, AUD, CAD and NZD.
1). Displays the currency name at the right end of the graph.
2). You can change the display color of each currency.
3). Moving average smoothing type (ENUM_MA_METHOD) can be selected.
4). Price constant (ENUM_APPLIED_PRICE) can be c
FREE

SA Assistant is an intuitive tool without complicated settings, designed to facilitate the trading operations in the MetaTrader 4 terminal. SA Assistant is not designed for working in the strategy tester. The demo version works only on the USDCAD pair. Please test the EA on a demo account before using it on a live account.
The SA Assistant EA is visually divided into 4 blocks: 1. "Information" - displays in real time: trading account balance leverage spread of the instrument the EA is attached
FREE

If you can not create a background image for yourself (photo size and format must be changed), let me know. I make your photo for free. Otherwise, you can read the help file . A tool for chart management You can change the background image You can change the background color Change the color of the candles Volume colors, line charts and everything else You can also enable and disable some items Read the help file for more information
Settings:
Save Changes After Remove Tool
Back Ground Photo
FREE

IzaRP - Risk / Profit Monitor (MT4) IzaRP — это вспомогательный индикатор для трейдеров, предназначенный для анализа открытых позиций и контроля рисков в реальном времени. Индикатор автоматически рассчитывает ожидаемый риск и ожидаемую прибыль по всем открытым сделкам на торговом счёте на основе установленных уровней Stop Loss и Take Profit и отображает результат непосредственно на графике. Основные возможности Анализирует все открытые рыночные ордера (BUY и SELL) Игнорирует отложенные орде
FREE

This indicator alerts you when/before new 1 or 5 minute bar candle formed. In other words,this indicator alerts you every 1/5 minutes. This indicator is especially useful for traders who trade when new bars formed.
*This indicator don't work propery in strategy tester.Use this in live trading to check functionality.
There is more powerful Pro version .In Pro version,you can choose more timeframe and so on.
Input Parameters Alert_Or_Sound =Sound ----- Choose alert or sound or both to notify y
FREE

This is a simple script that places a defined number of lines above and below a given price. The script lets you set the number of lines, the separation in pips and the color. Instructions:
Drop the script on a chart to draw the level lines If the last parameter is set to false, the script will delete the lines previously placed by it.
Parameters:
English? Turn it yes to use English language, false will turn language to Spanish Separation Set the pips distance among lines From Price Ca
FREE
StatBar 1.6 Indicator showing balance, earnings for today, yesterday and the day before yesterday. The indicator also shows: - Server; - GMT; - Server time; - Shoulder; - Spread.
Description of variables: extern int Magic = "-1"; // Magic for statistics -1 = all 0 = manual extern string Symboll = "-1"; // Symbol for statistics -1 = all 0 = current EURUSD = for EURUSD
FREE
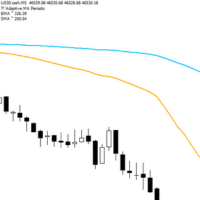
Adaptive Flow MAs is a moving average indicator designed to naturally adjust to market movements. Unlike traditional averages, it dynamically adapts its periods based on recent volatility and the current trend. The EMA closely follows rapid price swings to capture every impulse, while the SMA remains smoother, providing a stable and reliable reference. With a clean display showing the current adaptive periods, this tool helps traders feel the “flow” of the market without visual clutter. It’s cr
FREE
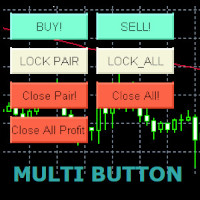
Use this multifunction button to execute orders instantly! Several buttons will handle:
1. BUY: Open a BUY order with preferred size (configurable in Expert config). 2. SELL: Open a SELL order with preferred size (configurable in Expert config). 3. LOCK PAIR: Open an order with the same lot to LOCK your order position, based on the currently opened chart (current pair). 4. LOCK ALL: Open an order with the same lot to LOCK your order position, based on all your open positions (all pairs). 5. Cl
FREE
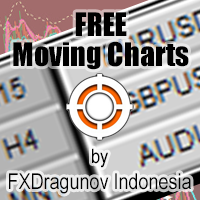
The Symbol Changer Indicator for MT4 is an amazing tool to switch and display any desired currency pair chart and any time frame. Forex traders can display the desired charts with the click of a mouse directly from any open chart. The symbol changer indicator for Metatrader is an essential tool for trend traders working with a top-down approach.
The symbol changer indicator shows all the available trading instruments in the market watch window. It also displays all the currency pairs as buttons
FREE

This is a Semi Automated OTE EA based on the free teachings of ICT. One of the biggest challenges in trading is related to executing and managing trades. After analyzing charts, draw an OTE Fibonacci and turn on the EA. It will automatically execute orders based on the Fibonacci level of your placement and protect any open positions when in profit. Please review the documentation that accompanies this product.
Auto Lot Calculation Based on Risk Percent
Auto SL and TP
Auto BE
Risk Per
FREE
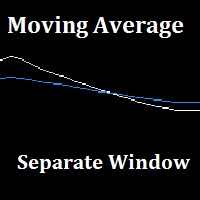
"Separate Moving Average" is a custom indicator made from the combination of 2 moving averages in a different window (the indicator window) for the goal of removing the clutter from the price chart, the indicator also has arrows to show the moving average cross either long or short. All the moving average parameters are customizable from the indicator input window.
FREE

TriadStrategiesFx-полностью автоматический эксперт с тремя стратегиями. Каждая стратегия работает отдельно.Для переключения стратегий необходимо изменить параметры советника в окне настроек. По умолчанию TriadStrategiesFx работает по классическому мартингейлу, локированием убыточного ордера.Как правило, закрытие всех ордеров происходит по совокупной прибыли после выхода из флетового коридора, после чего начинается новый цикл.
Вторая стратегия, предусмотренная в эксперте, также является кла
FREE

Candle size oscillator is an easy to use tool to figure out candle size from highest to lowest price of each candle. It's a powerful tool for price action analysts specifically for those who works intraday charts and also a perfect tool for short term swing traders. Kindly note that you can also edit the Bullish and Bearish candles with different colors.
#Tags: Candle size, oscillator, price action, price range, high to low, candle ticks __________________________________________________________
FREE

Dynamic Trading Dashboard for MT4 This powerful MT4 trading dashboard offers traders a comprehensive view of current and historical trading performance in an intuitive and visually organized format. With its precision-engineered design, the dashboard provides a seamless blend of real-time insights and historical analysis. This trading dashboard is perfect for meticulous traders who seek a precise, all-encompassing tool to manage open and closed positions while gaining insights into past perform
FREE

Trailing Step is an EA that lets the order's stop loss at a specific distance of current price, set by pips. Its configuration is very simple:
Trailing stop in pips - sets the stop loss distance in relation to the current price in pips. Trail step in pips - sets the "step" of stop loss in pips.
Never miss a trade by forgetting to move the stop. Guarantee your profit!
Any doubt or suggestion do not hesitate in contact us.
Enjoy!
Obs. You need to set the stoploss when you open your trades bec
FREE
This simple logging library is designed to provide clear and contextual log output with minimal hassle. It exposes five methods: LogErrorMessage(message) LogWarn Message (message) LogInfo Message (message) LogDebug Message (message) LogTrace Message (message) Each method prints the provided message to the console only if the severity level meets or exceeds the current threshold set by a global variable logLevel. This means you control the verbosity of your application's logs by adjusting logLev
FREE
This indicator allows to hide OBV (on all MT4 timeframes) from a date define by the user with a vertical line (Alone) or a panel (with "Hidden Candles"). Indicator Inputs: Apply To Information on "On Balance Volume" indicator is available here: https://www.metatrader4.com/en/trading-platform/help/analytics/tech_indicators/on_balance_volume ************************************************************* Hey traders!! Give me your feeds! We are a community here and we have the same objective....
FREE

It's an expert to open and close orders on specific day and time. Expert open and close orders only with the same symbol it attached. Can set time open and close orders based day of year or day of week. Expert can send market orders and pending (stop or limit). Each order can placed with take profit and stop loss. There is option to use trailing stop loss and break even. Expert can manage only own orders or all orders of account.
Information about the expert's parameters can find on the blog .
FREE

EMA Separation plots 2 exponential moving averages, and a fill between them. The fill is colored differently according to an uptrend (short period EMA above long period EMA), or a downtrend (short period EMA below long period EMA). This is a small tool to help visualize the difference between long and short period averages. We hope you enjoy! EMA Separation can also be paired with our free EMA Separation Coefficient
Parameters Short period (Default=10): # bars used to calculate short period EMA
FREE

Night Watcher – Smart Night Trading EA Expert Advisor — Version 1.0 Night Watcher is an automated trading system designed to operate during low-volatility night sessions. It combines technical filters and strict risk management to identify and manage trades under controlled conditions. How it works The EA monitors price behavior during predefined nighttime trading hours. Entry signals are generated using a combination of Bollinger Bands, RSI, and EMA crossovers. Each trade is protected with Sto
FREE

This indicator will show yesterday and today high low, very useful to understand the market sentiment. To trade within the range/ break out. Previous day low- can act as support- can used for pull back or break out Previous day high- can act as resistance- can used for pull back or break out The previous day high low breakout strategy refers to the day trading technique that provides traders with multiple opportunities to go either long or short . The main idea is to identify the trend in its m
FREE
This Expert Advisor is a tool to be used for closing all open positions by ticket in profit. Does not open positions, can only close positions. You can select the type of profits (pips or currency) and type of tickets (buy or sell) to manage it, and specific ID (magic number).
You can to get source code from here .
Parameters ManageBuySellOrders - Way to manage opened orders, as different basket buy from sell, or same basket buy and sell. CloseBuyOrders - Close all buy positions if target achi
FREE
The Manual Strategy Tester Assistant Expert Advisor is a powerful tool designed to assist traders in testing their strategies manually using the Strategy Tester in MetaTrader 4. This expert advisor provides a user-friendly panel with intuitive controls to set orders, calculate lot size, manage risk, and monitor account balance and equity directly on the chart. Key Features: User-friendly panel with 5 buttons for easy navigation and control. Risk management functionality: Set the desired risk am
FREE

Market Dashboard FREE Indicator gives you advanced information’s about your selected Symbols in MarketWatch
Features
Daily Price Movements (M1 – D1) RSI Values with Highlight Function for your current Timeframe & H1 & H4 Profit per Symbol and traded lots (buy & sell) EMA 5 – 100 based on selected period Swap Information (which direction is positive) FIBO Info & Tracking (highlighted FIBO Levels close to current price – based on selected period) One Click ChartOpen this Version is limited to 2
FREE

The utility is designed to close and delete positions when the specified loss/profit values are reached in the currency/percentage of the Deposit. The chart displays a panel with information: profit/loss on the account, the number of open positions, and total positions in lots. Parameters: SHOW THE DASHBOARD - TRUE - Yes, FALSE - No. CURRENCY PAIRS - TRUE - All, FALSE-Current. STOP PROFIT IN $ OF THE DEPOSIT - Profit value in the Deposit currency. STOP LOSS IN $ OF THE DEPOSIT - Loss value in
FREE

The Average True Spread Indicator is designed to visually display the average spread (difference between Ask and Bid prices) over a specified number of candles and timeframe, directly on the chart. Its primary purpose is to give traders real-time insight into how volatile or expensive the market is to enter , especially during fast-moving or low-liquidity periods. Benefits of Knowing the Average Spread Better Entry Timing
Avoid trading when spreads are abnormally high (e.g., during news event
FREE

ON THIS LINK YOU CAN FIND NEW VERSION https://www.mql5.com/en/market/product/53022 https://www.mql5.com/en/market/product/53022
/-/-/-/-/- /-/-/-/-/- /-/-/-/-/- /-/-/-/-/- /-/-/-/-/- /-/-/-/-/- /-/-/-/-/- /-/-/-/-/- /-/-/-/-/- /-/-/-/-/- /-/-/-/-/- /-/-/-/-/- /-/-/-/-/- /-/-/-/-/- /-/-/-/-/- /-/-/-/-/- /-/-/-/-/- /-/-/-/-/- /-/-/-/-/- /-/-/-/-/- /-/-/-/-/- /-/-/-/-/- /-/-/-/-/- /-/-/-/-/- /-/-/-/-/- /-/-/-/-/- /-/-/-/-/- /-/-/-/-/- /-/-/-/-/- /-/-/-/-/- /-/-/-/-/- /-/-/-/-/- /-/-/-/-/- /-/-/
FREE

The Rapid Reaper EA is a fully automated hybrid averaging EA that trades in sequences of lot increase and multiplication on both sides of the book. The system trades using market orders with take profits set across trade groups. This EA will work on any pair but works best on GBPUSD and USDCAD on the M5 timeframe. A VPS is advisable when trading with this EA. Check the comments for back test results and optimized settings. Please note: I have made the decision to give this EA away and many more
FREE

EA_SMI is based on SMI indicator. The Stochastic Momentum Index (SMI) is a technical indicator used to assess the momentum and direction of a trend. It is an improved version of the traditional Stochastic Oscillator, designed to provide a more accurate reflection of price changes. Below is an explanation of the basic concepts and usage of the SMI. Basic Concepts of SMI Calculation Method : The SMI measures where the current price stands relative to the range of prices over a specific period, co
FREE

Telegram Trading Panel – MT4 utility for order control via Telegram Purpose
Utility for MetaTrader 4 to open/close orders, set SL/TP, create pending orders, and view position info directly from Telegram using inline keyboards. Designed for mobile/VPS use without direct terminal access. Key features Telegram panel with inline keyboards: Open BUY/SELL market orders Close single order or “Close all” Pending orders: Buy/Sell Limit and Buy/Sell Stop with price and expiry Assisted Break Even: set SL a
FREE
如果产品有任何问题或者您需要在此产品上添加功能,请联系我 Contact/message me if you encounter any issue using the product or need extra feature to add on the base version.
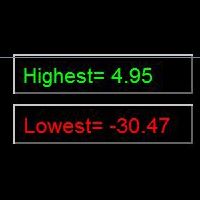
Indicator Floating Highest Lowest provides you an intuitive, and user-friendly method to monitor the floating highest (profit) and lowest (loss) that all your trades together ever arrive. For example, I opened 3 orders, which arrived at $4.71 floating profit when trade following trend. Later when the trend is against me, these 3 orders arrive $30 in loss
FREE
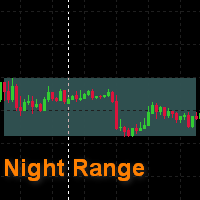
This is a simple indicator that draws a night range. The start and the end of a working day are specified in hours, color rectangles are adjusted as well. It helps to view the history in search for regularities , excluding unpredictable night time. It can be used to search for a breakthrough of the night range. It is drawn as a background , and does not cover a chart and other indicators .
FREE

RJT SALAMANDER, the indicator as in a video game
VERSION 2
Pilot your PRICE spaceship inside the cavern and avoid the collision against the stalactites (green) and stalagmites (red), dodging these obstacles to win.
When these objects are forming (or disappearing) then you must make the decision how to move your ship (just like in a video game)
Depending on the market and the size of the candles/bars you can adjust the calculation of stalactites and stalagmites (based on the last bars) in the
FREE

Altopium Trend is an indicator that identifies short-term trends. The signals it generates can be used to open long or short positions or can be integrated with other indicators/strategies. This is a trend indicator, be careful during narrow sideways phases. I recommend using it as a short-term trend indicator, complemented by other indicators that show the best times to enter the market.
Wait for the bar to close to confirm the signal.
FREE

This indicator applies the biquad high pass filter to the price-chart data, and displays the filter output for the OHLC as candlesticks. The candlesticks corresponds to the actual calculations of the filter value during the formation of each price bar (not from all historical highs lows or closes). The shape of the bars therefore corresponds directly to the shape of each price bar. High pass filters are an underappreciated type of oscillator that are seldom used in technical analysis in the st
FREE
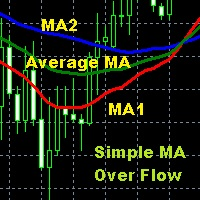
Moving Average is one of the indicators that is widely used in technical analysis which can help to smooth price movements by eliminating some price fluctuations that are less relevant based on past price calculations, so that an average line of price movements is formed within a certain time period. Simple Moving Average Over Flow is an indicator writen by MQL$ language that is given a special additional moving average line based on certain calculations so as to make this moving average better
FREE
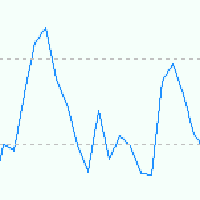
EA is based on Parabolic SAR and MACD indicator. if there are loss EA try to recover loss and fix position by placing another bigger order( factor multipler) after grid gap. if there is profit it waits to optimize profit. Suitable for Beginners No complex settings Just use EURUSD M5 time frame YOU CAN CONTACT ME FOR OPTIMIZATION Please leave the comment your like or dislike I will be happy to answer all kind of query related to this product... I advise you to please check my ot
FREE
LEADING AND LAGGING INDICATORS DASHBOARD https://www.mql5.com/en/users/earobotkk/seller#products P/S: If you like this indicator, please rate it with 5 stars in the review section, this will increase its popularity so that other users will be benefited from using it.
This dashboard scans all time frames(M1,M5,M15,M30,H1,H4,D1,W1,MN1) and shows up trend and down trend for MACD, PSAR, RSI, STOCHASTIC, MOVING AVERAGE, BOLLINGER BANDS by changing the colours of the relevant boxes. It also shows ca
FREE
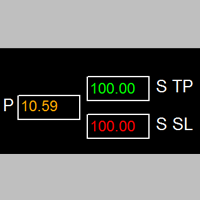
如果产品有任何问题或者您需要在此产品上添加功能,请联系我 Contact/message me if you encounter any issue using the product or need extra feature to add on the base version.
Session TakeProfit StopLoss is basically helping to set the take profit and stop loss in dollar for the total open orders (session). Once the total profit is greater than session_tp or less than session_sl, the EA will help to close all open orders acting similarly to a take profit/stop loss for a single order.
Inputs session_tp: session take profit ses
FREE

Simple and lightweight utility for automatically synchronizing the symbol of multiple charts Synchronization in both directions, regardless of which chart you change the symbol on Quickly activate or deactivate the synchronization of individual charts at the touch of a button Create multiple synchronization groups by assigning different event IDs Themes for bright and dark chart layouts
FREE

MP Relative Bandwidth Filter (RBF) is created to be used to identify your trading zones based on volatility. This easy to use technical indicator attempts to compare between Bandwidth of higher length and ATR of lower length to identify the areas of low and high volatility: Relative Bandwidth = Bandwidth / ATR The Bandwidth is based on Bollinger Band which its length ideally needs to be higher and ATR length needs to be ideally lower. After calculating Relative Bandwidth, the Bollinger Band is
FREE

Skull Per https://www.mql5.com/en/users/earobotkk/seller#products This is a fully functional Expert Advisor. It is intended for trading major currency pairs with small spread. It uses scalping technique for quick profit and easy to use with simple input parameters. Input Max Spread: maximum spread allowable for trading. Magic No: unique expert number. Lot: size of lot. Lot Multiplier: size of subsequent lot by multiplication. Take Profit: take profit in pips. Stop Loss: stop loss in pips. Trail
FREE
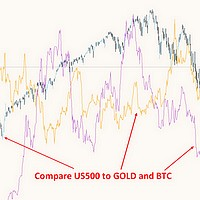
This free MT4 indicator allows you to easily compare as many symbols as you want! Make sure that the input symbol matches the name displayed in the Market Watch ***Please comment, rate and share it to your friends if you like it*** ------------------------------------------------------------------------------ Comparing trading pairs is useful for several reasons, including: Identifying relative strength: Comparing trading pairs can help traders identify which currency or asset is relatively stro
FREE

Wolf FREE is my another Expert Advisor for GBPUSD . It based on Keltner Channel , Bollinger Bands and Linearly Weighted Moving Average . Wolf FREE has been tested from year 2003 to 2021 . All trades use TakeProfit and StopLoss . This Expert Advisor is "ready to use" , it means, that there is no need to set anything and just launch. Doesn't use Martingale or other dangerous startegies.
Recommendations
Symbol: GBPUSD Timeframe: H1 Deposit: 300 USD Broker: Any broker
Settings CustomCo
FREE

Session Average Date Range: Analyze and average the low - high of specific trading sessions within custom date ranges, offering insights into price movements and market behavior over selected periods. The "Session Average Date Range" tool is an advanced analytical utility designed to empower traders and analysts by allowing them to dissect and evaluate the high and low range of specific trading sessions within a user-defined date range. This tool provides a flexible and precise approach to analy
FREE
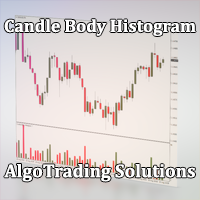
Индикатор Candle Body Histogram отображается в отдельном окне и показывает размер тела каждой свечи в виде гистограммы. В зависимости от того растёт свеча на графике или снижается, гистограмма меняет свой цвет. Свечи "доджи", у которых совпадают цены открытия и закрытия, так же отображаются на гистограмме отдельным цветом. Поскольку индикатор строится от нулевого значения, он позволяет визуально сравнить тела свечей относительно друг друга. На гистограмме можно разместить уровни, чтобы отслежив
FREE

Индикатор сглаженного Stochastic Oscillator (xStoh)
Входные параметры: xK Period - K период xD Period - D период xSlowing - замедление xMethod - метод усреднения (0-SMA | 1-EMA | 2-SMMA | 3 - LWMA) xPrice field - тип цены (0 - Low/High | 1 - Close/Close) Принцип работы
Индикатор перерассчитывает стандартный технический индикатор Stochastic Oscillator (дважды усредняет получаемые значения iStochastic).
FREE

The indicator is designed for intraday trading.
Equipped with all notification functions for convenience in manual trading.
It is recommended to use timeframes m5, m15, m30.
You can also view and select settings for any financial instrument. Settings: Indicator period - Indicator period Alert - The function of enabling alerts. Push notifications - Enabling Push notifications to the mobile terminal e-mail - Sending a signal to e-mail In addition to this product, I recommend looking at my othe
FREE
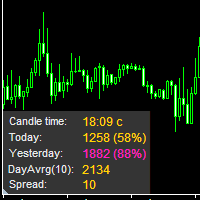
The information panel displays important trading information on the chart. Visual display of the information will help you to make a prompt and precise trading decision. Screenshots depict information which I use in my trading system. But you can add any other desired information. To do this contact me via MQL5 web-site. Displayed information: Time till the end of the current candle and formation of a new one. Time set format: hh:mm, if there is at least one full hour, or mm:ss, if you have les
FREE

This Utility is a tool to manage level of profits or losses for each order without using stop loss or take profit. The Utility applies virtual levels to close orders in profit or loss. You can use the robot to manage manually opened orders or manage orders opened by another EA.
You can to get the source code from here .
Parameters OrdersManage - orders to manage (all orders of all symbols or orders on the current chart). Stop Loss Pips - virtual stop loss level. Take Profit Pips - virtual take
FREE

NEW UPDATE VERSION 3.1 released Ai powered EA Analyse Data with Ai technology enjoy smart trading now great results with the default settings on the recommended pairs check what's new tab
You can follow any risk value either in pips or in percentage in the Expert settings
Hello Traders Not optimized best use on usdcad on h1 we have launched the new version 3.1 of power ranger Expert Advisor
Power Ranger EA Features: Ai powered EA Trend based Strategy Low drawdown open and close trades au
FREE

The DJ_15_811543657_S_BB_CF_SQX is an algorithmic trading strategy for MetaTrader, tested on DJ using the M15 timeframe from December 7, 2017, to June 2, 2023. There is no need to set up parameters, all settings are already optimized and fine-tuned.
Recommended broker RoboForex because of EET timezone.
You can find the strategy source code for StrategyQuant at the link: https://quantmonitor.net/dow-jones-bollinger-breaker/
Key details are:
MagicNumber: 811543657
Main Chart: Current s
FREE
Советник Rounding Levels Trade торгует по круглым ценовым уровням (пример 1.1200, 1.1300, 1.1400 и так далее) на пробой и на отскок в зависимости от пользовательских настроек. В советнике предусмотрен мантингейл. Советник может может торговать по выбору Пользователя по ценовым уровням в формате - круглый ценовой уровень + заданное количество пунктов: пример: 1.12 40 , 1.134 0 , 1.14 40. Настройки советника: Dig = 2; значение рыночной цены округляется до количества (Dig) знаков после запятой. Пр
FREE

The GU_H1_120114111_S_Pi_CF_0712_SQ3 is an algorithmic trading strategy for MetaTrader, tested on GBPUSD using the H1 timeframe from April 1, 2004, to April 24, 2024. There is no need to set up parameters, all settings are already optimized and fine-tuned.
Recommended broker RoboForex because of EET timezone.
You can find the strategy source code for StrategyQuant at the link: https://quantmonitor.net/gbpusd-pivots-trend-master/
Key details are:
Parameters
Main Chart: Current symbol and
FREE

BALANCE GUARDIAN is a software to support traders who wish to set profit and maximum loss targets for their trading accounts. developed for MT4. Once BALANCE GUARDIAN is activated, the user will be able to set the maximum acceptable loss as well as their own profit target - upon reaching either one, the software will proceed with closing all open trades and subsequent deactivation of autotrading in case any Expert Advisors are active.
PLEASE NOTE: The software's sole purpose is to provide the
FREE
The Bollinger Fading EA is a fully automated Expert Advisor that trades based on Bollinger Band and RSI entry signals. The EA trades using market orders and uses averaging to safely turn otherwise negative trades positive. This EA works best on EURUSD using the H1 timeframe. A VPS is advisable when trading this system. Check the comments for back test results and optimized settings. Please note: I have made the decision to give this EA away and many more for free with limited support so that I c
FREE
TradeStops Manager EA is a simple, dynamic, volatility-adaptable stops-management tool that will help you to manage your open order's stops effectively according to your way. The fact that most traders lose money in the markets is not really surprising if you consider that most traders do not know how to set up the right, dynamic, adaptable stops in the face of current volatility in the market. Do you want to close a specific order after a specified
number of candles, StopLoss Level is reach
FREE

Free Version. This expert advisor is optimized for the USD/JPY forex value,It can be used for any forex currency by setting the values listed below. Its operation is based on a multi time frame moving average strategy, so it can be classified as a trend expert. When the trend has consolidated on one direction the algorithm buys or sells the currency pair. In the event of a trend inversion, there is a fixed stop loss, while the take profit is variable with the trailing stop function. For this
FREE

This Dashboard is free to download but is dependent on you owning the Advanced Trend Breaker . Get the indicator here: https://www.mql5.com/en/market/product/66335
The Dashboard will show you on a single chart all the timeframes (M1 to Monthly) with their own status for the indicator: Advanced Trend Breaker
all time frame and all symbol: smart algorithm detects the trend,Support and resistance, filters out market noise and find breaker of entry signals!!!
!!!
How to understand th
FREE

This scanner shows the trend values based on crossovers of two moving averages for up to 30 instruments and 8 time frames. You can get alerts via MT4, Email and Push-Notification as soon as the direction of the trend changes. This is the FREE version of the indicator: https://www.mql5.com/en/market/product/29159
Important Information How you can maximize the potential of the scanner, please read here: www.mql5.com/en/blogs/post/718074
You have many possibilities to use the scanner. Here are tw
FREE

The StochasticDivergence is a custom indicator for the MetaTrader 4 (MT4) platform, designed to analyze the divergence between the Stochastic Oscillator (%K line) values of two currency pairs. It compares the Stochastic %K of the chart’s symbol (first symbol) with a user-defined second symbol, displaying both %K values and their absolute difference (divergence) in a separate subwindow. The indicator provides visual and alert-based feedback to highlight significant divergence levels, with custo
FREE

Overview The script displays information about the trade account: Account - account number and type (Real or Demo); Name - name of the account owner; Company - name of a company that provide the access to trading; Server - trade server name; Connection State - connection state; Trade Allowed - shows whether trading is allowed on the account at the moment; Balance - account balance; Equity - account equity; Credit - amount of credit; Profit - profit size; Free Margin - free margin on the account;
FREE
MetaTrader Market - trading robots and technical indicators for traders are available right in your trading terminal.
The MQL5.community payment system is available to all registered users of the MQL5.com site for transactions on MetaTrader Services. You can deposit and withdraw money using WebMoney, PayPal or a bank card.
You are missing trading opportunities:
- Free trading apps
- Over 8,000 signals for copying
- Economic news for exploring financial markets
Registration
Log in
If you do not have an account, please register
Allow the use of cookies to log in to the MQL5.com website.
Please enable the necessary setting in your browser, otherwise you will not be able to log in.