Watch the Market tutorial videos on YouTube
How to buy а trading robot or an indicator
Run your EA on
virtual hosting
virtual hosting
Test аn indicator/trading robot before buying
Want to earn in the Market?
How to present a product for a sell-through
Expert Advisors and Indicators for MetaTrader 4 - 30

Early Bird Breakout: Capture the Power of the London Open Are you tired of trading in choppy, unpredictable markets? The Early Bird Breakout is your essential tool for exploiting one of the most reliable and explosive patterns in Forex: the Asia Session Breakout . This smart indicator automatically identifies the crucial price levels set during the quiet Asian hours and alerts you the moment the major volume of the London/European session ignites a trend! Key Features and Market Edge Precision
FREE

** All Symbols x All Time frames scan just by pressing scanner button ** *** Contact me to send you instruction and add you in "Harmonic Scanner group" for sharing or seeing experiences with other users. Introduction Harmonic Patterns are best used to predict turning point. Harmonic Patterns give you high win rate and high opportunities for trade in during one day. This indicator detects the best and successful patterns base on Harmonic Trading books . The Harmonic Patterns Scanner Scans All ch

Advanced Moving Average Robot (Maab pro 2)
=============== This Robot is fully automated and has been created for everyone. The Robot works also on cent accounts.
The Ea is based on Moving averages ========================================= You can set up which Moving Averages you want to cross. But keep in mind if you use a smaller frame you will get more signals.And also consider the profit when there was a crossover but the market is trading sideways. Maybe better to go for small profit,

It is a custom non-repaint indicator to identify trade opportunities in swing action as prices move within an upper and lower band. Inspired by the Keltner Channel, the most popular channel Indicator introduced by Chester Keltner. It is different with a Bollinger Bands. It represents volatility using the high and low prices, while Bollinger's studies rely on the standard deviation. The algorithm for this indicator is also available in the EntryMaximator EA. Including the option to use it or not.
FREE

Lisek Stochastic oscillator indicator with Alarm, Push Notifications and e-mail Notifications. The Stochastic indicator is a momentum indicator that shows you how strong or weak the current trend is. It helps you identify overbought and oversold market conditions within a trend. The Stochastic indicator is lagging indicator, which means it don't predict where price is going, it is only providing data on where price has been !!!
How to trade with Stochastic indicator: Trend following: As long
FREE

Transform your trading approach with reliable bullish and bearish patterns This indicator evaluates volatility and price directionality simultaneously, which finds the following events. Decisive and sudden price movements Large hammers/shooting stars patterns Strong breakouts backed by most market participants Indecisive but volatile market situations It is an extremely easy to use indicator... The blue histogram represents the bullish impulse The red histogram represents the bearish impulse The
FREE

Special offer : ALL TOOLS , just $35 each! New tools will be $30 for the first week or the first 3 purchases ! Trading Tools Channel on MQL5 : Join my MQL5 channel to update the latest news from me SMC is a trading approach that helps traders identify liquidity zones, institutional order placements, and key market turning points. By leveraging SMC principles, traders can navigate the market more effectively, finding optimal entries and exits. The SMC System indicator automates th

Elliott Wave Helper - a panel for making elliott wave and technical analysis. Includes all known wave patterns, support and resistance levels, trend lines and cluster zones. Manual (Be sure to read before purchasing) | Version for MT5 Advantages
1. Making wave analysis and technical analysis in a few clicks 2. All Elliott wave patterns available, including triangle and combinations 3. All nine wave display styles, including a special circle font 4. E lements of technical analysis : trend lines,

EMA Cloud System is a Trading System Invented by Ripster where areas are shaded between two desired EMAs. The concept that the EMA cloud area serves as support or resistance for Intraday & Swing Trading. Can be utilized effectively on 10 Min for day trading and 1Hr/Daily for Swings. Ripster utilizes various combinations of 5-12 EMA clouds 34-50 EMA clouds among others. 8-9, 20-21 EMA clouds can be used as well. Adjust what works for you. Ideally 5-12 or 5-13 EMA cloud acts as sold fluid Trendlin
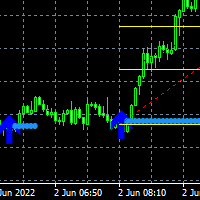
Here is the Double Arrow ArrZZx2 indicator that works best on 5 minutes time frame with Alerts. Good for pairs like NAS100, US30, GER30 and XAUUSD Your buy entry or Sell entry is on the second arrow of the Arr zzz You can confirm your second arrow with Fibonacci retracement levels the 50% level and the 61.8% which is the golden zone The double is good on strong trending markets look for the breakout on the second arrow Look at the screenshots for examples.
The VIX Fix is a volatility indicator developed by renowned trader Larry Williams. It's designed to measure volatility in assets that don't have options or futures, such as individual stocks and forex markets. Essentially, it acts as a synthetic VIX (Volatility Index) for any asset , providing a gauge of market uncertainty. This modified version of William's indicator helps you to find market bottoms and market tops. It comes with 2 styles: Stochastic and histogram style. Please see screenshot
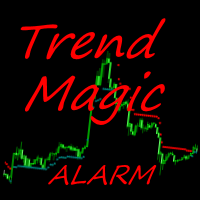
The Trend Magic Alarm shows the direction of a trend and indicates when it changes with a sound, popup window, push or email notice. Blue dots in the chart indicate an uptrend, red dots indicate a downtrend. Levels of former highs + lows give orientation in a chart. Trend Magic Alarm can draw these levels as lines in the chart, see inputs.
Input Parameters Counter : number of bars used for calculation PowerSet : shows how near to the bars the trigger dots are placed DotSize : size of the shown

Expret: The Ultimate Recovery Zone Strategy Expert Advisor for MT4 Revolutionize Your Trading with Expret Expret is a cutting-edge Expert Advisor (EA) designed for MetaTrader 4, leveraging the powerful Recovery Zone strategy to maximize your trading potential. Whether you're a novice trader or a seasoned professional, Expret offers unparalleled customization and control to adapt to your unique trading style.
Key Features: 1. Advanced Recovery Zone Strategy: Expret employs a sophisticated Recov
FREE
Order Block + Fair Value Gap (FVG) Indicator Multi-Timeframe Order Block + FVG Tool In the ICT (Inner Circle Trader) concept, Order Blocks (OB) + Fair Value Gaps (FVG) are among the most critical areas used by professional traders to read market structure, identify supply & demand zones, and spot high-probability entry points. The Order Block + FVG Indicator automatically detects and displays both Order Block zones and Fair Value Gaps directly on your MT4 charts. With multi-timeframe support, yo

PnL Calendar ... analyse to profit
PnL Calendar transforms your trading history into a clear calendar view, helping you spot profitable days, monitor risk in real time, and unify accounts with the new Multi‑Broker data export feature. Core Features Calendar Panel: Profit breakdowns by day, week, month, and year Account Panel: Balance, equity, margin alerts, multi‑timeframe summaries, overnight gap adjustments Risk Dashboard: Leverage, drawdown, profit factor, consistency ratio, holding time, ri

"The Squeeze indicator attempts to identify periods of consolidation in a market. In general the market is either in a period of quiet consolidation or vertical price discovery. By identifying these calm periods, we have a better opportunity of getting into trades with the potential for larger moves. Once a market enters into a "squeeze," we watch the overall market momentum to help forecast the market direction and await a release of market energy." The StdATR Squeeze Channel combines standard

Forex Meter Oscillator is an indicator that can give a whole view of forex market from a single chart, measuring currency strenghts among 28 forex pairs (majors and minors). The "oscillator" word is very meaningful: it normalizes currency strenghts in order to provide values in a predefined range (from -1 to 1).
What are normalization's advantages? It's so simple, values will always be in a pre-defined range that reflect exactly the current value compared to the last N values. In this way you w
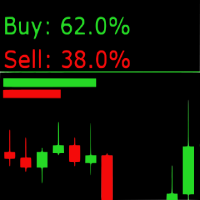
Sentiment Market Indicator: Real-Time Market Sentiment Display The Sentiment Market Indicator is a real-time MQL4 tool that displays current buy/sell sentiment directly on your MetaTrader 4 chart. Designed to support your technical analysis, it provides a visual representation of market positioning to help inform your decision-making process. Key Features Live Sentiment Display
View real-time percentage breakdowns of buy vs. sell sentiment. Customizable Alerts
Set specific thresholds for buy o
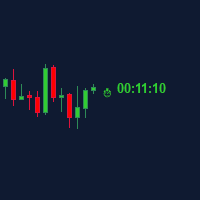
Candle Time (MT4) The Candle Time indicator shows the remaining time for the current candle on the active chart timeframe. It adapts automatically to the chart period and updates on every tick. This is a charting utility; it does not provide trading signals and does not guarantee any profit. Main functions Display the time remaining for the current candle on any timeframe (M1 to MN). Color-coded state: green when price is above the open (up), gray when unchanged, and red when below the open (do
FREE

Close Manager Buttons EA (MT4 Version) One-Click Trade Manager for MetaTrader 4 This is the MT4 edition of the Close Manager Buttons EA, built for traders who want instant control over their trades in MetaTrader 4.
The features are identical to the MT5 version, making it easy to manage trades across both platforms. Key Features Close All Trades – instantly close every open position Close Only Buy Trades – exit only BUY positions Close Only Sell Trades – exit only SELL positions Close Winning Tra
FREE

Virtual SL TP Trailing Pro for MT4 – Client-Side Stop Loss / Take Profit and Trade Management Looking for MetaTrader 5 version? I t is available separately in the Market: Virtual SL TP Trailing Pro MT5 Virtual SL TP Trailing Pro for MT4 is a trade management utility that keeps Stop Loss (SL) and Take Profit (TP) levels on the client side instead of sending them to the trading server. It is designed to help you manage exits in a structured way using a clear on-chart panel and visible price lev

What is ADR? Quite simply, ADR (Average Daily Range) is the average of price movement over a period of time. It can be used as a gauge of how far price may move on any given trading day. This indicator calculates 5, 10, 20 Average Daily Range Features: - Average: Daily Range, Prev 1/5/10/20 days - Calculator maximum stop loss/profit target by Risk/Reward percent of ADR in Pips. - Candle countdown - ... Contact me if you need: https://t.me/Cuongitl
FREE

G-Labs Market Maker Dashboard - Exclusive Seasonal Offer Elevate your trading with the original G-Labs Market Maker Dashboard, available for a limited time at just $70 USD. Ideal for starter traders, this dashboard has been enhanced with new features and now includes a comprehensive training video. This indicator is for people trading the market makers method and is the entry level dashboard for that strategy is available for both mt4 and mt5. its a market scanner in real time showing peak
Range Cycle Indicator. Gives signal on price range cycling smoothed by moving average. It is better to use it on H1+ timeframes and avoid side markets. Because if market is flat this indicator will give too many zero profit or even losing signals. Parameters: PopUpAlert - to allow it to alert when trend changes; EMailAlert - for email alerts; period - this is a smoothing criteria, use higher values on lower timeframes; TimeFrame(new) - higher timeframe (or the same) to use for calculation, defa
FREE

Heikin-Ashi-Sniper is a perfect addition to your portfolio. It is meant to be traded on EURUSD on H1 Timeframe.
It uses Heikin-Ashi High and Low/High of Monthly timeframe to determine optimal entry signals while having a reasonably low drawdown More EA´s will be published shortly to complete the Portfolio. The EA Trades not very frequently it waits for the right chance and places the order. The rest of the time, your capital is free to be traded on
other strategies Please see backtest results i
FREE
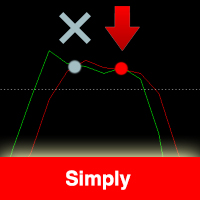
The indicator is based on the Stochastic indicator. I also recommend to see my EA Night Zen Strategy: It contains a strategy for crossing the K and D lines in the overbought (for sales) and oversold (for purchases) zones. The indicator gives a signal at the second intersection.
The signals are not rewritten, they appear after confirming the intersection of the K and D lines.
Settings: Stochastic Indicator Settings Indicator period Notification and Alert Settings
FREE

This indicator uses Bollinger Bands lines to detect markets trend. It's a very useful tool for manual trading. Furthermore it is possible to use the indicator with ATR as a filter , as well as the option to pop up an alert when a reverse trend occurs. The readings are very simple to use and understand. Indicator works best on H1 timeframe.
You can to get source code from here .
Parameters BarsCount - How many bars used to show the line. BBperiod - Period of Bollinger Bands. BBdeviations - Devi
FREE

This multicurrency strategy simultaneously determines the strength of the trends, entry points and the take profit levels for each trade. The indicator can determine entry points on any trading period from M1 to D1. For the convenience of users, the indicator renders the entry point (in the form of an arrow), recommended take profit levels (TP1, TP2, TP3) and the recommended stop loss level (SL1, SL2). The options for using the strategy are described below. Full description of the indicator Cosm
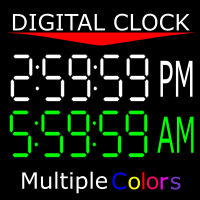
Shows you the time of the server you're on as well as the current time of the time zone you're in. 12-hour clock format (12:00:00 am to 11:59:59 pm) Charts from 1-5 mins are in hour:min:sec format Charts from 15 mins to 1 month are in hour:min format" You can also change the color of the clock to any color MT4 offers. If there is anything you would like me to add ask. As long as it isn't extensive, I might add it.
FREE

The indicator shows on the chart the classic pivot levels calculated on the basis of the previous day . You can choose from what hour to calculate the formula. Trade on reversal levels in a flat. In a trending market, use them as a target. Combine with your strategies for successful trading. The levels are drawn using buffers and displayed on the entire available quote history.
Input parameters.
Start Hour - Choose from what hour to start building levels. 00 - Default. Show Mid Pivots - M
FREE

MACD Crossover Arrows & Alert is a MT4 (MetaTrader 4) indicator and it can be used with any forex trading systems / strategies for additional confirmation of trading entries or exits on the stocks and currencies market. This mt4 indicator provides a BUY signal if the MACD main line crosses above the MACD signal line . It also displays a Sell signal if the MACD main line crosses below the MACD signal line .
STRATEGY Traders can use the MACD signal alerts from a higher time frame
FREE

Are you tired of drawing trendlines every time you're analyzing charts? Or perhaps you would like more consistency in your technical analysis. Then this is for you. This indicator will draw trend lines automatically when dropped on a chart. How it works Works similar to standard deviation channel found on mt4 and mt5. It has 2 parameters: 1. Starting Bar 2. Number of bars for calculation The starting bar is the bar which drawing of the trend lines will begin, while the number of bars for c
FREE
The High Low Cloud Trend indicator is a channel-based technical analysis tool that identifies trend direction and mean reversion opportunities through adaptive price boundaries. The system operates by calculating the highest high and lowest low over a specified lookback period, creating outer channel boundaries that define the overall price range. A secondary inner channel uses a shorter period (one-quarter of the main lookback) to capture more immediate price movements within the broader range.
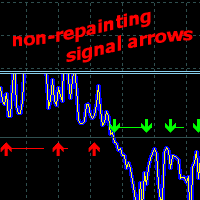
Price Direction Oscillator - indicator designed to detect short- and medium-term market movements. Adaptable to any market and timeframe,
It consists of a trend line, a market volatility oscillator, and a potential trading signal generator.
Indicator Use
It determines the trend based on market volatility and provides signals for opening BUY or SELL orders. Without redrawing its historical data, the signal arrows do not change color and appear at the close of the candle. Following the signal, t

It's an automated Forex strategy and programmed analytical system that allows you to sit back, relax and simply watch the Robot do its trick. After the parameters, scales and limits of your transactions have been provided by you, the Robot takes over and handles all the trades for you. This permits you to take control while focusing your energies on other important matters as well. This EA is especially designed for trading the XAUUSD (Gold pairs). It works best with M5 H1 timeframe. The trading

LAUNCH PROMO - $49 for early buyers MYFXBOOK - CLICK HERE TO SEE! - 2025 TEST, 3 YEARS SPREAD STRESS TEST , 3 YEARS AVERAGE SPREAD TEST
To see verified results, copy link below: myfxbook.com/members/ARAISYSTEMS After purchase, send me a private message to receive the installation manual and detailed setup instructions. TASMAN EA is a high-performance algorithm engineered for NZDCHF , optimized for RAW spread accounts and prop-firm trading conditions .
Backtested over 20+ years using 99% tick ac

Sniper Entries AI is a powerful, intelligent indicator designed for traders seeking precise entry points at potential market reversals. Leveraging advanced AI algorithms, this tool analyzes price patterns across multiple timeframes, allowing traders to stay informed of trend shifts, no matter the scale of their trades. Key Features of Sniper Entries AI: High-Precision Reversal Signals : The indicator scans market movements to identify precise reversal points and continuation, giving you a compe

The EasyTrend is a seemingly simple but quite powerful trend indicator. Everyone has probably come across indicators or Expert Advisors that contain numerous input parameters that are difficult to understand. Here you will not see dozens of input parameters, the purpose of which is only clear to the developer. Instead, an artificial neural network handles the configuration of the parameters.
Input Parameters The indicator is as simple as possible, so there are only 2 input parameters: Alert - i

本指标 基于 Zigzag 基础上... 增加了: 1.增加了箭头指示,使图表更鲜明 2.增加了价格显示,使大家更清楚的看清价格. 3.增加了报警等设置,可以支持邮件发送 原指标特性: 1.基本的波段指标构型. 2.最近的2个ZIGZAG点不具有稳定性,随着行情而改变,(就是网友所说的未来函数) 3.原指标适合分析历史拐点,波段特性,对于价格波动有一定的指导性.
Zigzag的使用方法一 丈量一段行情的起点和终点 (1)用ZigZag标注的折点作为起点和终点之后,行情的走势方向就被确立了(空头趋势); (2)根据道氏理论的逻辑,行情会按照波峰浪谷的锯齿形运行,行情确立之后会走回撤行情,回撤的过程中ZigZag会再次形成折点,就是回撤点; (3)在回撤点选择机会进场,等待行情再次启动,止损可以放到回撤的高点。 一套交易系统基本的框架就建立起来了。 Zigzag的使用方法二 作为画趋势线的连接点 趋势线是很常见的技术指标,在技术分析中被广泛地使用。 但一直以来趋势线在实战中都存在一个BUG,那就是难以保证划线的一致性。 在图表上有很多的高低点,到底该连接哪一个呢?不同的书上画趋势线的方法
FREE
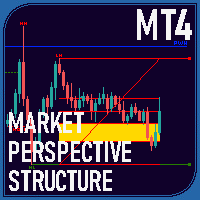
Overview The Market Perspective Structure Indicator is a comprehensive MetaTrader indicator designed to provide traders with a detailed analysis of market structure across multiple timeframes. It identifies and visualizes key price action elements, including swing highs and lows, Break of Structure (BOS), Change of Character (CHOCH), internal structures, equal highs/lows, premium/discount levels, previous levels from higher timeframes, and trading session zones. With extensive customization opt

This Expert Advisor is a pure scalping system. The expert place and manage pending orders. Runs perfect on pairs with tight spread and low commission broker (commission plus spread equal or less than 1.0 pip). Choose a broker with zero stop level and fast execution to use expert.
Pairs and Time Frame Pair: eurusd Time frame: M1 Default settings are good for eurusd.
Information Please test expert on demo account first, before uses it on real account. Have on your mind, all scalpers are sensiti
FREE

SMARTMASS INDICATOR This indicator is different from all known volume indicators. It has a significant distinction; it is an algorithm that relates price movement to volume, attempting to find proportionality and efficient movement while filtering out noise and other movements that are more random and do not follow a trend or reversal. Ultimately, it reveals the true strength of the movement, indicating whether it has genuine support from bulls or bears or if it's merely a high-volume movement

Special offer in honor of the New Year and Christmas!! https://www.mql5.com/ru/users/bossik2810
Trend Filter Pro
Trend filter indicator.
Very good filter for your trading system, I recommend to use it together with - System Trend Pro or Quantum Entry PRO
The indicator no repaint!!!
Settings:
Change the Period parameter for better filtering ( default is 90)
Any questions? Need help?, I am always happy to help, write me in private messages or
In Telegram: https://t.me/Trader35_Admin
FREE
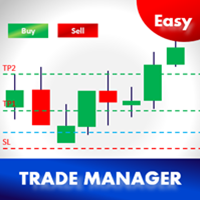
New version with Panel updated..! (Thank you users for all your great feedback!) -
Enter the Risked Amount or Lot size or % of Balance (New!) Drag the RED line on the chart to fix the Stop-Loss. Drag Blue line (New!) for Limit/Stop orders automatically ! Adjust TP1, TP2 and TP3 lines You are ready to Buy/Sell > Adjust the lines even after the trade - New!
Check the user video - https://tinyurl.com/etmmt4ea
Automatic Breakeven TP1/2 | Book Part/Partial Profit TP1-TP2 | Automatic Magic Trail TP1

QuantumAlert Stoch Navigator is a free indicator available for MT4/MT5 platforms, its work is to provide "alerts" when the market is inside "overbought and oversold" regions in the form of "buy or sell" signals. This indicator comes with many customization options mentioned in the parameter section below, user can customise these parameters as needful. Join our MQL5 group , where we share important news and updates. You are also welcome to join our private channel as well, contact me for the p
FREE

False Breakout Stochastic to be used with our Elliott Wave Indicator as part of the overall strategy on trading the 5th wave.
As we cannot upload multiple files, we have listed this separately. False Breakout Stochastic is best used as a confirmation tool rather than the sole signal indicator The Elliott Wave Indicator Suite is designed around a simple but effective Swing Trading Strategy. The Indicator Suite is great for Stocks, Futures and Forex trading on multiple timeframes You can find the
FREE

INFOPad is an information panel that creates information on the selected currency pair in the MetaTrader 4 terminal. There are 5 functions of this indicator: Shows the main and main information on the selected symbol: Ask BID, Spread, Stop Level, Swap, Tick value, Commission prices; Shows the future targets of SL target and TP Target (The number of points of the established stop loss and take profit, the dollar amount); It shows the profit received for the periods: Today, Week, Month, Year, Tot
FREE

Overview:
The Coloured Parabolic SAR Indicator is a visually enhanced trading tool designed to make trend-following and trade identification easier. This customizable indicator provides clear visual cues with color-coded signals for bullish (buy) and bearish (sell) trends directly on your MT4 chart. Key Features: Color-Coded Signals : Lime green "o" symbol for Buy signals. Red "o" symbol for Sell signals. Customizable Inputs : Adjustable Step and Maximum parameters to fine-tune the Parabolic SA
FREE

The indicator displays overbought and oversold levels, calculating them using the Fibonacci golden ratio formula.
It enables both trend-following and counter-trend trading, accommodating breakouts and rebounds from these levels.
It operates on all timeframes, across various currency pairs, metals, and cryptocurrencies.
Suitable for binary options trading.
Key Features: Based on the Fibonacci golden ratio Shows overbought and oversold levels Suitable for market and pending orders Simple
FREE
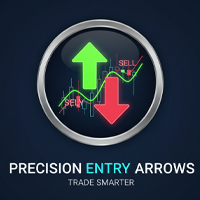
Precision Entry Arrows: Never Miss a High-Probability Trade Again! Stop guessing and start trading with confidence. The Precision Entry Arrows indicator is a sophisticated, all-in-one tool designed to deliver high-quality, non-repainting Buy and Sell signals directly on your chart. It expertly combines the power of MACD , Stochastic , and a unique EMA 5 Cross to pinpoint exact entry moments , then filters everything through a long-term EMA 200 to ensure you are always trading with the major tre
FREE

''Trendlines'' is an Indicator, that every Trader need and shows Trendline and Support and resistance levels in all Timeframe's. Also In 1-hour, 4-hour and daily time frames and Current timeframes, support, and resistance levels are specified and trend lines are drawn so that the trader can see all levels on a chart. In Properties it is possible to turn off unnecessary Lines.
In ' Tendency indicator '' , as full package of Predictions that every Trader need, there is also the Predict
FREE

Discover the Power of Trend Strength Pro Unlock a new level of clarity in your trading with Trend Strength Pro , the ultimate tool for visualizing market momentum. Stop guessing and start seeing the true strength of a trend with a single glance. Our elegant and intuitive indicator helps you make smarter, more confident trading decisions. Key Advantages & Features Instantly See Trend Strength : Our color-coded histogram tells you whether the trend is getting stronger or weaker. Green means moment
FREE

Price Action Indicator gives you reverse or even continous trend signals depending on your timeframe and Strategy used. !!!This is not a holy grail indicator and it will not give 100% winning rate!!! As you can see, it is not giving a lot of signals because of the price movements in side way (flat) trend. You can use it on every major currency pairs and even on indices. Please be aware of using this indicator with other strategies and indicators. Use MM and Risk Management properly. Sometimes
FREE

Expert Advisor designed for trading Engulfing Candle Patterns within a manually input price range the D point of harmonic patterns , gartley , bat cypher butterfly ect. This is the full version , word test in the title is an error How Does It Work
Step 1 Identify a price range around the end point D of your harmonic pattern. Input two prices into the EA settings Inp9 Upper Level- type the highest price where an engulfing candle pattern can occur. Inp9 Lower Level - type the lowest price whe
FREE
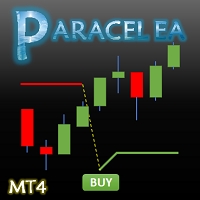
Paracel EA is an advanced and fully automated Expert Advisor designed to help traders navigate the complexities of the financial markets. Using a sophisticated strategy based on the Supertrend indicator and another built-in indicator, Paracel EA can analyze market conditions and identify trading opportunities with remarkable precision. The EA is equipped with a range of powerful features, including martingale functions, to help maximize profits and minimize risks. Whether you're a seasoned trad
FREE

Martingale Gaps is a fully automatic, professional trading robot, designed specifically for the foreign exchange market EUR USD M30 . It is specially designed for those who want to start with little money in automatic trading. Of course with minimum lot. For others, increasing the risk is enough. This EA does not need to configure parameters. Ready to work on EUR USD M30 . Input and output orders are based on are based on two indicators: Moving Average, Balance of Power. If account equity drops
FREE

Only EA developed over 1 year ago, which remains consistent in the market and in the #10 Top of the MQL Store
>>> You can use this EA with a balance starting at $30 in a cent account. Doubts about which broker and how much balance you need to trade, send me a message <<<
Summary:
Samurai Scaper Pro Series EUR/USD is an EA developed to run the EUR/USD on 5 MINUTE timeframe. This EA uses statistical analysis applied to the EUR/USD over 20 years to determine the best points of e
Immerse yourself in a trading environment where adaptability meets precision. Dynamic Grid Pro v1.7 offers a suite of tools designed to refine your approach in the market. This system was developed with the intention of providing a flexible framework for the execution of grid trading strategies. Its core functionality lies in the ability to dynamically adjust grid parameters in response to ever-changing market conditions. Features of Dynamic Grid Pro v1.7: Dynamic Grid: The system automatically

This Expert advisor does not do any trade, but it scans the whole symbols in your market watch and scan each shares one by one in different timeframes and at the end it shows you which symbol in which timeframe has a powerful engulfing candle. Furthermore, you can define a MA period and a high and low RSI limit, and it shows you which symbols in which timeframe is going to cross the adjusted moving average, and which symbol in which timeframe is going to cross high or low limit of the RSI. The
FREE

TILLSON MOVING AVERAGE Also known as TMA or T3 indicator. It is a moving average that uses EMA and DEMA in its formula and is calculated with the 3rd degree Binomial expansion. Pros; 1- erroneous signals encountered in other moving averages ( continuous zig zag ) has been reduced as much as possible. 2- prevented the delays seen in classical moving averages . 3- Very successful in trends Cons 1- It is not effective in horizontal markets. Setting parameters; period ; Altho
FREE

The free version of the Hi Low Last Day MT4 indicator . The Hi Low Levels Last Day MT4 indicator shows the high and low of the last trading day . The ability to change the color of the lines is available . Try the full version of the Hi Low Last Day MT4 indicator , in which additional indicator features are available : Displaying the minimum and maximum of the second last day Displaying the minimum and maximum of the previous week Sound alert when crossing max . and min . levels Selecting an arb
FREE
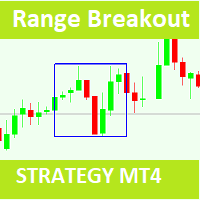
Range Breakout Expert Advisor (EA) for MetaTrader4
PS : This Expert Was Downloaded over 1200 Time , When we reach 2000 Download i ll increase the Price
Key Features: Fixed Lot Size / Martingale Option: Fixed Lot Size:* The EA allows you to set a constant lot size for each trade. Martingale Option:* Alternatively, you can enable the Martingale strategy, which increases the lot size after a losing trade to recover losses. Trading Between Specific Times: The EA only opens trades wit
FREE

The HedgeFund Experiment This is a basic version of the professional version; The HedgeFund Manager https://www.mql5.com/en/market/product/85241 It is a multi-currency EA that needs only to be loaded in one chart. It will access all Forex pairs or CFD provided by your broker and will only trade those with a spread less than or equal to MaxSpread specified in the settings. It uses standard Metatrader4 indicators to generate signals but with a customized trend filter to pick which pairs to includ
FREE

RRS Scalping is based on the Grid strategy, which involves increasing the lot size opposite to the price movement and waiting for recovery. Grid is usually a very medium risk technique, but this EA is built on well-calculated mathematics to minimize drawdown, reduce risk, and maximize profits. Refer for information about EA settings : https://docs.google.com/document/d/1cvg-qVqGrU5OaNUfd9AErpLSqYQ9gVcGd0tujWrKxFI/edit?usp=sharing Please share your experience, feedback, and trading reports. Good
FREE

Price Alert Eval MT4 Stay ahead of market movements with real-time price alerts. Simply set up an alert, add it to your alert list, and receive notifications the moment your specified price is reached. Alerts appear directly within the chart for instant visibility, and if you've enabled push notifications under Tool > Options > Notifications , you'll also be informed via the MetaTrader app on your phone - keeping you connected wherever you are.
Widget Categories Trading Tools Trendline Tradi
FREE
Session Timers (MT4) Session Timers adds a clean ribbon at the bottom of the chart showing the time until open and time until close for major FX sessions. While a session is open, a progress bar fills in real time. This is a charting utility; it does not provide trading signals and does not guarantee any profit. Sessions covered Sydney Tokyo Frankfurt London New York Main functions Countdown to the next session open/close for each market. Live progress bar while a session is active. Works on al
FREE

The ADX Indicator is known to be used to determine the trend direction. Not only that, but it also has deviation (+DI and -DI) that determine the direction of the trend as well. The role of the indicator is to spot the trend and its direction and generate signals accordingly.
Indicator Settings: - ADX period : default is 14 periods (it works best with the timeframe H1). - Signal Width : the size of signals arrows. - Signal Distance : the distance of the signal arrow from the candle. - Signal co
FREE

Bollinger Bands Breakout Alert is a simple indicator that can notify you when the price breaks out of the Bollinger Bands. You just need to set the parameters of the Bollinger Bands and how you want to be notified.
Parameters: Indicator Name - is used for reference to know where the notifications are from Bands Period - is the period to use to calculate the Bollinger Bands Bands Shift - is the shift to use to calculate the Bollinger Bands Bands Deviation - is the deviation to use to calculate t
FREE

The strategy primarily uses the MACD technical indicator, always following the direction of the major trend, and opens trades when the M1 chart shows a trigger signal.
It is suitable for trading the gold XAUUSD chart and can also be applied to other commodities with clear trend performance. Parameter Description
Long/Short Switch: Turn on to enable
Account Balance: $1,000 or $10,000
For a $1,000 account, it is recommended to trade one order at a time.
For a $10,000 account, you can optionally e
FREE

DrawRectangular EA
The Expert draws Renko rectangles and the levels of development of the following "bricks" directly on the chart, can be used as an indicator. The order may be opened on or against (sets in the settings) the trend, depending on the size of the shadows of the last two Renko bars. Expert features:
No more than one order per symbol; You must set the size of the last two shadows: "from" and "to"; Management of lot size depending on the deposit; Adjustable size Renko bar; Pending
FREE
Do you know why the MetaTrader Market is the best place to sell trading strategies and technical indicators? No need for advertising or software protection, no payment troubles. Everything is provided in the MetaTrader Market.
You are missing trading opportunities:
- Free trading apps
- Over 8,000 signals for copying
- Economic news for exploring financial markets
Registration
Log in
If you do not have an account, please register
Allow the use of cookies to log in to the MQL5.com website.
Please enable the necessary setting in your browser, otherwise you will not be able to log in.