Watch the Market tutorial videos on YouTube
How to buy а trading robot or an indicator
Run your EA on
virtual hosting
virtual hosting
Test аn indicator/trading robot before buying
Want to earn in the Market?
How to present a product for a sell-through
Expert Advisors and Indicators for MetaTrader 4 - 73

O Afastamento da Média Móvel, é uma poderosa ferramenta de análise técnica projetada para fornecer uma representação visual do afastamento entre o preço atual e uma média móvel específica. Este indicador, desenvolvido para o MetaTrader, oferece aos traders uma perspectiva clara das mudanças na dinâmica de preço em relação à tendência de médio prazo. Versão MT5: https://www.mql5.com/pt/market/product/111704
FREE
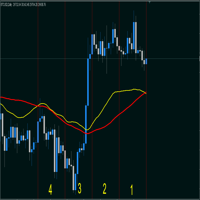
Индикатор суммируеn две средние скользящие, заданные в настройках и умножает на 2. (A + B)/2; Сдвиг на графике - смещает линию на графике.(ВАЖНО! учитывайте сдвиг на графике и сдвиг линии они суммируются, Т.Е. если смешение линий задано 50 и смещение на графике заданно 50 суммарно сдвинется на 100). Метод усреднения и тип цены классические как в средних скользящих. Период - колицество свечей для расчета. По умолчанию индикатор показывает среднею скользящию с периодом 26.
FREE

The indicator is a 15-minute signal indicator for all types of traders. Meaning, you could make lots of profits trading two different signals in one indicator.
NOTE: Both indicators are channels for achieving the same result. RED ARROW -- Sell Signal BLUE ARROW -- Buy Signal
Purchase now to be part of our community. We offer standard chart setups for both novice and intermediate traders. Trade with ease!
FREE

FXO BROKER SPREAD INFORMATION
Floating spreads are harmful for your trading strategy, even with Raw spread account. it makes a lot difference.
Floating spread goes too high when it's news time or daily or weekend rollovers.
this can affect trades's Expert Advisors, Pending orders and Stop losses.
Therefore this tool is created to find right information about spread while rollovers.
How to use :
download/paste the program file to Expert Advisor folder,
Open a chart of any instrument, Lo
FREE

Infometer индикатор для вывода информации в одном из углов - сколько пунктов (пипсов) или в валюте депозита профита во всех отрытых ордеров данного торгового инструмента. В меню индикатора внесены такие данные 1. Угол вывода информации. 2. Цвет вывода информации. 3. вывод валюты депозита и пипсов. 4. Выбор вывода информации - профит и пункты - профит -пункты. На белом фоне автоматически информация выводится черным цветом на других фонах цвет вывода информации определяется в меню.
FREE

This script generate close order history to a text file including order information such as - TicketNumber, OpenTime, Type, Volume, Symbol, - Price, S/L, T/P, CloseTime, Price, Commission, - Swap, Profit, MagicNumber, Comment
Text File located at \MQL4\Files Please leave a comment or send me an email if you have any idea. #FF8,#FF10,#FF11,#WayneClassIsTheBest Email: fxac19@gmail.com
FREE

The London Stock Exchange Session's Hours
This indicator facilitates observing the currency pair's quotations during subsequent parts of the stock exchange session live. Before the session starts, a rectangle is drawn on the chart but not filled in with color. It means the extent of the session duration. Before the first bar enters the rectangle of the session, a sound signal or pop-up window will notify us that the session will just start. When the price graph crosses the edge of the session
FREE

Magneto Power MA - трендовый осциллятор. Основан на классическом индикаторе moving average, но при этом имеет нестандартный способ интерпретации. Здесь нет никаких фокусов с пересечениями мувингов, только гибридная работа MA и волатильности инструмента. При этом при должной настройке может составить конкуренцию дорогим и сложным аналогам. По гистограмме индикатора легко определить текущую тенденцию, а так же исчерпало себя движение цены или ещё нет. Настройки индикатора аналогичны классическому
FREE

Идея индикатора очень проста и скорее всего пригодится тем, кто используют линейный график для технического анализа. Что-бы устранить "неровности" (-: линейного графика и был написан этот индикатор. Линия графика соединяет цены закрытия свечей, как и в классическом линейном графике, но игнорирует цены, которые шли в направлении линии и новый экстремум возникает только тогда, когда цена закрытия последней свечи явно ниже или выше предыдущего значения. Это облегчает визуальное восприятие при поиск
FREE

n3oNpLoX Trade Manager Market Order. Stop Order. Limit Order.
To help you Place trades based on the amount of Money in Dollars you want to risk. As it will show in the screenshots you can calculate the right Lot size for the money you want to risk. Calculates Lot Size based on the distance between Stop Loss and Entry Point. 5 Options for TP - (1RR,2RR,3RR,4RR,5RR)
It will help you manage your risk and Place trades with the correct Lot Size. So you will not over expose yourself and your money
FREE

MT4 Sinyalleri Telegram EA'ya - Daha Akıllıca Ticaret Yapın, Güncel Kalın! Güçlü MT4 Sinyallerimizle Telegram EA ile yatırımlarınızı hızlandırın! Gerçek zamanlı yatırım sinyallerini, kâr güncellemelerini ve SL/TP değişikliklerini doğrudan MT4 platformunuzdan Telegram kanallarınıza sorunsuz bir şekilde gönderin. İster Forex, ister Endeks veya Kripto para ticareti yapın, anında bildirimlerle kontrolü elinizde tutun. Temel Özellikler: Gerçek Zamanlı Sinyaller : Anında işlem açılış, kapanış ve deği
FREE

The purpose of this new version of the MT4 standard indicator provided in your platform is to display in a sub-window multiple timeframes of the same indicator. See the example shown in the picture below. But the display isn’t like a simple MTF indicator. This is the real display of the indicator on its timeframe. Here's the options available in the FFx indicator: Select the timeframes to be displayed (M1 to Monthly) Define the width (number of bars) for each timeframe box Alert pop up/sound/ema
FREE
Moving Averages Divergence 3x3 Indicator uses the crossover technique for signaling the market trend and the trade opportunities as well. It applies 3 formats of the same indicator and allows them to plot the crossover signals which are interpreted as the trade signals along with the direction of the market trend. Moving Averages Divergence 3x3 Indicator can be applied to trade all kinds of forex currency pairs within the financial markets. Although, this indicator works well o
FREE

iSTOCH in iMA is an indicator which applies the stochastic changes to the iMA. Changes are reflected by altering the moving average colors. It is a useful tool to see easily the upsides or downsides of the stochastic.
You can to get source code from here .
Parameters MA_Periods - iMA period. MA_Method - iMA method. K_Period - K line period. D_Period - D line period. Slowind - slowing. STOCH_MA_METHOD - averaging method for MA. PriceField - price (Low/High or Close/Close). STOCH_LevelUp - uptre
FREE

The indicator allows you to trade binary options. The recommended time frame is М1 and the expiration time is 1,2,3 minutes. The indicator suitable for auto and manual trading. A possible signal is specified as a arrows above/under a candle. You should wait until the candle closes! Arrows are not re-painted Trade sessions: TOKYO section (Half-end) Currency pairs: USD/JPY Working time frame: M1 Expiration time: 1,2,3 minutes. The indicator also shows good results when using the martingale strateg
FREE
StrxInfoPanel is an essential tool for every trader It gives you an immediate idea about your account and realtime informations about the current symbol and timeframe you are analyzing Every information line can be hidden and shown via parameters, even panel position can be changed via input parameters Parameters list: Corner : the screen corner where you want the panel to be shown Left, Top, and Width : customizable position and panel dimensions BgColor : background color Show XXX : every infor
FREE

ManageEquity - A Powerful Trading Utility for Risk Management ManageEquity is a simple yet powerful trading utility designed to enhance risk management strategies. By attaching this utility to a single chart and specifying the maximum dollar amount for both profit and loss, traders can effectively manage their open orders. With ManageEquity, traders can easily set their desired profit target and maximum acceptable loss for all open trades. Once the profit target is reached or the maximum loss th
FREE

EMA Above Below Bid price Технический индикатор в помощь трейдеру. Данный индикатор, показывает расположение пяти ЕМА,
пяти средних скользящих, относительно цены формирующей японские свечи или бары (цена Bid ).
О понятии ЕМА.
Скользящая средняя (moving average, MA) — это дополнительная линия на графике цены актива.
Внешне она повторяет график цены, но с небольшим запозданием и более гладко, без колебаний. Основные характеристики:
1. Показывает тренды. Если скользящая устремлена ввер
FREE

TPP : Turning Point Pattern The indicator shows the market Turning Point Pattern as arrows. The reversal signals are based on observation of price action and market behavior. It is based on the principles of searching for extremums, volatility, and candlestick pattern. The indicator provides signals on the following principles: Search for the end of the ascending/descending trend Search for the reversal pattern based on candlestick pattern Confirmation of the reversal by the volatility. The in
FREE

MA Cross Histogram Oscillator (MT4) The MA Cross Histogram Oscillator is a custom indicator designed to visualize the relationship between two moving averages in the form of a color-coded histogram. Instead of drawing standard MA lines on the chart, it highlights the strength and direction of the trend by comparing the difference between a fast and a slow moving average. Green bars – bullish momentum (fast MA is above slow MA and rising). Red bars – bearish momentum (fast MA is below slow MA and
FREE

Network EURUSD - сеточный советник, настроенный для торговли валютной парой EURUSD. Для определения моментов для открытия сделок советник использует несколько индикаторов. Рекомендуемый период графика для торговли с настройками по-умолчанию - M15.
Настройки: Take profit
Размер тейк профита
Volume
Размер лота
Balance
Баланс для расчёта лота. Если ноль, то лот будет фиксированным
Period for indicators Период для индикаторов.
FREE

Detailed post explained:
https://www.mql5.com/en/blogs/post/759269
This is a slope indicator for Bollinger Bands indicator. It provides slopes for BB top band, center band (main) and Lower Band. You can also set a threshold value for Center line to control Red/Green slope histogram lines. Settings:
You can choose which line you need the slope and Threshold Alerts for in Drop down.
Slope Thresholds: for Alerts. Please note that Alerts only happen when Threshold is crossed. e.g.: If Threshold
FREE

Handle orders for different magic -1 for all magic, 0 for manual orders, 1-XXXXXX for EAs For example, if you want to control orders from EA with magic 3333, your manual orders, type 0;3333 Close on exact time, example. close order every XX:15 --> Close all on 00:15, Close all on 11:15, Close all on 12:15... Close on Loss, close the loss for single order, close the loss for the whole magic number.
Parameters Description (-1 for all magic)(0 for manual orders)
List of the magic to check - 0;1;2
FREE

MWC COX indicator shows the extreme zones of net short/long positions for four periods of time. Default settings are periods of 12, 26, 52 and 156 weeks.
Additional Features
- Displays the sum of all 4 periods in one line
- MA, MOM and RSI indicators are integrated
Please make sure that you download the MWC_Demo.zip file and unpack it into [...]/MQL4/Files folder. -> www.myweeklycot.com/teaser-demo
FREE

SkalpAUDNZD is a highly accurate and reliable advisor for trading the AUDNZD currency pair( time frame М5) . The advisor does not have dangerous technologies such as martingay, grids and averaging and is therefore safe for a trading account. Orders are closed using a signal or take profit and stop loss; the advisor forcibly closes orders on the opening day. The advisor opens only one order at a time and all orders are protected by a fixed Stop Loss. The advisor is easy to use, as it has few para
FREE

A classic indicator with advanced features for more accurate display of the market situation. All settings of all moving averages are available, such as the moving average type and the priced used in its calculation. It is also possible to change the appearance of the indicator - line or histogram. Additional parameters provide the ability of fine tuning.
Distinctive features Does not redraw. Additional parameters for fine tuning. Displayed as a line or as a histogram. Works on all timeframes a
FREE

A new interpretation of the classical indicator in the form of an oscillator for a more accurate representation of the situation on the market. Less lagging than the standard Alligator. All settings are fully accessible, such as the type and prices for which it is built. Thanks to the additional parameters, it became possible to fine tune.
Distinctive features Does not redraw. Additional parameters for fine tuning. Works on all timeframes and symbols. Suitable for manual trading and developmen
FREE

HelloTrader is a completely new product view for the MetaTrader platform. Immediately after launching, the utility displays randomly one of the lines of the phrase, quotes of famous people or an aphorism in the upper left corner of the terminal. Every 5 minutes the recording changes. The Demo version includes 32 phrases, quotes or aphorisms in English only.
The utility starts working immediately after launch and no longer has any settings or functions. The only task is to randomly display quot
FREE

The indicator draws two simple moving averages using High and Low prices. The MA_High line is displayed when the moving average is directed downwards. It can be used for setting a stop order for a sell position. The MA_Low line is displayed when the moving average is directed upwards. It can be used for setting a stop order for a buy position. The indicator is used in the TrailingStop Expert Advisor. Parameters Period - period of calculation of the moving average. Deviation - rate of convergence
FREE

Welcome to the World of our Trade Copier via Internet *whatever is the technology we can copy trades from/to MT4 platforms. You can trade manually from your mobile phone or you can attach your trading robots (EA) to your master account(s) and the trades will be copied to all your usersaccount(s). Our trade copier is not self-hosted, it means that you need to keep your computer or VPS running, everything is managed via internet.
Everything works Via Internet! ( Please add the address "
FREE
Discover IT MACD Crossover, your ultimate ally for maximizing your profits in the foreign exchange market. Our Expert Advisor (EA) leverages the powerful MACD technical indicator to execute trades automatically with unparalleled precision.
Key Features:
- MACD Crossover Strategy: IT MACD Crossover is based on the proven strategy of MACD crossover to identify trading opportunities. Crossings between fast and slow exponential moving averages (EMA) trigger buy or sell signals, suitable for all m
FREE

The demo version is limited to the currency pair CADCHF. The product with complete description and video can be found here: https://www.mql5.com/en/market/product/23310 The Trading Assistant can apply automatic exits, set pending orders when trading is closed, scale trades and much more. The tool is easy to handle and clear, it works smoothly with one or more orders.
Features Scheduling of pending and market order - useful for time based strategies or for preparing an order when the market is
FREE

About : Based on the strategy identified at https://tradingstrategyguides.com/williams-percent-range-strategy/ but automated to support multiple currencies from a single expert advisor instance. Also uses the SMA slow and fast crosses to determine the trend direction. The basis for the external strategy is to open a BUY trade when Williams %R crosses the -50 on an uptrend and open a SELL trade on the down trend. You have control over the trend period and Williams %R range from the midpoint throu
FREE

This Dashboard is free to download but is dependent on you owning the Advanced Trend Breaker . Get the indicator here: https://www.mql5.com/en/market/product/66335
The Dashboard will show you on a single chart all the timeframes (M1 to Monthly) with their own status for the indicator: Advanced Trend Breaker
all time frame and all symbol: smart algorithm detects the trend,Support and resistance, filters out market noise and find breaker of entry signals!!!
!!!
How to understand th
FREE
An indicator for analyzing different currency pairs simultaneously Forex is a complex market that requires several currency pairs to be analyzed simultaneously Determine the number of currency pairs yourself Determine the currency pair you want to analyze to analyze 4 of the most important and similar currency pairs at the same time. For direct and simple analysis, some currency pairs have changed (EURUSD>>>USDEUR) Do not doubt that to succeed in this market, you must analyze several currency pa
FREE

Note: This is a Limited Edition of Lion Grid . It works only on Mondays.
The trading strategy has been been created by using machine learning algorithms to build a model directly from the historical data. Machine learning is an application of artificial intelligence (AI) that provides the ability to automatically learn and improve from experience without being explicitly programmed. The strategic focus of this robot is to identify trend reversals by analyzing multiple technical indicators (
FREE

Protect your account from Margin Call when the market is going opposite with your trades. Manage your risk when you're using Martingale, Grid, Average . They are not dangerous anymore, but manageable Use this EA utilities to accompany your every MT4 installation This EA is a utility to protect your capital when your trading are unfavorable : Maximum loss in money, Maximum Draw-down/ equity loss in percentage, Your minimum equity reached Those are whichever reached first It's simple, straightfor
FREE

The DJ_15_811543657_S_BB_CF_SQX is an algorithmic trading strategy for MetaTrader, tested on DJ using the M15 timeframe from December 7, 2017, to June 2, 2023. There is no need to set up parameters, all settings are already optimized and fine-tuned.
Recommended broker RoboForex because of EET timezone.
You can find the strategy source code for StrategyQuant at the link: https://quantmonitor.net/dow-jones-bollinger-breaker/
Key details are:
MagicNumber: 811543657
Main Chart: Current s
FREE

The indicator represents 4 moving averages, shifted back. Created, like any moving average indicators, in order to see the approximate balance of volatility and the number of bulls and bears. The difference from other Moving Averages is that an attempt is made here to bring the moving averages of different periods to a common denominator, respectively, to bring the number of traders trading on different timeframes to a common denominator. The indicator is distributed as is.
MnojitelMA1, Mnojit
FREE
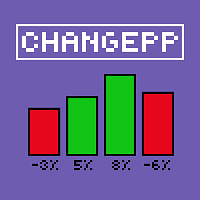
About the ChangePP indicator
The ChangePP indicator displays the percentage price change for the selected period according to the selected parameters and builds the corresponding bars in the indicator subwindow.
Clicking on a bar or pair name opens the corresponding chart with the period specified in the input parameters.
Without a doubt, the ChangePP trading indicator will be useful for traders using the correlation of currency pairs, as well as for analyzing the situation on the market.
FREE
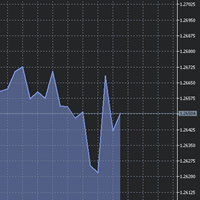
The utility Filled Area Chart adds to the standard set of price presentations. It is a brand new, nice price chart. You will certainly like it if you want to feel yourself a trader born under the Bloomber lucky star.
The Properties allow to set the colors and other things: Color preset - choose a preset or set to "Custom" and set your own colors using the properties below.
Custom area color - color of the area below the price line. Works only with Color preset = Custom.
Custom chart color - col
FREE

The SyncAllCharts indicator streamlines trading by automatically aligning all open MetaTrader 4 charts to the symbol of the chart where it’s applied, saving traders time and effort when analyzing a single asset across multiple timeframes or setups. With a customizable "Main Sync" label to identify the lead chart, it ensures a clear, clutter-free workspace, enhancing workflow efficiency and consistency for traders monitoring one currency pair or symbol.
FREE

Virtual Trailing Stop Start, Trailing Stop and Trailing Step with TakeProfit and Stoploss Virtual Lines And Sound Alerts are included. Brake brokers limitation. You can put even 1 point trailing stops and take profit levels. Best EA for protecting your profits and scalping. MT5 version of this product in on the way. Point Multiplyer 1 means 1 point. You can adjust Multiplier point.
FREE
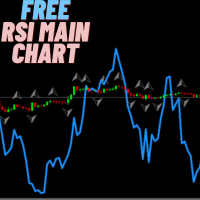
This indicator functions similarly to the traditional Relative Strength Index (RSI), but it's integrated directly onto the main price chart. This setup allows traders to more easily identify price fluctuations and recognize conditions of overbought or oversold markets. By observing the indicator in conjunction with price movements, you can gain valuable insights into potential trend reversals or continued momentum. Keep an eye on these signals to enhance your trading strategy. Happy trading, eve
FREE

Представдяю вашему вниманию Trall StopLoss. Посмотрим что он умеет;)
#Order сразу выставляем в 0!!!
#Start это через сколько пунктов начнет срабатывать трал.
#Distance первая дистанция с которой начинает работать трал.
#DistanceTrall это стандартный трал, который просто смещает StopLoss на заданное количество пунктов.
#SL устанавливает StopLoss на заданное количества пунктов.
#MultiplicationTakeProfit устанавливает TakeProfit = SL*MultiplicationTakeProfit
#Trall а вот здесь начинается ин
FREE

This pointer is supplied of a double smoothing in such way to succeed to be more reactive of a blunt Moving Average but without tracing the noises of bottom of the market. Its use will have to be exclusively turned to the search and to the identification of the trend in action (even if graphically it could seem an indicator that indicates an inversion of the prices) because the first useful signal is had to the opening of the successive bar to that one that has made to invert the sense of the
FREE

Current Pips and Money Profit This indicator displays the results of the currently open position on the graph. Result in pips and in the invoice currency. Thanks to this, you can enlarge the chart to the entire screen and have control over the result of trading without opening a terminal window which takes a space of a screen. The display positions of this data can be adjusted at the user's discretion and colors also.
FREE

Forex trend omega is a trend following indicator which filter market noice to make perfect entries to follow the trend or spotting trend reversals. The possibilities are endless for the use of this indicator, you can use it on any timeframe to find trends matching your trading strategy. The BEST thing about this indicator it does NOT REPAINT . This makes it a very unique indicator and is a MUST HAVE in your indicator portfolio. The indicator is really simple to use because it can be used with de
FREE

Activation initiates the sequence from the initial symbol in the Market Watch roster, forming a perpetual loop that continues until deactivation. The system employs global terminal variables to sustain operational continuity amid symbol-induced reinitializations, thereby ensuring uninterrupted performance. This EA should not be checked off as 'Allowed live Trading' and is functional with that checkmark box, when uploading the EA. Principal advantages encompass augmented productivity in overseein
FREE
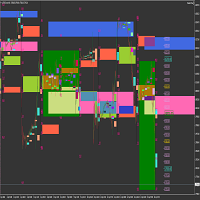
Market Viewer This utility seeks to assist the trader in identifying potential areas of interest on the price chart. Different components integral to decision making have been automated, allowing the user to engage with perfectly calculated levels. Some components include the weeks initial balance, session Min and Max areas and a round number indicator altogether forming templates providing confidence to the trader. Have a look at the screenshots for a sneak peak into the components. The utility
FREE
If you like this product, please leave a 5 start review!
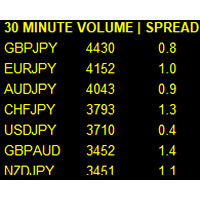
Monitors symbols and shows you which one are the most active for the 3 different time frames you select. Shows volume and spread as well. Good for scalpers or short term traders. Forex is 24 hours, so knowing which pair is active is key to entering with good spreads and catching moves in an active market. This utility attached to a chart and shows you which pair is active, the list is auto sorted, active pairs move to the top of the list.
FREE

The strategy used by this trading robot is placing stop orders (Pending) before the news event. The news event release time can be accessed from investment.com an app that the trader must download from play store into his/her mobile device. The robot places two stop orders, a Buy Stop and Sell Stop at the same time at least two minutes before news release time. For example, if the news release time is 15:30, the pending orders will be opened at 15:28(see how to insert the news time at screensho
FREE

Utility for reading news from investing.com
To access the site, you need to add WebRequest in the Options terminal menu on the Expert Advisors tab: https://sslecal2.investing.com
If reading is successful, a message about writing the file is displayed.
The INV_week_this.txt file is written to the MQL4\Files folder of the terminal and is kept up to date, updating data according to its own timer. The INV_week_last.txt file is recorded on Saturday and saves the news data of the previous week .
FREE

A utility to close all orders automatically. There are simple options as follows: - Close orders created by EA . - Close manually created orders. - Close orders by Symbol . - Close buy order separately. - Close sell order separately. - Close all orders. Please refer to the video for more details about our products:
We are ready to help you with the use of EA, Please contact us.
FREE

Индикатор выводит первые производные двух MACD. По умолчанию, желтая MACD является более быстрой, чем синяя MACD. В настройках можно задать подходящие вам параметры для каждой из MACD. Одновременное изменение знака производных может являться дополнительным сигналом разворота. Входные параметры
Yellow MACD fast EMA period Yellow MACD slow EMA period Blue MACD fast EMA period Blue MACD slow EMA period
FREE

Active Price Lines
Indicator gives you full custom control over the Bid and Ask price lines, both color and style. Color control is also customizable based on increased or decreased price by the tick.
Options include: Show both the Bid line and the Ask line Set unique color for each Set unique line style for each Set unique color for increased price (by the tick) Show only Bid line Show only Ask line
Rider Capital Group
FREE

THE LiveExpertVisitor
Please make this Change than the Robot Work. Stop Loss to 60 or higher and Take Profit to 2000 or 1000. Indize: DE40, US30 “IC Market or FTMO” Recomment Broker. This EA „LiveExpertVisitor“ BUY and SELL in one.
Only DE40 with this Standart Settings Stopp Loss 50 Take Profit 2000 or 1000.
For other Indizes or Pairs Set the Stopp Loss to actuall Spread and maximal the Take Profit x40 to Spread Points.
-Recomment M5
-minimum 1000$/€ ...Lot 1 in first Week
Strong Code for Err
FREE

This indicator allows to hide Ichimoku Kinko Hyo (on all MT4 timeframes) from a date define by the user, with a vertical line (Alone) or a panel (with "Hidden Candles"). Indicator Inputs: Tenkan-sen Kijun-sen Senkou Span B Information on "Ichimoku Kinko Hyo" indicator is available here: https://www.metatrader4.com/en/trading-platform/help/analytics/tech_indicators/ichimoku ************************************************************* Hey traders!! Give me your feeds! We are a community here
FREE
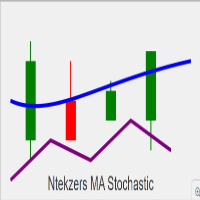
Please remember to leave a review for improvements thank you Overview of Key Functionalities: Buy Signal Conditions : The Stochastic Oscillator's main line crosses above the signal line. The closing price of the current candle is higher than the previous candle's close. The current closing price is above the EMA (Exponential Moving Average). The Stochastic value is below 50. When these conditions are met, a buy arrow is plotted, and alerts (audible or push notifications) are triggered. Sell Sign
FREE

Double Price Channel Price channel indicator for a certain number of bars specified in the settings.
Indicator lines represent dynamic support or resistance levels. The upper limit is the price maximum for a certain number of periods, the lower one is the minimum. Unlike moving averages, which are based on close prices, the indicator is not “distracted” by small fluctuations. It will be recalculated only if the boundaries change. If the latter happens, then it is worth seriously thinking about
FREE
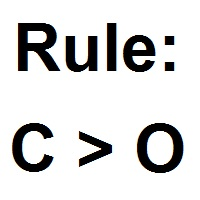
Patterns Wizard is a tool for creating candlestick patterns. With it, you can create various patterns and add as many instances of this indicator as you want on your chart, each with a different pattern. To better understand how creation formulas work, you can refer to the examples of the My Candle indicator, which has over 70 examples of candlestick patterns The main difference with this indicator is that it has 30 rule parameters , meaning you can set a different rule for each of the last 30 c
FREE
SK Stochastic Candle Moves EA based on Stochastic oscillator . It is used to generate overbought and oversold trading signals. Easy to use and Simple Max Drawdown protection No Martingale Recommended GBPUSD,EURUSD Timeframe M30,H1 others timeframes with the appropriate settings. Works for ECN/Non-ECN brokers and 2-3-4-5 digit symbols
A low latency vps is and an lower spread broker is always recommended. Support us by open My recommended broker. Exness Tickmill How its work ? Candles
FREE
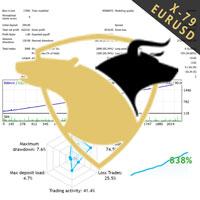
TraderX-79 uses non repainting home made indicatiors to predict the direction of the market. It has been trained over the years with Ai to efficiently predict market movement. Nothing is certain in life so does forex trading, However traderX-79 has managed to be right 70% of the time, And in the 30% of cases when it is wrong, we added a great reverse strategy inside which instantly activates to enable breakeven and not take any loses. This simple trick makes the robot really undefeatable on bot
FREE

Trend Rising is a custom MT4 ( Metatrader 4 ) indicator, use best for scalping on TF M30 and below that analyzes the trend and momentum pattern using Bill William Indicators on multiple timeframes. As the result, It identifies the beginning and the end of the trend that works for most currency pairs. The Trend Rising indicator is developed based on Accelerator Oscillator and Awesome Indicator. Key Features Identify the beginning and the end of the trend as display with colors. Identify eas
FREE

Buy and sell signals using the MACD histogram. The interface is simple and easy to understand. You can perzonalize the indicator in several ways according to its visual style or even more importantly, its setting of parameters to detect market signals. Using the Multiplier option in the menu you can increase the indicator period although it is recommended to use the default settings.
FREE

Stable Helper – Keep Your Trading Connection Uninterrupted! Ensure your MT4 stays connected and stable automatically! Stable Helper works silently in the background, monitoring your connection, rescanning servers, and even restarting MT4 if necessary—all without manual intervention. Designed to minimize downtime and optimize server performance , Stable Helper protects your trades from unexpected disconnections and latency issues. Key Features: 1️⃣ Real-Time Connection Monitoring
Constantly
FREE

Attention, for the indicator to work correctly, you need to put the "MQL5" folder in your terminal folder, you can download it from the link below: https://disk.yandex.ru/d/DPyo0ntaevi_2A
One of the best arrow indicators for Binary Options, which can also be used in the Forex market. Any time frame from M1 to MN, any currency pair, can also be used on stocks - the indicator is universal. Expiration from 1 to 5 candles. Displays traffic statistics on a graph. The indicator gives signals along th
FREE
Simple dashboard to view ATR value across multiple time frame, no need to click at any timeframe, we can see the overview of ATR quicker. Support changing value of ATR period. Download free! We already tested via Strategy Tester, nothing wrong. If you found something wrong just drop the comment below or contact me at site: https://youtube.com/@itwetrade
Email: itwetrade@gmail.com
--------------------------- Support for development: https://www.buymeacoffee.com/itwetrade
FREE

To the first 5 buyers for --> $45.99;
The Cat Trend VZ is a constantly improving indicator with accurate and profitable entry signals.
The Cat Trend VZ indicator line changes color depending on the trend direction, and the indicator draws arrows at the price reversal points.
In addition, The Cat Trend VZ indicator implements a sound and text alert about the appearance of an arrow.
IMPORTANT: THE INDICATOR DOES NOT REDRAW.
Main features of The Cat Trend VZ: Analytical functions It can b
FREE

MT4 trading tool. Intuitive Dashboard that allows effortless automated trading, saving 99 Strategies , Advanced Money Management , Automatic group orders : Global Take Profit / Stop Loss, Smart TP (Multi-Level, Position Recovery) and Smart SL (Breakeven, trailing Stop, Multi-Level), Exit Manager , Signals, Strength Indicator , ATR Graph, Price Alert, News Warning… # If you have any other requirements or are interested in collaboration, please contact (info@styxia.com)
Get more information
FREE
The MetaTrader Market offers a convenient and secure venue to buy applications for the MetaTrader platform. Download free demo versions of Expert Advisors and indicators right from your terminal for testing in the Strategy Tester.
Test applications in different modes to monitor the performance and make a payment for the product you want using the MQL5.community Payment System.
You are missing trading opportunities:
- Free trading apps
- Over 8,000 signals for copying
- Economic news for exploring financial markets
Registration
Log in
If you do not have an account, please register
Allow the use of cookies to log in to the MQL5.com website.
Please enable the necessary setting in your browser, otherwise you will not be able to log in.