Articles on trading system automation in MQL5

Read articles on the trading systems with a wide variety of ideas at the core. Learn how to use statistical methods and patterns on candlestick charts, how to filter signals and where to use semaphore indicators.
The MQL5 Wizard will help you create robots without programming to quickly check your trading ideas. Use the Wizard to learn about genetic algorithms.
Add a new article

You are missing trading opportunities:
- Free trading apps
- Over 8,000 signals for copying
- Economic news for exploring financial markets
Registration
Log in
You agree to website policy and terms of use
If you do not have an account, please register


William Gann methods (Part I): Creating Gann Angles indicator
What is the essence of Gann Theory? How are Gann angles constructed? We will create Gann Angles indicator for MetaTrader 5.


Optimizing Long-Term Trades: Engulfing Candles and Liquidity Strategies
This is a high-timeframe-based EA that makes long-term analyses, trading decisions, and executions based on higher-timeframe analyses of W1, D1, and MN. This article will explore in detail an EA that is specifically designed for long-term traders who are patient enough to withstand and hold their positions during tumultuous lower time frame price action without changing their bias frequently until take-profit targets are hit.

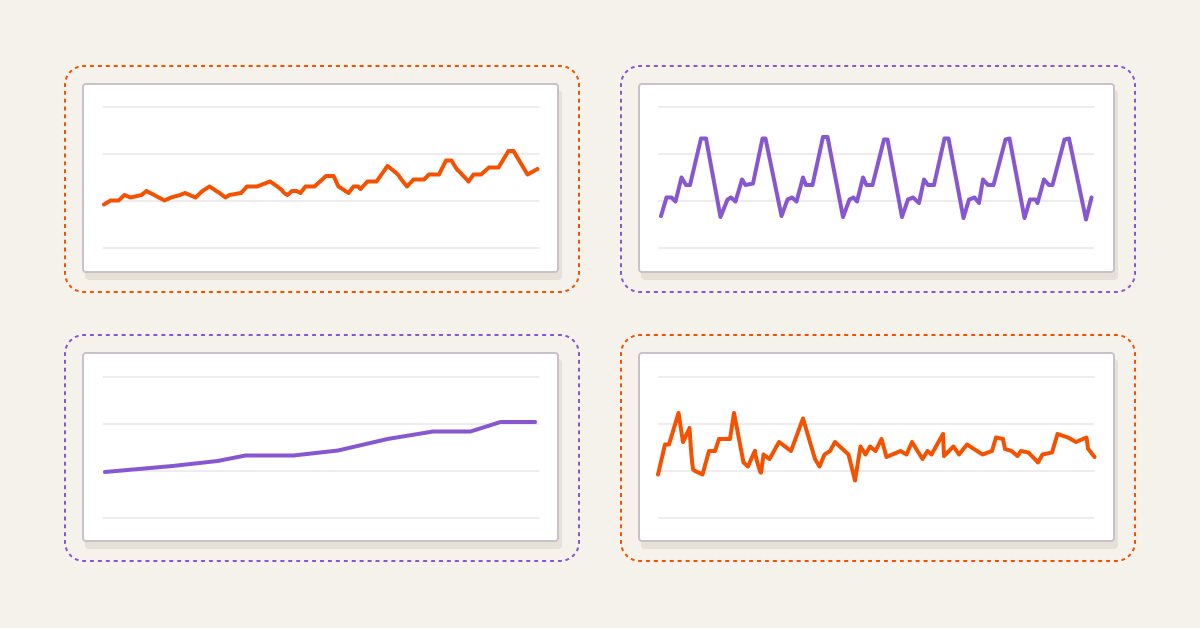
Forecasting with ARIMA models in MQL5
In this article we continue the development of the CArima class for building ARIMA models by adding intuitive methods that enable forecasting.


Automated grid trading using limit orders on Moscow Exchange (MOEX)
The article considers the development of an MQL5 Expert Advisor (EA) for MetaTrader 5 aimed at working on MOEX. The EA is to follow a grid strategy while trading on MOEX using MetaTrader 5 terminal. The EA involves closing positions by stop loss and take profit, as well as removing pending orders in case of certain market conditions.


Price Movement: Mathematical Models and Technical Analysis
Forecasting the movements of currency pairs is an important factor in trading success. This article explores various price movement models, analyzes their advantages and disadvantages, and explores their practical application in trading strategies. We will consider approaches that allow us to identify hidden patterns and improve the accuracy of forecasts.


Forex arbitrage trading: A simple synthetic market maker bot to get started
Today we will take a look at my first arbitrage robot — a liquidity provider (if you can call it that) for synthetic assets. Currently, this bot is successfully operating as a module in a large machine learning system, but I pulled up an old Forex arbitrage robot from the cloud, so let's take a look at it and think about what we can do with it today.


Creating an EMA Crossover Forward Simulation (Culmination): Interactive Synthetic Candles
This article finalizes the Forward Simulation Engine for MetaTrader 5 by calibrating synthetic candles to recent market volatility instead of using slope-only sizing. It samples average body, upper wick, and lower wick from closed bars, applies a sine-envelope with decay, proportional wicks, gaps between candles, and periodic counter-trend injections. The result is a live projection that advances one bar ahead, with code you can reuse for calibrated, anchor-based forward rendering and automatic cleanup.


Introduction to MQL5 (Part 14): A Beginner's Guide to Building Custom Indicators (III)
Learn to build a Harmonic Pattern indicator in MQL5 using chart objects. Discover how to detect swing points, apply Fibonacci retracements, and automate pattern recognition.


Statistical Arbitrage Through Mean Reversion in Pairs Trading: Beating the Market by Math
This article describes the fundamentals of portfolio-level statistical arbitrage. Its goal is to facilitate the understanding of the principles of statistical arbitrage to readers without deep math knowledge and propose a starting point conceptual framework. The article includes a working Expert Advisor, some notes about its one-year backtest, and the respective backtest configuration settings (.ini file) for the reproduction of the experiment.


Self-Learning Expert Advisor with a Neural Network Based on a Markov State-Transition Matrix
Self-training EA with a neural network based on a state matrix. We combine Markov chains with a multilayer neural network MLP developed using the ALGLIB MQL5 library. How can Markov chains and neural networks be combined for Forex forecasting?


Implementing the Generalized Hurst Exponent and the Variance Ratio test in MQL5
In this article, we investigate how the Generalized Hurst Exponent and the Variance Ratio test can be utilized to analyze the behaviour of price series in MQL5.


The price movement model and its main provisions. (Part 3): Calculating optimal parameters of stock exchange speculations
Within the framework of the engineering approach developed by the author based on the probability theory, the conditions for opening a profitable position are found and the optimal (profit-maximizing) take profit and stop loss values are calculated.


Price Action Analysis Toolkit Development (Part 17): TrendLoom EA Tool
As a price action observer and trader, I've noticed that when a trend is confirmed by multiple timeframes, it usually continues in that direction. What may vary is how long the trend lasts, and this depends on the type of trader you are, whether you hold positions for the long term or engage in scalping. The timeframes you choose for confirmation play a crucial role. Check out this article for a quick, automated system that helps you analyze the overall trend across different timeframes with just a button click or regular updates.


Reimagining Classic Strategies (Part 13): Minimizing The Lag in Moving Average Cross-Overs
Moving average cross-overs are widely known by traders in our community, and yet the core of the strategy has changed very little since its inception. In this discussion, we will present you with a slight adjustment to the original strategy, that aims to minimize the lag present in the trading strategy. All fans of the original strategy, could consider revising the strategy in accordance with the insights we will discuss today. By using 2 moving averages with the same period, we reduce the lag in the trading strategy considerably, without violating the foundational principles of the strategy.


Automating Trading Strategies in MQL5 (Part 50): Turtle Soup Liquidity Sweeps
We build an automated MQL5 program that trades Turtle Soup by fading false breakouts of the N-bar high and low. The article implements liquidity-sweep detection, confirmation closes back inside the level, sweep-depth and extreme-age filters, and an optional reversal-candle body check. It adds configurable dynamic or static stops, two take-profit modes, points-based trailing, and clear chart visuals, providing a ready baseline for backtesting and further customization.


Automating Trading Strategies in MQL5 (Part 30): Creating a Price Action AB-CD Harmonic Pattern with Visual Feedback
In this article, we develop an AB=CD Pattern EA in MQL5 that identifies bullish and bearish AB=CD harmonic patterns using pivot points and Fibonacci ratios, executing trades with precise entry, stop loss, and take-profit levels. We enhance trader insight with visual feedback through chart objects.


Building AI-Powered Trading Systems in MQL5 (Part 1): Implementing JSON Handling for AI APIs
In this article, we develop a JSON parsing framework in MQL5 to handle data exchange for AI API integration, focusing on a JSON class for processing JSON structures. We implement methods to serialize and deserialize JSON data, supporting various data types like strings, numbers, and objects, essential for communicating with AI services like ChatGPT, enabling future AI-driven trading systems by ensuring accurate data handling and manipulation.


Reimagining Classic Strategies (Part 15): Daily Breakout Trading Strategy
Human traders had long participated in financial markets before the rise of computers, developing rules of thumb that guided their decisions. In this article, we revisit a well-known breakout strategy to test whether such market logic, learned through experience, can hold its own against systematic methods. Our findings show that while the original strategy produced high accuracy, it suffered from instability and poor risk control. By refining the approach, we demonstrate how discretionary insights can be adapted into more robust, algorithmic trading strategies.


MQL5 Wizard techniques you should know (Part 03): Shannon's Entropy
Todays trader is a philomath who is almost always looking up new ideas, trying them out, choosing to modify them or discard them; an exploratory process that should cost a fair amount of diligence. These series of articles will proposition that the MQL5 wizard should be a mainstay for traders.


Creating Custom Indicators in MQL5 (Part 6): Evolving RSI Calculations with Smoothing, Hue Shifts, and Multi-Timeframe Support
In this article, we build a versatile RSI indicator in MQL5 supporting multiple variants, data sources, and smoothing methods for improved analysis. We add hue shifts for color visuals, dynamic boundaries for overbought/oversold zones, and notifications for trend alerts. It includes multi-timeframe support with interpolation, offering us a customizable RSI tool for diverse strategies.


MQL5 Wizard Techniques you should know (Part 48): Bill Williams Alligator
The Alligator Indicator, which was the brain child of Bill Williams, is a versatile trend identification indicator that yields clear signals and is often combined with other indicators. The MQL5 wizard classes and assembly allow us to test a variety of signals on a pattern basis, and so we consider this indicator as well.


Reimagining Classic Strategies (Part 21): Bollinger Bands And RSI Ensemble Strategy Discovery
This article explores the development of an ensemble algorithmic trading strategy for the EURUSD market that combines the Bollinger Bands and the Relative Strength Indicator (RSI). Initial rule-based strategies produced high-quality signals but suffered from low trade frequency and limited profitability. Multiple iterations of the strategy were evaluated, revealing flaws in our understanding of the market, increased noise, and degraded performance. By appropriately employing statistical learning algorithms, shifting the modeling target to technical indicators, applying proper scaling, and combining machine learning forecasts with classical trading rules, the final strategy achieved significantly improved profitability and trade frequency while maintaining acceptable signal quality.


Reimagining Classic Strategies (Part 12): EURUSD Breakout Strategy
Join us today as we challenge ourselves to build a profitable break-out trading strategy in MQL5. We selected the EURUSD pair and attempted to trade price breakouts on the hourly timeframe. Our system had difficulty distinguishing between false breakouts and the beginning of true trends. We layered our system with filters intended to minimize our losses whilst increasing our gains. In the end, we successfully made our system profitable and less prone to false breakouts.


Statistical Arbitrage with predictions
We will walk around statistical arbitrage, we will search with python for correlation and cointegration symbols, we will make an indicator for Pearson's coefficient and we will make an EA for trading statistical arbitrage with predictions done with python and ONNX models.

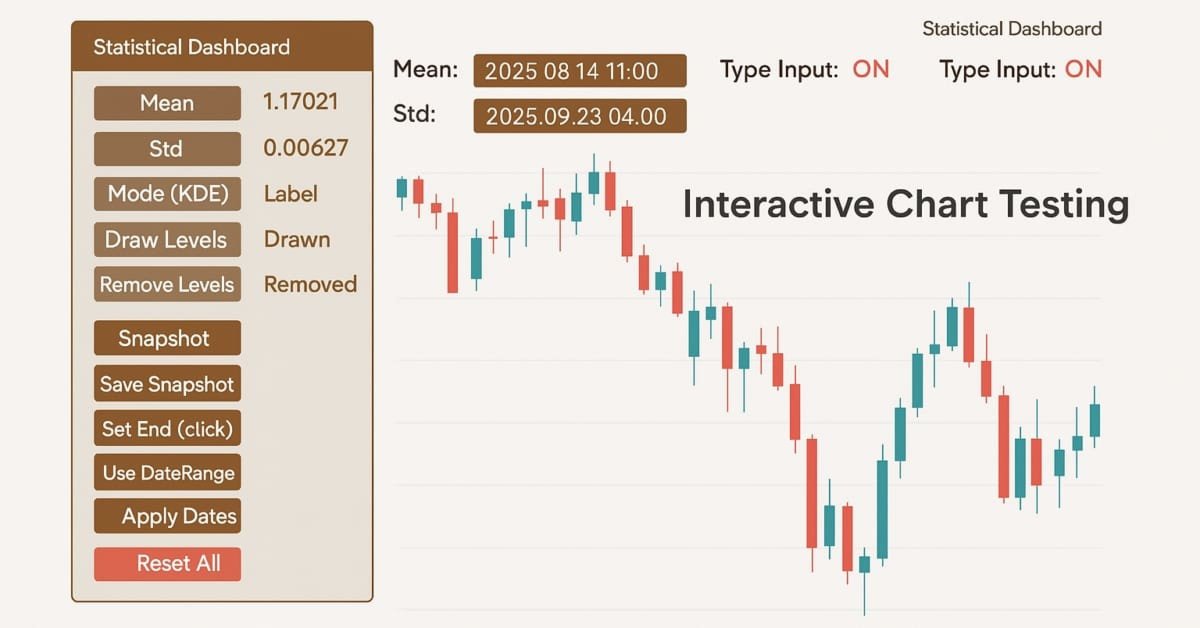
Price Action Analysis Toolkit Development (Part 42): Interactive Chart Testing with Button Logic and Statistical Levels
In a world where speed and precision matter, analysis tools need to be as smart as the markets we trade. This article presents an EA built on button logic—an interactive system that instantly transforms raw price data into meaningful statistical levels. With a single click, it calculates and displays mean, deviation, percentiles, and more, turning advanced analytics into clear on-chart signals. It highlights the zones where price is most likely to bounce, retrace, or break, making analysis both faster and more practical.


How to create a simple Multi-Currency Expert Advisor using MQL5 (Part 3): Added symbols prefixes and/or suffixes and Trading Time Session
Several fellow traders sent emails or commented about how to use this Multi-Currency EA on brokers with symbol names that have prefixes and/or suffixes, and also how to implement trading time zones or trading time sessions on this Multi-Currency EA.


Prices in DoEasy library (part 61): Collection of symbol tick series
Since a program may use different symbols in its work, a separate list should be created for each of them. In this article, I will combine such lists into a tick data collection. In fact, this will be a regular list based on the class of dynamic array of pointers to instances of CObject class and its descendants of the Standard library.


Neural Networks in Trading: A Hybrid Trading Framework with Predictive Coding (StockFormer)
In this article, we will discuss the hybrid trading system StockFormer, which combines predictive coding and reinforcement learning (RL) algorithms. The framework uses 3 Transformer branches with an integrated Diversified Multi-Head Attention (DMH-Attn) mechanism that improves on the vanilla attention module with a multi-headed Feed-Forward block, allowing it to capture diverse time series patterns across different subspaces.


Creating an EA that works automatically (Part 13): Automation (V)
Do you know what a flowchart is? Can you use it? Do you think flowcharts are for beginners? I suggest that we proceed to this new article and learn how to work with flowcharts.

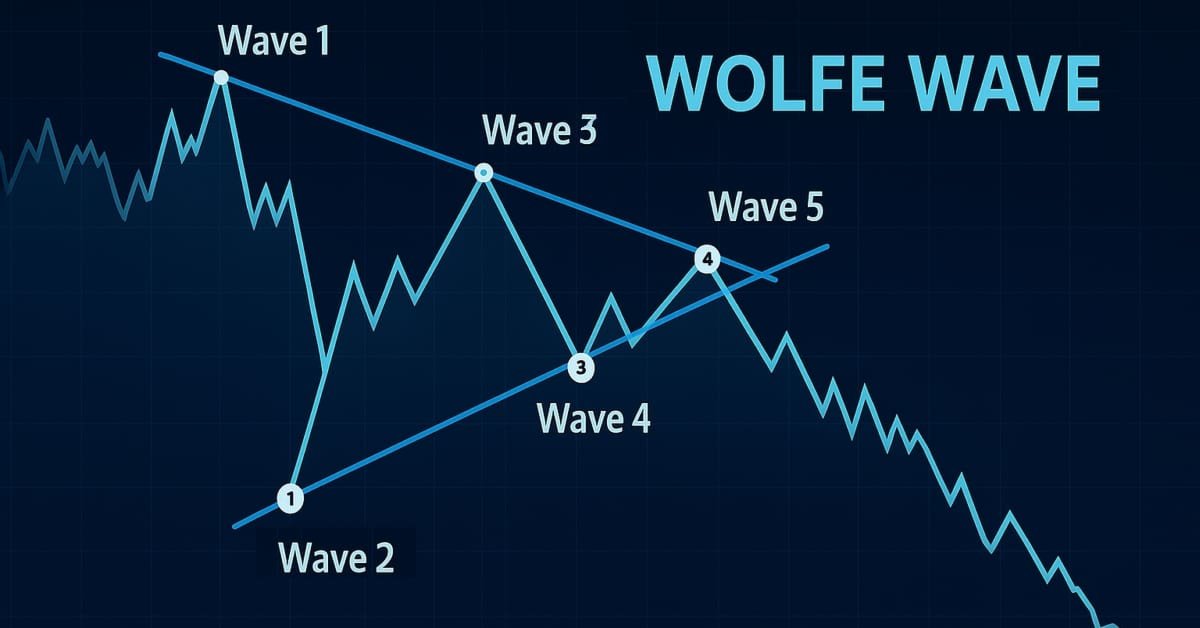
Introduction to MQL5 (Part 19): Automating Wolfe Wave Detection
This article shows how to programmatically identify bullish and bearish Wolfe Wave patterns and trade them using MQL5. We’ll explore how to identify Wolfe Wave structures programmatically and execute trades based on them using MQL5. This includes detecting key swing points, validating pattern rules, and preparing the EA to act on the signals it finds.


Creating an EA that works automatically (Part 14): Automation (VI)
In this article, we will put into practice all the knowledge from this series. We will finally build a 100% automated and functional system. But before that, we still have to learn one last detail.


Understanding Programming Paradigms (Part 2): An Object-Oriented Approach to Developing a Price Action Expert Advisor
Learn about the object-oriented programming paradigm and its application in MQL5 code. This second article goes deeper into the specifics of object-oriented programming, offering hands-on experience through a practical example. You'll learn how to convert our earlier developed procedural price action expert advisor using the EMA indicator and candlestick price data to object-oriented code.


Neural networks made easy (Part 28): Policy gradient algorithm
We continue to study reinforcement learning methods. In the previous article, we got acquainted with the Deep Q-Learning method. In this method, the model is trained to predict the upcoming reward depending on the action taken in a particular situation. Then, an action is performed in accordance with the policy and the expected reward. But it is not always possible to approximate the Q-function. Sometimes its approximation does not generate the desired result. In such cases, approximation methods are applied not to utility functions, but to a direct policy (strategy) of actions. One of such methods is Policy Gradient.


MQL5 Wizard techniques you should know (Part 02): Kohonen Maps
These series of articles will proposition that the MQL5 Wizard should be a mainstay for traders. Why? Because not only does the trader save time by assembling his new ideas with the MQL5 Wizard, and greatly reduce mistakes from duplicate coding; he is ultimately set-up to channel his energy on the few critical areas of his trading philosophy.


News Trading Made Easy (Part 2): Risk Management
In this article, inheritance will be introduced into our previous and new code. A new database design will be implemented to provide efficiency. Additionally, a risk management class will be created to tackle volume calculations.


Trend strength and direction indicator on 3D bars
We will consider a new approach to market trend analysis based on three-dimensional visualization and tensor analysis of the market microstructure.


Data Science and ML (Part 37): Using Candlestick patterns and AI to beat the market
Candlestick patterns help traders understand market psychology and identify trends in financial markets, they enable more informed trading decisions that can lead to better outcomes. In this article, we will explore how to use candlestick patterns with AI models to achieve optimal trading performance.

Tales of Trading Robots: Is Less More?
Two years ago in "The Last Crusade" we reviewed quite an interesting yet currently not widely used method for displaying market information - point and figure charts. Now I suggest you try to write a trading robot based on the patterns detected on the point and figure chart.


From Novice to Expert: Automating Base-Candle Geometry for Liquidity Zones in MQL5
This article implements an MQL5 module that analyzes the lower‑timeframe bars inside each liquidity‑zone base candle. It detects swing points and applies objective rules to classify the internal structure as an ascending, descending, or symmetrical triangle; a rectangle; M; W; or undefined. The indicator displays geometry labels on the chart and adds the pattern to alerts, reducing manual lower‑timeframe inspection.


Developing a trading Expert Advisor from scratch (Part 29): The talking platform
In this article, we will learn how to make the MetaTrader 5 platform talk. What if we make the EA more fun? Financial market trading is often too boring and monotonous, but we can make this job less tiring. Please note that this project can be dangerous for those who experience problems such as addiction. However, in a general case, it just makes things less boring.