

Creating an EMA Crossover Forward Simulation (Culmination): Interactive Synthetic Candles
 7 381
7 381
 0
0

Table of Contents
Introduction
In the first article, we built the core components of a Forward Simulation Engine for MetaTrader 5. We started with a basic EMA crossover detector. Then we added an anchor mechanism, an EMA-slope projection loop, a pip-based invalidation rule, and a chart-object rendering system. The result was a self-contained indicator capable of projecting a fixed number of synthetic OHLC candles beyond a confirmed crossover. These candles were drawn with visible bodies and wicks, labeled clearly on the chart, and automatically removed when invalidated or replaced by a new signal. This initial version established the foundation of the system, including signal detection, state management, object handling, and a repeatable candle-generation process. It also demonstrated that forward-looking visualization can be integrated into a traditional EMA indicator in a practical and useful way.
This article expands that foundation in three key areas. First, the projection engine now derives candle body and wick sizes from the average characteristics of recent market candles on the active symbol and timeframe. EMA slope remains a momentum factor, but candle dimensions now reflect the actual volatility of the instrument. As a result, projections naturally adapt to markets ranging from volatile XAUUSD on M15 to more stable EURUSD on H1. Second, the visual presentation has been enhanced with configurable spacing between candles, a sine-wave body-size envelope, proportional wick sizing, and controlled counter-trend candle injection. These additions create more realistic price sequences while preserving the overall directional bias.
Finally, the projected candles are now interactive. As each new market candle closes, the oldest projected candle is removed. The projection therefore remains anchored one bar ahead of the current market and advances continuously with incoming price data. Together, these improvements transform the original static projection into a live, self-updating forward simulation that evolves alongside the chart in real time.
System Overview
The indicator is built around three independent modules that each own a single responsibility. The first is the signal module, which monitors the last two closed bars for a fast EMA and slow EMA crossover. When the fast line crosses above the slow line, a bullish state is latched; when it crosses below, a bearish state is latched. Each new cross resets the engine and refreshes the average candle metrics by sampling the most recent closed bars of the active symbol and timeframe. Those metrics—average body height, average upper wick, and average lower wick—become the calibration baseline for everything drawn afterward.
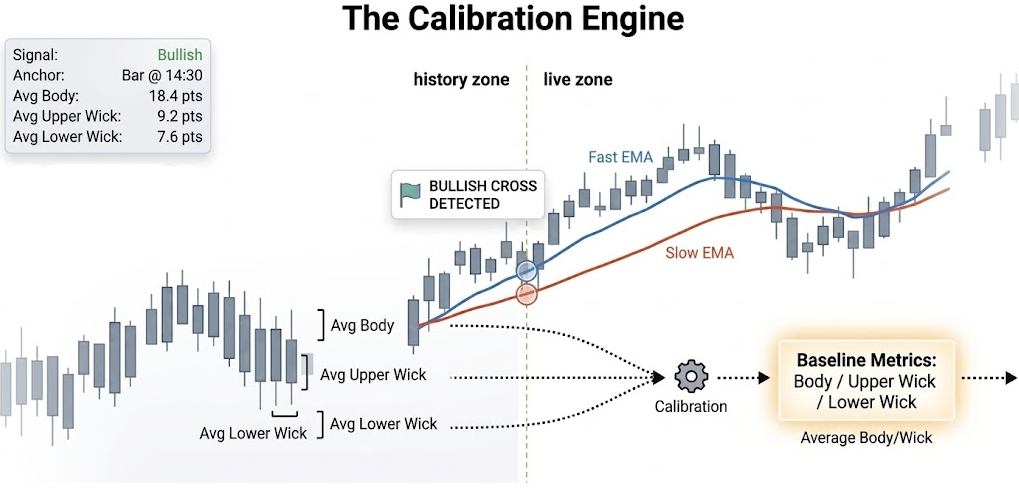
Before a single synthetic candle is drawn, the engine listens to the chart itself—measuring how big real candles and their shadows have actually been, so the projection speaks the same visual language as the instrument it's drawn on.
How The Calibration Engine Works:
- Step 1: Sample The Last 50 Closed Bars -> Measure Average Body & Wick Sizes.
- Step 2: Fast EMA Crosses Above Slow EMA -> Signal Latched, Anchor Placed.
- Step 3: Measured Averages Become the Baseline for Every Future Candle.
- Step 4: Panel Confirms Signal State and Calibration Values in Real Time.
The second module is the prediction engine, which uses that baseline to build a sequence of synthetic OHLC candles. Body sizes follow a sine-wave envelope layered over an exponential decay, so candles pulse in size across the projection and taper toward the tail. Every N bars, a counter-trend candle is injected at a reduced size to simulate realistic pullbacks within the dominant direction. Wick lengths are derived from the measured wick-to-body ratios, so the projected candles naturally match the shadow character of the instrument.
The third module is the renderer. It draws each synthetic candle using chart objects: a filled rectangle for the body and two trend lines for the wicks. Candles are placed into future time slots with a configurable gap. As each new real candle closes, the first projected candle is removed, keeping the simulation perpetually one bar ahead of the chart without any manual intervention.
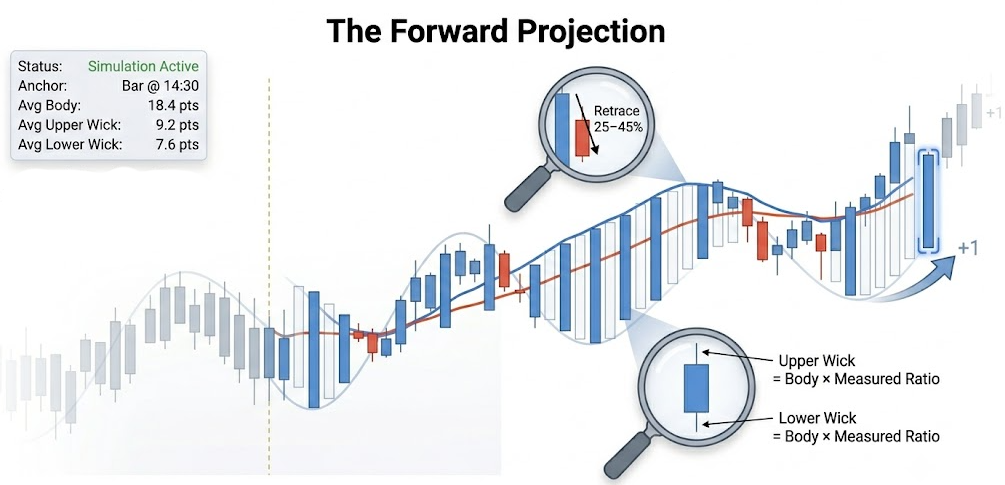
The projection isn't a static forecast pasted onto the chart—it's a living sequence of candles, sized and shaped from the instrument's own history, that quietly steps forward in time alongside the market.
How The Forward Projection Works:
- Step 1: Body Sizes Follow a Sine-Wave Pulse, Tapering Toward the End.
- Step 2: Every Few Bars, a Counter-Trend Candle Injects a Realistic Pullback.
- Step 3: Each Wick Length is Drawn From the Calibrated Wick-to-Body Ratio.
- Step 4: As Each Real Candle Closes, the Oldest Projected Candle Disappears - the Simulation Always Stays One Bar Ahead.
Getting Started
//+------------------------------------------------------------------+
//|                                        Forward Simulation_V2.mq5 |
//|                                  Copyright 2025, MetaQuotes Ltd. |
//|                     https://www.mql5.com/en/users/johnhlomohang/ |
//+------------------------------------------------------------------+
#property copyright "Copyright 2025, MetaQuotes Ltd."
#property link      "https://www.mql5.com/en/users/johnhlomohang/"
#property version   "2.00"
#property indicator_chart_window
#property indicator_buffers   2

#property indicator_label1  "Fast EMA"
#property indicator_type1   DRAW_LINE
#property indicator_color1  clrDodgerBlue
#property indicator_style1  STYLE_SOLID
#property indicator_width1  2

#property indicator_label2  "Slow EMA"
#property indicator_type2   DRAW_LINE
#property indicator_color2  clrOrangeRed
#property indicator_style2  STYLE_SOLID
#property indicator_width2  2

//+------------------------------------------------------------------+
//|  INDICATOR BUFFERS                                               |
//+------------------------------------------------------------------+
double FastEMABuffer[];
double SlowEMABuffer[];

//+------------------------------------------------------------------+
//|  INPUT PARAMETERS                                                |
//+------------------------------------------------------------------+
input int    FastEMA_Period     = 9;            // Fast EMA period
input int    SlowEMA_Period     = 21;           // Slow EMA period
input int    FutureBars         = 30;           // Number of future candles to project
input double SpreadMultiplier   = 2.0;          // Wick size multiplier
input bool   AutoAnchor         = true;         // Auto-move anchor to latest cross bar
input string AnchorLineName     = "FSE_Anchor"; // Anchor vertical line name
input color  BullishColor       = clrDodgerBlue;    // Bullish body color
input color  BearishColor       = clrCrimson;       // Bearish body color
input color  WickColor          = clrDimGray;       // Wick color
input bool   ShowZoneLabel      = true;         // Show projection label
input bool   ShowSeparatorLine  = true;         // Show dashed separator at anchor
input int    InvalidationPips   = 10;           // Pip distance to trigger invalidation
input double CandleGapFraction  = 0.08;         // Gap between candles as fraction of bar width (0.04–0.20)
input int    CounterCandleFreq  = 4;            // Insert 1 counter-trend candle every N candles (min 3)
input int    AvgLookback        = 50;           // Bars used to measure average candle size
To get started, we define the indicator as a chart-window tool with two output buffers used to display the fast and slow Exponential Moving Averages (EMAs). We then configure the visual appearance of both EMA lines, including their colors, widths, and styles, so they can be easily distinguished on the chart. Next, we declare the indicator buffers that will store the calculated EMA values. The input section provides full control over the behavior of the Forward Simulation Engine. Here we specify the EMA periods, the number of future candles to project, wick scaling, anchor management, candle colors, invalidation distance, candle spacing, counter-trend frequency, and the lookback period used to measure average candle characteristics.
//+------------------------------------------------------------------+
//|  STRUCTS                                                         |
//+------------------------------------------------------------------+
struct PredictedCandle
  {
   double            open;
   double            high;
   double            low;
   double            close;
   bool              bullish;
  };

//+------------------------------------------------------------------+
//|  GLOBALS                                                         |
//+------------------------------------------------------------------+
int      g_FastHandle    = INVALID_HANDLE;
int      g_SlowHandle    = INVALID_HANDLE;

int      g_LastSignal    = 0;     // +1 bull, -1 bear, 0 none
bool     g_SignalActive  = false;
double   g_SignalPrice   = 0.0;
datetime g_SignalBarTime = 0;
datetime g_DrawnAnchor   = 0;     // anchor time of the last successful draw

//--- Measured average candle metrics (refreshed on each new signal)
double   g_AvgBody       = 0.0;  // average |close - open|  over AvgLookback bars
double   g_AvgUpperWick  = 0.0;  // average (high - max(open,close))
double   g_AvgLowerWick  = 0.0;  // average (min(open,close) - low)
double   g_AvgRange      = 0.0;  // average (high - low)  – full candle height

//+------------------------------------------------------------------+
//| Expert initialization function                                   |
//+------------------------------------------------------------------+
int OnInit()
  {
   //--- Bind and configure the two visible EMA plot buffers
   SetIndexBuffer(0, FastEMABuffer, INDICATOR_DATA);
   SetIndexBuffer(1, SlowEMABuffer, INDICATOR_DATA);

   ArraySetAsSeries(FastEMABuffer, false);
   ArraySetAsSeries(SlowEMABuffer, false);

   PlotIndexSetInteger(0, PLOT_DRAW_BEGIN, FastEMA_Period);
   PlotIndexSetInteger(1, PLOT_DRAW_BEGIN, SlowEMA_Period);

   //--- Internal calculation handles
   g_FastHandle = iMA(_Symbol, _Period, FastEMA_Period, 0, MODE_EMA, PRICE_CLOSE);
   g_SlowHandle = iMA(_Symbol, _Period, SlowEMA_Period, 0, MODE_EMA, PRICE_CLOSE);

   if(g_FastHandle == INVALID_HANDLE || g_SlowHandle == INVALID_HANDLE)
     {
      Print("ForwardSimEngine [ERROR]: iMA handle creation failed. "
            "Symbol=", _Symbol, " TF=", EnumToString(_Period));
      return INIT_FAILED;
     }

   Print("ForwardSimEngine [INIT]: OK  FastEMA=", FastEMA_Period,
         "  SlowEMA=", SlowEMA_Period,
         "  FutureBars=", FutureBars,
         "  InvalidationPips=", InvalidationPips,
         "  AvgLookback=", AvgLookback);

   //--- Pre-compute average candle metrics from history
   CalcAvgCandleMetrics();

   EventSetTimer(3);
   return INIT_SUCCEEDED;
  }

//+------------------------------------------------------------------+
//| Expert deinitialization function                                 |
//+------------------------------------------------------------------+
void OnDeinit(const int reason)
  {
   EventKillTimer();
   CleanAllObjects();
   Print("ForwardSimEngine [DEINIT]: objects cleaned, reason=", reason);
  }
The foundation of the engine begins with the PredictedCandle structure, which acts as a container for every synthetic candle generated by the projection system. Each instance stores the candle's open, high, low, and close prices, together with a bullish flag that identifies its directional bias.
Following this, we declare a collection of global variables that maintain the state of the indicator. These include handles for the fast and slow EMA calculations, variables that track the most recent crossover signal, and information about the active projection such as the signal price, signal time, and anchor position. We also reserve storage for measured candle statistics, including average body size, wick lengths, and total candle range. These values allow future projections to be calibrated against real market behavior rather than relying solely on indicator-derived estimates.
The OnInit() function prepares the indicator for operation. Here we bind the EMA buffers to the chart, configure their plotting behavior, and create the internal EMA calculation handles using iMA(). A validation step confirms that both handles were created successfully before execution continues. Once initialization is complete, we calculate the average candle metrics from recent historical data and start a timer that will support periodic maintenance tasks. The OnDeinit() function performs the opposite role when the indicator is removed. It stops the timer, removes all graphical objects created by the engine, and records a shutdown message in the log.
//+-----------------------------------------------------------------------+
//| ON CALCULATE                                                          |
//+-----------------------------------------------------------------------+
int OnCalculate(const int rates_total,
                const int prev_calculated,
                const datetime &time[],
                const double   &open[],
                const double   &high[],
                const double   &low[],
                const double   &close[],
                const long     &tick_volume[],
                const long     &volume[],
                const int      &spread[])
  {
   if(rates_total < SlowEMA_Period + 5)
     {
      Print("ForwardSimEngine [WARN]: Not enough bars: ", rates_total);
      return 0;
     }

   //--- How many bars to (re)calculate
   int limit = (prev_calculated > 1) ? rates_total - prev_calculated + 1
               : rates_total;
   //--- Start index in the buffer (oldest bar that needs updating)
   int startBar = rates_total - limit;

   //--- Local arrays for engine logic
   double tmpFast[], tmpSlow[];
   ArraySetAsSeries(tmpFast, false);
   ArraySetAsSeries(tmpSlow, false);
   ArrayResize(tmpFast, rates_total);
   ArrayResize(tmpSlow, rates_total);

   //--- Copy ALL bars into local arrays (needed by RunEngine for crossover)
   int copiedFast = CopyBuffer(g_FastHandle, 0, 0, rates_total, tmpFast);
   int copiedSlow = CopyBuffer(g_SlowHandle, 0, 0, rates_total, tmpSlow);

   if(copiedFast <= 0 || copiedSlow <= 0)
     {
      Print("ForwardSimEngine [WARN]: CopyBuffer returned <=0. fast=",
            copiedFast, " slow=", copiedSlow);
      return prev_calculated;
     }

   /* Write into plot buffers ONLY within the confirmed copied range
      and only within what MT5 has allocated (ArraySize guard).*/
   int bufSzFast = ArraySize(FastEMABuffer);
   int bufSzSlow = ArraySize(SlowEMABuffer);
   int safeFast  = MathMin(copiedFast, bufSzFast);
   int safeSlow  = MathMin(copiedSlow, bufSzSlow);

   for(int i = startBar; i < safeFast; i++)
      FastEMABuffer[i] = tmpFast[i];
   for(int i = startBar; i < safeSlow; i++)
      SlowEMABuffer[i] = tmpSlow[i];

// ── Run the simulation engine ─────────────────────────────────
   RunEngine(rates_total, time, close, tmpFast, tmpSlow);

   return rates_total;
  }

//+------------------------------------------------------------------+
//| ON TIMER                                                         |
//+------------------------------------------------------------------+
void OnTimer()
  {
   // If user moved the anchor manually, force a redraw on next tick
   if(!AutoAnchor)
     {
      datetime curAnchor = GetAnchorTime();
      if(curAnchor != g_DrawnAnchor && curAnchor != 0)
        {
         g_DrawnAnchor = 0;
         ChartRedraw();
        }
     }
  }
The OnCalculate() function is the main execution loop. It runs when new market data becomes available. We begin by verifying that enough historical bars exist to support the slow EMA calculation. If insufficient data is available, the function exits early and records a warning. From there, we compute how many bars require recalculation based on prev_calculated. This avoids processing the entire history on every tick. Temporary arrays are then created to store the fast and slow EMA values, which are copied from the internal EMA handles using CopyBuffer(). After confirming that the data was copied successfully, we transfer the values into the visible indicator buffers while applying safety checks to prevent writing beyond the allocated buffer size.
Once the EMA data has been updated, we pass the latest market information and EMA arrays to RunEngine(), where the crossover detection, projection generation, and rendering logic are executed. Then, it returns the total number of processed bars, allowing MetaTrader 5 to track future updates correctly. The OnTimer() function provides additional support for manual anchor management. When automatic anchoring is disabled, it continuously monitors the position of the user-defined anchor. If the anchor is moved to a new location, the function forces a redraw by resetting the last drawn anchor state and requesting a chart refresh. This ensures that the projected candles remain aligned with the user's selected anchor position without requiring the indicator to be reloaded.
//+------------------------------------------------------------------+
//| CALC AVERAGE CANDLE METRICS                                      |
//+------------------------------------------------------------------+
void CalcAvgCandleMetrics()
  {
   int lookback = (AvgLookback < 10) ? 10 : AvgLookback;  // minimum 10 bars

   double hiBuf[], loBuf[], opBuf[], clBuf[];
   ArraySetAsSeries(hiBuf, true);
   ArraySetAsSeries(loBuf, true);
   ArraySetAsSeries(opBuf, true);
   ArraySetAsSeries(clBuf, true);

   //--- Copy starting at shift 1 (skip the live bar), going back lookback bars
   int copiedH = CopyHigh(_Symbol, _Period, 1, lookback, hiBuf);
   int copiedL = CopyLow(_Symbol, _Period, 1, lookback, loBuf);
   int copiedO = CopyOpen(_Symbol, _Period, 1, lookback, opBuf);
   int copiedC = CopyClose(_Symbol, _Period, 1, lookback, clBuf);

   int n = MathMin(MathMin(copiedH, copiedL), MathMin(copiedO, copiedC));
   if(n <= 0)
     {
      Print("ForwardSimEngine [AVG]: CopyPrice failed, keeping previous averages.");
      return;
     }

   double sumBody = 0, sumUWick = 0, sumLWick = 0, sumRange = 0;
   for(int i = 0; i < n; i++)
     {
      double bodyTop  = MathMax(opBuf[i], clBuf[i]);
      double bodyBot  = MathMin(opBuf[i], clBuf[i]);
      sumBody  += bodyTop - bodyBot;
      sumUWick += hiBuf[i] - bodyTop;
      sumLWick += bodyBot  - loBuf[i];
      sumRange += hiBuf[i] - loBuf[i];
     }

   double pip = _Point * 10.0;  // 1 pip floor

   g_AvgBody      = MathMax(sumBody  / n, pip);
   g_AvgUpperWick = MathMax(sumUWick / n, pip * 0.5);
   g_AvgLowerWick = MathMax(sumLWick / n, pip * 0.5);
   g_AvgRange     = MathMax(sumRange / n, pip * 2.0);

   Print("ForwardSimEngine [AVG]: lookback=", n,
         "  AvgBody=",      DoubleToString(g_AvgBody      / _Point, 1), " pts",
         "  AvgUpperWick=", DoubleToString(g_AvgUpperWick / _Point, 1), " pts",
         "  AvgLowerWick=", DoubleToString(g_AvgLowerWick / _Point, 1), " pts",
         "  AvgRange=",     DoubleToString(g_AvgRange     / _Point, 1), " pts");
  }

//+------------------------------------------------------------------+
//| CORE ENGINE                                                      |
//| All arrays: index 0 = oldest,  rates_total-1 = live forming bar  |
//|            rates_total-2 = last fully closed bar  (bar index 1)  |
//|            rates_total-3 = bar before that         (bar index 2) |
//+------------------------------------------------------------------+
void RunEngine(const int      rates_total,
               const datetime &time[],
               const double   &close[],
               const double   &fastBuf[],
               const double   &slowBuf[])
  {
   int barLive    = rates_total - 1; // live/forming bar
   int barClosed  = rates_total - 2; // last fully closed bar
   int barPrev    = rates_total - 3; // bar before that

   if(barPrev < SlowEMA_Period)
      return;

   //--- 1. Crossover detection
   //--- We look at the two most recently CLOSED bars (barPrev and barClosed).
   //--- Cross occurs when the fast EMA crossed over the slow EMA between them.
   double fCur  = fastBuf[barClosed];
   double fPrev = fastBuf[barPrev];
   double sCur  = slowBuf[barClosed];
   double sPrev = slowBuf[barPrev];

   int newSignal = 0;
   if(fPrev <= sPrev && fCur > sCur)
      newSignal =  1; // bullish
   if(fPrev >= sPrev && fCur < sCur)
      newSignal = -1; // bearish

   //--- Heartbeat log (first 3 ticks + every new signal)
   static int s_ticks = 0;
   s_ticks++;
   if(s_ticks <= 3 || newSignal != 0)
     {
      Print("ForwardSimEngine [TICK #", s_ticks, "]",
            "  fCur=",   DoubleToString(fCur,  _Digits),
            "  sCur=",   DoubleToString(sCur,  _Digits),
            "  gap=",    DoubleToString(fCur - sCur, _Digits),
            "  newSig=", newSignal,
            "  active=", g_SignalActive,
            "  lastSig=",g_LastSignal);
     }

   //--- 2. Latch new signal
   if(newSignal != 0)
     {
      g_LastSignal    = newSignal;
      g_SignalActive  = true;
      g_SignalPrice   = close[barClosed];
      g_SignalBarTime = time[barClosed];
      g_DrawnAnchor   = 0; // force full redraw

      /* Refresh measured candle averages at the moment of the signal
         so the projection uses the most recent volatility context. */
      CalcAvgCandleMetrics();

      Print("ForwardSimEngine [SIGNAL]: ",
            (newSignal == 1 ? ">>> BULLISH CROSS <<<" : ">>> BEARISH CROSS <<<"),
            "  bar=", TimeToString(g_SignalBarTime),
            "  px=",  DoubleToString(g_SignalPrice, _Digits));
     }

   //--- 3. Invalidation check
   if(g_SignalActive)
     {
      double livePx = close[barLive];
      //--- 1 pip = 10 * _Point for a 5-digit broker (covers 3-digit too)
      double pipSize = _Point * 10.0;
      double thresh  = InvalidationPips * pipSize;

      bool inv = false;
      if(g_LastSignal ==  1 && livePx < g_SignalPrice - thresh)
         inv = true;
      if(g_LastSignal == -1 && livePx > g_SignalPrice + thresh)
         inv = true;

      if(inv)
        {
         Print("ForwardSimEngine [INVALIDATED]",
               "  signalPx=", DoubleToString(g_SignalPrice, _Digits),
               "  livePx=",   DoubleToString(livePx, _Digits),
               "  thresh=",   DoubleToString(thresh,  _Digits));

         g_SignalActive = false;
         g_LastSignal   = 0;
         g_DrawnAnchor  = 0;
         CleanAllObjects();
         DrawInvalidationLabel(g_SignalBarTime, g_SignalPrice);
         ChartRedraw();
         return;
        }
     }

   //--- 4. Only draw/redraw when there is an active signal
   if(!g_SignalActive || g_LastSignal == 0)
      return;

   datetime anchorTime = (AutoAnchor) ? g_SignalBarTime : GetAnchorTime();
   if(anchorTime == 0)
      anchorTime = g_SignalBarTime;

   //--- Skip if already drawn at this anchor
   if(anchorTime == g_DrawnAnchor)
      return;
   g_DrawnAnchor = anchorTime;

   //--- 5. Build synthetic candles
   double emaSlope = fCur - fPrev;
   PredictedCandle pred[];
   ArrayResize(pred, FutureBars);
   GeneratePrediction(close[barClosed], emaSlope, pred);

   //--- 6. Render
   CleanAllObjects();
   DrawAllCandles(anchorTime, pred);
   if(ShowSeparatorLine)
      DrawSeparator(anchorTime);
   if(ShowZoneLabel)
      DrawZoneLabel(anchorTime, close[barClosed]);
   UpdateAnchorLine(anchorTime);
   ChartRedraw();

   Print("ForwardSimEngine [DRAWN]",
         "  signal=",   g_LastSignal,
         "  anchor=",   TimeToString(anchorTime),
         "  bars=",     FutureBars,
         "  slope=",    DoubleToString(emaSlope, _Digits));
  }
The CalcAvgCandleMetrics() function measures the recent behavior of the market and converts it into statistical values that can be reused by the projection engine. We then enforce a minimum lookback period of ten bars to ensure that the calculations are based on a meaningful sample size. It then retrieves the open, high, low, and close prices of recently closed candles while deliberately skipping the current live bar. Using this data, we calculate the average candle body size, average upper wick, average lower wick, and average full range. These measurements are stored in global variables and represent the current volatility profile of the active symbol and timeframe. To prevent unrealistic values, minimum pip-based floors are applied before the averages are saved and reported in the log.
The RunEngine() function acts as the central controller of the Forward Simulation Engine. We start by identifying the most recent closed bars and comparing the fast and slow EMA values to detect bullish or bearish crossovers. When a new crossover is found, the signal state is updated, the signal price and timestamp are recorded, and the average candle metrics are refreshed so that future projections reflect the latest market conditions.
The function then monitors the active signal for invalidation by measuring whether the price has moved against the signal beyond the configured pip threshold. If invalidation occurs, all projected objects are removed, and a visual notification is displayed. When a valid signal remains active, the function determines the correct anchor point, generates a sequence of synthetic candles using the current EMA slope and measured candle statistics, and renders the projection on the chart.
//+------------------------------------------------------------------+
//|  PREDICTION ENGINE                                               |
//+------------------------------------------------------------------+
void GeneratePrediction(double startPrice, double emaSlope, PredictedCandle &out[])
  {
   MathSrand((int)(TimeLocal() % 32767));

   int    n   = ArraySize(out);
   int    sig = g_LastSignal;   // +1 bull, -1 bear
   double pip = _Point * 10.0;

   //--- Baseline body size from measured history
   //--- Guard: if CalcAvgCandleMetrics hasn't run yet use a pip floor
   double avgBody  = (g_AvgBody  > pip) ? g_AvgBody  : pip * 3.0;
   double avgUWick = (g_AvgUpperWick > 0) ? g_AvgUpperWick : avgBody * 0.5;
   double avgLWick = (g_AvgLowerWick > 0) ? g_AvgLowerWick : avgBody * 0.5;

   //--- EMA-slope momentum scale: 0.5× (weak) … 1.5× (strong)
   //--- Normalise slope against avgBody so it is always unit-consistent
   double slopeAbs   = MathAbs(emaSlope);
   double slopeRatio = slopeAbs / avgBody;          // 0 = flat, 1 = slope equals avg body
   //--- Clamp to a ±0.5 band around 1.0
   double momentumScale = 0.5 + MathMin(slopeRatio, 1.0);  // 0.5 … 1.5

   //--- baseStep = what one average trend-direction candle body should be
   double baseStep = avgBody * momentumScale;

   //--- Counter-candle frequency guard
   int ccFreq = (CounterCandleFreq < 3) ? 3 : CounterCandleFreq;

   double prevClose = startPrice;

   for(int i = 0; i < n; i++)
     {
      //--- Sine envelope: body pulses between 40% and 130% of baseStep
      double phase    = (double)i / (double)n * 2.0 * M_PI;
      double sinSq    = MathSin(phase) * MathSin(phase);   // 0 … 1
      double envelope = 0.40 + 0.90 * sinSq;               // 0.40 … 1.30

      //--- Exponential decay: projection flattens toward the tail
      double decay    = MathPow(0.93, i);

      //--- Body for this candle
      double bodySize = baseStep * envelope * decay;

      //--- ±8% random jitter
      double jitter   = 1.0 + ((double)(MathRand() % 160) - 80.0) * 0.001;
      bodySize       *= jitter;

      //--- Hard floor: at least 0.5 × avgBody so candles are always visible
      if(bodySize < avgBody * 0.5)
         bodySize = avgBody * 0.5;

      //--- Counter-trend injection every ccFreq bars
      bool   isCounter   = (i > 0 && (i % ccFreq == 0));
      double retracePct  = 0.25 + (MathRand() % 21) * 0.01;  // 0.25–0.45
      double step;
      if(isCounter)
         step = -(double)sig * bodySize * retracePct;
      else
         step = (double)sig * bodySize;

      //--- OHLC
      out[i].open    = prevClose;
      out[i].close   = prevClose + step;
      out[i].bullish = (out[i].close >= out[i].open);

      double bodyTop = MathMax(out[i].open, out[i].close);
      double bodyBot = MathMin(out[i].open, out[i].close);
      double bHeight = bodyTop - bodyBot;
      if(bHeight < _Point)
         bHeight = _Point;

      //--- Wicks anchored to measured avg wick ratios
      //--- Base ratio = avgWick / avgBody, then add ±25% random spread
      double uRatioBase = avgUWick / avgBody;
      double lRatioBase = avgLWick / avgBody;

      double uJitter = 1.0 + ((double)(MathRand() % 50) - 25.0) * 0.01; // ±25%
      double lJitter = 1.0 + ((double)(MathRand() % 50) - 25.0) * 0.01;

      double upWick = bHeight * uRatioBase * uJitter;
      double dnWick = bHeight * lRatioBase * lJitter;

      //--- Trend bias: the shadow in the signal direction is slightly longer
      if(out[i].bullish)
         upWick *= 1.20;
      else
         dnWick *= 1.20;

      //--- Minimum wick: 20% of body height
      if(upWick < bHeight * 0.20)
         upWick = bHeight * 0.20;
      if(dnWick < bHeight * 0.20)
         dnWick = bHeight * 0.20;

      out[i].high = bodyTop + upWick;
      out[i].low  = bodyBot - dnWick;

      prevClose = out[i].close;
     }
  }

//+------------------------------------------------------------------+
//| DRAW ALL CANDLES – project one bar-width ahead of anchor         |
//+------------------------------------------------------------------+
void DrawAllCandles(datetime startTime, PredictedCandle &candles[])
  {
   int barSec  = PeriodSeconds();
   int total   = ArraySize(candles);

   //--- Gap in seconds on each side of the body (max 45% each side)
   double gapFrac = CandleGapFraction;
   if(gapFrac < 0.01)
      gapFrac = 0.01;
   if(gapFrac > 0.45)
      gapFrac = 0.45;
   int gapSec = (int)(barSec * gapFrac);

   for(int i = 0; i < total; i++)
     {
      //--- Slot boundaries (full bar width)
      datetime slotStart = startTime + (datetime)((i + 1) * barSec);
      datetime slotEnd   = slotStart  + (datetime)barSec;

      //--- Body boundaries (inset by gap on each side)
      datetime bodyStart = slotStart + (datetime)gapSec;
      datetime bodyEnd   = slotEnd   - (datetime)gapSec;
      datetime bodyMid   = slotStart + (datetime)(barSec / 2); // wick centre

      DrawSingleCandle(i, bodyStart, bodyEnd, bodyMid, candles[i]);
     }
  }
The GeneratePrediction() function is responsible for creating the sequence of synthetic candles that form the forward projection. We then establish baseline candle measurements from the average body and wick statistics calculated from recent market history. These averages provide realistic dimensions that reflect the behavior of the active symbol and timeframe. The EMA slope is then converted into a momentum scale factor, allowing stronger crossover signals to produce larger projected candles while weaker signals generate smaller ones.
As the projection progresses, a sine-wave envelope introduces natural variation in candle sizes, while an exponential decay factor gradually reduces momentum toward the end of the sequence. Small random adjustments are also applied to prevent the projection from appearing overly mechanical. In addition, the engine periodically inserts counter-trend candles that retrace a portion of the dominant move, creating more realistic pullbacks within the projected trend.
Once the body size and direction of each synthetic candle have been determined, the function constructs the complete OHLC structure. Open and close prices are generated from the previous projected candle, while wick lengths are calculated using ratios derived from the measured average upper and lower wicks. Random variation is added to the wick sizes, and a directional bias slightly extends the wick that aligns with the prevailing trend. Minimum wick lengths are also enforced to ensure that every candle remains visually clear.
The completed candle data is then passed to DrawAllCandles(), which converts the projected candles into chart objects. This function allocates a full-time slot for each future candle, applies configurable spacing on both sides of the candle body, and positions the wick at the center of the slot. By separating candle generation from candle rendering, the design remains modular and allows the projection logic to evolve independently from the visual display layer.
//+------------------------------------------------------------------+
//|  DRAW ONE CANDLE                                                 |
//+------------------------------------------------------------------+
void DrawSingleCandle(int idx,
                      datetime t1, datetime t2, datetime tMid,
                      const PredictedCandle &c)
  {
   string pfx    = "FutureCandle_" + IntegerToString(idx);
   color  bodyCol = c.bullish ? BullishColor : BearishColor;

   //--- Doji guard
   double bOpen  = c.open;
   double bClose = c.close;
   if(MathAbs(bOpen - bClose) < _Point)
      bClose = bOpen + (c.bullish ? _Point * 2 : -_Point * 2);

   //--- Filled body
   string nm = pfx + "_body";
   ObjectDelete(0, nm);
   if(ObjectCreate(0, nm, OBJ_RECTANGLE, 0, t1, bOpen, t2, bClose))
     {
      ObjectSetInteger(0, nm, OBJPROP_COLOR,      bodyCol);
      ObjectSetInteger(0, nm, OBJPROP_FILL,       true);
      ObjectSetInteger(0, nm, OBJPROP_BACK,       false);
      ObjectSetInteger(0, nm, OBJPROP_WIDTH,      1);
      ObjectSetInteger(0, nm, OBJPROP_SELECTABLE, false);
      ObjectSetInteger(0, nm, OBJPROP_HIDDEN,     false);
     }

   //--- Body outline
   nm = pfx + "_bord";
   ObjectDelete(0, nm);
   if(ObjectCreate(0, nm, OBJ_RECTANGLE, 0, t1, bOpen, t2, bClose))
     {
      ObjectSetInteger(0, nm, OBJPROP_COLOR,      bodyCol);
      ObjectSetInteger(0, nm, OBJPROP_FILL,       false);
      ObjectSetInteger(0, nm, OBJPROP_BACK,       false);
      ObjectSetInteger(0, nm, OBJPROP_WIDTH,      1);
      ObjectSetInteger(0, nm, OBJPROP_SELECTABLE, false);
      ObjectSetInteger(0, nm, OBJPROP_HIDDEN,     false);
     }

   //--- Upper wick  (centred on full slot, not the inset body)
   nm = pfx + "_wU";
   ObjectDelete(0, nm);
   double wTop = MathMax(bOpen, bClose);
   if(ObjectCreate(0, nm, OBJ_TREND, 0, tMid, wTop, tMid, c.high))
     {
      ObjectSetInteger(0, nm, OBJPROP_COLOR,      WickColor);
      ObjectSetInteger(0, nm, OBJPROP_WIDTH,      1);
      ObjectSetInteger(0, nm, OBJPROP_RAY_RIGHT,  false);
      ObjectSetInteger(0, nm, OBJPROP_SELECTABLE, false);
      ObjectSetInteger(0, nm, OBJPROP_HIDDEN,     false);
     }

   //--- Lower wick
   nm = pfx + "_wD";
   ObjectDelete(0, nm);
   double wBot = MathMin(bOpen, bClose);
   if(ObjectCreate(0, nm, OBJ_TREND, 0, tMid, wBot, tMid, c.low))
     {
      ObjectSetInteger(0, nm, OBJPROP_COLOR,      WickColor);
      ObjectSetInteger(0, nm, OBJPROP_WIDTH,      1);
      ObjectSetInteger(0, nm, OBJPROP_RAY_RIGHT,  false);
      ObjectSetInteger(0, nm, OBJPROP_SELECTABLE, false);
      ObjectSetInteger(0, nm, OBJPROP_HIDDEN,     false);
     }
  }

//+------------------------------------------------------------------+
//| SEPARATOR                                                        |
//+------------------------------------------------------------------+
void DrawSeparator(datetime t)
  {
   string nm = "FSE_Sep";
   ObjectDelete(0, nm);
   if(ObjectCreate(0, nm, OBJ_VLINE, 0, t, 0))
     {
      ObjectSetInteger(0, nm, OBJPROP_COLOR,      clrSilver);
      ObjectSetInteger(0, nm, OBJPROP_STYLE,      STYLE_DASH);
      ObjectSetInteger(0, nm, OBJPROP_WIDTH,      1);
      ObjectSetInteger(0, nm, OBJPROP_BACK,       true);
      ObjectSetInteger(0, nm, OBJPROP_SELECTABLE, false);
      ObjectSetInteger(0, nm, OBJPROP_HIDDEN,     false);
     }
  }

//+------------------------------------------------------------------+
//| ZONE LABEL                                                       |
//+------------------------------------------------------------------+
void DrawZoneLabel(datetime t, double price)
  {
   string nm  = "FSE_Label";
   string txt = (g_LastSignal == 1) ? "[ BULLISH PROJECTION ]" : "[ BEARISH PROJECTION ]";
   color  col = (g_LastSignal == 1) ? BullishColor : BearishColor;

   ObjectDelete(0, nm);
   if(ObjectCreate(0, nm, OBJ_TEXT, 0, t + (datetime)PeriodSeconds(), price))
     {
      ObjectSetString(0,  nm, OBJPROP_TEXT,       txt);
      ObjectSetInteger(0, nm, OBJPROP_COLOR,      col);
      ObjectSetInteger(0, nm, OBJPROP_FONTSIZE,   10);
      ObjectSetString(0,  nm, OBJPROP_FONT,       "Courier New");
      ObjectSetInteger(0, nm, OBJPROP_ANCHOR,     ANCHOR_LEFT_LOWER);
      ObjectSetInteger(0, nm, OBJPROP_SELECTABLE, false);
      ObjectSetInteger(0, nm, OBJPROP_HIDDEN,     false);
     }
  }
The DrawSingleCandle() function is responsible for converting a predicted candle into visible chart objects. We begin by creating a unique name prefix for the candle and selecting the appropriate body color based on whether the candle is bullish or bearish. A doji safeguard is then applied to ensure that candles with tiny bodies remain visible on the chart. The candle body is rendered using two rectangle objects: one filled rectangle for the body itself and another unfilled rectangle that acts as the outline. Before each object is created, any existing object with the same name is removed to prevent duplicates. Additional properties are configured to control appearance, visibility, and user interaction, ensuring that the projected candles behave as visual elements rather than editable chart objects.
The remaining functions add supporting graphics that improve the readability of the projection zone. DrawSingleCandle() completes the candle by drawing upper and lower wick lines centered within the candle's allocated time slot. The DrawSeparator() function places a dashed vertical line at the anchor position, creating a clear visual boundary between historical market data and projected candles. Then, the DrawZoneLabel() adds a descriptive text label that identifies the projection as either bullish or bearish. The label is positioned near the start of the projected region and adopts the color associated with the active signal.
//+------------------------------------------------------------------+
//|  INVALIDATION LABEL                                              |
//+------------------------------------------------------------------+
void DrawInvalidationLabel(datetime t, double price)
  {
   string nm = "FSE_Invalid";
   ObjectDelete(0, nm);
   if(ObjectCreate(0, nm, OBJ_TEXT, 0, t + (datetime)PeriodSeconds(), price))
     {
      ObjectSetString(0,  nm, OBJPROP_TEXT,       "[ INVALIDATED - AWAITING NEXT CROSS ]");
      ObjectSetInteger(0, nm, OBJPROP_COLOR,      clrOrange);
      ObjectSetInteger(0, nm, OBJPROP_FONTSIZE,   9);
      ObjectSetString(0,  nm, OBJPROP_FONT,       "Courier New");
      ObjectSetInteger(0, nm, OBJPROP_ANCHOR,     ANCHOR_LEFT_LOWER);
      ObjectSetInteger(0, nm, OBJPROP_SELECTABLE, false);
      ObjectSetInteger(0, nm, OBJPROP_HIDDEN,     false);
     }
  }

//+------------------------------------------------------------------+
//|  ANCHOR LINE HELPERS                                             |
//+------------------------------------------------------------------+
void PlaceAnchorLine(datetime t)
  {
   ObjectDelete(0, AnchorLineName);
   if(ObjectCreate(0, AnchorLineName, OBJ_VLINE, 0, t, 0))
     {
      ObjectSetInteger(0, AnchorLineName, OBJPROP_COLOR,      clrGold);
      ObjectSetInteger(0, AnchorLineName, OBJPROP_STYLE,      STYLE_DASHDOTDOT);
      ObjectSetInteger(0, AnchorLineName, OBJPROP_WIDTH,      2);
      ObjectSetInteger(0, AnchorLineName, OBJPROP_SELECTABLE, true);
      ObjectSetInteger(0, AnchorLineName, OBJPROP_HIDDEN,     false);
     }
  }

//+------------------------------------------------------------------+
//|  Update Anchor Line                                              |
//+------------------------------------------------------------------+
void UpdateAnchorLine(datetime t)
  {
   if(ObjectFind(0, AnchorLineName) < 0)
      PlaceAnchorLine(t);
   else
      ObjectSetInteger(0, AnchorLineName, OBJPROP_TIME, t);
  }

//+------------------------------------------------------------------+
//|  Get Anchor Time                                                 |
//+------------------------------------------------------------------+
datetime GetAnchorTime()
  {
   if(ObjectFind(0, AnchorLineName) >= 0)
      return (datetime)ObjectGetInteger(0, AnchorLineName, OBJPROP_TIME);
   return 0;
  }

//+------------------------------------------------------------------+
//|  CLEANUP                                                         |
//+------------------------------------------------------------------+
void CleanAllObjects()
  {
   ObjectsDeleteAll(0, "FutureCandle_");
   ObjectsDeleteAll(0, "FSE_");
  }
//+------------------------------------------------------------------+
The DrawnIvalidationLabel() function provides visual feedback whenever an active projection becomes invalid. When the invalidation conditions are met, we first remove any existing invalidation label to avoid duplication. A text object is then created near the invalidated signal location and displays the message indicating that the projection has been cancelled and the engine is waiting for the next EMA crossover. The label is styled with an orange color, a fixed font, and a predefined anchor position to ensure that it remains clearly visible on the chart. This gives traders immediate confirmation that the previous forecast is no longer considered valid.
The anchor-management functions allow us to control where the projection begins on the chart. PlaceAnchorLine() creates a movable vertical line that acts as the projection anchor, while UpdateAnchorLine() either creates the anchor if it does not exist or moves it to a new position when required. The GetAnchorTime() function retrieves the current anchor timestamp, allowing other parts of the engine to align projected candles correctly. Finally, CleanAllObjects() performs housekeeping by removing all graphical objects created by the simulation engine. This ensures that outdated candles, labels, and markers are cleared before a new projection is drawn, keeping the chart clean and preventing object accumulation over time.
Simulation Demo 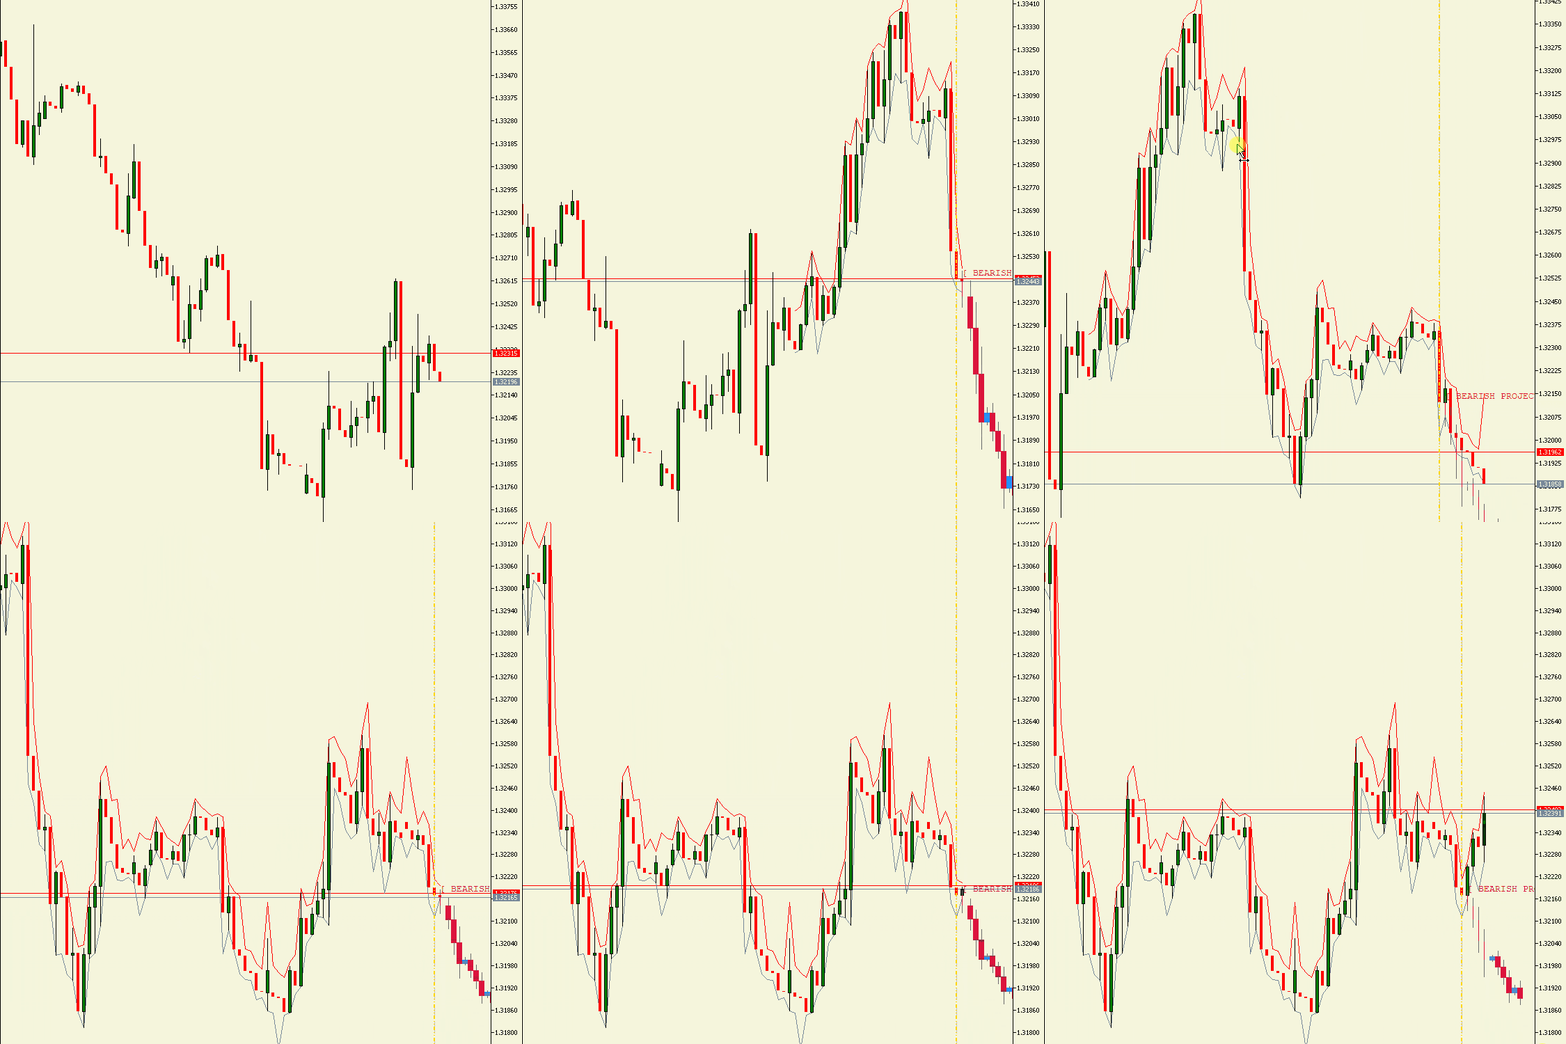
Conclusion
This article delivered a significantly enhanced Forward Simulation Engine and serves as the culmination of the topic. The original version established the core framework, including EMA crossover detection on closed bars, anchor-locked projections, slope-driven candle generation, pip-based invalidation, and a complete rendering and cleanup system. Those foundations remain intact. This version strengthens each component while introducing new layers of realism and interactivity.
The most important enhancement is the calibration layer. Instead of relying solely on the EMA slope, the engine now measures the average body size, upper wick, and lower wick of recent closed candles using the CopyOpen, CopyHigh, CopyLow, and CopyClose functions. This allows every projection to reflect the actual volatility of the active symbol and timeframe. A projection on 'XAUUSD M15' now resembles genuine 'XAUUSD M15' price action rather than a generic estimate. EMA slope is still used as a momentum factor, allowing stronger signals to generate larger synthetic candles while remaining aligned with real market conditions.
Several visual improvements have also been introduced. Configurable inter-candle spacing improves chart clarity, while a sine-squared envelope creates natural variation in candle body sizes across the projection. Wick lengths are scaled using measured market averages, producing more realistic candle structures. Controlled counter-trend candle injection adds periodic pullbacks within the projected sequence. These retracements help the projection resemble real market behavior and prevent the unrealistic appearance of a continuous one-directional move.
The new interactivity layer connects the simulation directly to live market activity. Whenever a new candle closes, the engine removes the oldest projected candle. This keeps the projection anchored one bar ahead of the current market. The simulation remains relevant as price evolves and does not accumulate outdated graphical objects. Combined with the existing anchor, invalidation, and cleanup mechanisms, the result is a forward-looking projection that stays synchronized with the chart in real time.
The architecture remains modular and easy to extend. Components such as CalcAvgCandleMetrics, GeneratePrediction, DrawAllCandles, and the signal state machine operate independently. Developers can replace the EMA crossover trigger with a structure-based model, introduce an ATR-driven volatility system, or add confidence-based visual effects without modifying the rendering or invalidation layers. The framework developed throughout these two articles is therefore more than a completed indicator. It provides a clean and extensible foundation for building advanced projection and scenario-visualization tools in MetaTrader 5.
This article is supported in AlgoForge.
Warning: All rights to these materials are reserved by MetaQuotes Ltd. Copying or reprinting of these materials in whole or in part is prohibited.
This article was written by a user of the site and reflects their personal views. MetaQuotes Ltd is not responsible for the accuracy of the information presented, nor for any consequences resulting from the use of the solutions, strategies or recommendations described.
 Dream Optimization Algorithm (DOA)
 MQL5 Wizard Techniques you should know (Part 100): Sliding Window Median and Bidirectional LSTM for a Custom Trailing Stop
 Building an Internal and External Market Structure Indicator
 Automatic Session Volume Profile Builder in MQL5: Rendering POC and Value Area Without Third-Party Tools

- Free trading apps
- Over 8,000 signals for copying
- Economic news for exploring financial markets
You agree to website policy and terms of use