Introduction to MQL5 (Part 19): Automating Wolfe Wave Detection

Introduction
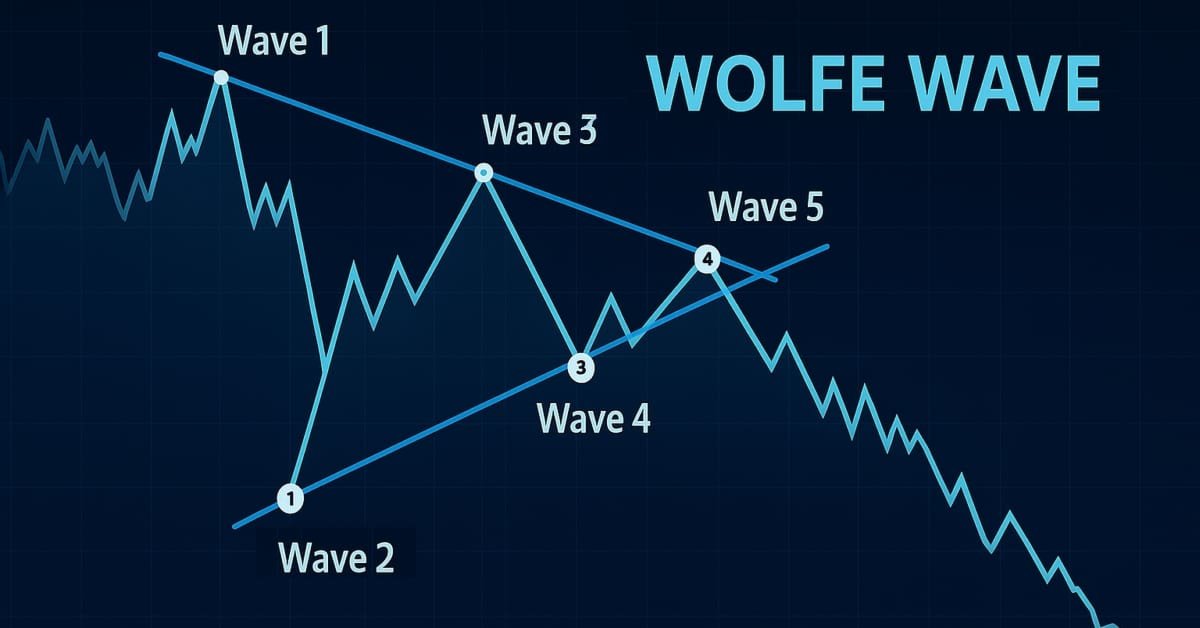
Welcome back to Part 19 of the Introduction to MQL5 series! In Part 18, I introduced you to the Wolfe Wave pattern, a unique five-wave structure used to anticipate price reversals with precision. We discussed the two main types of Wolfe Waves: the bearish setup that signals a potential price drop and the bullish setup that hints at an upcoming rally. You also learned how to retrieve candlestick data, which is essential for price action analysis, and we outlined the logic for spotting valid trade opportunities based on this pattern.
In this part, we’re moving from theory to implementation. We’ll explore how to identify Wolfe Wave structures programmatically and execute trades based on them using MQL5. This includes detecting key swing points, validating pattern rules, and preparing the EA to act on the signals it finds.
In this article, you'll learn:
- How to detect the classic five-wave structure of Wolfe Waves using historical price data.
- Programmatically identify swing highs and lows to determine wave points.
- Understand how to apply and modify Fibonacci expansion levels to validate wave formation, especially for waves 3 and 5.
- The article shows how to draw three important trend lines (Wave 1–3, 2–4, and 1–4) that are critical for pattern confirmation and trade decisions.
- How to check symmetry and proportional relationships between Wave 1–2 and Wave 3–4 to improve pattern reliability.
- Learn how to label waves and draw visual objects such as text, rectangles, and trend lines directly on the chart using MQL5.
- Implementing logic that waits for confirmation before placing trades, avoiding false entries.
- How to program automatic trade exits when the market touches the trend line between Wave 1 and 4, helping to manage risk.
Identifying the Bearish Wolfe Wave Patterns
In the last article, we already discussed the structure and rules of the bearish Wolfe Wave pattern in detail. Now, in this section, we will focus on how to implement that logic programmatically. As previously mentioned, the bearish Wolfe Wave is made up of five waves that have to adhere to a certain sequence and fulfill certain structural requirements. Wave 2 must be a swing low that is situated beneath Wave 1, and Wave 1 must be a swing high. Another swing high, but this time above wave 1 and inside a certain Fibonacci extension of the wave 1 to wave 2 legs, is then formed by wave 3. Wave 4, a swing low that falls below wave 3 but stays above wave 2, is then recognized. Wave 5 completes the pattern by reaching a swing high above wave 3 and falling inside a predetermined Fibonacci extension of the wave 3 to wave 4 motions.
Remembering that the legs of waves one and two must be comparable in size to those of waves three and four is also crucial. Waves 3–4 should ideally be at least 70% as long as waves 1–2. The structure gains credibility from this symmetry, which also serves to validate the validity of the pattern. This section will locate the five locations using swing detection functions and include checks to make sure their distances and connections meet Wolfe Wave requirements.
Identifying Wave One and Two
Recognizing waves 1 and 2 accurately is the first step in spotting a bearish Wolfe Wave pattern. Accurately locating the remaining waves is difficult without these two fundamentals. This part will concentrate on looking for legitimate swing highs and lows that fit the wave 1 and wave 2 criteria on the chart. We will clearly label the two waves on the chart for visual reference as soon as they have been detected.
Between waves 1 and 2, we will also provide a Fibonacci extension object. By establishing appropriate price levels based on the pattern rules, this expansion will aid in directing the detection of waves three and five. We create a solid basis for the remainder of the wave identification process by putting this in place early.
Example:input ENUM_TIMEFRAMES timeframe = PERIOD_CURRENT; int bars_check = 500; datetime time_bar; double total_symbol_bars; double open[]; double close[]; double low[]; double high[]; datetime time[]; double wv1; datetime wv1_time; string wv1_txt; double wv2; datetime wv2_time; string wv2_txt; string fib_ext_wv1_wv2; ulong chart_id = ChartID(); //+------------------------------------------------------------------+ //| Expert initialization function | //+------------------------------------------------------------------+ int OnInit() { return(INIT_SUCCEEDED); } //+------------------------------------------------------------------+ //| Expert deinitialization function | //+------------------------------------------------------------------+ void OnDeinit(const int reason) { ObjectsDeleteAll(chart_id); } //+------------------------------------------------------------------+ //| Expert tick function | //+------------------------------------------------------------------+ void OnTick() { total_symbol_bars = Bars(_Symbol, timeframe); time_bar = iTime(_Symbol,timeframe,0); CopyOpen(_Symbol, timeframe, time_bar, bars_check, open); CopyClose(_Symbol, timeframe, time_bar, bars_check, close); CopyLow(_Symbol, timeframe, time_bar, bars_check, low); CopyHigh(_Symbol, timeframe, time_bar, bars_check, high); CopyTime(_Symbol, timeframe, time_bar, bars_check, time); if(total_symbol_bars >= bars_check) { for(int i = 7; i < bars_check - 7; i++) { if(IsSwingHigh(high, i, 7)) { wv1 = high[i]; wv1_time = time[i]; wv1_txt = StringFormat("WAVE 1 %d", i); for(int j = i; j < bars_check - 7; j++) { if(IsSwingLow(low, j, 7) && low[j] < wv1) { wv2 = low[j]; wv2_time = time[j]; wv2_txt = StringFormat("WAVE 2 %d", j); ObjectCreate(chart_id, wv1_txt, OBJ_TEXT, 0, wv1_time, wv1); ObjectSetString(chart_id, wv1_txt, OBJPROP_TEXT, "WV1"); ObjectSetInteger(chart_id, wv1_txt, OBJPROP_COLOR, clrBlue); ObjectCreate(chart_id, wv2_txt, OBJ_TEXT, 0, wv2_time, wv2); ObjectSetString(chart_id, wv2_txt, OBJPROP_TEXT, "WV2"); ObjectSetInteger(chart_id, wv2_txt, OBJPROP_COLOR, clrBlue); fib_ext_wv1_wv2 = StringFormat("FIBO EXTENSION WAVE 1 AND 2 %d", i); ObjectCreate(chart_id, fib_ext_wv1_wv2, OBJ_EXPANSION, 0, wv2_time, wv2, wv1_time, wv1, wv2_time, wv2); ObjectSetInteger(chart_id, fib_ext_wv1_wv2, OBJPROP_COLOR, clrBlue); for(int i = 0; i <= 2; i++) { ObjectSetInteger(chart_id, fib_ext_wv1_wv2, OBJPROP_LEVELCOLOR, i, clrBlue); } break; } } } } } } //+------------------------------------------------------------------+ //| FUNCTION FOR SWING LOW | //+------------------------------------------------------------------+ bool IsSwingLow(const double &low_price[], int index, int lookback) { for(int i = 1; i <= lookback; i++) { if(low_price[index] > low_price[index - i] || low_price[index] > low_price[index + i]) return false; } return true; } //+------------------------------------------------------------------+ //| FUNCTION FOR SWING HIGH | //+------------------------------------------------------------------+ bool IsSwingHigh(const double &high_price[], int index, int lookback) { for(int i = 1; i <= lookback; i++) { if(high_price[index] < high_price[index - i] || high_price[index] < high_price[index + i]) return false; } return true; }
Output:

Explanation:
Certain variables are declared to retain crucial information about the first two waves to efficiently identify and describe patterns such as the Bearish Wolfe Wave on the chart. Three variables are added for Wave 1: wv1 to hold the price level, wv1_time to note the precise moment that price occurred, and wv1_txt to act as a text label for the wave's graphic representation on the chart. The variables wv2, wv2_time, and wv2_txt have the same function for Wave 2.
Because they enable the Expert Advisor to save and subsequently consult the precise price points and timestamps where notable swing highs or lows were detected, these data are crucial. The trader may more easily determine which wave is being emphasized on the chart thanks to the string labels, which are especially helpful for visual clarity.
A string variable called fib_ext_wv1_wv2 is declared to store the name of the Fibonacci Extension object in addition to the wave data. This variable makes sure that the item that represents the extension from Wave 1 to Wave 2 may be appropriately generated, altered, or removed when needed because each object on the chart needs to have a unique identification. To keep each instance unique, the wave index is usually included in the name, particularly if the Expert Advisor creates several patterns while looking through past bars.
The code additionally uses the ChartID() function to obtain the current chart's unique ID and stores it in the variable chart_id to support all object-creation operations. Because MetaTrader 5 enables many charts to be open simultaneously, this is significant. To prevent conflicts or misplacements, the application makes sure that it produces and alters graphical elements on the intended chart by explicitly referencing the relevant chart ID.
The line ObjectsDeleteAll(chart_id); in the OnDeinit() function has a cleanup function. This function removes all objects previously drawn by the Expert Advisor from the chart when the Expert Advisor is removed or the chart is closed. This avoids clutter and guarantees that, once the EA has finished operating, outdated drawing elements like wave labels or Fibonacci lines won't be left behind.
The EA makes a critical check to ensure there are enough bars available before the pattern-detecting logic starts. It makes a comparison between the number of bars it plans to scan (bars_check) and the total number of bars on the chart (total_symbol_bars). The program starts scanning the price data to find the early signs of a Bearish Wolfe Wave after confirming that there are enough historical bars loaded on the display (if(total_symbol_bars >= bars_check)).
The first step in this detection is a for loop:
for(int i = 7; i < bars_check - 7; i++)
For the purpose of safely checking for swing highs and lows, the loop begins at index 7 rather than 0. To ascertain whether a price is actually a swing point, the swing detection functions (described in a moment) examine seven bars forward and seven bars backward. There wouldn't be any prior bars to compare if the loop began at index 0, leading to an out-of-bounds error. In a similar vein, stopping the loop at bars_check -7 guarantees that there will be sufficient subsequent bars for comparison.
This outer loop is looking for what could be Wave 1 of the Wolfe Wave pattern, a swing high. The code determines whether the high price at index i is a local maximum, meaning it is higher than the surrounding candles. Each index i represents a historical candle.
if(IsSwingHigh(high, i, 7))
The EA views this candle as a potential Wave 1 candidate if the function yields true, indicating that it is a legitimate swing high. A label string (wv1_txt) is made for use on the chart later, and the associated high price and time are saved to the variables wv1 and wv1_time.
The code initiates an inner loop to look forward in time for the subsequent valid swing low, which would represent Wave 2, once a valid Wave 1 (swing high) has been located:
for(int j = i; j < bars_check - 7; j++)
This loop starts from the same index as the outer loop (i) and moves forward. It scans for a bar that meets two conditions:
- It is a swing low (a local minimum).
- Its price is lower than the price of Wave 1.
if(IsSwingLow(low, j, 7) && low[j] < wv1)
When both Wave 2 requirements are satisfied, the EA records the cost, time, and label as wv2, wv2_time, and wv2_txt. Once Waves 1 and 2 have been located, it uses a break statement to end the inner loop, draws a Fibonacci Extension object between them, and adds text labels to the chart for both locations. This stops the EA from identifying a suitable match for the current Wave 1 and then looking for more Wave 2 possibilities.
Identifying Wave Three and Four
To construct the Wolfe Wave pattern, it makes sense to identify Waves 3 and 4 after correctly identifying Waves 1 and 2. The location and composition of Waves 1 and 2 have a significant impact on these later waves, though. Wave 3 in particular needs to fulfill two essential requirements: it needs to develop above Wave 1's high and fall inside a predetermined Fibonacci extension range that is calculated from Waves 1 and 2.
The price movement from Wave 1 to Wave 2 is used to plot a Fibonacci Extension to identify this range. Based on the magnitude and momentum of the first wave structure, this tool assists in projecting possible future price levels. The range that the price is anticipated to reach before reversing is the 127.2% to 161.8% extension levels, which is normally the acceptable area for Wave 3. The price is thought to be a good contender for Wave 3 if it swings high within this range.
Wave 3 must respect the pattern's symmetry in addition to its price level. The structure and scale of Waves 1 and 2 should be appropriately mirrored or echoed by Waves 3 and 4. It is this geometric equilibrium that distinguishes legitimate Wolfe Wave forms. We will define symmetry in straightforward, quantifiable terms for the purposes of this study. The total movement from Wave 1 to Wave 2 should be at least 70% the size of Waves 3 and 4, specifically. As we continue to develop the Expert Advisor, this percentage offers a solid framework for pattern validation and contributes to preserving the Wolfe Wave's structural and visual integrity.
Determining 70% of the distance between Wave 1 and Wave 2
First, let’s determine 70% of the distance between Wave 1 and Wave 2.
Example:
double wv1_wv2_size;
double wv1_wv2_70p;
if(total_symbol_bars >= bars_check)
  {
   for(int i = 7; i < bars_check - 7; i++)
     {
      if(IsSwingHigh(high, i, 7))
        {
         wv1 = high[i];
         wv1_time = time[i];
         wv1_txt = StringFormat("WAVE 1 %d", i);

         for(int j = i; j < bars_check - 7; j++)
           {
            if(IsSwingLow(low, j, 7) && low[j] < wv1)
              {
               wv2 = low[j];
               wv2_time = time[j];
               wv2_txt = StringFormat("WAVE 2 %d", j);

               ObjectCreate(chart_id, wv1_txt, OBJ_TEXT, 0, wv1_time, wv1);
               ObjectSetString(chart_id, wv1_txt, OBJPROP_TEXT, "WV1");
               ObjectSetInteger(chart_id, wv1_txt, OBJPROP_COLOR, clrBlue);

               ObjectCreate(chart_id, wv2_txt, OBJ_TEXT, 0, wv2_time, wv2);
               ObjectSetString(chart_id, wv2_txt, OBJPROP_TEXT, "WV2");
               ObjectSetInteger(chart_id, wv2_txt, OBJPROP_COLOR, clrBlue);

               fib_ext_wv1_wv2 = StringFormat("FIBO EXTENSION WAVE 1 AND 2 %d", i);
               ObjectCreate(chart_id, fib_ext_wv1_wv2, OBJ_EXPANSION, 0, wv2_time, wv2, wv1_time, wv1, wv2_time, wv2);
               ObjectSetInteger(chart_id, fib_ext_wv1_wv2, OBJPROP_COLOR, clrBlue);

               for(int i = 0; i <= 2; i++)
                 {
                  ObjectSetInteger(chart_id, fib_ext_wv1_wv2, OBJPROP_LEVELCOLOR, i, clrBlue);
                 }

               wv1_wv2_size = MathAbs(wv1 - wv2);
               wv1_wv2_70p = (wv1_wv2_size / 100) * 70;

               string luh = StringFormat("bb 2 %d", j);
               ObjectCreate(chart_id, luh, OBJ_TREND, 0, wv1_time, wv1 - wv1_wv2_70p, wv2_time, wv1 - wv1_wv2_70p);

               break;
              }
           }
        }
     }
  }
Output:

Explanation:
Wave 3 must respect the pattern's symmetry in addition to its price level. The structure and scale of Waves 1 and 2 should be appropriately mirrored or echoed by Waves 3 and 4. It is this geometric equilibrium that distinguishes legitimate Wolfe Wave forms. We will define symmetry in straightforward, quantifiable terms for the purposes of this study. The total movement from Wave 1 to Wave 2 should be at least 70% the size of Waves 3 and 4, specifically. As we continue to develop the Expert Advisor, this percentage offers a solid framework for pattern validation and contributes to preserving the Wolfe Wave's structural and visual integrity.
To help visualize this criterion, a horizontal trend line is drawn on the chart from the time of Wave 1 to the time of Wave 2 at a price level 70% below the Wave 1 high. This line serves as a reference point to guarantee that succeeding waves meet the minimum size requirement.
Regardless of the order of Waves 1 and 2, the MathAbs function is utilized here to guarantee that the computed size is always positive. Using MathAbs is a preventive measure, albeit it is not technically required in this specific circumstance, as Wave 1 is anticipated to be above Wave 2 in a bearish pattern. It helps prevent possible mistakes if the waves are underestimated or switched.
Fibonacci Expansion of Wave 1 and Wave 2
Using the IsSwingHigh function, the algorithm finds Wave 3 by searching for a swing high that comes after Wave 2 and lies between the 127.2% and 161.8% Fibonacci expansion of Waves 1 and 2. Wave 3 is saved if it fits. To make sure we're dealing with the right pattern, we only draw the Fibonacci tools, the 70% line, and wave names on the chart. Wave 4, which must be a swing low after Wave 3, is then sought after by the algorithm.
Example:
input ENUM_TIMEFRAMES timeframe = PERIOD_CURRENT;
input double max_fib_ext_wv12 = 161.8;
input double min_fib_ext_wv12 = 127.2;

int bars_check = 500;
datetime time_bar;
double total_symbol_bars;

double open[];
double close[];
double low[];
double high[];
datetime time[];

double wv1;
datetime wv1_time;
string wv1_txt;

double wv2;
datetime wv2_time;
string wv2_txt;

string fib_ext_wv1_wv2;

ulong chart_id = ChartID();

double wv1_wv2_size;
double wv1_wv2_70p;
string perc_70;
double fib_ext_1_2_161_8;
double fib_ext_1_2_127_2;
string fib_ext_range;

//+------------------------------------------------------------------+
//| Expert initialization function                                   |
//+------------------------------------------------------------------+
int OnInit()
  {
   return(INIT_SUCCEEDED);
  }

//+------------------------------------------------------------------+
//| Expert deinitialization function                                 |
//+------------------------------------------------------------------+
void OnDeinit(const int reason)
  {
   ObjectsDeleteAll(chart_id);
  }

//+------------------------------------------------------------------+
//| Expert tick function                                             |
//+------------------------------------------------------------------+
void OnTick()
  {
   total_symbol_bars = Bars(_Symbol, timeframe);
   time_bar = iTime(_Symbol, timeframe, 0);

   CopyOpen(_Symbol, timeframe, time_bar, bars_check, open);
   CopyClose(_Symbol, timeframe, time_bar, bars_check, close);
   CopyLow(_Symbol, timeframe, time_bar, bars_check, low);
   CopyHigh(_Symbol, timeframe, time_bar, bars_check, high);
   CopyTime(_Symbol, timeframe, time_bar, bars_check, time);

   if(total_symbol_bars >= bars_check)
     {
      for(int i = 7; i < bars_check - 7; i++)
        {
         if(IsSwingHigh(high, i, 7))
           {
            wv1 = high[i];
            wv1_time = time[i];
            wv1_txt = StringFormat("WAVE 1 %d", i);

            for(int j = i; j < bars_check - 7; j++)
              {
               if(IsSwingLow(low, j, 7) && low[j] < wv1)
                 {
                  wv2 = low[j];
                  wv2_time = time[j];
                  wv2_txt = StringFormat("WAVE 2 %d", j);

                  ObjectCreate(chart_id, wv1_txt, OBJ_TEXT, 0, wv1_time, wv1);
                  ObjectSetString(chart_id, wv1_txt, OBJPROP_TEXT, "WV1");
                  ObjectSetInteger(chart_id, wv1_txt, OBJPROP_COLOR, clrBlue);

                  ObjectCreate(chart_id, wv2_txt, OBJ_TEXT, 0, wv2_time, wv2);
                  ObjectSetString(chart_id, wv2_txt, OBJPROP_TEXT, "WV2");
                  ObjectSetInteger(chart_id, wv2_txt, OBJPROP_COLOR, clrBlue);

                  fib_ext_wv1_wv2 = StringFormat("FIBO EXTENSION WAVE 1 AND 2 %d", i);
                  ObjectCreate(chart_id, fib_ext_wv1_wv2, OBJ_EXPANSION, 0, wv2_time, wv2, wv1_time, wv1, wv2_time, wv2);
                  ObjectSetInteger(chart_id, fib_ext_wv1_wv2, OBJPROP_COLOR, clrBlue);

                  for(int i = 0; i <= 2; i++)
                    {
                     ObjectSetInteger(chart_id, fib_ext_wv1_wv2, OBJPROP_LEVELCOLOR, i, clrBlue);
                    }

                  wv1_wv2_size = MathAbs(wv1 - wv2);
                  wv1_wv2_70p = (wv1_wv2_size / 100) * 70;

                  perc_70 = StringFormat("70 PERCENT %d", j);
                  ObjectCreate(chart_id, perc_70, OBJ_TREND, 0, wv1_time, wv1 - wv1_wv2_70p, wv2_time, wv1 - wv1_wv2_70p);

                  fib_ext_1_2_127_2 = MathAbs((((wv1 - wv2) / 100) * (min_fib_ext_wv12 - 100)) + wv1);
                  fib_ext_1_2_161_8 = MathAbs((((wv1 - wv2) / 100) * (max_fib_ext_wv12 - 100)) + wv1);

                  fib_ext_range = StringFormat("Fibo EXPENSION RANGE%d", j);
                  ObjectCreate(chart_id, fib_ext_range, OBJ_RECTANGLE, 0, wv1_time, fib_ext_1_2_161_8, wv2_time, fib_ext_1_2_127_2);

                  break;
                 }
              }
           }
        }
     }
  }

//+------------------------------------------------------------------+
//| FUNCTION FOR SWING LOW                                           |
//+------------------------------------------------------------------+
bool IsSwingLow(const double &low_price[], int index, int lookback)
  {
   for(int i = 1; i <= lookback; i++)
     {
      if(low_price[index] > low_price[index - i] || low_price[index] > low_price[index + i])
         return false;
     }
   return true;
  }

//+------------------------------------------------------------------+
//| FUNCTION FOR SWING HIGH                                          |
//+------------------------------------------------------------------+
bool IsSwingHigh(const double &high_price[], int index, int lookback)
  {
   for(int i = 1; i <= lookback; i++)
     {
      if(high_price[index] < high_price[index - i] || high_price[index] < high_price[index + i])
         return false;
     }
   return true;
  }
Output:

Identifying Wave 3
The code moves ahead from Wave 2 to discover a swing high that is inside the 127.2% to 161.8% expansion of Waves 1 and 2 to identify Wave 3 as a bearish Wolfe Wave. This zone is designated as Wave 3 if a legitimate swing is discovered there.
Example:double wv3; datetime wv3_time; string wv3_txt;
if(total_symbol_bars >= bars_check)
     {
      for(int i = 7; i < bars_check - 7; i++)
        {
         if(IsSwingHigh(high, i, 7))
           {
            wv1 = high[i];
            wv1_time = time[i];
            wv1_txt = StringFormat("WAVE 1 %d", i);

            for(int j = i; j < bars_check - 7; j++)
              {
               if(IsSwingLow(low, j, 7) && low[j] < wv1)
                 {
                  wv2 = low[j];
                  wv2_time = time[j];
                  wv2_txt = StringFormat("WAVE 2 %d", j);

                  wv1_wv2_size = MathAbs(wv1 - wv2);
                  wv1_wv2_70p = (wv1_wv2_size / 100) * 70;

                  fib_ext_1_2_127_2 = MathAbs((((wv1 - wv2) / 100) * (min_fib_ext_wv12 - 100)) + wv1);
                  fib_ext_1_2_161_8 = MathAbs((((wv1 - wv2) / 100) * (max_fib_ext_wv12 - 100)) + wv1);

                  for(int k = j; k < bars_check - 7; k++)
                    {
                     if(IsSwingHigh(high, k, 7) && time[k] > wv2_time)
                       {
                        wv3 = high[k];
                        wv3_time = time[k];
                        wv3_txt = StringFormat("WAVE 3 %d", k);

                        if(wv3 >= fib_ext_1_2_127_2 && wv3 <= fib_ext_1_2_161_8)
                          {
                           ObjectCreate(chart_id, wv1_txt, OBJ_TEXT, 0, wv1_time, wv1);
                           ObjectSetString(chart_id, wv1_txt, OBJPROP_TEXT, "WV1");
                           ObjectSetInteger(chart_id, wv1_txt, OBJPROP_COLOR, clrBlue);

                           ObjectCreate(chart_id, wv2_txt, OBJ_TEXT, 0, wv2_time, wv2);
                           ObjectSetString(chart_id, wv2_txt, OBJPROP_TEXT, "WV2");
                           ObjectSetInteger(chart_id, wv2_txt, OBJPROP_COLOR, clrBlue);

                           fib_ext_wv1_wv2 = StringFormat("FIBO EXTENSION WAVE 1 AND 2 %d", i);
                           ObjectCreate(chart_id, fib_ext_wv1_wv2, OBJ_EXPANSION, 0, wv2_time, wv2, wv1_time, wv1, wv2_time, wv2);
                           ObjectSetInteger(chart_id, fib_ext_wv1_wv2, OBJPROP_COLOR, clrBlue);

                           for(int i = 0; i <= 2; i++)
                             {
                              ObjectSetInteger(chart_id, fib_ext_wv1_wv2, OBJPROP_LEVELCOLOR, i, clrBlue);
                             }

                           perc_70 = StringFormat("70 PERCENT %d", j);
                           ObjectCreate(chart_id, perc_70, OBJ_TREND, 0, wv1_time, wv1 - wv1_wv2_70p, wv2_time, wv1 - wv1_wv2_70p);

                           fib_ext_range = StringFormat("Fibo EXPENSION RANGE%d", j);
                           ObjectCreate(chart_id, fib_ext_range, OBJ_RECTANGLE, 0, wv1_time, fib_ext_1_2_161_8, wv2_time, fib_ext_1_2_127_2);

                           ObjectCreate(chart_id, wv3_txt, OBJ_TEXT, 0, wv3_time, wv3);
                           ObjectSetString(chart_id, wv3_txt, OBJPROP_TEXT, "WV3");
                           ObjectSetInteger(chart_id, wv3_txt, OBJPROP_COLOR, clrBlue);
                          }

                        break;
                       }
                    }

                  break;
                 }
              }
           }
        }
     }
Output:

Explanation:
Three variables are used in the code to define Wave 3: wv3 for price level, wv3_time for timing, and wv3_txt for labeling. By employing the IsSwingHigh function to locate legitimate swing highs that follow Wave 2, it can determine Wave 3 by scanning forward from Wave 2's location. Previously, all the objects were drawn after detecting wv2. Now, these objects will only appear when wv3 falls within the specified extension of wv1 and wv2.
Identifying Wave 4
Finding Wave 4, which must be a swing low that develops following Wave 3, is the next stage. We must verify that the price movement from Wave 3 to Wave 4 maintains a decent symmetry with the movement from Wave 1 to Wave 2 to confirm that the pattern is still valid. We are employing a straightforward symmetry criterion in this project, which states that Waves 3 through 4 must be at least 70% as large as Waves 1 through 2. By preventing disproportionate or shallow retracements, this requirement aids in maintaining the structural equilibrium of the Wolfe Wave pattern. In the following part, we will put this reasoning into practice by looking for a legitimate swing low following Wave 3 and confirming that it satisfies the minimum size criteria.
Example:double wv4; datetime wv4_time; string wv4_txt; double wv3_wv4_size;
if(total_symbol_bars >= bars_check)
     {
      for(int i = 7; i < bars_check - 7; i++)
        {
         if(IsSwingHigh(high, i, 7))
           {
            wv1 = high[i];
            wv1_time = time[i];
            wv1_txt = StringFormat("WAVE 1 %d", i);

            for(int j = i; j < bars_check - 7; j++)
              {
               if(IsSwingLow(low, j, 7) && low[j] < wv1)
                 {
                  wv2 = low[j];
                  wv2_time = time[j];
                  wv2_txt = StringFormat("WAVE 2 %d", j);

                  wv1_wv2_size = MathAbs(wv1 - wv2);
                  wv1_wv2_70p = (wv1_wv2_size / 100) * 70;

                  fib_ext_1_2_127_2 = MathAbs((((wv1 - wv2) / 100) * (min_fib_ext_wv12 - 100)) + wv1);
                  fib_ext_1_2_161_8 = MathAbs((((wv1 - wv2) / 100) * (max_fib_ext_wv12 - 100)) + wv1);

                  for(int k = j; k < bars_check - 7; k++)
                    {
                     if(IsSwingHigh(high, k, 7) && time[k] > wv2_time)
                       {
                        wv3 = high[k];
                        wv3_time = time[k];
                        wv3_txt = StringFormat("WAVE 3 %d", k);

                        if(wv3 >= fib_ext_1_2_127_2 && wv3 <= fib_ext_1_2_161_8)
                          {
                           for(int l = k; l < bars_check - 7; l++)
                             {
                              if(IsSwingLow(low, l, 7) && time[l] > wv3_time)
                                {
                                 wv4 = low[l];
                                 wv4_time = time[l];
                                 wv4_txt = StringFormat("WAVE 4 %d", l);

                                 wv3_wv4_size = MathAbs(wv3 - wv4);

                                 if(wv3_wv4_size >= wv1_wv2_size && wv4 > wv2 && wv4 < wv3)
                                   {
                                    ObjectCreate(chart_id, wv1_txt, OBJ_TEXT, 0, wv1_time, wv1);
                                    ObjectSetString(chart_id, wv1_txt, OBJPROP_TEXT, "WV1");
                                    ObjectSetInteger(chart_id, wv1_txt, OBJPROP_COLOR, clrBlue);

                                    ObjectCreate(chart_id, wv2_txt, OBJ_TEXT, 0, wv2_time, wv2);
                                    ObjectSetString(chart_id, wv2_txt, OBJPROP_TEXT, "WV2");
                                    ObjectSetInteger(chart_id, wv2_txt, OBJPROP_COLOR, clrBlue);

                                    fib_ext_wv1_wv2 = StringFormat("FIBO EXTENSION WAVE 1 AND 2 %d", i);
                                    ObjectCreate(chart_id, fib_ext_wv1_wv2, OBJ_EXPANSION, 0, wv2_time, wv2, wv1_time, wv1, wv2_time, wv2);
                                    ObjectSetInteger(chart_id, fib_ext_wv1_wv2, OBJPROP_COLOR, clrBlue);

                                    for(int i = 0; i <= 2; i++)
                                      {
                                       ObjectSetInteger(chart_id, fib_ext_wv1_wv2, OBJPROP_LEVELCOLOR, i, clrBlue);
                                      }

                                    perc_70 = StringFormat("70 PERCENT %d", j);
                                    ObjectCreate(chart_id, perc_70, OBJ_TREND, 0, wv1_time, wv1 - wv1_wv2_70p, wv2_time, wv1 - wv1_wv2_70p);

                                    fib_ext_range = StringFormat("Fibo EXPENSION RANGE%d", j);
                                    ObjectCreate(chart_id, fib_ext_range, OBJ_RECTANGLE, 0, wv1_time, fib_ext_1_2_161_8, wv2_time, fib_ext_1_2_127_2);

                                    ObjectCreate(chart_id, wv3_txt, OBJ_TEXT, 0, wv3_time, wv3);
                                    ObjectSetString(chart_id, wv3_txt, OBJPROP_TEXT, "WV3");
                                    ObjectSetInteger(chart_id, wv3_txt, OBJPROP_COLOR, clrBlue);

                                    ObjectCreate(chart_id, wv4_txt, OBJ_TEXT, 0, wv4_time, wv4);
                                    ObjectSetString(chart_id, wv4_txt, OBJPROP_TEXT, "WV4");
                                    ObjectSetInteger(chart_id, wv4_txt, OBJPROP_COLOR, clrBlue);
                                   }

                                 break;
                                }
                             }
                          }

                        break;
                       }
                    }

                  break;
                 }
              }
           }
        }
     }
Output:

Explanation:
After the program identifies wv3, the next thing is to identify wv4. It will look for the distance between wv3 and wv4 and store it in wv3_wv4_size. After the program spots a swing low, it stores the bar time and price as wv4_time and wv4. The program ensures that wv3 and wv4 is similar to wv1 and wv2, also ensures that Wave 4 stays above Wave 2 and below Wave 3 to preserve the correct structure. The program checks if wv3 falls within specified expansion. Wave 4, which completes the pattern setup utilizing swing logic, Fibonacci filters, and symmetry criteria, is labeled on the chart after all checks are successful.


As you can see in the first image (Figure 11), Wave 3 is not the highest high during the transition from Wave 3 to Wave 4. Wave 3 is meant to be the most important peak before the dip into Wave 4, so this is problematic. The right structure has not been captured by our detection mechanism if a higher high occurs after the point we have designated as Wave 3. The second image (Figure 12) also shows that Wave 1 is not the highest in the area between Waves 1 and 2.
Additionally, this violates the pattern rules because Wave 1 ought to be the dominating swing high in that leg. We won't obtain reliable results for the Wolfe Wave pattern if our algorithm keeps choosing fundamentally incorrect wave points. To increase the detecting logic's dependability, this problem must be resolved.
We will now add an extra validation step for every wave to address the problems we saw in the earlier examples. To be sure that Wave 3 accurately depicts the peak before the decline, it must be the maximum high between Waves 3 and 4. Wave 2 must be the lowest low between Waves 2 and 3 to truly reflect the bottom before the next upward trend. Wave 1 must be the highest high between Waves 1 and 2 to be easily recognized as the significant swing high in that pattern segment.
Example:
int wv3_wv4_bars;
int wv3_highest_index;
double wv3_hh;
datetime wv3_hh_t;

int wv2_wv3_bars;
int wv2_lowest_index;
double wv2_ll;
datetime wv2_ll_t;

int wv1_wv2_bars;
int wv1_highest_index;
double wv1_hh;
datetime wv1_hh_t;
for(int l = k; l < bars_check - 7; l++)
  {
   if(IsSwingLow(low, l, 7) && time[l] > wv3_time)
     {
      wv4 = low[l];
      wv4_time = time[l];
      wv4_txt = StringFormat("WAVE 4 %d", l);

      wv3_wv4_bars = Bars(_Symbol, timeframe, wv3_time, wv4_time);
      wv3_highest_index = ArrayMaximum(high, k, wv3_wv4_bars);
      wv3_hh = high[wv3_highest_index];
      wv3_hh_t = time[wv3_highest_index];

      wv2_wv3_bars = Bars(_Symbol, timeframe, wv2_time, wv3_time);
      wv2_lowest_index = ArrayMinimum(low, j, wv2_wv3_bars);
      wv2_ll = low[wv2_lowest_index];
      wv2_ll_t = time[wv2_lowest_index];

      wv1_wv2_bars = Bars(_Symbol, timeframe, wv1_time, wv2_time);
      wv1_highest_index = ArrayMaximum(high, i, wv1_wv2_bars);
      wv1_hh = high[wv1_highest_index];
      wv1_hh_t = time[wv1_highest_index];

      wv1_wv2_size = MathAbs(wv1_hh - wv2_ll);
      wv1_wv2_70p = (wv1_wv2_size / 100) * 70;

      fib_ext_1_2_127_2 = MathAbs((((wv1_hh - wv2_ll) / 100) * (min_fib_ext_wv12 - 100)) + wv1_hh);
      fib_ext_1_2_161_8 = MathAbs((((wv1_hh - wv2_ll) / 100) * (max_fib_ext_wv12 - 100)) + wv1_hh);

      wv3_wv4_size = MathAbs(wv3_hh - wv4);

      if(wv3_wv4_size >= wv1_wv2_size && wv4 > wv2_ll && wv4 < wv3_hh && wv3_hh >= fib_ext_1_2_127_2 && wv3_hh <= fib_ext_1_2_161_8)
        {
         ObjectCreate(chart_id, wv1_txt, OBJ_TEXT, 0, wv1_hh_t, wv1_hh);
         ObjectSetString(chart_id, wv1_txt, OBJPROP_TEXT, "WV1");
         ObjectSetInteger(chart_id, wv1_txt, OBJPROP_COLOR, clrBlue);

         ObjectCreate(chart_id, wv2_txt, OBJ_TEXT, 0, wv2_ll_t, wv2_ll);
         ObjectSetString(chart_id, wv2_txt, OBJPROP_TEXT, "WV2");
         ObjectSetInteger(chart_id, wv2_txt, OBJPROP_COLOR, clrBlue);

         fib_ext_wv1_wv2 = StringFormat("FIBO EXTENSION WAVE 1 AND 2 %d", i);
         ObjectCreate(chart_id, fib_ext_wv1_wv2, OBJ_EXPANSION, 0, wv2_ll_t, wv2_ll, wv1_hh_t, wv1_hh, wv2_ll_t, wv2_ll);
         ObjectSetInteger(chart_id, fib_ext_wv1_wv2, OBJPROP_COLOR, clrBlue);

         for(int i = 0; i <= 2; i++)
            ObjectSetInteger(chart_id, fib_ext_wv1_wv2, OBJPROP_LEVELCOLOR, i, clrBlue);

         perc_70 = StringFormat("70 PERCENT %d", j);
         ObjectCreate(chart_id, perc_70, OBJ_TREND, 0, wv1_hh_t, wv1_hh - wv1_wv2_70p, wv2_time, wv1 - wv1_wv2_70p);

         fib_ext_range = StringFormat("Fibo EXPENSION RANGE%d", j);
         ObjectCreate(chart_id, fib_ext_range, OBJ_RECTANGLE, 0, wv1_hh_t, fib_ext_1_2_161_8, wv2_ll_t, fib_ext_1_2_127_2);

         ObjectCreate(chart_id, wv3_txt, OBJ_TEXT, 0, wv3_hh_t, wv3_hh);
         ObjectSetString(chart_id, wv3_txt, OBJPROP_TEXT, "WV3");
         ObjectSetInteger(chart_id, wv3_txt, OBJPROP_COLOR, clrBlue);

         ObjectCreate(chart_id, wv4_txt, OBJ_TEXT, 0, wv4_time, wv4);
         ObjectSetString(chart_id, wv4_txt, OBJPROP_TEXT, "WV4");
         ObjectSetInteger(chart_id, wv4_txt, OBJPROP_COLOR, clrBlue);
        }
      break;
     }
  }
Output:

Explanation:
We propose a new set of calculations to verify the Wolfe Wave's structure and make sure that each wave point accurately depicts the most important high or low in its segment. To identify the extreme price points (highest high or lowest low) between each wave segment, we first declare a number of variables: the variable wv3_wv4_bars contains the number of bars that separate Waves 3 and 4. The maximum high within that range is then obtained by using ArrayMaximum to run over the wv3_wv4_bars number of bars and start at index k (where Wave 3 is located). The wv3_highest_index retains the result. This index is used to extract the true high price (wv3_hh) and its timestamp (wv3_hh_t).
wv2_wv3_bars covers the region between Waves 2 and 3, although it functions similarly. Here, we use ArrayMinimum, which yields the index of the lowest price, to find the lowest low. We retrieve the matching low price (wv2_ll) and time (wv2_ll_t) after storing this index in wv2_lowest_index. The number of bars separating Waves 1 and 2 is determined by wv1_wv2_bars. In this case, Wave 1 should be a dominant peak; therefore we use ArrayMaximum again to get the highest high in that area. From the resultant index, which is stored in wv1_highest_index, we extract the high price (wv1_hh) and the date that corresponds to it (wv1_hh_t).
In wv3_wv4_bars, the number of bars between Waves 3 and 4 is recorded. To find the highest high inside that range, we then use ArrayMaximum to go over the wv3_wv4_bars number of bars and start at index k, which is where Wave 3 is located. The result remains in the wv3_highest_index. This index is used to extract the timestamp (wv3_hh_t) and the actual high price (wv3_hh). We increase the accuracy of our Wolfe Wave recognition and decrease the likelihood of identifying weak or incorrect wave patterns by programmatically enforcing these restrictions. The pattern's adherence to technical concepts and suitability for real-world trading analysis are guaranteed by this additional validation stage.
The validated high or low points will now be used for constructing objects on the chart, rather than the wave points that were initially chosen. For Wave 1, we will specifically substitute wv1_hh_t and wv1_hh for wv1_time and wv1. We shall substitute wv2_ll_t and wv2_ll for wv2_time and wv2 for Wave 2. Additionally, for Wave 3, we will substitute wv3_hh_t and wv3_hh with wv3_time and wv3. By making this adjustment, we can be sure that we are referring to each segment's actual structural highs and lows rather than just the initial swing points that were found. We significantly increase the Wolfe Wave visualization's accuracy and dependability by drawing chart objects at these validated areas, assisting traders in making more informed selections based on a more exact pattern structure.
Only when the following criteria are met will the Fibonacci extension, Waves 1–4 chart items, and other graphic components be generated:
if(wv3_wv4_size >= wv1_wv2_size && wv4 > wv2_ll && wv4 < wv3_hh && wv3_hh >= fib_ext_1_2_127_2 && wv3_hh <= fib_ext_1_2_161_8)This condition guarantees that all price-based and structural requirements for a legitimate bearish Wolfe Wave are met. It confirms that Waves 3 and 4 are vertically separated by at least as much as Waves 1 and 2, preserving symmetry. Wave 4's position above the lowest low between Waves 2 and 3 and below the highest high between Waves 3 and 4 is further confirmed by this. In addition, Wave 3 must be within the 127.2% to 200% Fibonacci expansion range in comparison to Waves 1 and 2.
The software won't name the waves, create the Fibonacci projection, or indicate the required trend lines on the chart until all of these requirements have been met. This stringent validation guarantees greater accuracy in Wolfe Wave recognition and helps prevent the drawing of inaccurate or incomplete patterns.
Identifying Wave Five
Finding Wave 5 is the next stage in our Wolfe Wave detection procedure. Because it indicates the pattern's possible reversal point, this wave is crucial. Wave 5 is a useful indicator in technical analysis, since traders frequently search for it to predict a shift in the market's direction. However, we must first construct three crucial trend lines that will direct the confirmation of Wave 5 before we can correctly identify it.
The initial trend line will connect waves 1 and 3. This line typically represents the upper limit of the pattern in a bearish Wolfe Wave. It helps define the structure and direction of the pattern and serves as a resistance level that the price stays inside throughout the construction of Wave 4 and the development of Wave 5. The second trend line will connect waves two and four. This line is important because it clarifies the channel structure and symmetry of the Wolfe Wave. As the price gets closer to the reversal point, it gives a general indication of the expected trajectory of Wave 5.
The third trend line, which links Waves 1 and 4, has a distinct function from the first two. Usually, this line is utilized to decide when to end the transaction. The Wave 1 to Wave 4 line serves as the take-profit target in a bearish Wolfe Wave once Wave 5 has been discovered and the price begins to move in the expected direction. As soon as the market crosses this trend line, the trade will be closed because it indicates that the anticipated move has occurred, and the pattern is complete.
Example:string tline_1_3; string tline_2_4; string tline_1_4;
if(wv3_wv4_size >= wv1_wv2_size && wv4 > wv2_ll && wv4 < wv3_hh && wv3_hh >= fib_ext_1_2_127_2 && wv3_hh <= fib_ext_1_2_161_8)
  {
   ObjectCreate(chart_id, wv1_txt, OBJ_TEXT, 0, wv1_hh_t, wv1_hh);
   ObjectSetString(chart_id, wv1_txt, OBJPROP_TEXT, "WV1");
   ObjectSetInteger(chart_id, wv1_txt, OBJPROP_COLOR, clrBlue);

   ObjectCreate(chart_id, wv2_txt, OBJ_TEXT, 0, wv2_ll_t, wv2_ll);
   ObjectSetString(chart_id, wv2_txt, OBJPROP_TEXT, "WV2");
   ObjectSetInteger(chart_id, wv2_txt, OBJPROP_COLOR, clrBlue);

   fib_ext_wv1_wv2 = StringFormat("FIBO EXTENSION WAVE 1 AND 2 %d", i);

   ObjectCreate(chart_id, fib_ext_wv1_wv2, OBJ_EXPANSION, 0, wv2_ll_t, wv2_ll, wv1_hh_t, wv1_hh, wv2_ll_t, wv2_ll);
   ObjectSetInteger(chart_id, fib_ext_wv1_wv2, OBJPROP_COLOR, clrBlue);

   for(int i = 0; i <= 2; i++)
     {
      ObjectSetInteger(chart_id, fib_ext_wv1_wv2, OBJPROP_LEVELCOLOR, i, clrBlue);
     }

   perc_70 = StringFormat("70 PERCENT %d", j);
   ObjectCreate(chart_id, perc_70, OBJ_TREND, 0, wv1_hh_t, wv1_hh - wv1_wv2_70p, wv2_time, wv1 - wv1_wv2_70p);

   fib_ext_range = StringFormat("Fibo EXPENSION RANGE%d", j);
   ObjectCreate(chart_id, fib_ext_range, OBJ_RECTANGLE, 0, wv1_hh_t, fib_ext_1_2_161_8, wv2_ll_t, fib_ext_1_2_127_2);

   ObjectCreate(chart_id, wv3_txt, OBJ_TEXT, 0, wv3_hh_t, wv3_hh);
   ObjectSetString(chart_id, wv3_txt, OBJPROP_TEXT, "WV3");
   ObjectSetInteger(chart_id, wv3_txt, OBJPROP_COLOR, clrBlue);

   ObjectCreate(chart_id, wv4_txt, OBJ_TEXT, 0, wv4_time, wv4);
   ObjectSetString(chart_id, wv4_txt, OBJPROP_TEXT, "WV4");
   ObjectSetInteger(chart_id, wv4_txt, OBJPROP_COLOR, clrBlue);

   tline_1_3 = StringFormat("TREND LINE WAVE 1 AND 3 %d", i);
   ObjectCreate(chart_id, tline_1_3, OBJ_TREND, 0, wv1_hh_t, wv1_hh, wv3_hh_t, wv3_hh);
   ObjectSetInteger(chart_id, tline_1_3, OBJPROP_COLOR, clrBlue);

   tline_2_4 = StringFormat("TREND LINE WAVE 2 AND 4 %d", i);
   ObjectCreate(chart_id, tline_2_4, OBJ_TREND, 0, wv2_ll_t, wv2_ll, wv4_time, wv4);
   ObjectSetInteger(chart_id, tline_2_4, OBJPROP_COLOR, clrBlue);

   tline_1_4 = StringFormat("TREND LINE WAVE 1 AND 4 %d", i);
   ObjectCreate(chart_id, tline_1_4, OBJ_TREND, 0, wv1_hh_t, wv1_hh, wv4_time, wv4);
   ObjectSetInteger(chart_id, tline_1_4, OBJPROP_COLOR, clrBlue);
  }
Output:

Explanation:
The purpose of the initial declaration of the string variables tline_1_3, tline_2_4, and tline_1_4 is to uniquely identify trend lines on the chart. In tline_1_3, the upper boundary of the bearish Wolfe Wave pattern is represented by the trend line that connects Waves 1 and 3. ObjectCreate() is used to make it using the confirmed highest points of Waves 1 and 3, and it is colored blue for easy visibility. The second trend line, which connects Waves 2 and 4, is maintained in tline_2_4. The lowest low of Wave 2 (wv2_ll_t, wv2_ll) is drawn between the point of Wave 4 (wv4_time, wv4), which is also styled in blue. Waves 1 and 4 are connected by the third trend line, tline_1_4.
The trend lines are only generated between two pre-established anchor points, which is an issue with this method. Each line in a genuine Wolfe Wave pattern should extend past its second anchor to indicate possible future interactions between the anchor and the price. For example, the trend line between Waves 1 and 3 is not merely a short segment between those two points. Instead, unless the market rises above it and then drops back below, it is expected to continue past Wave 3 and into the future. This expanded section provides a clearer picture of the link between price and the upper boundary of the pattern over time.
Maintaining Wolfe Wave symmetry and predicting the likely location of Wave 5 requires that the trend line between Waves 2 and 4 be the same length and direction as the line between Waves 1 and 3. As the price moves toward the trend line, which serves as the trade exit objective and indicates when to complete the transaction, it must also be extended past Wave 4 to be followed. All three trend lines must, in other words, be appropriately extended into the future to offer accurate pattern confirmation and trade preparation.
Example:
tline_1_3 = StringFormat("TREND LINE WAVE 1 AND 3 %d", i);
ObjectCreate(chart_id,tline_1_3,OBJ_TREND,0,wv1_hh_t,wv1_hh,wv3_hh_t,wv3_hh);
ObjectSetInteger(chart_id, tline_1_3, OBJPROP_COLOR, clrBlue);
ObjectSetInteger(chart_id, tline_1_3, OBJPROP_RAY_RIGHT, true);

tline_2_4 = StringFormat("TREND LINE WAVE 2 AND 4 %d", i);
ObjectCreate(chart_id,tline_2_4,OBJ_TREND,0,wv2_ll_t,wv2_ll,wv4_time,wv4);
ObjectSetInteger(chart_id, tline_2_4, OBJPROP_COLOR, clrBlue);
ObjectSetInteger(chart_id, tline_1_3, OBJPROP_RAY_RIGHT, true);

tline_1_4 = StringFormat("TREND LINE WAVE 1 AND 4 %d", i);
ObjectCreate(chart_id,tline_1_4,OBJ_TREND,0,wv1_hh_t,wv1_hh,wv4_time,wv4);
ObjectSetInteger(chart_id, tline_1_4, OBJPROP_COLOR, clrBlue);
ObjectSetInteger(chart_id, tline_1_3, OBJPROP_RAY_RIGHT, true);

OBJPROP_RAY_RIGHT attribute ensures that trend lines are beyond their anchor locations, which is also a problem. Although this could be useful for maintaining line visibility, it doesn't correspond with the precise behavior we're looking for in Wolfe Wave analysis. We don't want the trend lines to go on forever in our situation. Rather, we want them to halt at a specified moment, especially when a particular circumstance is satisfied.
The trend line connecting Waves 1 and 3, for instance, should only go as far as the market passes above it before falling back below. By doing this, accuracy is preserved, and the chart is kept clear of superfluous, maybe irrelevant trend lines. We have greater control, and the Wolfe Wave pattern's visual structure is more precise and clean when we set a specified end time for each line based on actual price interaction.
Example:tline_1_3 = StringFormat("TREND LINE WAVE 1 AND 3 %d", i); if(ObjectCreate(chart_id,tline_1_3,OBJ_TREND,0,wv1_hh_t,wv1_hh,wv3_hh_t,wv3_hh)) { ObjectSetInteger(chart_id, tline_1_3, OBJPROP_COLOR, clrBlue); ObjectSetInteger(chart_id, tline_1_3, OBJPROP_RAY_RIGHT, true); ObjectSetInteger(chart_id, tline_1_3, OBJPROP_TIMEFRAMES, OBJ_NO_PERIODS); } tline_2_4 = StringFormat("TREND LINE WAVE 2 AND 4 %d", i); if(ObjectCreate(chart_id,tline_2_4,OBJ_TREND,0,wv2_ll_t,wv2_ll,wv4_time,wv4)) { ObjectSetInteger(chart_id, tline_2_4, OBJPROP_COLOR, clrBlue); ObjectSetInteger(chart_id, tline_2_4, OBJPROP_RAY_RIGHT, true); ObjectSetInteger(chart_id, tline_2_4, OBJPROP_TIMEFRAMES, OBJ_NO_PERIODS); } tline_1_4 = StringFormat("TREND LINE WAVE 1 AND 4 %d", i); if(ObjectCreate(chart_id,tline_1_4,OBJ_TREND,0,wv1_hh_t,wv1_hh,wv4_time,wv4)) { ObjectSetInteger(chart_id, tline_1_4, OBJPROP_COLOR, clrBlue); ObjectSetInteger(chart_id, tline_1_4, OBJPROP_RAY_RIGHT, true); ObjectSetInteger(chart_id, tline_1_4, OBJPROP_TIMEFRAMES, OBJ_NO_PERIODS); }

Explanation:
By setting its attribute to conceal it on all timeframes, this code generates an invisible trend line that may be utilized internally without being seen on the chart. It then keeps an eye out for significant price swings, such as when a candlestick closes above and then below this wave 1-3 trend line.
Example:double t_1_3_values; double t_2_4_values; string tline_1_3_visible; string tline_2_4_visible;
for(int m = l; m < bars_check - 2; m++)
  {

   t_1_3_values = ObjectGetValueByTime(chart_id, tline_1_3, time[m], 0);
   t_2_4_values = ObjectGetValueByTime(chart_id, tline_2_4, time[m], 0);

   if(close[m] > open[m] && open[m] < t_1_3_values && close[m] > t_1_3_values && time[m] > time[l+4])
     {

      tline_1_3_visible = StringFormat("TREND LINE WAVE 1 AND 3 V %d", i);
      ObjectCreate(chart_id,tline_1_3_visible,OBJ_TREND,0,wv1_hh_t,wv1_hh,time[m],t_1_3_values);
      ObjectSetInteger(chart_id, tline_1_3_visible, OBJPROP_COLOR, clrBlue);

      tline_2_4_visible = StringFormat("TREND LINE WAVE 2 AND 4 V %d", i);
      ObjectCreate(chart_id,tline_2_4_visible,OBJ_TREND,0,wv2_ll_t,wv2_ll,time[m],t_2_4_values);
      ObjectSetInteger(chart_id, tline_2_4_visible, OBJPROP_COLOR, clrBlue);

      break;
     }
  }
Output:

Explanation:
This code section detects when the price breaks above the trend line connecting Waves 1 and 3 by checking future bars from Wave 4 onward. It uses variables to get the trend line’s price level at each bar’s time and looks for a bullish candlestick that opens below but closes above the trend line, signaling a breakout that must occur at least four bars after Wave 4. Two additional visible trend lines are generated and dynamically named using StringFormat upon detection of the breakout. The chart then displays these trend lines, one linking Wave 1 to the breakout point and the other linking Wave 2 to the same position. This helps you better watch and evaluate the development of the Wolfe Wave pattern by giving them a clear visual indication of the precise bar where price passes above the Wave 1–3 trend line.
But this isn't our objective. Although they aid in emphasizing the breakout, the visible trend lines that are generated upon the market's crossing and closing above the Waves 1-3 trend line do not yet finish the Wolfe Wave structure. The real goal is to keep extending these lines until the market crosses and closes below the trend line from Waves 1-3.
Example:double t_1_3_values_2;for(int m = l; m < bars_check - 2; m++) { t_1_3_values = ObjectGetValueByTime(chart_id, tline_1_3, time[m], 0); if(close[m] > open[m] && open[m] < t_1_3_values && close[m] > t_1_3_values && time[m] > time[l+4]) { for(int n = m; n < bars_check - 1; n++) { t_1_3_values_2 = ObjectGetValueByTime(chart_id, tline_1_3, time[n], 0); t_2_4_values = ObjectGetValueByTime(chart_id, tline_2_4, time[n], 0); if(close[n] < open[n] && open[n] > t_1_3_values_2 && close[n] < t_1_3_values_2) { tline_1_3_visible = StringFormat("TREND LINE WAVE 1 AND 3 V %d", i); ObjectCreate(chart_id,tline_1_3_visible,OBJ_TREND,0,wv1_hh_t,wv1_hh,time[n],t_1_3_values_2); ObjectSetInteger(chart_id, tline_1_3_visible, OBJPROP_COLOR, clrBlue); tline_2_4_visible = StringFormat("TREND LINE WAVE 2 AND 4 V %d", i); ObjectCreate(chart_id,tline_2_4_visible,OBJ_TREND,0,wv2_ll_t,wv2_ll,time[n],t_2_4_values); ObjectSetInteger(chart_id, tline_2_4_visible, OBJPROP_COLOR, clrBlue); break; } } break; } }
Output:

Explanation:
But this isn't our objective. Although they aid in emphasizing the breakout, the visible trend lines that are generated upon the market's crossing and closing above the Waves 1-3 trend line do not yet finish the Wolfe Wave structure. The real goal is to keep extending these lines until the market crosses and closes below the trend line from Waves 1-3. In particular, the inner for loop uses the variable t_1_3_values_2 to hold the price level of the Wave 1–3 trend line at a later time. This loop starts scanning ahead from the bar where the breakthrough above the trend line was observed (m). It uses ObjectGetValueByTime to retrieve the trend line value at that moment for each bar n, storing it in t_1_3_values_2.
A bearish candle that opened above the trend line and closed below it is checked for by the expression if(close[n] < open[n] && open[n] > t_1_3_values_2 && close[n] < t_1_3_values_2, which indicates that the price has now crossed back below the trend line. The fact that this point frequently marks the conclusion of Wave 5 and the start of the anticipated price reversal makes it noteworthy. Two discernible trend lines are produced as soon as this second crossing is found; one links Wave 1 to this new location on the chart, and the other links Wave 2 to the same spot. This provides a more thorough and accurate picture of the Wolfe Wave from beginning to breakout to reversal, effectively replacing the previous trend lines. Now, the trend lines extend from their starting locations to the precise point at which price action validates the entire pattern.
The next stage is to ascertain Wave 5's price level. We must determine the highest high between two significant points to accomplish this: the first time the market crosses and closes above the Wave 1 to 3 trend line, and the second time it reverses and crosses below the same trend line. Usually, this range denotes the Wolfe Wave pattern's conclusion phase. Before the expected reverse starts, the price in this area frequently makes one more push upward. Finding the highest high in this window will allow us to precisely identify Wave 5's peak.
Example:int cross_bars; int cross_bars_highest; string wv5_txt;
if(close[m] > open[m] && open[m] < t_1_3_values && close[m] > t_1_3_values && time[m] > time[l+4])
  {

   for(int n = m; n < bars_check - 1; n++)
     {

      t_1_3_values_2 = ObjectGetValueByTime(chart_id, tline_1_3, time[n], 0);
      t_2_4_values = ObjectGetValueByTime(chart_id, tline_2_4, time[n], 0);

      if(close[n] < open[n] && open[n] > t_1_3_values_2 && close[n] < t_1_3_values_2)
        {

         tline_1_3_visible = StringFormat("TREND LINE WAVE 1 AND 3 V %d", i);
         ObjectCreate(chart_id,tline_1_3_visible,OBJ_TREND,0,wv1_hh_t,wv1_hh,time[n],t_1_3_values_2);
         ObjectSetInteger(chart_id, tline_1_3_visible, OBJPROP_COLOR, clrBlue);

         tline_2_4_visible = StringFormat("TREND LINE WAVE 2 AND 4 V %d", i);
         ObjectCreate(chart_id,tline_2_4_visible,OBJ_TREND,0,wv2_ll_t,wv2_ll,time[n],t_2_4_values);
         ObjectSetInteger(chart_id, tline_2_4_visible, OBJPROP_COLOR, clrBlue);

         cross_bars = Bars(_Symbol,timeframe,time[n], time[m]);
         cross_bars_highest = ArrayMaximum(high,m,cross_bars);

         wv5_txt = StringFormat("WAVE 5 %d", i);
         ObjectCreate(chart_id, wv5_txt, OBJ_TEXT, 0, time[cross_bars_highest], high[cross_bars_highest]);
         ObjectSetString(chart_id, wv5_txt, OBJPROP_TEXT, "WV5");
         ObjectSetInteger(chart_id, wv5_txt, OBJPROP_COLOR, clrBlue);

         break;
        }
     }
Explanation:
Wave 5 of the Wolfe Wave pattern is identified and labeled in this code segment. The algorithm determines the number of bars between the breakout and reversal points to determine the anticipated timing for Wave 5 to occur once the price breaks above the Wave 1–3 trend line and then reverses back below it. The code then starts at index m and traverses the number of bars in cross_bars using the ArrayMaximum() function to search the high[] price array. The highest high index in that range, which denotes Wave 5's peak, is returned by this function. The variable cross_bars_highest is where this index is kept.
To designate this recognized high as "WV5," the code lastly generates a text object on the chart. The label is positioned using the date and price value at the cross_bars_highest index, and its color is set to blue to resemble the labels from the preceding waves. This completes the Wolfe Wave structure graphically on the chart by guaranteeing that Wave 5 is appropriately marked at the highest point between the breakout and the reversal.
Fibonacci Expansion
As you may remember, we already established that Wave 5 must fall within a specific range of the expansion produced by Waves 3 and 4. Between Waves 3 and 4, this range usually ranges from 127.2% to 161.8% of the price change.
Example:input ENUM_TIMEFRAMES timeframe = PERIOD_CURRENT; // TIMEFRAME input double max_fib_ext_wv12 = 161.8; // WAVE 1 AND 2 FIBO EXTENSION MAX LEVEL input double min_fib_ext_wv12 = 127.2; // WAVE 1 AND 2 FIBO EXTENSION MIN LEVEL input double max_fib_ext_wv34 = 120.0; // WAVE 3 AND 4 FIBO EXTENSION MAX LEVEL input double min_fib_ext_wv34 = 200.0; // WAVE 3 AND 4 FIBO EXTENSION MIN LEVEL string fib_ext_3_4; double fib_ext_3_4_161_8; double fib_ext_3_4_127_2; string fib_ext_3_4_168_127; string fib_ext_range_3_4; int no_bars;
for(int l = k; l < bars_check - 7; l++)
  {
   if(IsSwingLow(low, l, 7) && time[l] > wv3_time)
     {
      wv4 = low[l];
      wv4_time = time[l];
      wv4_txt = StringFormat("WAVE 4 %d", l);

      wv3_wv4_bars = Bars(_Symbol, timeframe, wv3_time, wv4_time);
      wv3_highest_index = ArrayMaximum(high, k, wv3_wv4_bars);
      wv3_hh = high[wv3_highest_index];
      wv3_hh_t = time[wv3_highest_index];

      wv2_wv3_bars = Bars(_Symbol, timeframe, wv2_time, wv3_time);
      wv2_lowest_index = ArrayMinimum(low, j, wv2_wv3_bars);
      wv2_ll = low[wv2_lowest_index];
      wv2_ll_t = time[wv2_lowest_index];

      wv1_wv2_bars = Bars(_Symbol, timeframe, wv1_time, wv2_time);
      wv1_highest_index = ArrayMaximum(high, i, wv1_wv2_bars);
      wv1_hh = high[wv1_highest_index];
      wv1_hh_t = time[wv1_highest_index];

      wv1_wv2_size = MathAbs(wv1_hh - wv2_ll);
      wv1_wv2_70p = (wv1_wv2_size / 100) * 70;

      fib_ext_1_2_127_2 = MathAbs((((wv1_hh - wv2_ll) / 100) * (min_fib_ext_wv12 - 100)) + wv1_hh);
      fib_ext_1_2_161_8 = MathAbs((((wv1_hh - wv2_ll) / 100) * (max_fib_ext_wv12 - 100)) + wv1_hh);

      wv3_wv4_size = MathAbs(wv3_hh - wv4);

      if(wv3_wv4_size >= wv1_wv2_size && wv4 > wv2_ll && wv4 < wv3_hh && wv3_hh >= fib_ext_1_2_127_2 && wv3_hh <= fib_ext_1_2_161_8)
        {
         tline_1_3 = StringFormat("TREND LINE WAVE 1 AND 3 %d", i);
         if(ObjectCreate(chart_id,tline_1_3,OBJ_TREND,0,wv1_hh_t,wv1_hh,wv3_hh_t,wv3_hh))
           {
            ObjectSetInteger(chart_id, tline_1_3, OBJPROP_COLOR, clrBlue);
            ObjectSetInteger(chart_id, tline_1_3, OBJPROP_RAY_RIGHT, true);
            ObjectSetInteger(chart_id, tline_1_3, OBJPROP_TIMEFRAMES, OBJ_NO_PERIODS);
           }

         tline_2_4 = StringFormat("TREND LINE WAVE 2 AND 4 %d", i);
         if(ObjectCreate(chart_id,tline_2_4,OBJ_TREND,0,wv2_ll_t,wv2_ll,wv4_time,wv4))
           {
            ObjectSetInteger(chart_id, tline_2_4, OBJPROP_COLOR, clrBlue);
            ObjectSetInteger(chart_id, tline_2_4, OBJPROP_RAY_RIGHT, true);
            ObjectSetInteger(chart_id, tline_2_4, OBJPROP_TIMEFRAMES, OBJ_NO_PERIODS);
           }

         tline_1_4 = StringFormat("TREND LINE WAVE 1 AND 4 %d", i);
         if(ObjectCreate(chart_id,tline_1_4,OBJ_TREND,0,wv1_hh_t,wv1_hh,wv4_time,wv4))
           {
            ObjectSetInteger(chart_id, tline_1_4, OBJPROP_COLOR, clrBlue);
            ObjectSetInteger(chart_id, tline_1_4, OBJPROP_RAY_RIGHT, true);
            ObjectSetInteger(chart_id, tline_1_4, OBJPROP_TIMEFRAMES, OBJ_NO_PERIODS);
           }

         fib_ext_3_4 = StringFormat("FIB EXTENSION WAVE 3 AND 4 %d", i);
         fib_ext_3_4_127_2 = MathAbs((((wv3_hh - wv4) / 100) * (min_fib_ext_wv34 - 100)) + wv3_hh);
         fib_ext_3_4_161_8 = MathAbs((((wv3_hh - wv4) / 100) * (max_fib_ext_wv34 - 100)) + wv3_hh);
         fib_ext_3_4_168_127 = StringFormat("FIB EXTENSION wv3 wv4 %d", i);

         for(int m = l; m < bars_check - 2; m++)
           {
            t_1_3_values = ObjectGetValueByTime(chart_id, tline_1_3, time[m], 0);

            if(close[m] > open[m] && open[m] < t_1_3_values && close[m] > t_1_3_values && time[m] > time[l+4])
              {
               for(int n = m; n < bars_check - 1; n++)
                 {
                  t_1_3_values_2 = ObjectGetValueByTime(chart_id, tline_1_3, time[n], 0);
                  t_2_4_values = ObjectGetValueByTime(chart_id, tline_2_4, time[n], 0);

                  no_bars = Bars(_Symbol, timeframe, wv3_hh_t, time[n]);
                  cross_bars = Bars(_Symbol,timeframe,time[n], time[m]);
                  cross_bars_highest = ArrayMaximum(high,m,cross_bars);

                  if(close[n] < open[n] && open[n] > t_1_3_values_2 && close[n] < t_1_3_values_2 && no_bars < 100
                     && time[n] > time[m]
                     && high[cross_bars_highest] >= fib_ext_3_4_127_2 &&  high[cross_bars_highest] <= fib_ext_3_4_161_8)
                    {
                     ObjectCreate(chart_id, wv1_txt, OBJ_TEXT, 0, wv1_hh_t, wv1_hh);
                     ObjectSetString(chart_id, wv1_txt, OBJPROP_TEXT, "WV1");
                     ObjectSetInteger(chart_id, wv1_txt, OBJPROP_COLOR, clrBlue);

                     ObjectCreate(chart_id, wv2_txt, OBJ_TEXT, 0, wv2_ll_t, wv2_ll);
                     ObjectSetString(chart_id, wv2_txt, OBJPROP_TEXT, "WV2");
                     ObjectSetInteger(chart_id, wv2_txt, OBJPROP_COLOR, clrBlue);

                     fib_ext_wv1_wv2 = StringFormat("FIBO EXTENSION WAVE 1 AND 2 %d", i);

                     ObjectCreate(chart_id, fib_ext_wv1_wv2, OBJ_EXPANSION, 0, wv2_ll_t, wv2_ll, wv1_hh_t, wv1_hh, wv2_ll_t, wv2_ll);

                     ObjectSetInteger(chart_id, fib_ext_wv1_wv2, OBJPROP_COLOR, clrBlue);

                     for(int i = 0; i <= 2; i++)
                       {
                        ObjectSetInteger(chart_id, fib_ext_wv1_wv2, OBJPROP_LEVELCOLOR, i, clrBlue);
                       }

                     perc_70 = StringFormat("70 PERCENT %d", j);
                     ObjectCreate(chart_id, perc_70, OBJ_TREND, 0, wv1_hh_t, wv1_hh - wv1_wv2_70p, wv2_time, wv1 - wv1_wv2_70p);

                     fib_ext_range = StringFormat("Fibo EXPENSION RANGE%d", j);
                     ObjectCreate(chart_id, fib_ext_range, OBJ_RECTANGLE, 0, wv1_hh_t, fib_ext_1_2_161_8, wv2_ll_t, fib_ext_1_2_127_2);

                     ObjectCreate(chart_id, wv3_txt, OBJ_TEXT, 0, wv3_hh_t, wv3_hh);
                     ObjectSetString(chart_id, wv3_txt, OBJPROP_TEXT, "WV3");
                     ObjectSetInteger(chart_id, wv3_txt, OBJPROP_COLOR, clrBlue);

                     ObjectCreate(chart_id, wv4_txt, OBJ_TEXT, 0, wv4_time, wv4);
                     ObjectSetString(chart_id, wv4_txt, OBJPROP_TEXT, "WV4");
                     ObjectSetInteger(chart_id, wv4_txt, OBJPROP_COLOR, clrBlue);

                     tline_1_3_visible = StringFormat("TREND LINE WAVE 1 AND 3 V %d", i);
                     ObjectCreate(chart_id,tline_1_3_visible,OBJ_TREND,0,wv1_hh_t,wv1_hh,time[n],t_1_3_values_2);
                     ObjectSetInteger(chart_id, tline_1_3_visible, OBJPROP_COLOR, clrBlue);

                     tline_2_4_visible = StringFormat("TREND LINE WAVE 2 AND 4 V %d", i);
                     ObjectCreate(chart_id,tline_2_4_visible,OBJ_TREND,0,wv2_ll_t,wv2_ll,time[n],t_2_4_values);
                     ObjectSetInteger(chart_id, tline_2_4_visible, OBJPROP_COLOR, clrBlue);

                     wv5_txt = StringFormat("WAVE 5 %d", i);
                     ObjectCreate(chart_id, wv5_txt, OBJ_TEXT, 0, time[cross_bars_highest], high[cross_bars_highest]);
                     ObjectSetString(chart_id, wv5_txt, OBJPROP_TEXT, "WV5");
                     ObjectSetInteger(chart_id, wv5_txt, OBJPROP_COLOR, clrBlue);

                     ObjectCreate(chart_id, fib_ext_3_4,OBJ_EXPANSION, 0,wv4_time, wv4,wv3_hh_t,wv3_hh,wv4_time,wv4);
                     for(int i = 0; i <= 2; i++)
                       {
                        ObjectSetInteger(chart_id,fib_ext_3_4,OBJPROP_LEVELCOLOR,i,clrBlue);
                        ObjectSetInteger(chart_id,fib_ext_3_4,OBJPROP_COLOR,clrBlue);
                       }

                     fib_ext_range_3_4 =  StringFormat("Fibo EXPENSION RANGE WV3 WV4 %d", i);
                     ObjectCreate(chart_id,fib_ext_range_3_4,OBJ_RECTANGLE,0,wv3_hh_t,fib_ext_3_4_127_2,time[cross_bars_highest],fib_ext_3_4_161_8);

                     break;
                    }
                 }
               break;
              }
           }
        }
      break;
     }
  }
Output:

Explanation:
It uses Fibonacci expansion of Waves 3 and 4. By calculating Fibonacci levels and counting the bars between Wave 3 and the price closing below the Wave 1–3 trend line, it makes sure the pattern is structurally sound and compact. The EA looks for a particular bearish candle within the condition block that breaks above the Wave 1 to 3 trend line before closing back below it. The reversal must occur within a suitable number of bars (less than 100), and the highest price between the breakout and the reverse must fall within the permissible Fibonacci expansion range, according to further parameters. Wave 5 might be legitimate if each of these requirements is met.
Waves 3 and 4 are then used as the basis legs to draw a Fibonacci Expansion object. For visibility, all three expansion levels—0, 127.2, and 161.8—are blue. To visually emphasize the Fibonacci goal zone, a rectangle is also painted. Crucially, this condition block is the only one used to produce all pertinent chart objects, such as expansion zones, labels, and trend lines. This lowers false signals and increases the dependability of the Wolfe Wave detection logic by guaranteeing that the complete pattern is only tagged once all rules have been met.
Drawing the Wave 1 to Wave 4 Trend Line
Before we proceed to let the EA execute trades, we need to draw the trend line connecting Wave 1 to Wave 4. This trend line plays a critical role in the Wolfe Wave pattern, especially for exit planning.int no_wv1_n_bars; int no_n_c_bars; string tline_1_4_visible; double t_1_4_values; string tline_1_4_visible_2; if(close[n] < open[n] && open[n] > t_1_3_values_2 && close[n] < t_1_3_values_2 && no_bars < 100 && time[n] > time[m] && high[cross_bars_highest] >= fib_ext_3_4_127_2 && high[cross_bars_highest] <= fib_ext_3_4_161_8) { ObjectCreate(chart_id, wv1_txt, OBJ_TEXT, 0, wv1_hh_t, wv1_hh); ObjectSetString(chart_id, wv1_txt, OBJPROP_TEXT, "WV1"); ObjectSetInteger(chart_id, wv1_txt, OBJPROP_COLOR, clrBlue); ObjectCreate(chart_id, wv2_txt, OBJ_TEXT, 0, wv2_ll_t, wv2_ll); ObjectSetString(chart_id, wv2_txt, OBJPROP_TEXT, "WV2"); ObjectSetInteger(chart_id, wv2_txt, OBJPROP_COLOR, clrBlue); fib_ext_wv1_wv2 = StringFormat("FIBO EXTENSION WAVE 1 AND 2 %d", i); ObjectCreate(chart_id, fib_ext_wv1_wv2, OBJ_EXPANSION, 0, wv2_ll_t, wv2_ll, wv1_hh_t, wv1_hh, wv2_ll_t, wv2_ll); ObjectSetInteger(chart_id, fib_ext_wv1_wv2, OBJPROP_COLOR, clrBlue); for(int i = 0; i <= 2; i++) { ObjectSetInteger(chart_id, fib_ext_wv1_wv2, OBJPROP_LEVELCOLOR, i, clrBlue); } perc_70 = StringFormat("70 PERCENT %d", j); ObjectCreate(chart_id, perc_70, OBJ_TREND, 0, wv1_hh_t, wv1_hh - wv1_wv2_70p, wv2_time, wv1 - wv1_wv2_70p); fib_ext_range = StringFormat("Fibo EXPENSION RANGE%d", j); ObjectCreate(chart_id, fib_ext_range, OBJ_RECTANGLE, 0, wv1_hh_t, fib_ext_1_2_161_8, wv2_ll_t, fib_ext_1_2_127_2); ObjectCreate(chart_id, wv3_txt, OBJ_TEXT, 0, wv3_hh_t, wv3_hh); ObjectSetString(chart_id, wv3_txt, OBJPROP_TEXT, "WV3"); ObjectSetInteger(chart_id, wv3_txt, OBJPROP_COLOR, clrBlue); ObjectCreate(chart_id, wv4_txt, OBJ_TEXT, 0, wv4_time, wv4); ObjectSetString(chart_id, wv4_txt, OBJPROP_TEXT, "WV4"); ObjectSetInteger(chart_id, wv4_txt, OBJPROP_COLOR, clrBlue); tline_1_3_visible = StringFormat("TREND LINE WAVE 1 AND 3 V %d", i); ObjectCreate(chart_id,tline_1_3_visible,OBJ_TREND,0,wv1_hh_t,wv1_hh,time[n],t_1_3_values_2); ObjectSetInteger(chart_id, tline_1_3_visible, OBJPROP_COLOR, clrBlue); tline_2_4_visible = StringFormat("TREND LINE WAVE 2 AND 4 V %d", i); ObjectCreate(chart_id,tline_2_4_visible,OBJ_TREND,0,wv2_ll_t,wv2_ll,time[n],t_2_4_values); ObjectSetInteger(chart_id, tline_2_4_visible, OBJPROP_COLOR, clrBlue); wv5_txt = StringFormat("WAVE 5 %d", i); ObjectCreate(chart_id, wv5_txt, OBJ_TEXT, 0, time[cross_bars_highest], high[cross_bars_highest]); ObjectSetString(chart_id, wv5_txt, OBJPROP_TEXT, "WV5"); ObjectSetInteger(chart_id, wv5_txt, OBJPROP_COLOR, clrBlue); ObjectCreate(chart_id, fib_ext_3_4,OBJ_EXPANSION, 0,wv4_time, wv4,wv3_hh_t,wv3_hh,wv4_time,wv4); for(int i = 0; i <= 2; i++) { ObjectSetInteger(chart_id,fib_ext_3_4,OBJPROP_LEVELCOLOR,i,clrBlue); ObjectSetInteger(chart_id,fib_ext_3_4,OBJPROP_COLOR,clrBlue); } fib_ext_range_3_4 = StringFormat("Fibo EXPENSION RANGE WV3 WV4 %d", i); ObjectCreate(chart_id,fib_ext_range_3_4,OBJ_RECTANGLE,0,wv3_hh_t,fib_ext_3_4_127_2,time[cross_bars_highest],fib_ext_3_4_161_8); no_wv1_n_bars = Bars(_Symbol, timeframe, wv1_hh_t, time[n]); no_n_c_bars = Bars(_Symbol, timeframe, time[n], TimeCurrent()); if(no_n_c_bars <= no_wv1_n_bars) { t_1_4_values = ObjectGetValueByTime(chart_id, tline_1_4, TimeCurrent(), 0); tline_1_4_visible = "TL WAVE 1 AND 4 Visible"; ObjectCreate(chart_id,tline_1_4_visible,OBJ_TREND,0,wv1_hh_t,wv1_hh,TimeCurrent(),t_1_4_values); ObjectSetInteger(chart_id,tline_1_4_visible,OBJPROP_STYLE,STYLE_DASH); ObjectSetInteger(chart_id,tline_1_4_visible,OBJPROP_COLOR,clrBlue); } if(no_n_c_bars > no_wv1_n_bars) { ObjectDelete(chart_id,tline_1_4_visible); t_1_4_values = ObjectGetValueByTime(chart_id, tline_1_4, time[n + no_wv1_n_bars], 0); tline_1_4_visible_2 = StringFormat("TL WAVE 1 AND 4 DISPLAY %d", i); ObjectCreate(chart_id,tline_1_4_visible_2,OBJ_TREND,0,wv1_hh_t,wv1_hh,time[n+no_wv1_n_bars],t_1_4_values); ObjectSetInteger(chart_id,tline_1_4_visible_2,OBJPROP_STYLE,STYLE_DASH); ObjectSetInteger(chart_id,tline_1_4_visible_2,OBJPROP_COLOR,clrBlue); } break; }
Explanation:
The number of bars between two important places is ascertained using the variables no_wv1_n_bars and no_n_c_bars. The number of bars between the timestamp of Wave 1 and the timestamp at which the market reversed, when it crossed back below the trend line, is specifically determined by the no_wv1_n_bars function. Conversely, no_n_c_bars counts the number of bars that separate the current bar on the chart from the reversal point (Wave 5). This comparison aids in determining if the trend line from Waves 1 through 4 should reach a fixed future bar or the current market.
A trend line with the label "TL WAVE 1 AND 4 Visible" is formed between Wave 1 and the current market time if the current bar is still within the range that Wave 1 and the reversal point (no_n_c_bars <= no_wv1_n_bars) define. ObjectGetValueByTime is used to retrieve the trend line's current value, and for visibility, the line is displayed in blue and dashed.
The previously drawn line is eliminated using ObjectDelete, though, if the number of bars after the reversal point is greater than the range between Wave 1 and the reversal. To ensure that it covers the same distance as the initial projection, a new trend line is constructed in this instance, extending from Wave 1 to a determined point in the future (time[n + no_wv1_n_bars]). This new line has a dynamic label and is styled with blue and a dashed line. While visibly adjusting to the chart's real-time updates, this algorithm guarantees that the Wave 1 to Wave 4 trend line stays constant and intent.
Trade Execution
As of right now, we have successfully recognized all five of the Wolfe Wave pattern's waves, Waves 1 through 5, along with the three key trend lines that connect Wave 1 to wave 3, Wave 2 to Wave 4, and Wave 1 to Wave 4. In addition to providing visual confirmation of the pattern, these trend lines also serve as a reference for our trade execution decisions.
Executing the deal in accordance with the predetermined structure comes next. The entry condition for a bearish Wolfe Wave pattern is closely linked to how the price moves around the Wave 1 to Wave 3 trend line. In particular, the candle has to cross above this trend line first, suggesting that the upward rise may be coming to an end, and then cross below it again. This second move is a good time to start a sell position because it confirms that the market might start to reverse lower. The EA should not initiate a transaction until this two-step confirmation is completed.
Example:
#include <Trade/Trade.mqh>
CTrade trade;
input int MagicNumber = 6160;
input double lot_size = 0.01;

input ENUM_TIMEFRAMES timeframe = PERIOD_CURRENT; // TIMEFRAME
input double max_fib_ext_wv12 = 161.8; // WAVE 1 AND 2 FIBO EXTENSION MAX LEVEL
input double min_fib_ext_wv12 = 127.2; // WAVE 1 AND 2 FIBO EXTENSION MIN LEVEL
input double max_fib_ext_wv34 = 200.0; // WAVE 3 AND 4 FIBO EXTENSION MAX LEVEL
input double min_fib_ext_wv34 = 120.0; // WAVE 3 AND 4 FIBO EXTENSION MIN LEVEL
datetime time_exe[];
datetime lastTradeBarTime = 0;
double ask_price;
//+------------------------------------------------------------------+
//| Expert initialization function                                   |
//+------------------------------------------------------------------+
int OnInit()
  {
//---
   trade.SetExpertMagicNumber(MagicNumber);
   ArraySetAsSeries(time_exe,true);

//---
   return(INIT_SUCCEEDED);
  }
//+------------------------------------------------------------------+
//| Expert tick function                                             |
//+------------------------------------------------------------------+
void OnTick()
  {
//---

   total_symbol_bars = Bars(_Symbol, timeframe);


   time_bar = iTime(_Symbol,timeframe,0);


   CopyOpen(_Symbol, timeframe, time_bar, bars_check, open);
   CopyClose(_Symbol, timeframe, time_bar, bars_check, close);
   CopyLow(_Symbol, timeframe, time_bar, bars_check, low);
   CopyHigh(_Symbol, timeframe, time_bar, bars_check, high);
   CopyTime(_Symbol, timeframe, time_bar, bars_check, time);

   CopyTime(_Symbol, timeframe, 0, 2, time_exe);
   datetime currentBarTime = iTime(_Symbol, timeframe, 0);
   ask_price = SymbolInfoDouble(_Symbol,SYMBOL_ASK);
if(time[n] == time_exe[1]  && currentBarTime != lastTradeBarTime)
  {

   trade.Sell(lot_size,_Symbol,ask_price, high[cross_bars_highest],wv2_ll);

   lastTradeBarTime = currentBarTime;

  }
Output:

Explanation:
The built-in MQL5 trading library is imported in the first line, #include, giving the CTrade class access to trade management features. An instance of CTrade called trade is produced after this library is included. Trade commands such as buying, selling, establishing a take-profit and stop-loss, and maintaining orders are all carried out by this object. MagicNumber and lot_size are the next two input variables defined. This EA's transactions are uniquely identified by their MagicNumber, which makes it simple to separate them from other trades that might be made on the same account. The lot_size, which in this instance is 0.01 lots, indicates the volume or size of the trade that will be carried out.
Then, some variables are declared: time_exe[], lastTradeBarTime, and ask_price. The time_exe array will store time data from recent bars. The lastTradeBarTime is initialized to zero and is used to prevent the EA from executing multiple trades on the same bar. ask_price is used to store the current ask price of the symbol, which is the price at which a sell trade can be executed. The trade.SetExpertMagicNumber(MagicNumber); line assigns the Magic Number to the trade object so that every trade it places can be identified later. ArraySetAsSeries(time_exe, true); sets the time_exe array to be treated as a time series, which means index 0 corresponds to the most recent bar.
Next, CopyTime(_Symbol, timeframe, 0, 2, time_exe); is used to copy the time values of the last two bars into the time_exe array. Then, datetime currentBarTime = iTime(_Symbol, timeframe, 0); gets the opening time of the currently forming bar. The ask_price = SymbolInfoDouble(_Symbol, SYMBOL_ASK); line fetches the current ask price of the trading instrument, which is necessary for placing a sell order.
Now, the condition if (time[n] == time_exe[1] && currentBarTime != lastTradeBarTime) checks whether the time stored in time[n] matches the opening time of the second most recent bar (time_exe[1]) and ensures that a trade hasn’t already been executed on the current bar by comparing with lastTradeBarTime. If this condition is true, the EA proceeds to place a sell trade using trade.Sell(). It opens the trade at the current ask_price, with the stop loss set too high[cross_bars_highest] (which likely represents the top of Wave 5) and the take profit set to wv2_ll (the low of Wave 2, potentially the target level). Finally, the lastTradeBarTime is updated to the current bar time to prevent multiple entries within the same candle.
Please note the last crucial item on our list: ensuring proper trade exits. After executing a trade based on the Wolfe Wave pattern, we need to implement logic to automatically close the trade when the market touches the trend line connecting Wave 1 and Wave 4. This line serves as our exit target because, in theory, the price is expected to reverse around that area. In addition to this, we must also build in protection against holding trades for too long. If the price does not reach the trend line within a reasonable number of bars (candles), the EA should close the trade anyway. This helps us avoid unnecessary risk and exposure in situations where the pattern fails or the market conditions change.
Example:double low_m[]; double high_m[]; //+------------------------------------------------------------------+ //| Expert initialization function | //+------------------------------------------------------------------+ int OnInit() { //--- trade.SetExpertMagicNumber(MagicNumber); ArraySetAsSeries(time_exe,true); ArraySetAsSeries(low_m,true); ArraySetAsSeries(high_m,true); //--- return(INIT_SUCCEEDED); }
CopyLow(_Symbol, timeframe, 0, 3, low_m);
CopyHigh(_Symbol, timeframe, 0, 3, high_m);
if(no_n_c_bars <= no_wv1_n_bars)
  {

   t_1_4_values =  ObjectGetValueByTime(chart_id, tline_1_4, TimeCurrent(), 0);
   tline_1_4_visible = "TL WAVE 1 AND 4 Visible";

   ObjectCreate(chart_id,tline_1_4_visible,OBJ_TREND,0,wv1_hh_t,wv1_hh,TimeCurrent(),t_1_4_values);
   ObjectSetInteger(chart_id,tline_1_4_visible,OBJPROP_STYLE,STYLE_DASH);
   ObjectSetInteger(chart_id,tline_1_4_visible,OBJPROP_COLOR,clrBlue);

   if(time[n] == time_exe[1]  && currentBarTime != lastTradeBarTime)
     {

      trade.Sell(lot_size,_Symbol,ask_price, high[cross_bars_highest],wv2_ll);

      lastTradeBarTime = currentBarTime;

     }

   for(int i = 0; i < PositionsTotal(); i++)
     {
      ulong ticket = PositionGetTicket(i);
      datetime positionTime = 0;

      if(PositionSelectByTicket(ticket))
        {

         if(PositionGetInteger(POSITION_MAGIC) == MagicNumber && PositionGetString(POSITION_SYMBOL) == ChartSymbol(chart_id))
           {

            positionTime = (datetime)PositionGetInteger(POSITION_TIME);


            if(PositionGetInteger(POSITION_TYPE) == POSITION_TYPE_SELL)
              {

               double pos_bars = Bars(_Symbol, timeframe, positionTime, TimeCurrent());


               if((ask_price < t_1_4_values || low_m[1] < t_1_4_values || no_n_c_bars == no_wv1_n_bars) && no_n_c_bars == pos_bars+1)
                 {

                  trade.PositionClose(ticket);

                 }
              }
           }
        }
     }
  }

if(no_n_c_bars > no_wv1_n_bars)
  {

   ObjectDelete(chart_id,tline_1_4_visible);

   t_1_4_values =  ObjectGetValueByTime(chart_id, tline_1_4, time[n + no_wv1_n_bars], 0);
   tline_1_4_visible_2 = StringFormat("TL WAVE 1 AND 4 DISPLAY %d", i);

   ObjectCreate(chart_id,tline_1_4_visible_2,OBJ_TREND,0,wv1_hh_t,wv1_hh,time[n+no_wv1_n_bars],t_1_4_values);
   ObjectSetInteger(chart_id,tline_1_4_visible_2,OBJPROP_STYLE,STYLE_DASH);
   ObjectSetInteger(chart_id,tline_1_4_visible_2,OBJPROP_COLOR,clrBlue);

  }
Output:

Explanation:
Two arrays are declared in the first section of the code: double low_m[]; and double high_m[];. The most recent low and high prices from the chart are kept in these arrays. Similar to MetaTrader 5's typical chart behavior, the lines ArraySetAsSeries(low_m, true); and ArraySetAsSeries(high_m, true); reverse the arrays' indexing so that index 0 always relates to the most recent bar. Comparing recent or present price levels to important trend line values requires this.
The last three low and high prices from the chart are then added to the low_m and high_m arrays, respectively, using the methods CopyLow(_Symbol, timeframe, 0, 3, low_m); and CopyHigh(_Symbol, timeframe, 0, 3, high_m); then. At these points, the price is then analyzed to determine whether it has touched or crossed below a specific trend line, such as the Wave 1 to 4 trend line.
If the position is a sell trade, which is what the Wolfe Wave pattern calls for in a bearish setup, the code calculates how many bars have passed since the trade was opened using Bars(_Symbol, timeframe, positionTime, TimeCurrent()). Finally, a condition checks whether the market has reached the exit point. Specifically, it evaluates if:
- The current ask price is below the Wave 1 to 4 trend line (t_1_4_values), or
- The previous candle’s low (low_m[1]) has pierced that trend line, or
- The number of bars since entry equals the number of bars it would take to reach the Wave 1 to 4 trend line (no_n_c_bars == no_wv1_n_bars), and
- The position has been open exactly that number of bars (no_n_c_bars == pos_bars + 1)
The EA uses the it to close the position if all of these criteria are met, since it indicates that the trade has either reached its anticipated exit point or has been held for an excessive amount of time. Ticket; PositionClose. To make sure the EA correctly associates an open trade with the most recent Wolfe Wave pattern, the condition no_n_c_bars == pos_bars + 1 is used. The bot searches for several Wolfe Wave patterns over a predetermined number of bars in this Expert Advisor's logic. However, it only makes a trade when time[n] == time_exe[1]. This guarantees that the trade will take place at the same moment the latest pattern has been verified.
The number of bars that have elapsed since the trade was opened is represented by the pos_bars variable, which is computed to preserve this alignment between signal and execution. Conversely, no_n_c_bars determines the number of bars that have elapsed between the current time and the Wolfe Wave confirmation point (time[n]). The EA is informed that the transaction was initiated by this precise pattern and not by a prior one if these two values coincide, as no_n_c_bars == pos_bars + 1.
This is crucial because, even though the EA may see several Wolfe Waves on the chart, it should only handle and close the trade that matches the most recent one. In the absence of this requirement, the bot may inadvertently stop or disrupt trades from previous signals. The EA guarantees accurate transaction processing, prevents signal conflicts, and upholds consistent behavior in execution and risk management by verifying this alignment.
Identifying the Bullish Wolfe Wave Patterns
The bullish Wolfe Wave pattern is simply the opposite of the bearish Wolfe Wave we previously discussed. Since the structure and logic are very similar, we will not place too much emphasis on re-explaining every detail. Instead, we will highlight only the parts that are reversed or different. In this case, we are looking for a five-wave structure that suggests a potential buying opportunity rather than a selling one.
Wave 1, which forms the first base in a bullish Wolfe Wave, must be a swing low. Without breaking below Wave 1, Wave 3 should produce another swing low after Wave 2, which must be a swing high. The bullish setup must be completed by Wave 5 forming a final swing low and Wave 4 being a swing high, typically lower than Wave 2.
Waves 1 through 3 must be the lowest or highest points between their neighboring waves, while Wave 5 should fall between Waves 3 and 4's 127.2% and 161.8% Fibonacci expansion. The sensitivity of pattern detection can be altered by users by varying these ranges. To improve entry reliability, the price must first pass below and then rise above the trend line between Waves 1 and 3. The Wave 1–4 line is frequently utilized as a take-profit objective. Important trend lines linking Waves 1-3, 2-4, and 1-4 are automatically drawn to aid in pattern recognition and trade exit planning.

Conclusion
This article describes how we created an Expert Advisor in MQL5 that can recognize both bullish and bearish Wolfe Wave formations. We went over how to use swing highs and lows to identify the five-wave structure, apply Fibonacci expansion levels, create important trend lines, and only enter trades when all the requirements are satisfied. Although 127.2% to 161.8% is the typical Fibonacci range, individuals can modify these numbers to fit their own plans. This project offers a solid basis for developing more sophisticated, pattern-based trading systems in addition to automating a complicated chart pattern.
Warning: All rights to these materials are reserved by MetaQuotes Ltd. Copying or reprinting of these materials in whole or in part is prohibited.
This article was written by a user of the site and reflects their personal views. MetaQuotes Ltd is not responsible for the accuracy of the information presented, nor for any consequences resulting from the use of the solutions, strategies or recommendations described.

- Free trading apps
- Over 8,000 signals for copying
- Economic news for exploring financial markets
You agree to website policy and terms of use