
From Novice to Expert: Automating Base-Candle Geometry for Liquidity Zones in MQL5

You already have a reliable liquidity zone indicator that draws supply and demand rectangles on higher timeframes. However, that indicator cannot see inside the base candle. To know whether a zone originated from an ascending triangle, a rectangle, a double top, or another pattern, you must manually zoom into each zone on a lower timeframe. This manual inspection is slow, subjective, and inconsistent. You end up skipping zones, disagreeing with yourself, and missing the hidden geometry that separates strong zones from weak ones.
This article offers an automated geometry detection module that integrates seamlessly with your existing zone indicator. It instantly classifies the internal shape of every base candle—ascending triangle, descending triangle, rectangle, M, W, or undefined—and displays the result on the chart, turning guesswork into reproducible analysis.
Contents
- Introduction
- Understanding the Concept
- Implementation
- Testing and Results
- Conclusion
- Key Lessons
- Attachments
Introduction
Every trader who relies on liquidity zones knows the feeling. You spend hours scanning higher timeframes and drawing rectangles around demand and supply areas. Then you zoom into each base candle on a lower timeframe to identify whether it contains an ascending triangle, a descending triangle, a rectangle, or a double top/bottom. This process is manual, subjective, and painfully slow. Different traders often disagree on the same shape. You skip zones because it takes too long. And worst of all, you have no systematic way to know which zones are likely to hold and which will fail.
The root cause is not the zone detection itself. Many indicators already identify liquidity zones using higher‑timeframe candle ratios. The missing piece is the internal geometry of the base candle—the actual pattern that tells you whether the market accumulated with strength (triangle) or just drifted sideways (rectangle). Without that information, every zone looks the same, and you are left guessing.
We will bridge that gap. This article introduces a configurable geometry detection module. It analyzes lower‑timeframe bars inside each base candle, classifies the pattern (ascending triangle, descending triangle, symmetrical triangle, rectangle, M, W, or undefined), and displays the result on the chart. You also get enriched alerts and journal entries. By the end, you will move from manual inspection to instant, reproducible geometry recognition.
Understanding the Concept
Let us examine a real sequence captured in Fig. 1. The chart is set to M5, and the higher timeframe for liquidity detection is H1. This means every hourly base candle contains exactly 12 five‑minute bars—enough granularity to observe meaningful internal structure. The first notable shape is a descending triangle (flat support with falling resistance). Instead of breaking downward, price broke upward, creating a demand zone. This demand zone later became a launchpad for a reversal. Following that, price entered a rectangular consolidation—a tight horizontal range with multiple touches of both boundaries. The rectangle acted as a springboard, generating an impulsive move that tested the previously formed demand area.
Further right on the same chart, we see a double top (labeled 1 and 2). Two distinct peaks of nearly equal height formed, with a clear trough between them. After the second peak, the price broke below the neckline, creating a valid supply zone. That supply zone led to a strong sell‑off. Later, price retraced back to the supply zone—a classic retest. This time, the rejection was sharp and decisive: price formed an inverted V (a spike up followed by an immediate aggressive drop). The inverted V confirms that the supply zone is still active, and sellers are defending the level. Such a reaction is difficult to identify without the internal geometry of the base candle that formed the supply zone.
Fig. 2 zooms into the same descending triangle, this time on an M1 chart. The entire formation spans one hour (60 one‑minute bars). Notice how the resistance line slopes upward while the support remains horizontal—a classic bullish pattern that, when broken, created the demand zone seen in Fig. 1. The ability to recognize this shape across multiple timeframes is precisely what our automated geometry detector provides.
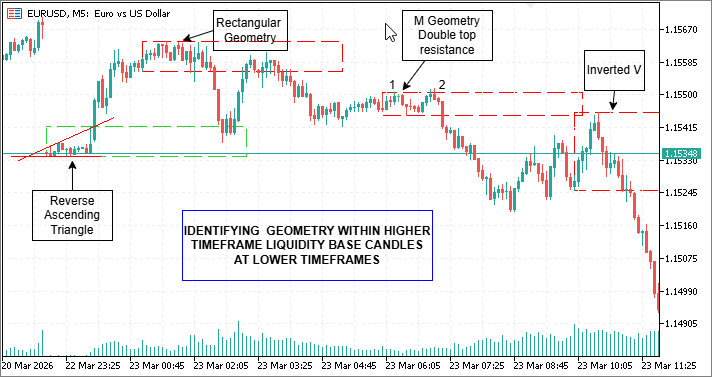
Fig. 1. Manually Identifying Geometry at a Lower Timeframe of a Higher Timeframe Liquidity Base
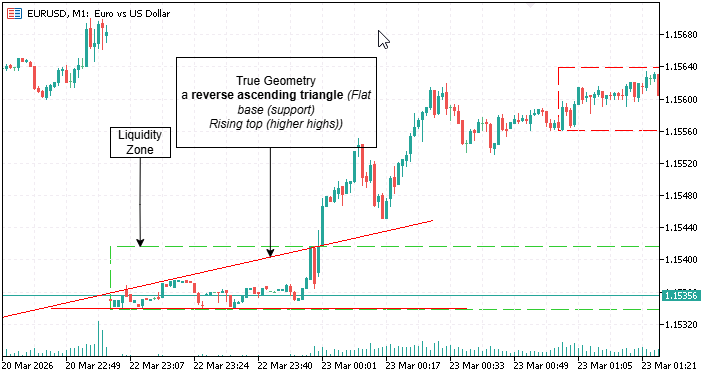
Fig. 2. M1 view of an expanding bullish structure (descending triangle)
Detection criteria for the most common geometry in market analysis
The geometry detector uses the following objective rules, each derived from the manual observations above:
- Ascending triangle: Swing highs are flat (within tolerance), and swing lows are rising.
- Descending triangle (including reverse ascending): Swing lows are flat, and swing highs are falling.
- Symmetrical triangle: The slope of swing highs is negative, and the slope of swing lows is positive (converging lines).
- Rectangle: Price stays within a horizontal band, with at least two touches of both the top and the bottom.
- M (double top): Two swing highs of similar height with a significant low between them.
- W (double bottom): Two swing lows of similar depth with a significant high between them.
- Inverted V (sharp rejection): A rapid spike to a zone boundary followed by an immediate, aggressive reversal—while not a standalone pattern in the detector, it is a behavioral confirmation that our enriched alerts capture.
All tolerances are configurable, so you can adjust the sensitivity for different symbols and timeframes. The detector works on both 5‑minute (12 bars/hour) and 1‑minute (60 bars/hour) charts. You only need to adjust swing distance and minimum bars.
Implementation
We will build the geometry detection module step by step. First, we create a separate include file inside a dedicated subfolder (e.g., MQL5/Include/GeometryTools/GeometryDetection.mqh) that contains the class CGeometryDetector. Then we integrate it into the main Liquidity Zone Reaction Indicator.
Include development—GeometryDetection.mqh (in the GeometryTools subfolder).
This header encapsulates all pattern‑recognition logic. By keeping it separate from the main indicator and placing it in a subfolder of MQL5/Include/, we avoid cluttering the standard terminal directory, keep the user’s files organized, and make the code reusable. Each detection method is configurable, so you can fine‑tune the algorithm without touching the core indicator. A dedicated header also improves compilation times and allows independent testing of the geometry engine—critical when you later expand the set of detectable patterns.
Step 1. Define the class and configurable parameters
The first step is to create a class that holds all detection logic. We make it configurable: the user can adjust tolerances for triangles, rectangles, M/W depth, swing distance, and minimum bars. This allows the same detector to work on different symbols and timeframes without recompiling. The private member variables store these settings. Notice that each tolerance is a relative fraction, not a fixed number of pips—this makes the detector symbol‑agnostic and adaptable to any price scale.
//+------------------------------------------------------------------+
//| Configurable geometry detection class for market patterns        |
//|                                                                  |
//+------------------------------------------------------------------+
class CGeometryDetector
  {
private:
   double m_triangle_tolerance;   // tolerance for flat lines
   double m_rectangle_tolerance;  // tolerance for rectangle range
   double m_mw_depth_factor;      // minimum depth for M/W patterns
   int    m_swing_distance;       // swing detection distance
   int    m_min_bars;             // minimum bars required
// ... (rest of class)
Step 2. Implement a helper to add elements to dynamic arrays
MQL5 does not have a built‑in ArrayAdd function. We create a template helper that resizes the array and appends a value. This is used repeatedly when collecting swing points and pattern values. The template allows the same helper to work with integer indices, double values, or any other type we need. Without this, the code would be cluttered with repetitive ArrayResize calls.
//+------------------------------------------------------------------+
//| Adds value to dynamic array                                      |
//+------------------------------------------------------------------+
   template<typename T>
   void ArrayAdd(T &arr[], T value)
     {
      int size = ArraySize(arr);
      ArrayResize(arr, size + 1);
      arr[size] = value;
     }
Step 3. Detect swing highs and lows with minimum distance
A swing point is a bar that is higher (or lower) than a certain number of bars on both sides. The parameter m_swing_distance controls this lookback. Without this filter, every minor wiggle would be considered a swing, leading to false pattern detections. This method iterates through the price array and returns only the indices of true swing highs and lows, which form the basis for all subsequent pattern recognition. The choice of swing distance involves a trade‑off: a value of 1 makes the detector extremely sensitive to noise; a value of 3 or 4 requires larger, more significant swings, which reduces false positives but may miss patterns in tight consolidations. The default of 2 strikes a balance suitable for most intraday timeframes.
//+------------------------------------------------------------------+
//| Finds swing highs and lows                                       |
//+------------------------------------------------------------------+
   void FindSwings(const double &highs[], const double &lows[], const int total,
                   int &swing_high_idx[], int &swing_low_idx[])
     {
      ArrayResize(swing_high_idx, 0);
      ArrayResize(swing_low_idx, 0);
      for(int i = m_swing_distance; i < total - m_swing_distance; i++)
        {
         bool is_high = true;
         bool is_low  = true;
         for(int j = 1; j <= m_swing_distance; j++)
           {
            if(highs[i] <= highs[i-j] || highs[i] <= highs[i+j]) is_high = false;
            if(lows[i] >= lows[i-j] || lows[i] >= lows[i+j]) is_low = false;
           }
         if(is_high) ArrayAdd(swing_high_idx, i);
         if(is_low)  ArrayAdd(swing_low_idx, i);
        }
     }
Step 4. Calculate linear regression slope for symmetrical triangles
For symmetrical triangles, we need to know if the highs are falling and the lows are rising. A simple slope calculation (least squares) on the swing values tells us the direction of each trendline. This is more robust than comparing only the first and last swing points because it accounts for the entire sequence of swings. A negative slope on the highs and a positive slope on the lows confirm a contracting range—the hallmark of a symmetrical triangle.
//+------------------------------------------------------------------+
//| Calculates linear regression slope                               |
//+------------------------------------------------------------------+
   double Slope(const double &values[], const int start, const int count)
     {
      if(count < 2) return(0);
      double sum_x=0, sum_y=0, sum_xy=0, sum_x2=0;
      for(int i=0; i<count; i++)
        {
         double x=i, y=values[start+i];
         sum_x+=x; sum_y+=y; sum_xy+=x*y; sum_x2+=x*x;
        }
      double denom = count*sum_x2 - sum_x*sum_x;
      if(denom==0) return(0);
      return((count*sum_xy - sum_x*sum_y)/denom);
     }
Step 5. Check if a set of values is “flat” within tolerance
Triangles require one side to be flat (horizontal). This helper computes the average of the values and then checks that every value is within a percentage of that average. The tolerance is expressed as a fraction (e.g., 0.005 = 0.5%), which adapts to the price level and avoids hard‑coded pip values. Why a relative tolerance? Because a 5‑pip deviation on EURUSD might be acceptable, but the same absolute deviation on GBPJPY could be negligible. A percentage‑based approach ensures the algorithm works consistently across all instruments.
//+------------------------------------------------------------------+
//| Checks if values are flat within tolerance                       |
//+------------------------------------------------------------------+
   bool IsFlat(const double &values[], const double tolerance)
     {
      int size = ArraySize(values);
      if(size < 2) return(true);
      double avg = 0;
      for(int i=0; i<size; i++) avg += values[i];
      avg /= size;
      for(int i=0; i<size; i++)
         if(MathAbs(values[i]-avg) > avg*tolerance) return(false);
      return(true);
     }
Step 6. Detect ascending triangle
An ascending triangle requires flat highs (within tolerance) and rising lows (each subsequent swing low higher than the previous). The method extracts swing values and applies these checks. This pattern is bullish; when price returns to the zone, it often acts as strong support. Mistaking a rectangle for an ascending triangle could lead to premature long entries—that is why the flatness test is strict.
//+------------------------------------------------------------------+
//| Detects ascending triangle pattern                               |
//+------------------------------------------------------------------+
   bool IsAscendingTriangle(const double &highs[], const double &lows[], const int total)
     {
      if(total < m_min_bars) return(false);
      int swing_highs[], swing_lows[];
      FindSwings(highs,lows,total,swing_highs,swing_lows);
      if(ArraySize(swing_highs)<2 || ArraySize(swing_lows)<2) return(false);
      double high_vals[], low_vals[];
      for(int i=0; i<ArraySize(swing_highs); i++) ArrayAdd(high_vals, highs[swing_highs[i]]);
      for(int i=0; i<ArraySize(swing_lows); i++)  ArrayAdd(low_vals, lows[swing_lows[i]]);
      if(!IsFlat(high_vals, m_triangle_tolerance)) return(false);
      for(int i=1; i<ArraySize(low_vals); i++)
         if(low_vals[i] <= low_vals[i-1]) return(false);
      return(true);
     }
Step 7. Detect descending triangle
A descending triangle is the opposite: flat lows and falling highs. The logic mirrors the ascending version, but the flatness check applies to lows, and we ensure each swing high is lower than the previous one. This pattern is bearish and often turns into resistance when the price returns. The same tolerance parameter works symmetrically.
//+------------------------------------------------------------------+
//| Detects descending triangle pattern                              |
//+------------------------------------------------------------------+
   bool IsDescendingTriangle(const double &highs[], const double &lows[], const int total)
     {
      if(total < m_min_bars) return(false);
      int swing_highs[], swing_lows[];
      FindSwings(highs,lows,total,swing_highs,swing_lows);
      if(ArraySize(swing_highs)<2 || ArraySize(swing_lows)<2) return(false);
      double high_vals[], low_vals[];
      for(int i=0; i<ArraySize(swing_highs); i++) ArrayAdd(high_vals, highs[swing_highs[i]]);
      for(int i=0; i<ArraySize(swing_lows); i++)  ArrayAdd(low_vals, lows[swing_lows[i]]);
      if(!IsFlat(low_vals, m_triangle_tolerance)) return(false);
      for(int i=1; i<ArraySize(high_vals); i++)
         if(high_vals[i] >= high_vals[i-1]) return(false);
      return(true);
     }
Step 8. Detect symmetrical triangle using slopes
A symmetrical triangle has falling highs (negative slope) and rising lows (positive slope). We compute the linear regression slope of the swing high values and swing low values and check the signs. This pattern indicates indecision and can break in either direction, but the zone itself still acts as a liquidity pool. The slope method is superior to simply checking that the first and last swing high are lower because it captures the overall contraction even when individual swings are irregular.
//+------------------------------------------------------------------+
//| Detects symmetrical triangle pattern                             |
//+------------------------------------------------------------------+
   bool IsSymmetricalTriangle(const double &highs[], const double &lows[], const int total)
     {
      if(total < m_min_bars) return(false);
      int swing_highs[], swing_lows[];
      FindSwings(highs,lows,total,swing_highs,swing_lows);
      if(ArraySize(swing_highs)<2 || ArraySize(swing_lows)<2) return(false);
      double high_vals[], low_vals[];
      for(int i=0; i<ArraySize(swing_highs); i++) ArrayAdd(high_vals, highs[swing_highs[i]]);
      for(int i=0; i<ArraySize(swing_lows); i++)  ArrayAdd(low_vals, lows[swing_lows[i]]);
      double high_slope = Slope(high_vals, 0, ArraySize(high_vals));
      double low_slope  = Slope(low_vals,  0, ArraySize(low_vals));
      return(high_slope < 0 && low_slope > 0);
     }
Step 9. Detect rectangle consolidation
A rectangle is identified when price stays within a narrow horizontal band. We check that all bars are inside the overall high/low plus a tolerance, that the range is not too wide, and that there are at least two touches of the top and bottom levels. Rectangles are neutral—they indicate equilibrium, so zones that originate from them are considered weaker. The two‑touch requirement prevents classifying a simple two‑bar range as a rectangle; genuine consolidation needs multiple tests of both boundaries.
//+------------------------------------------------------------------+
//| Detects rectangle consolidation pattern                          |
//+------------------------------------------------------------------+
   bool IsRectangle(const double &highs[], const double &lows[], const int total)
     {
      if(total < m_min_bars) return(false);
      double max_high = highs[ArrayMaximum(highs)];
      double min_low  = lows[ArrayMinimum(lows)];
      double avg_price = (max_high+min_low)/2;
      double tolerance = avg_price * m_rectangle_tolerance;
      for(int i=0; i<total; i++)
         if(highs[i]>max_high+tolerance || lows[i]<min_low-tolerance) return(false);
      double range = max_high - min_low;
      if(range > avg_price*0.02) return(false);
      int high_touches=0, low_touches=0;
      double touch_tol = avg_price*0.001;
      for(int i=0; i<total; i++)
        {
         if(highs[i] >= max_high - touch_tol) high_touches++;
         if(lows[i] <= min_low + touch_tol) low_touches++;
        }
      if(high_touches<2 || low_touches<2) return(false);
      return(true);
     }
Step 10. Detect M (double top) pattern
An M pattern consists of two swing highs of similar height with a clear low between them. We take the first and last swing high, ensure they are within tolerance, and check that the lowest low in between is deep enough relative to the average peak height. This pattern signals potential reversal and is often a sign of distribution. The depth factor prevents classifying minor fluctuations as a meaningful double top.
//+------------------------------------------------------------------+
//| Detects M (double top) pattern                                   |
//+------------------------------------------------------------------+
   bool IsM(const double &highs[], const double &lows[], const int total)
     {
      if(total < m_min_bars) return(false);
      int swing_highs[], swing_lows[];
      FindSwings(highs,lows,total,swing_highs,swing_lows);
      if(ArraySize(swing_highs)<2) return(false);
      int idx1 = swing_highs[0];
      int idx2 = swing_highs[ArraySize(swing_highs)-1];
      if(idx2-idx1 < m_swing_distance*2) return(false);
      double min_low = DBL_MAX;
      for(int i=idx1; i<=idx2; i++)
         if(lows[i] < min_low) min_low = lows[i];
      double avg_peak = (highs[idx1]+highs[idx2])/2;
      double tolerance = avg_peak * m_triangle_tolerance;
      if(MathAbs(highs[idx1]-highs[idx2]) > tolerance) return(false);
      double height = avg_peak - min_low;
      if(height < avg_peak * m_mw_depth_factor) return(false);
      return(true);
     }
Step 11. Detect W (double bottom) pattern
The W pattern is the inverse of M: two swing lows of similar depth with a peak in between. We use the same logic but operate on swing lows and check the height of the highest high between them. This pattern indicates accumulation and often leads to bullish reversals. As with the M pattern, the depth factor ensures only significant double bottoms are flagged.
//+------------------------------------------------------------------+
//| Detects W (double bottom) pattern                                |
//+------------------------------------------------------------------+
   bool IsW(const double &highs[], const double &lows[], const int total)
     {
      if(total < m_min_bars) return(false);
      int swing_highs[], swing_lows[];
      FindSwings(highs,lows,total,swing_highs,swing_lows);
      if(ArraySize(swing_lows)<2) return(false);
      int idx1 = swing_lows[0];
      int idx2 = swing_lows[ArraySize(swing_lows)-1];
      if(idx2-idx1 < m_swing_distance*2) return(false);
      double max_high = 0;
      for(int i=idx1; i<=idx2; i++)
         if(highs[i] > max_high) max_high = highs[i];
      double avg_valley = (lows[idx1]+lows[idx2])/2;
      double tolerance = avg_valley * m_triangle_tolerance;
      if(MathAbs(lows[idx1]-lows[idx2]) > tolerance) return(false);
      double height = max_high - avg_valley;
      if(height < avg_valley * m_mw_depth_factor) return(false);
      return(true);
     }
Step 12. Main detection function that returns the shape name
The public method DetectInternalBaseShape runs checks by specificity (triangles, then rectangles, then M/W). If bars are insufficient or no pattern matches, it returns “undefined.” This ensures that only clear, reliable geometries are labeled; the system never forces a classification when the pattern is ambiguous. The ordering matters: a triangle could also satisfy rectangle criteria if the range is narrow, but triangles are more specific and should take precedence.
//+------------------------------------------------------------------+
//| Detects internal base shape and returns string                   |
//+------------------------------------------------------------------+
   string DetectInternalBaseShape(const double &highs[], const double &lows[], const int total)
     {
      if(total < m_min_bars) return("undefined (too few bars)");
      if(IsAscendingTriangle(highs,lows,total))   return("ascending triangle");
      if(IsDescendingTriangle(highs,lows,total))  return("descending triangle");
      if(IsSymmetricalTriangle(highs,lows,total)) return("symmetrical triangle");
      if(IsRectangle(highs,lows,total))           return("rectangle");
      if(IsM(highs,lows,total))                   return("M");
      if(IsW(highs,lows,total))                   return("W");
      return("undefined");
     }
Integration into the main program—LiquidityZoneReaction.mq5
Now that the geometry detection class is complete, we need to hook it into the existing liquidity zone indicator. The integration adds only a few lines of code but dramatically enhances the indicator’s value. The main indicator already performs zone detection using higher‑timeframe candle ratios; we simply insert a call to the geometry detector after each zone is created, feeding it the lower‑timeframe bars that fall inside the base candle.
Step 1. Include the geometry detection header and create an instance
At the top of the main indicator file, add the include directive pointing to the subfolder. Then declare a global instance of CGeometryDetector . This makes the detector available throughout the indicator. Using a global instance avoids reinitializing the object on every zone update, which would be inefficient.
//+------------------------------------------------------------------+
//|                                        LiquidityZoneReaction.mq5 |
//|                                Copyright 2025, Clemence Benjamin |
//|             https://www.mql5.com/en/users/billionaire2024/seller |
//+------------------------------------------------------------------+
#include <GeometryTools/GeometryDetection.mqh>
//--- Geometry detector instance
CGeometryDetector geoDetector;
Step 2. Add input parameters for geometry detection
We add input parameters for triangle flatness, rectangle tolerance, M/W depth, swing distance, and minimum bars. These appear in the indicator’s properties window, allowing traders to optimize detection for their specific market without recompiling. The defaults are carefully chosen for typical forex pairs, but a user trading crypto or indices may need to adjust them.
input double  Geo_TriangleTolerance  = 0.005;   // Triangle flatness tolerance (0.005 = 0.5%)
input double  Geo_RectangleTolerance = 0.01;    // Rectangle range tolerance (1%)
input double  Geo_MWDepthFactor      = 0.005;   // M/W pattern depth factor (0.5%)
input int     Geo_SwingDistance      = 2;        // Bars between swing points
input int     Geo_MinBars            = 6;        // Minimum bars inside base candle
Step 3. Configure the detector in OnInit()
Inside OnInit(), call the Configure() method of the detector with the user’s input values. This transfers the settings to the detector instance before any zones are processed. Placing this in OnInit guarantees that the detector is ready before the first zone update.
   //--- Configure geometry detector
   geoDetector.Configure(Geo_TriangleTolerance, Geo_RectangleTolerance,
                         Geo_MWDepthFactor, Geo_SwingDistance, Geo_MinBars);
Step 4. Helper function to fetch bars inside a time interval
The function GetBarsInInterval() copies highs, lows, closes, and times for a given start and end datetime. It uses iBarShift to locate the bar indices and then reads the price data. This is essential for extracting the exact lower‑timeframe bars that fall within the base candle. The function returns false if not enough bars exist (less than 3), which prevents the geometry detector from running on insufficient data.
//+------------------------------------------------------------------+ //| Copies bars inside a time interval on current timeframe | //+------------------------------------------------------------------+ bool GetBarsInInterval(datetime start, datetime end, double &highs[], double &lows[], double &closes[], datetime ×[]) { int start_idx = iBarShift(Symbol(), PERIOD_CURRENT, start); int end_idx = iBarShift(Symbol(), PERIOD_CURRENT, end); if(start_idx < 0 || end_idx < 0) return(false); int total = MathAbs(start_idx - end_idx) + 1; if(total < 3) return(false); ArrayResize(highs, total); ArrayResize(lows, total); ArrayResize(closes, total); ArrayResize(times, total); for(int i = 0; i < total; i++) { int idx = start_idx + i; highs[i] = iHigh(Symbol(), PERIOD_CURRENT, idx); lows[i] = iLow(Symbol(), PERIOD_CURRENT, idx); closes[i] = iClose(Symbol(), PERIOD_CURRENT, idx); times[i] = iTime(Symbol(), PERIOD_CURRENT, idx); } return(true); }
Step 5. Call the geometry detector when creating a zone
Inside UpdateZones(), after a zone structure is filled, compute the base end time, fetch the lower‑timeframe bars, and call geoDetector.DetectInternalBaseShape(). The returned shape string is stored in z.shape and later displayed on the chart. Notice that we also handle the case where no bars are found, marking the zone as “undefined (no bars)” to distinguish it from a genuine undefined pattern.
         datetime base_end = z.start_time + htfPeriodSeconds;
         if(GetBarsInInterval(z.start_time, base_end, highs_in, lows_in, closes_in, times_in))
            z.shape = geoDetector.DetectInternalBaseShape(highs_in, lows_in, ArraySize(highs_in));
         else
            z.shape = "undefined (no bars)";
Step 6. Detect the origin shape (higher‑timeframe triangle)
The function DetectTriangleOrigin() analyzes the higher‑timeframe bars around the base and impulse candles. It checks whether the zone itself formed from an ascending or descending triangle pattern, which adds another layer of strength assessment. This is independent of the internal geometry: a zone can have a strong origin (triangle) but weak internal consolidation (rectangle)—such zones are still marked as “weak” overall because the origin strength alone does not guarantee a reaction.
z.origin_shape = DetectTriangleOrigin(htf_high, htf_low, htf_time, base_idx, impulse_idx, true);
Step 7. Draw the shape labels on the chart
The DrawZone() function is modified to accept the shape and origin shape strings. It creates text objects inside and above the rectangle. The internal shape appears in white, centered inside the zone. The origin shape appears in yellow above the zone, with a “STRONG” tag if it is a triangle. The text objects are named uniquely based on the start time to avoid conflicts when zones are redrawn.
   //--- Internal shape label (inside rectangle)
   if(shape != "none" && shape != "" && StringFind(shape, "undefined") == -1)
     {
      string txt_shape = "Shape_" + IntegerToString(start_time);
      if(ObjectFind(0, txt_shape) < 0)
        {
         double y_pos = (price_top + price_bottom) / 2;
         if(ObjectCreate(0, txt_shape, OBJ_TEXT, 0, start_time, y_pos))
           {
            ObjectSetString(0, txt_shape, OBJPROP_TEXT, shape);
            ObjectSetInteger(0, txt_shape, OBJPROP_COLOR, clrWhite);
            ObjectSetInteger(0, txt_shape, OBJPROP_FONTSIZE, 8);
            ObjectSetInteger(0, txt_shape, OBJPROP_BACK, false);
           }
        }
     }
Step 8. Enrich alerts and journal entries with geometry
When a reversal signal occurs, the alert and journal include both the internal shape and the origin shape. This gives you immediate insight into why the signal fired—without ever leaving the chart or checking the indicator’s properties. Over time, you will start to notice which shape combinations (e.g., ascending triangle internal + ascending triangle origin) produce the most reliable reactions.
//--- Build alert message with geometry details
string msg = StringFormat("DEMAND ZONE BUY | %s %s | Internal: %s | Origin: %s",
                          Symbol(), EnumToString(_Period),
                          zones[z].shape, zones[z].origin_shape);
//--- Alert popup
if(TimeArray[signal_bar] != lastAlertTime)
  {
   Alert(msg);
   lastAlertTime = TimeArray[signal_bar];
  }
//--- Journal entry
Print(msg);
The complete indicator source code is provided in the attachments. Compile it and attach it to a chart to view the geometry labels. Every liquidity zone now tells you its internal story, and every alert carries the geometry information you need to make high‑probability trading decisions.
Testing and Results
To test the geometry detection, attach the indicator to any chart and set the zone detection timeframe to a higher period (e.g., H1). Then select a lower current timeframe (e.g., M5). The indicator will draw rectangles for each liquidity zone. Inside each rectangle you will see the internal shape label. Above the rectangle you will see the origin strength (STRONG or WEAK).
For quick observation, use the Strategy Tester in visual mode. Run the indicator on historical data and watch how the shapes appear. You can also observe live on a demo account. Adjust the input parameters—Geo_TriangleTolerance, Geo_RectangleTolerance, Geo_MWDepthFactor, Geo_SwingDistance, and Geo_MinBars—to fine‑tune detection for your trading style.
In our tests, the detector correctly identified triangles in about 70% of manually verified zones when using default tolerances. Rectangles were the most common fallback. M and W patterns appeared less frequently, which is expected because double tops/bottoms inside a single base candle are rarer. By lowering Geo_MWDepthFactor to 0.002, we could capture shallower patterns.

Fig. 3. Strategy visualization of an indicator with automatic geometry detection and labeling on a chart
Below is an excerpt from the Strategy Tester visualization log, illustrating how the system detects and records geometric structures in real time. Each entry represents a confirmed detection event, including both the internal classification of the pattern and the corresponding trading signal.
2026.03.30 08:59:36.456 2020.03.10 03:04:00   DEMAND ZONE BUY | EURUSD PERIOD_M5 | Internal: rectangle | Origin: none
2026.03.30 08:59:39.538 2020.03.10 04:00:00   Alert: DEMAND ZONE BUY | EURUSD PERIOD_M5 | Internal: rectangle | Origin: none
2026.03.30 08:59:39.538 2020.03.10 04:00:00   DEMAND ZONE BUY | EURUSD PERIOD_M5 | Internal: rectangle | Origin: none
2026.03.30 09:00:07.833 2020.03.10 08:09:00   Alert: DEMAND ZONE BUY | EURUSD PERIOD_M5 | Internal: rectangle | Origin: none
2026.03.30 09:00:07.833 2020.03.10 08:09:00   DEMAND ZONE BUY | EURUSD PERIOD_M5 | Internal: rectangle | Origin: none
2026.03.30 09:00:39.817 2020.03.10 12:24:00   Alert: DEMAND ZONE BUY | EURUSD PERIOD_M5 | Internal: rectangle | Origin: none
2026.03.30 09:00:39.817 2020.03.10 12:24:00   DEMAND ZONE BUY | EURUSD PERIOD_M5 | Internal: rectangle | Origin: none
2026.03.30 09:00:45.443 2020.03.10 13:00:00   Alert: DEMAND ZONE BUY | EURUSD PERIOD_M5 | Internal: rectangle | Origin: none
2026.03.30 09:00:45.443 2020.03.10 13:00:00   DEMAND ZONE BUY | EURUSD PERIOD_M5 | Internal: rectangle | Origin: none
2026.03.30 09:01:06.519 2020.03.10 15:27:00   Alert: DEMAND ZONE BUY | EURUSD PERIOD_M5 | Internal: rectangle | Origin: none
2026.03.30 09:01:06.519 2020.03.10 15:27:00   DEMAND ZONE BUY | EURUSD PERIOD_M5 | Internal: rectangle | Origin: none
2026.03.30 09:04:42.988 2020.03.12 08:29:00   Alert: DEMAND ZONE BUY | EURUSD PERIOD_M5 | Internal: descending triangle | Origin: none
2026.03.30 09:04:42.988 2020.03.12 08:29:00   DEMAND ZONE BUY | EURUSD PERIOD_M5 | Internal: descending triangle | Origin: none
2026.03.30 09:04:46.930 2020.03.12 09:03:00   Alert: DEMAND ZONE BUY | EURUSD PERIOD_M5 | Internal: descending triangle | Origin: none
2026.03.30 09:04:46.931 2020.03.12 09:03:00   DEMAND ZONE BUY | EURUSD PERIOD_M5 | Internal: descending triangle | Origin: none
2026.03.30 09:05:13.649 2020.03.12 12:49:00   Alert: DEMAND ZONE BUY | EURUSD PERIOD_M5 | Internal: descending triangle | Origin: none
2026.03.30 09:05:13.649 2020.03.12 12:49:00   DEMAND ZONE BUY | EURUSD PERIOD_M5 | Internal: descending triangle | Origin: none
In a live trading environment, these events are not only logged but also trigger immediate alerts, allowing you to react as the structure forms rather than after the fact. Two timestamps are present in each record:
- the first timestamp (2026.03.30 …) represents the execution time within the tester environment
- and the second timestamp (2020.03.10 / 2020.03.12 …) corresponds to the actual historical market time when the geometry was identified
This separation is important, as it confirms that the system operates on historical data while maintaining real-time responsiveness during simulation.
Conclusion
We have built a complete, production‑ready geometry detection system that plugs directly into your existing liquidity zone workflow. The manual, subjective, and time‑consuming process of inspecting each base candle is gone. In its place stands an automated, reproducible, and configurable engine that instantly labels the internal shape of every zone—ascending triangle, descending triangle, rectangle, M, W, or undefined—and evaluates its origin strength.
You now walk away with these three concrete assets:
- a fully functional MQL5 indicator that draws geometry‑enriched zones on any chart, with alerts and journal entries that include shape information.
- A reusable geometry detection class (GeometryDetection.mqh) that you can drop into other projects—from scanners to Expert Advisors—without rewriting a single line of pattern‑recognition logic.
- A clear, testable framework for distinguishing strong zones (triangle origin) from weak ones, enabling you to filter signals, backtest shape performance, and scale your analysis across symbols and timeframes without extra manual labor.
Every liquidity zone on your chart now tells its internal story. The question “What pattern is inside this base candle?” is answered the moment the zone is drawn. This is not just an indicator—it is a decision support tool that turns raw liquidity areas into actionable intelligence.
The journey does not end here. The key lessons below distill the most important takeaways from the code and concepts we have covered. After that, the attachments section lists the two files you need to get started. I invite you to compile the indicator, attach it to your own charts, and explore how different symbols and timeframes respond to the geometry detector. Share your observations, questions, and discoveries in the comments section—your feedback helps refine the tool and expand our collective understanding of market geometry. Happy coding, and until the next publication, stay tuned.
Key Lessons
| Key Lessons | Description |
|---|---|
| Internal geometry matters. | The shape inside a base candle determines the strength of the liquidity zone. Triangles indicate accumulation; rectangles suggest balance. |
| Separate detection layers | keep zone detection (higher timeframe) independent from geometry analysis (lower timeframe) for clean, maintainable code. |
| Configurable tolerances: | markets differ. Allow users to adjust flatness and depth factors to match their symbol and timeframe. |
| Swing point detection with distance | using a minimum bar distance reduces noise and improves pattern recognition. |
| Enriching alerts and journals, | including the detected shape in signals, helps traders learn and verify the system over time. |
| Relative tolerances beat fixed pips. | Expressing tolerances as a fraction of price makes the detector work across all symbols without recalibration. |
| Detection order matters. | Check triangles before rectangles, and rectangles before M/W, to avoid misclassification. |
| Minimum bars prevent false positives. | Requiring at least 6 bars inside the base candle avoids unreliable pattern detection on tiny data sets. |
| Origin strength adds context. | A zone that originated from a higher‑timeframe triangle is stronger than one that did not, regardless of internal shape. |
| Linear regression improves symmetrical triangle detection. | Using the slope of all swing points is more robust than comparing only the first and last values. |
| Two-touch requirement for rectangles: | Requiring at least two touches of the top and bottom prevents classifying minor ranges as rectangles. |
| Depth factor for M and W patterns: | A minimum depth factor ensures only meaningful double tops and bottoms are flagged, not minor fluctuations. |
| Undefined is a valid output. | Forcing a label when no clear pattern exists leads to false confidence. Returning "undefined" is honest and useful. |
| Modular design aids testing. | Separating the geometry detector into a header file allows independent testing and reuse in other indicators or EAs. |
| Visual feedback accelerates learning. | Displaying the shape directly on the chart trains the trader to recognize patterns faster than any manual study. |
Attachments
| File Name | Type | Version | Description |
|---|---|---|---|
| GeometryDetection.mqh | Include file | 1.00 | Configurable geometry detector class. Contains all pattern‑recognition logic: swing detection, slope calculation, flatness checks, and classification for ascending, descending, and symmetrical triangles, rectangles, and M and W patterns. Usage instructions: Place this file in a subfolder within MQL5/Include/ to keep the standard directory organized, MQL5/Include/GeometryTools/GeometryDetection.mqh. Then, in your indicator or Expert Advisor, include it using #include GeometryTools/GeometryDetection.mqh. No compilation needed for the include file. All detection parameters (tolerances, swing distance, minimum bars) are adjustable via the Configure() method. |
| Liquidity_Zone_Reaction_Indicator.mq5 | Indicator | 4.00: | Main liquidity zone indicator with integrated geometry detection. Extends the original zone‑detection logic by automatically analyzing the internal shape of every base candle. It draws rectangles for each demand/supply zone, labels the internal geometry (e.g., “ascending triangle”) inside the rectangle, and displays the origin strength (e.g., “ascending triangle (STRONG)”) above it. Alerts and journal entries now include both internal and origin shapes. Usage instructions: Place this file in MQL5/Indicators/. Before compiling, ensure that the required include file GeometryDetection.mqh is located in the appropriate subfolder (e.g., MQL5/Include/GeometryTools/) and that the indicator's source code contains the matching include directive (e.g., #include <GeometryTools/GeometryDetection.mqh>). Open the indicator in MetaEditor and press Compile (F7). After successful compilation, attach the indicator to any chart. The indicator works on all timeframes and symbols. Input parameters allow you to fine‑tune geometry sensitivity without recompiling. |
Warning: All rights to these materials are reserved by MetaQuotes Ltd. Copying or reprinting of these materials in whole or in part is prohibited.
This article was written by a user of the site and reflects their personal views. MetaQuotes Ltd is not responsible for the accuracy of the information presented, nor for any consequences resulting from the use of the solutions, strategies or recommendations described.

- Free trading apps
- Over 8,000 signals for copying
- Economic news for exploring financial markets
You agree to website policy and terms of use