
Introduction to MQL5 (Part 24): Building an EA that Trades with Chart Objects

Introduction
Welcome back to Part 24 of the Introduction to MQL5 series! In this article, we’ll take a major step forward by combining manual chart analysis with automated trading execution. In particular, we'll build an Expert Advisor that makes trades straight from chart objects like rectangles, trend lines, and support and resistance lines.
This method fills the gap between automated and discretionary trading. By only sketching elements on your chart, you can now visually lead your EA rather than depending just on predetermined technical parameters. After identifying these items, the EA will track price changes and initiate trades automatically anytime the price engages with them.
This article will also teach you how to detect chart objects programmatically, and utilize those coordinates to calculate trade entries and exits. Additionally, we will configure the EA to react dynamically, which means that it will instantaneously adapt to any changes you make to the elements on your chart.
How the EA Works
We'll create an expert advisor that recognizes trend reversals at strategic zones using chart objects. We'll make a Support and Resistance EA, in which the user manually marks possible reversal locations on the chart with a rectangle object. The EA will keep an eye on that region and wait for the price to hit it, if you place a rectangle above the price to indicate a resistance zone.
The EA will wait for a bearish change of character to validate that a possible reversal is forming before executing a trade once the price reaches the zone. The EA will automatically initiate a sell trade if the price responds inside the rectangle without breaking above it and the bearish change of character is identified.
When the market starts producing lower highs and lower lows (bearish structure) instead of higher highs and higher lows (bullish structure), it is said to have undergone a bearish change of character. The EA will search for four significant price movements to identify this:
- A low,
- followed by a high,
- then a higher low,
- then a higher high,
- and finally, a break below the previous higher low.
The bullish structure has been broken, and a negative shift in character has taken place, as confirmed by that last break below the upper low. The EA places a sell order when this structure shift occurs inside or close to the resistance rectangle, indicating a high likelihood of a reversal.

A support zone follows the same logic. To symbolize support, the user will draw a rectangle below the price, signifying a potential place for a bullish reversal. The EA waits patiently for a bullish shift in character before making any trades once the price hits this zone. Four swings can also be used to identify the bullish change of character:
- A high,
- followed by a low,
- then a lower high,
- then a lower low,
- and finally, a break above the previous lower high.
The market structure has changed from bearish to bullish, as shown by that last break above the lower high. This indicates a probable bullish reversal, and the EA will automatically execute a buy trade if it occurs inside or close to the support rectangle.

Identifying Chart Objects
Since it dictates how the EA selects which rectangle to utilize for support or resistance, identifying chart objects is a crucial component of this project. An EA can identify chart objects that it has developed on its own, but it cannot identify objects that a user has manually drawn. The EA must be able to determine precisely which of the many items, rectangles, trend lines, text labels, or forms that are often present in the chart to employ for its reasoning.
We use the ObjectCreate() function when writing code to create chart objects. The EA can draw various objects on the chart using this function. But it's important to realize that you can access or change an object's properties at any moment after it has been created. These attributes may consist of color, style, visibility, time and price levels, and so on.
For a more thorough explanation of how the ObjectCreate() function operates, you may refer to Part 9 of this series, where I covered how to create chart objects in your code.
The most crucial aspect is that in MQL5, an object's name captures everything about it. You can get or change an object's details simply by knowing its name, regardless of whether it was created manually by the user or automatically by the EA. Asking for the upper and lower price levels or checking the time boundaries of a rectangle object used for resistance is simple if you know its name.
Because of this, the object name functions as a sort of link between the EA's logic and the user's chart. It paves the path for accurate automated choices by enabling the EA to read the precise coordinates of the drawn zone and utilize that information to determine when price enters the area.
The problem at hand is how to include an object's name in our code that we do not yet know. Consider this: before the user even draws the object on the chart, the software has already been compiled and is operating. Therefore, how is it possible for the EA to know ahead of time the object name to use?
The name of the object can be obtained straight from the chart, even after it has been drawn, in a straightforward and efficient manner. Without requiring the name to be hard-coded in advance, this technique enables the EA to dynamically detect user-created items. Let us discuss how that operates.
Example:input string h_line = ""; // Horizontal Line ulong chart_id = ChartID(); double line_price; //+------------------------------------------------------------------+ //| Expert initialization function | //+------------------------------------------------------------------+ int OnInit() { //--- //--- return(INIT_SUCCEEDED); } //+------------------------------------------------------------------+ //| Expert deinitialization function | //+------------------------------------------------------------------+ void OnDeinit(const int reason) { //--- } //+------------------------------------------------------------------+ //| Expert tick function | //+------------------------------------------------------------------+ void OnTick() { //--- line_price = ObjectGetDouble(chart_id,h_line,OBJPROP_PRICE,0); Comment(line_price); }
Explanation:
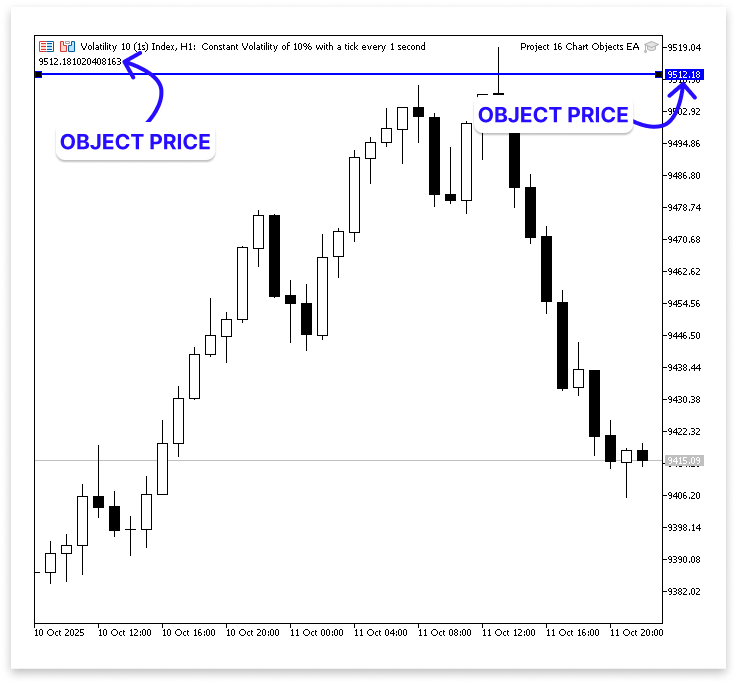
Anticipating that the user will put a horizontal line on the chart is the first stage in this approach. As a result, we developed the h_line string input parameter. The user can manually enter or copy the precise name of the horizontal line they made on the chart using this input. The EA will then know which particular object to deal with.
After that, we used the ChartID() function to get the chart ID. When there are several charts open on MetaTrader 5, this guarantees that the EA is communicating with the appropriate chart. To obtain the price level of the object whose name was provided in the input, we utilize the ObjectGetDouble() function inside the OnTick() function. The chart ID, the object name, the property we wish to access (OBJPROP_PRICE), and an index value are among the parameters supplied to this function. The index for a horizontal line is set to 0.
To verify that the EA has properly located and extracted data from the manually created object, the Comment() function lastly shows the value of the item's price level immediately on the chart. This method makes the EA versatile and easy to use by enabling it to operate dynamically with any object name that the user provides.
Output:
Just right-click on the object you drew on the chart and choose Properties from the menu to determine its name. A Name field will appear in the properties window. The name should be copied exactly as it is and pasted into the EA's input settings. You can optionally decide to rename it something more memorable, like ResistanceZone or SupportArea.

Next, go to the input settings of the EA and paste the name of the object into the input field. This is the same input parameter we created earlier to receive the object’s name.

You are connecting the manually created chart object to the EA by doing this. After entering the name, the EA can identify that particular item, retrieve its information, including coordinates or price levels, and utilize that data to decide when to make a trade.
Retrieving data from the chart's objects is the next step after learning how to identify them. In MQL5, each chart object contains unique data; however, the kind of data you may access varies depending on the object type. For instance, because a horizontal line spans the entire chart at a fixed level, it only contains price information.

While a vertical line only contains time information since it represents a specific time.

Retrieving Resistance Object Data
Rectangles are important since our project depends on using them to show support and resistance zones. They can store both time and pricing information. Each rectangle contains two points and has its own time and price coordinates.

The EA can determine the precise location of the rectangle on the chart by obtaining these coordinates. As a result, it can identify the time frame and price range of the user-drawn support or resistance area, which is essential for determining when the market moves into that zone and whether a possible trade setup is developing.
A rectangle object is defined by two points representing opposite corners, each with time and price coordinates. These points can switch roles depending on how the rectangle is drawn. Because of this flexibility, the EA shouldn't presume that one anchor represents the top or bottom of the zone when obtaining data from a rectangle. To properly identify the support or resistance area, it must instead verify both coordinates and utilize the lower price as the bottom border and the higher price as the top boundary.
Example:
input string reistance = ""; // Resistance Object Name

ulong chart_id = ChartID();

double res_anchor1_price;
double res_anchor2_price;

double res_max_price;
double res_min_price;

//+------------------------------------------------------------------+
//| Expert initialization function                                   |
//+------------------------------------------------------------------+
int OnInit()
  {
//---

//---
   return(INIT_SUCCEEDED);
  }
//+------------------------------------------------------------------+
//| Expert deinitialization function                                 |
//+------------------------------------------------------------------+
void OnDeinit(const int reason)
  {
//---
  }
//+------------------------------------------------------------------+
//| Expert tick function                                             |
//+------------------------------------------------------------------+
void OnTick()
  {
//---
   res_anchor1_price = NormalizeDouble(ObjectGetDouble(chart_id,reistance,OBJPROP_PRICE,0),_Digits);
   res_anchor2_price = NormalizeDouble(ObjectGetDouble(chart_id,reistance,OBJPROP_PRICE,1),_Digits);

   res_max_price = NormalizeDouble(MathMax(res_anchor1_price,res_anchor2_price),_Digits);
   res_min_price = NormalizeDouble(MathMin(res_anchor1_price,res_anchor2_price),_Digits);

   Comment("Anchor 1 Price: ",res_anchor1_price,"\nAnchor 2 Price: ",res_anchor2_price,
           "\n\nMax Resistance Price: ",res_max_price,"\nMin Resistance Price: ",res_min_price);
  }
Output:

Explanation:
The object name is produced as an input parameter. It enables you to manually copy and paste the name of the rectangle object from the chart into the input settings. The price levels of the two anchors in the rectangle are then stored in two variables. Anchors 1 and 2 are the two corners of each rectangle, and each corner has a coordinate for both time and price. The EA retrieves the price for both anchors, so the resistance zone may be defined using just the price values.
The price values of the rectangle's two anchors are read by the EA using the ObjectGetDouble function. Point 1 is denoted by the index value 0 in this function, and point 2 by the index value 1. Both anchors have their own time and price coordinates, and each anchor represents a corner of the rectangle. The EA only obtains the price data for each anchor because we are just interested in the pricing levels for this project.
The EA determines which of these values is higher and which is lower after acquiring them. The resistance zone's upper and lower boundaries are represented by the maximum and minimum prices, respectively.
The EA will accurately read the zone boundaries regardless of whether the user draws the rectangle from top to bottom or bottom to top thanks to this logic. These two borders will be utilized to track price movement during the project. Before making a sell trade, the EA will wait for a bearish shift in the market's behavior as it gets closer to this resistance zone.
Therefore, the EA can determine which anchor represents the beginning and which indicates the ending of the rectangle by comparing the time values for the two anchors. By correctly interpreting the rectangle's horizontal location on the chart, this step helps the EA make sure that it only reacts when the current market time is inside the drawn zone's legal range.
Example:input string reistance = ""; // Resistance Object Name ulong chart_id = ChartID(); double res_anchor1_price; double res_anchor2_price; double res_max_price; double res_min_price; long res_anchor1_time; long res_anchor2_time; datetime res_start_time; datetime res_end_time; //+------------------------------------------------------------------+ //| Expert initialization function | //+------------------------------------------------------------------+ int OnInit() { //--- //--- return(INIT_SUCCEEDED); } //+------------------------------------------------------------------+ //| Expert deinitialization function | //+------------------------------------------------------------------+ void OnDeinit(const int reason) { //--- } //+------------------------------------------------------------------+ //| Expert tick function | //+------------------------------------------------------------------+ void OnTick() { //--- res_anchor1_price = NormalizeDouble(ObjectGetDouble(chart_id,reistance,OBJPROP_PRICE,0),_Digits); res_anchor2_price = NormalizeDouble(ObjectGetDouble(chart_id,reistance,OBJPROP_PRICE,1),_Digits); res_max_price = NormalizeDouble(MathMax(res_anchor1_price,res_anchor2_price),_Digits); res_min_price = NormalizeDouble(MathMin(res_anchor1_price,res_anchor2_price),_Digits); res_anchor1_time = ObjectGetInteger(chart_id,reistance,OBJPROP_TIME,0); res_anchor2_time = ObjectGetInteger(chart_id,reistance,OBJPROP_TIME,1); res_start_time = (datetime)MathMin(res_anchor1_time,res_anchor2_time); res_end_time = (datetime)MathMax(res_anchor1_time,res_anchor2_time); Comment("RESISTANCE START TIME: ",res_start_time,"\nRESISTANCE END TIME: ",res_end_time); }
Output:

By locating the first and second points (0 and 1), this portion obtains the resistance rectangle's time coordinates. After then, it sets the earlier as the start time and the later as the end time, comparing them to see which came first. This guarantees that, regardless of how the rectangle was drawn, the EA accurately determines the resistance zone's time range.
Bearish Change of Character
Finding a bearish change of character, which indicates a possible reversal from the resistance zone, is the next step. The EA will track pricing changes to identify whether a noticeable structural adjustment takes place to verify this. In particular, it will verify that the user-drawn resistance zone contains the market's maximum high. This guarantees that the pricing truly interacted with the zone and that it is legitimate. A bearish change of character is confirmed when the market establishes this high within the resistance zone and then breaks below the prior higher low, suggesting a potential downward reversal from that zone.
Example:
input string reistance = ""; // Resistance Object Name
input ENUM_TIMEFRAMES timeframe = PERIOD_CURRENT; // TIME-FRAME

ulong chart_id = ChartID();

double res_anchor1_price;
double res_anchor2_price;

double res_max_price;
double res_min_price;

long res_anchor1_time;
long res_anchor2_time;

datetime res_start_time;
datetime res_end_time;

int res_total_bars;
double res_close[];
double res_open[];
double res_high[];
double res_low[];
datetime res_time[];

double high;
datetime high_time;
double low;
datetime low_time;
double higher_low;
datetime higher_low_time;
double higher_high;
datetime higher_high_time;
//+------------------------------------------------------------------+
//| Expert initialization function                                   |
//+------------------------------------------------------------------+
int OnInit()
  {
//---
   ArraySetAsSeries(res_close,true);
   ArraySetAsSeries(res_open,true);
   ArraySetAsSeries(res_high,true);
   ArraySetAsSeries(res_low,true);
   ArraySetAsSeries(res_time,true);

//---
   return(INIT_SUCCEEDED);
  }
//+------------------------------------------------------------------+
//| Expert deinitialization function                                 |
//+------------------------------------------------------------------+
void OnDeinit(const int reason)
  {
//---
   Comment("");
  }
//+------------------------------------------------------------------+
//| Expert tick function                                             |
//+------------------------------------------------------------------+
void OnTick()
  {
//---
   res_anchor1_price = NormalizeDouble(ObjectGetDouble(chart_id,reistance,OBJPROP_PRICE,0),_Digits);
   res_anchor2_price = NormalizeDouble(ObjectGetDouble(chart_id,reistance,OBJPROP_PRICE,1),_Digits);

   res_max_price = NormalizeDouble(MathMax(res_anchor1_price,res_anchor2_price),_Digits);
   res_min_price = NormalizeDouble(MathMin(res_anchor1_price,res_anchor2_price),_Digits);

   res_anchor1_time =  ObjectGetInteger(chart_id,reistance,OBJPROP_TIME,0);
   res_anchor2_time = ObjectGetInteger(chart_id,reistance,OBJPROP_TIME,1);

   res_start_time = (datetime)MathMin(res_anchor1_time,res_anchor2_time);
   res_end_time = (datetime)MathMax(res_anchor1_time,res_anchor2_time);

   res_total_bars = Bars(_Symbol,timeframe,TimeCurrent(),res_start_time);

   CopyOpen(_Symbol, timeframe, TimeCurrent(), res_start_time, res_open);
   CopyClose(_Symbol, timeframe, TimeCurrent(), res_start_time, res_close);
   CopyLow(_Symbol, timeframe, TimeCurrent(), res_start_time,  res_low);
   CopyHigh(_Symbol, timeframe, TimeCurrent(), res_start_time, res_high);
   CopyTime(_Symbol, timeframe, TimeCurrent(), res_start_time, res_time);

   for(int i = 4; i < res_total_bars-3; i++)
     {
      if(IsSwingHigh(res_high, i, 3))
        {
         higher_high = res_high[i];
         higher_high_time = res_time[i];

         for(int j = i; j < res_total_bars-3; j++)
           {
            if(IsSwingLow(res_low,j,3))
              {
               higher_low = res_low[j];
               higher_low_time = res_time[j];

               for(int k = j; k < res_total_bars-3; k++)
                 {
                  if(IsSwingHigh(res_high, k, 3))
                    {
                     high = res_high[k];
                     high_time = res_time[k];

                     for(int l = k; l < res_total_bars-3; l++)
                       {
                        if(IsSwingLow(res_low,l,3))
                          {
                           //   ObjectCreate(chart_id,"kk",OBJ_VLINE,0,res_time[l],0);
                           ObjectDelete(chart_id,"kk");

                           low = res_low[l];
                           low_time = res_time[l];

                           for(int m = i; m > 0; m--)
                             {
                              if(res_close[m] < higher_low && res_open[m] > higher_low)
                                {
                                 if(higher_low < higher_high && high > higher_low && high < higher_high && low < high && low < higher_low)
                                   {
                                    ObjectCreate(chart_id,"HHHL",OBJ_TREND,0,higher_high_time,higher_high,higher_low_time,higher_low);
                                    ObjectSetInteger(chart_id,"HHHL",OBJPROP_COLOR,clrRed);
                                    ObjectSetInteger(chart_id,"HHHL",OBJPROP_WIDTH,2);

                                    ObjectCreate(chart_id,"HLH",OBJ_TREND,0,higher_low_time,higher_low,high_time,high);
                                    ObjectSetInteger(chart_id,"HLH",OBJPROP_COLOR,clrRed);
                                    ObjectSetInteger(chart_id,"HLH",OBJPROP_WIDTH,2);

                                    ObjectCreate(chart_id,"HL",OBJ_TREND,0,high_time,high,low_time,low);
                                    ObjectSetInteger(chart_id,"HL",OBJPROP_COLOR,clrRed);
                                    ObjectSetInteger(chart_id,"HL",OBJPROP_WIDTH,2);

                                    ObjectCreate(chart_id,"Cross Line",OBJ_TREND,0,higher_low_time,higher_low,res_time[m],higher_low);
                                    ObjectSetInteger(chart_id,"Cross Line",OBJPROP_COLOR,clrRed);
                                    ObjectSetInteger(chart_id,"Cross Line",OBJPROP_WIDTH,2);
                                   }

                                 break;
                                }
                             }

                           break;
                          }
                       }

                     break;
                    }
                 }

               break;
              }
           }

         break;
        }
     }
  }

//+------------------------------------------------------------------+
//| FUNCTION FOR SWING LOW                                           |
//+------------------------------------------------------------------+
bool IsSwingLow(const double &low_price[], int index, int lookback)
  {
   for(int i = 1; i <= lookback; i++)
     {
      if(low_price[index] > low_price[index - i] || low_price[index] > low_price[index + i])
         return false;
     }
   return true;
  }

//+------------------------------------------------------------------+
//| FUNCTION FOR SWING HIGH                                          |
//+------------------------------------------------------------------+
bool IsSwingHigh(const double &high_price[], int index, int lookback)
  {
   for(int i = 1; i <= lookback; i++)
     {
      if(high_price[index] < high_price[index - i] || high_price[index] < high_price[index + i])
         return false; // If the current high is not the highest, return false.
     }
   return true;
  }
Output:

Explanation:
The user may first select the chart timeframe that the EA will examine using the timeframe input. You can modify it to use any supported period, but by default it uses the current chart window. This is significant since the time frame is used for all ensuing market structure identification methods, including timestamps, swing detection, and bar count counting. The right period is a design choice that strikes a balance between noise and responsiveness.
The arrays that will hold historical data are configured to function as time series during the initialization process. When they are set as a series, the oldest bars are at increasing indices, and the most recent bar is kept at index zero. When looking for recent swings, it is simple to walk the array from newest to oldest thanks to this ordering. Additionally, your loop logic can presume that index zero is the most recent finished bar because it aligns with the way that MQL5 typically displays real-time series data.
The program then determines the number of bars that separate the start of the rectangle from the current time. The size of the window to copy is determined by this bar count. The EA duplicates the open, high, low, close, and time arrays for each bar in that range after knowing that count. The data set that the EA examines is made up of those duplicated arrays. The EA only considers price action that truly interacted with the zone the user drew by limiting the data to the rectangle's time duration.
Detecting swing lows and swing highs are two minor aid functions that the EA utilizes to identify real turning points. A number of candles to the left and right of a candidate candle are compared by each function. On both sides, the swing low function returns true only if the candidate low is lower than the designated neighbors. If the candidate high is higher than the neighbors on both sides, the swing high function returns true. In addition to ensuring that the swings observed are locally relevant pivots rather than random noise, using a lookback window on both sides helps avoid false positives from isolated ticks.
When everything is put together, the procedure operates as follows. To choose a swing high contender, the EA first examines the duplicated price arrays. After identifying one, it keeps looking forward to finding the next swing low, which turns into the contender for a higher low. It then looks for a subsequent swing low after searching for another swing high. After assembling these four swing points into the anticipated pattern, the EA looks for a clear break, which would be a candle closing below the higher low that was previously determined. That break is regarded as evidence of the shift in character.
The EA then confirms the correlations between the swings, such as that the higher low is, in fact, below the higher high and that the subsequent high and low are positioned in a manner consistent with the anticipated structure.
To verify the accuracy of the bearish Change of Character (ChoCH), two crucial checks must be carried out next. The next step is to determine whether no bar has broken over the maximum resistance price since the rectangle's start time. If it has, the resistance will no longer be valid. We must first loop around each bar, gather all the high prices from the rectangle's beginning to the current bar, and then determine which high is the highest.
Example:int max_high_index; double max_high;
if(higher_low < higher_high && high > higher_low && high < higher_high && low < high && low < higher_low)
  {

   ObjectCreate(chart_id,"HHHL",OBJ_TREND,0,higher_high_time,higher_high,higher_low_time,higher_low);
   ObjectSetInteger(chart_id,"HHHL",OBJPROP_COLOR,clrRed);
   ObjectSetInteger(chart_id,"HHHL",OBJPROP_WIDTH,2);

   ObjectCreate(chart_id,"HLH",OBJ_TREND,0,higher_low_time,higher_low,high_time,high);
   ObjectSetInteger(chart_id,"HLH",OBJPROP_COLOR,clrRed);
   ObjectSetInteger(chart_id,"HLH",OBJPROP_WIDTH,2);

   ObjectCreate(chart_id,"HL",OBJ_TREND,0,high_time,high,low_time,low);
   ObjectSetInteger(chart_id,"HL",OBJPROP_COLOR,clrRed);
   ObjectSetInteger(chart_id,"HL",OBJPROP_WIDTH,2);

   ObjectCreate(chart_id,"Cross Line",OBJ_TREND,0,higher_low_time,higher_low,res_time[m],higher_low);
   ObjectSetInteger(chart_id,"Cross Line",OBJPROP_COLOR,clrRed);
   ObjectSetInteger(chart_id,"Cross Line",OBJPROP_WIDTH,2);

   max_high_index = ArrayMaximum(res_high,0,res_total_bars);
   max_high = res_high[max_high_index];
   Comment(max_high);
  }
Output:

Explanation:
The highest price within the chosen range and its location inside the array are determined by two variables. The real price that corresponds to that index is preserved in one, and the index (position) with the highest high value is kept in the other. The application then retrieves the matching price value after locating the array's highest price index.
The authenticity of the resistance zone can now be verified using two conditions. The first requirement is that no candle has broken over the resistance zone if the highest high is less than the maximum resistance price. The second requirement is that the highest high of the character change must be higher than the resistance minimum price but lower than the maximal price. This indicates a legitimate reaction point where a possible negative change of character could transpire, as the market has indeed struck the resistance zone.
Example:if(higher_low < higher_high && high > higher_low && high < higher_high && low < high && low < higher_low) { ObjectCreate(chart_id,"HHHL",OBJ_TREND,0,higher_high_time,higher_high,higher_low_time,higher_low); ObjectSetInteger(chart_id,"HHHL",OBJPROP_COLOR,clrRed); ObjectSetInteger(chart_id,"HHHL",OBJPROP_WIDTH,2); ObjectCreate(chart_id,"HLH",OBJ_TREND,0,higher_low_time,higher_low,high_time,high); ObjectSetInteger(chart_id,"HLH",OBJPROP_COLOR,clrRed); ObjectSetInteger(chart_id,"HLH",OBJPROP_WIDTH,2); ObjectCreate(chart_id,"HL",OBJ_TREND,0,high_time,high,low_time,low); ObjectSetInteger(chart_id,"HL",OBJPROP_COLOR,clrRed); ObjectSetInteger(chart_id,"HL",OBJPROP_WIDTH,2); ObjectCreate(chart_id,"Cross Line",OBJ_TREND,0,higher_low_time,higher_low,res_time[m],higher_low); ObjectSetInteger(chart_id,"Cross Line",OBJPROP_COLOR,clrRed); ObjectSetInteger(chart_id,"Cross Line",OBJPROP_WIDTH,2); max_high_index = ArrayMaximum(res_high,0,res_total_bars); max_high = res_high[max_high_index]; if(max_high < res_max_price && higher_high > res_min_price && higher_high < res_max_price) { } }
Trade Execution
Executing trades comes after making sure that the higher high is inside the resistance zone and that all prerequisites are satisfied. This indicates that there has been a legitimate negative change of character and that the market has shown indications of respecting the resistance area. Based on the guidelines of the strategy, the Expert Advisor may now initiate a sell position or carry out any other predetermined trading activity. The take profit (TP) will be determined by a user-specified risk-to-reward ratio, and the stop loss (SL) will be set at the high of the change of character rather than at the higher high.
Example:
#include <Trade/Trade.mqh>
CTrade trade;
int MagicNumber = 533915;  // Unique Number
double lot_size = 0.2; // Lot Size
double ask_price;
double take_profit;
datetime lastTradeBarTime = 0;
if(max_high < res_max_price && higher_high > res_min_price && higher_high < res_max_price)
  {

   if(res_time[1] == res_time[m] && currentBarTime != lastTradeBarTime)
     {
      take_profit = MathAbs(ask_price - ((high - ask_price) * RRR));

      trade.Sell(lot_size,_Symbol,ask_price,high,take_profit);
      lastTradeBarTime = currentBarTime;
     }

  }
Output:

Explanation:
Once all trading requirements are satisfied, this part of the software is responsible for planning and carrying out a deal. The trading library, which offers the resources required to carry out trade transactions, is included first. To enable the Expert Advisor to initiate, alter, and terminate transactions, an instance of the trading class is constructed. To prevent them from interfering with transactions from other EAs or manual positions, each trade made by this particular EA is identified by a special magic number. The amount of volume exchanged per order is determined by the lot size.
To prevent several trades from opening within the same candle, the program also specifies variables for the ask price (which is the current price at which a sell order can be executed), the take profit level, and a variable that stores the time of the previous conducted transaction. After that, it records the current bar's time and obtains the symbol's current ask price.
The EA verifies two things before making a trade: first, that the time corresponds to the resistance zone's precise point of validation; and second, that the bar time now differs from the bar time from the previous trade (to avoid repeated entries). The software determines the take profit level using a user-specified risk-to-reward ratio and initiates a sell trade if these requirements are met. The take-profit is determined using the computed ratio, and the stop loss is set at the peak of the character change.
Bullish Change of Character at Support Zone
Since most of the reasoning we employed to identify the bearish character shift at the resistance zone also applies here, we will only touch on this briefly. To prevent misunderstandings or issues, a few crucial details must be addressed. Therefore, we will go right to the point and concentrate mostly on the fundamental distinctions in this part.
Example:
input string support = ""; // Support Object Name
double sup_anchor1_price;
double sup_anchor2_price;

double sup_max_price;
double sup_min_price;

long sup_anchor1_time;
long sup_anchor2_time;

datetime sup_start_time;
datetime sup_end_time;

int sup_total_bars;
double sup_close[];
double sup_open[];
double sup_high[];
double sup_low[];
datetime sup_time[];

double lower_high;
datetime lower_high_time;
double lower_low;
datetime lower_low_time;

int min_low_index;
double min_low;

//+------------------------------------------------------------------+
//| Expert initialization function                                   |
//+------------------------------------------------------------------+
int OnInit()
  {
//---
   ArraySetAsSeries(res_close,true);
   ArraySetAsSeries(res_open,true);
   ArraySetAsSeries(res_high,true);
   ArraySetAsSeries(res_low,true);
   ArraySetAsSeries(res_time,true);

   ArraySetAsSeries(sup_close,true);
   ArraySetAsSeries(sup_open,true);
   ArraySetAsSeries(sup_high,true);
   ArraySetAsSeries(sup_low,true);
   ArraySetAsSeries(sup_time,true);

//---
   return(INIT_SUCCEEDED);
  }
sup_anchor1_price = NormalizeDouble(ObjectGetDouble(chart_id,support,OBJPROP_PRICE,0),_Digits);
sup_anchor2_price = NormalizeDouble(ObjectGetDouble(chart_id,support,OBJPROP_PRICE,1),_Digits);

sup_max_price = NormalizeDouble(MathMax(sup_anchor1_price,sup_anchor2_price),_Digits);
sup_min_price = NormalizeDouble(MathMin(sup_anchor1_price,sup_anchor2_price),_Digits);

sup_anchor1_time =  ObjectGetInteger(chart_id,support,OBJPROP_TIME,0);
sup_anchor2_time = ObjectGetInteger(chart_id,support,OBJPROP_TIME,1);

sup_start_time = (datetime)MathMin(sup_anchor1_time,sup_anchor2_time);
sup_end_time = (datetime)MathMax(sup_anchor1_time,sup_anchor2_time);

sup_total_bars = Bars(_Symbol,timeframe,TimeCurrent(),sup_start_time);

CopyOpen(_Symbol, timeframe, TimeCurrent(), sup_start_time, sup_open);
CopyClose(_Symbol, timeframe, TimeCurrent(), sup_start_time, sup_close);
CopyLow(_Symbol, timeframe, TimeCurrent(), sup_start_time,  sup_low);
CopyHigh(_Symbol, timeframe, TimeCurrent(), sup_start_time, sup_high);
CopyTime(_Symbol, timeframe, TimeCurrent(), sup_start_time, sup_time);

for(int i = 4; i < sup_total_bars-3; i++)
  {
   if(IsSwingLow(sup_low, i, 3))
     {
      lower_low = sup_low[i];
      lower_low_time = sup_time[i];

      for(int j = i; j < sup_total_bars-3; j++)
        {
         if(IsSwingHigh(sup_high,j,3))
           {
            lower_high = sup_high[j];
            lower_high_time = sup_time[j];

            for(int k = j; k < sup_total_bars-3; k++)
              {
               if(IsSwingLow(sup_low, k, 3))
                 {
                  low = sup_low[k];
                  low_time = sup_time[k];

                  for(int l = k; l < sup_total_bars-3; l++)
                    {
                     if(IsSwingHigh(sup_high,l,3))
                       {
                        high = sup_high[l];
                        high_time = sup_time[l];

                        for(int m = i; m > 0; m--)
                          {
                           if(sup_close[m] > lower_high && sup_open[m] < lower_high)
                             {
                              if(lower_high > lower_low && low < lower_high && low > lower_low && high > low && high > lower_high)
                                {

                                 ObjectCreate(chart_id,"LLLH",OBJ_TREND,0,lower_low_time,lower_low,lower_high_time,lower_high);
                                 ObjectSetInteger(chart_id,"LLLH",OBJPROP_COLOR,clrRed);
                                 ObjectSetInteger(chart_id,"LLLH",OBJPROP_WIDTH,2);

                                 ObjectCreate(chart_id,"LHL",OBJ_TREND,0,lower_high_time,lower_high,low_time,low);
                                 ObjectSetInteger(chart_id,"LHL",OBJPROP_COLOR,clrRed);
                                 ObjectSetInteger(chart_id,"LHL",OBJPROP_WIDTH,2);

                                 ObjectCreate(chart_id,"LH",OBJ_TREND,0,low_time,low,high_time,high);
                                 ObjectSetInteger(chart_id,"LH",OBJPROP_COLOR,clrRed);
                                 ObjectSetInteger(chart_id,"LH",OBJPROP_WIDTH,2);

                                 ObjectCreate(chart_id,"S Cross Line",OBJ_TREND,0,lower_high_time,lower_high,sup_time[m],lower_high);
                                 ObjectSetInteger(chart_id,"S Cross Line",OBJPROP_COLOR,clrRed);
                                 ObjectSetInteger(chart_id,"S Cross Line",OBJPROP_WIDTH,2);

                                 min_low_index = ArrayMinimum(sup_low,0,sup_total_bars);
                                 min_low = sup_low[min_low_index];

                                 if(min_low > sup_min_price && lower_low < sup_max_price && lower_low > sup_min_price)
                                   {
                                    if(sup_time[1] == sup_time[m] && currentBarTime != lastTradeBarTime)
                                      {
                                       take_profit = MathAbs(ask_price + ((ask_price - low) * RRR));

                                       trade.Buy(lot_size,_Symbol,ask_price,low,take_profit);
                                       lastTradeBarTime = currentBarTime;

                                      }
                                   }
                                }
                              break;
                             }
                          }
                        break;
                       }
                    }
                  break;
                 }
              }
            break;
           }
        }
      break;
     }
  }
Explanation:
The logic employed in this section of the program is nearly identical to that of the resistance zone. The primary distinction is found in the direction of price behavior and market structure. We are hoping for a positive change of character for the support zone, which means that the market should begin to rise upward and reject the lower area.
To keep the candlestick data, particularly for the support zone, a distinct set of arrays was declared, which is an important aspect of the code. This comprises arrays for candle data. Because the support rectangle object's start time frequently differs from the resistance rectangle's start time, fresh arrays are used. Separate arrays guarantee that the data under analysis matches the chosen support zone on the chart exactly. The EA may analyze each level independently and avoid data overlap or confusion between the two zones as a result.
Note:
This article's strategy is entirely project-based and intended to teach readers MQL5 through real-world, hands-on application. It is not a guaranteed method for making profits in live trading.
Conclusion
In this article, we combined automated trade execution with manual chart analysis to create an Expert Advisor that responds to chart objects such as support and resistance zones. To bridge the gap between automated and discretionary trading, you learned how to extract and interpret chart data to execute trades automatically.
Warning: All rights to these materials are reserved by MetaQuotes Ltd. Copying or reprinting of these materials in whole or in part is prohibited.
This article was written by a user of the site and reflects their personal views. MetaQuotes Ltd is not responsible for the accuracy of the information presented, nor for any consequences resulting from the use of the solutions, strategies or recommendations described.

- Free trading apps
- Over 8,000 signals for copying
- Economic news for exploring financial markets
You agree to website policy and terms of use