Price Action Analysis Toolkit Development (Part 42): Interactive Chart Testing with Button Logic and Statistical Levels

Contents
Introduction
Welcome to the next installment of the Price Action Analysis Toolkit Development series. Our objective is to automate price-action analysis and make it intuitive and accessible for traders who rely on price structure rather than black-box indicators. In this article, we extend the prior work, which introduced statistical metrics such as mean, standard deviation, median, and other distributional levels computed from candles’ typical prices, and show how these metrics map naturally to important market reference levels like support, resistance, and pivot points.
Rather than hard-coding parameters and manually tuning inputs, we now introduce a more interactive, on-chart approach: the Statistical Dashboard. This dashboard places control buttons and editable fields directly on the chart, so users can compute and visualize statistical levels on demand. While many functions from the previous implementation remain, this design represents a more sophisticated, user-centric approach to on-chart analytics.
In this article we will:
- Explain the logic and motivation behind the Statistical Dashboard.
- Walk through the MQL5 implementation highlights.
- Share example outcomes and usage patterns.
- Summarize conclusions and next steps.
Understanding the Concept
Statistical measures computed from price data, such as mean, median, percentiles, and density-based modes, capture the central tendency and distributional shape of recent price action. These metrics often coincide with key reaction areas in the market: zones where liquidity clusters, where price tends to revert to, or where breakouts and reversals originate. Treating these statistics as reference levels supports both discretionary and systematic approaches. They are easy to interpret visually and suitable for automated monitoring. You can learn more about metrics such as mean, standard deviation, and median in the previous article, where I explained them in depth.
The logic of this tool is built around button-based controls that simplify market analysis. The dashboard converts the developer’s inputs into a lightweight, chart-attached UI that allows traders to:
- Select a date/time range (on-chart or typed).
- Compute distributional statistics over the selected range.
- Render lines for mean, standard-deviation bands, percentiles, median, and modes.
- Snapshot reference levels for live monitoring (touch, breakout, and reversal detection).
- Export snapshot data to CSV.
- Reset the dashboard quickly to a clean state.
This on-chart UX eliminates guesswork about which settings to use and speeds up analysis workflows. It also makes the tool safer and friendlier for live trading: instead of continuously altering code, traders can compute and inspect results in seconds.

The diagram shows the dashboard’s simple interaction model: a single button click routes to one of three clear actions (Reset, Calculate, Toggle). Each action performs deterministic operations (clear data, compute & draw statistics, or toggle visibility), updates the chart immediately, and then returns the EA to an idle state. This on-chart workflow removes the need to edit code for routine analysis, speeds decision-making, and reduces the risk of leaving stale objects or globals in the terminal.
Implementation
First, we begin by establishing the foundational metadata for our indicator. We include header comments that specify the filename, author, and copyright details, which help identify the script and attribute ownership. Moving into the platform-specific directives, we set properties such as #property copyright, #property version, and #property strict. These directives ensure MetaTrader recognizes our script correctly, enforces strict syntax rules for safer coding, and provides essential versioning for maintenance. This initial setup is critical because it ensures our code integrates seamlessly with MetaTrader and adheres to best practices.
//+------------------------------------------------------------------+
//|                                         Statistical Dashboard.mq5|
//|                               Copyright 2025, Christian Benjamin.|
//|                           https://www.mql5.com/en/users/lynnchris|
//+------------------------------------------------------------------+
#property copyright "https://www.mql5.com/en/users/lynnchris"
#property version   "1.36"
#property strict
Next, we incorporate external libraries to enhance our script's capabilities. We include ArrayObj.mqh, which provides advanced array management functions. By doing this, we enable ourselves to handle dynamic collections of objects and data efficiently—an important aspect when dealing with multiple levels, signals, and UI components. This modular approach keeps our code clean and scalable, especially as we add features like graphical objects or global variables.
// Include array utility library
#include <Arrays/ArrayObj.mqh>
Then, we define user input parameters that allow traders to customize the indicator's behavior. These input variables include lookback periods, signal thresholds, visual preferences, and control toggles. For example, Lookback determines how many bars we analyze at once, while ZScoreSignalEnter controls sensitivity to market deviations. By exposing these parameters, we empower traders to adapt the indicator to different markets, timeframes, and personal strategies, making our implementation flexible and user-friendly.
// === Inputs ===
input int    Lookback               = 1000;
input bool   ExcludeCurrent         = true;
input bool   UseWeightedByVol       = true;
input int    ModeBins               = 30;
input int    KDEGridPoints          = 100;
input double KDEBandwidthFactor     = 1.0;
input int    RefreshEveryXTicks     = 1;
input double ZScoreSignalEnter      = 2.0;
input double ZScoreSignalExit       = 0.8;
input bool   AllowLongSignals       = true;
input bool   AllowShortSignals      = true;
input bool   SendAlertOnSignal      = false;
input bool   PlaySoundOnSignal      = false;
input string SoundFileOnSignal      = "alert.wav";
input bool   SendPushOnSignal       = false;
input ENUM_TIMEFRAMES TF           = PERIOD_CURRENT;
input int    TimerIntervalSeconds   = 60;
input int    CleanupIntervalSeconds = 3600;
input bool     AutoSnapshotLevels   = false;
input datetime InputRefStart        = 0;
input datetime InputRefEnd          = 0;
input int      MonitorBars          = 20;
input double   TouchTolerancePips   = 3.0;
input double   BreakoutPips         = 5.0;
input double   ReversalPips         = 5.0;
input bool     UseCloseForConfirm   = true;
input bool     UseATRforThresholds  = true;
input double   ATRMultiplier        = 0.5;
input int      ATRperiod            = 14;
input bool     ClearSnapshotOnStart = false;
input int LabelOffset_Mean_Sec   = 0;
input int LabelOffset_Median_Sec = -60;
input int LabelOffset_ModeB_Sec  = -120;
input int LabelOffset_ModeK_Sec  = -180;
input int LabelOffset_Pct_Sec    = -240;
input bool DebugMode = false;
input string InputRefStartStr = "";
input string InputRefEndStr   = "";
As we proceed, we set up internal state variables to track the indicator's ongoing status. Variables like awaitingSetStart and refStartChart hold information about user interactions—such as whether they're setting reference points—and store reference timestamps. Variables like currentSignal keep track of whether the system currently signals a long, short, or neutral stance. These internal variables are vital because they enable our script to maintain context across ticks and user commands, ensuring a consistent and responsive behavior.
// Internal variables to track state
bool awaitingSetStart = false;
bool awaitingSetEnd = false;
datetime refStartChart = 0;
datetime refEndChart = 0;
int currentSignal = 0; // 1 for long, -1 for short, 0 for neutral
To handle multiple reference levels, we define a structured data type called RefLevel. This structure encapsulates details such as the level's name, price, whether it’s touched, the number of touches, highest and lowest prices observed, and other metrics. We then create an array refLevels[] to store multiple such instances, allowing us to monitor and analyze several levels simultaneously. Using a structured approach like this provides clarity and scalability—as traders add more levels, our code can handle them systematically and efficiently.
struct RefLevel
{
  string name;
  double price;
  bool touched;
  datetime touchTime;
  int touchCount;
  double highest;
  double lowest;
  double avgTouchVol;
  int recentTouches;
  double persistence;
  int result; // -1, 0, 1
  datetime resolvedTime;
};
RefLevel refLevels[]; // Array to hold multiple levels
Throughout our implementation, we declare numerous functions to modularize our logic. For example, we have functions for creating buttons, labels, and graphical objects (CreateButton(), CreateHLine_Pro(), DrawArrowAt()), exporting data (ExportSnapshotCSV()), and performing statistical calculations (ComputeLevelScore(), Median(), Variance()). This modular design is crucial because it separates UI management from analysis routines, making our code easier to understand, debug, and extend. It also allows us to reuse code snippets across different parts of the script.
// Forward declarations
void CreateToolbar();
void DeleteToolbar();
void CreateButton(string name,int corner,int xdist,int ydist,int xsize,int ysize,string text);
void CreateButtonStatLabel(string labName,int corner,int xdist,int ydist,string text);
void CreateEditField(string name,int corner,int xdist,int ydist,int xsize,int ysize,string text);
void ExportSnapshotCSV();
void CreateHLine_Pro(string name,double price,double score,string friendlyLabel);
double ComputeLevelScore(int touchCount,double avgTouchVolume,int recentTouches,double persistenceBars,datetime lastTouchTime);
void DrawArrowAt(string name, datetime when, double price, bool isBuy);
void CreatePanel();
void CreateOrUpdateLineText(string name, datetime t, double price, string text);
void RemoveOldObjects(int ageSec);
void ClearSnapshot();
void ClearSnapshotVisuals();
void SnapshotReferenceLevels(double mean_val,double p25,double p75,double median_val,double mode_b,double mode_k,double stddev);
void MonitorReferenceLevels(const MqlRates &rates[], int copied);
double pipToPointMultiplier();
void DeleteObjectIfExists(string name);
void RemoveHistogramObjects();
void SetObjTimestamp(string name);
datetime GetObjTimestamp(string name);
void CleanupMetaForObject(string name);
void CleanupAllMetaGlobals();
double Mean(const double &a[], int n);
double WeightedMean(const double &a[], const double &w[], int n);
double WeightedMeanFromRates(const MqlRates &rates[], int copied);
double Variance(const double &a[], int n, bool sample);
double Median(const double &a[], int n);
double Percentile(const double &a[], int n, double q);
double ModeBinned(const double &a[], int n, int bins);
double ModeKDE(const double &a[], int n, int gridPts, double bwFactor);
double ArrayMin(const double &a[], int n);
double ArrayMax(const double &a[], int n);
bool ComputeStatsFromGlobals(double &mean,double &stddev,double &median,double &modeb,double &modek,double &p25,double &p75,double &zscore);
We then develop utility functions that simplify common tasks. For instance, UpdateLabelText() updates UI labels dynamically, TrimString() cleans user input strings, and pipToPointMultiplier() converts pip units into platform-specific points for precise calculations. These helpers improve robustness, prevent redundant code, and ensure consistent handling of data—features that are essential for a professional-grade indicator.
// Example: update label text
void UpdateLabelText(string name, string text)
{
  if(ObjectFind(0, name) >= 0)
    ObjectSetString(0, name, OBJPROP_TEXT, text);
  else
    CreateButtonStatLabel(name, 0, 0, 0, text);
}

// Example: trim strings
string TrimString(string s)
{
  // Implementation omitted for brevity
}
Moving on, we implement a comprehensive reset routine called ResetAll(). This function clears snapshots, removes all graphical objects and associated metadata, resets internal variables, and rebuilds the user interface. It’s a critical feature because it allows users to restart the analysis cleanly without restarting MetaTrader, especially after changing parameters or encountering unexpected states. This improves user experience and maintains the integrity of ongoing analysis.
void ResetAll()
{
  // Clear snapshots, delete objects, reset globals, rebuild UI
  ClearSnapshot();
  RemoveExistingEAObjects();
  CleanupAllMetaGlobals();
  RemoveHistogramObjects();
  DeleteToolbar();

  // Reset internal variables
  currentSignal = 0;
  refStartChart = 0;
  refEndChart = 0;
  refSnapshotTaken = false;
  snapshotTakenTime = 0;

  // Recreate UI
  CreatePanel();
  CreateToolbar();
}
In the OnInit() function, we initialize the indicator when it loads. Here, we generate unique identifiers based on the symbol and timeframe, create visual panels and toolbars, set up timers for periodic cleanup, and initialize reference points based on user inputs or chart annotations. This setup phase ensures all necessary resources—UI components, global variables, and internal states—are correctly configured before real-time data processing begins. Proper initialization is fundamental to prevent errors and ensure smooth operation.
int OnInit()
{
  // Set base strings for global variables
  S_base = StringFormat("CSTATS_%s_%d", _Symbol, (int)TF);
  CreatePanel();
  if(ClearSnapshotOnStart) ClearSnapshot();
  EventSetTimer(TimerIntervalSeconds);
  CreateToolbar();
  // Additional setup...
  return INIT_SUCCEEDED;
}
Correspondingly, OnDeinit() handles cleanup when the indicator is removed. It kills timers, deletes graphical objects, clears global variables, and resets the environment. This step is vital because it prevents resource leaks, avoids clutter on the chart, and ensures that subsequent indicators or scripts operate without interference. It maintains the overall health and performance of the trading environment.
void OnDeinit(const int reason)
{
  EventKillTimer();
  // Delete graphical objects
  DeleteObjectIfExists(S_mean);
  DeleteObjectIfExists(S_panel);
  // Clear global variables
  CleanupAllMetaGlobals();
}
We then implement a timer handler with OnTimer(), which runs at specified intervals. It removes outdated graphical objects and expired snapshots based on their age, keeping the chart uncluttered and ensuring that the displayed data remains relevant. This periodic cleanup sustains clarity and performance, especially during long trading sessions with continuous data flow.
void OnTimer()
{
  // Periodic cleanup of old objects
  RemoveOldObjects(CleanupIntervalSeconds);
  // Clear expired snapshots
  if(refSnapshotTaken && snapshotTakenTime > 0 && (TimeCurrent() - snapshotTakenTime) >= CleanupIntervalSeconds)
  {
    ClearSnapshot();
  }
}
The core of our real-time analysis resides in OnTick(). Each time a market tick arrives, this function checks if the indicator is paused or if it should skip processing based on refresh rates. It then gathers recent market data through GetRatesForSelection(), which fetches historical prices within user-defined ranges or lookback periods. Using this data, we compute statistical measures—mean, median, mode, and standard deviation—via functions like ComputeStatsFromRates(). These metrics form the foundation for identifying market regimes, deviations, and potential signals.
We then calculate a z-score, representing how far the latest price deviates from the mean, which serves as a trigger for signals. Based on thresholds, we update the current signal state and visually mark signals with arrows, providing traders with immediate visual cues about market conditions.
void OnTick()
{
  if(GlobalVariableCheck(S_base + "_PAUSED") && GlobalVariableGet(S_base + "_PAUSED") == 1.0)
    return; // Paused

  // Throttle refresh rate
  tick_count++;
  if(tick_count < RefreshEveryXTicks) return;
  tick_count = 0;

  // Gather data
  MqlRates rates[]; int copied=0;
  if(!GetRatesForSelection(rates, copied))
    return;

  // Compute stats
  double mean_val, stddev, median_val, mode_b, mode_k, p25, p75;
  if(!ComputeStatsFromRates(rates, copied, mean_val, stddev, median_val, mode_b, mode_k, p25, p75))
    return;

  // Calculate z-score
  double latest = (rates[0].high + rates[0].low + rates[0].close) / 3.0;
  double zscore = (stddev > 0) ? (latest - mean_val) / stddev : 0;

  // Store global variables
  GlobalVariableSet(S_base + "_mean", mean_val);
  GlobalVariableSet(S_base + "_zscore", zscore);

  // Generate signals
  int newSignal = 0;
  if(zscore >= ZScoreSignalEnter && AllowLongSignals)
    newSignal = 1;
  else if(zscore <= -ZScoreSignalEnter && AllowShortSignals)
    newSignal = -1;

  // Update visual signals
  if(newSignal != currentSignal)
  {
    if(newSignal == 1)
      DrawArrowAt(S_arrow_long, iTime(_Symbol, TF, 0), latest, true);
    else if(newSignal == -1)
      DrawArrowAt(S_arrow_short, iTime(_Symbol, TF, 0), latest, false);
    currentSignal = newSignal;
  }
}
To facilitate data analysis, we build functions like GetRatesForSelection() and ComputeStatsFromRates(). The first retrieves the relevant market data, considering user-specified date ranges or lookback periods, ensuring the analysis is focused on the trader’s area of interest. The second performs statistical calculations—mean, median, modes, and using robust algorithms like array sorting and percentile computation. These functions are the backbone of the indicator's analytical capability, translating raw market data into meaningful insights for decision-making.
bool GetRatesForSelection(MqlRates &rates[], int &copied)
{
  // Fetch data based on date range or lookback
  if(UseDateRangeOnChart && refStartChart > 0 && refEndChart > 0)
  {
    int shiftStart = iBarShift(_Symbol, TF, refEndChart, false);
    int shiftEnd = iBarShift(_Symbol, TF, refStartChart, false);
    int startShift = MathMin(shiftStart, shiftEnd);
    int endShift = MathMax(shiftStart, shiftEnd);
    int count = endShift - startShift + 1;
    ArrayResize(rates, count);
    copied = CopyRates(_Symbol, TF, startShift, count, rates);
    return copied > 0;
  }
  else
  {
    int startShift = ExcludeCurrent ? 1 : 0;
    int needed = Lookback;
    ArrayResize(rates, needed);
    copied = CopyRates(_Symbol, TF, startShift, needed, rates);
    return copied > 0;
  }
}
Interactivity is a key aspect; we craft functions to manage user input and interactions. For example, CreateButton(), CreateEditField(), and CreateToolbar() generate UI controls on the chart, allowing traders to adjust parameters or trigger actions. The OnChartEvent() function processes user clicks, button presses, and object modifications, updating internal variables or reference points accordingly. This design makes the indicator highly adaptable, enabling traders to customize analysis parameters on the fly, which is essential in dynamic trading environments.
bool ComputeStatsFromRates(const MqlRates &rates[], int copied, double &mean, double &stddev, double &median, double &modeb, double &modek, double &p25, double &p75)
{
  // Extract data
  double vals[]; ArrayResize(vals, copied);
  for(int i=0; i<copied; i++)
  {
    double tp = (rates[i].high + rates[i].low + rates[i].close) / 3.0;
    vals[i] = tp;
  }
  // Compute measures
  mean = Mean(vals, copied);
  stddev = MathSqrt(Variance(vals, copied, true));
  median = Median(vals, copied);
  p25 = Percentile(vals, copied, 0.25);
  p75 = Percentile(vals, copied, 0.75);
  modeb = ModeBinned(vals, copied, ModeBins);
  modek = ModeKDE(vals, copied, KDEGridPoints, KDEBandwidthFactor);
  return true;
}
When you click the "Mean" button, the OnChartEvent() function detects this action through the CHARTEVENT_OBJECT_CLICK event. The code then identifies that the clicked object is indeed the "Mean" button by checking its name. Once confirmed, the EA proceeds to sample the relevant market data range by calling GetRatesForSelection(). If this data retrieval fails—meaning no data is available or an error occurs—the script updates the corresponding label to inform the user that no data was found and then exits.
void OnChartEvent(const int id, const long &lparam, const double &dparam, const string &sparam)
{
   if(id != CHARTEVENT_OBJECT_CLICK)
      return;

   string objName = sparam;

   if(objName == S_base + "_BTN_SHOWMEAN")
   {
      // Step 1: Sample data for the selected range
      MqlRates rates[];
      int copied=0;
      if(!GetRatesForSelection(rates, copied) || copied <= 0)
      {
         // Failure: No data available
         UpdateLabelText(S_base + "_LBL_BTN_MEAN", "No data for selection");
         return;
      }

      // Step 2: Compute statistics (mean, stddev, etc.)
      double mean_val, stddev, median_val, mode_b, mode_k, p25, p75;
      if(!ComputeStatsFromRates(rates, copied, mean_val, stddev, median_val, mode_b, mode_k, p25, p75))
      {
         // Failure: Calculation failed
         UpdateLabelText(S_base + "_LBL_BTN_MEAN", "Compute failed");
         return;
      }

      // Step 3: Draw horizontal line at mean
      CreateHLine_Pro(S_mean, mean_val, 0.85, "Mean");

      // Step 4: Update label with computed mean
      string rangeTxt = "";
      if(UseDateRangeOnChart && refStartChart > 0 && refEndChart > 0)
         rangeTxt = StringFormat("%s -> %s", TimeToString(refStartChart, TIME_DATE|TIME_MINUTES), TimeToString(refEndChart, TIME_DATE|TIME_MINUTES));
      else
         rangeTxt = StringFormat("Lookback %d bars", copied);

      CreateOrUpdateLineText(S_mean + "_TXT", iTime(_Symbol, TF, 0), mean_val, StringFormat("Mean: %s | %s | N=%d", DoubleToString(mean_val, _Digits), rangeTxt, copied));
      UpdateLabelText(S_base + "_LBL_BTN_MEAN", "Mean: " + DoubleToString(mean_val, _Digits));

      // End of process for button press
      return;
   }

   // Similar structure applies for other buttons like Std, Mode, Draw Levels, etc.
}
If data retrieval is successful, the EA moves on to compute the mean value by passing the sampled data to ComputeStatsFromRates(). Should the computation fail for any reason, the label is updated to indicate the failure, and the process ends. Otherwise, upon successful calculation, the EA draws a horizontal line at the computed mean level using CreateHLine_Pro(), customizing its appearance and label for clarity. Simultaneously, the script updates the statistical label next to the button with the new mean value, providing immediate visual feedback. After completing these steps, the process concludes, ready for the next user interaction. This flow ensures that each button press triggers a sequence of data sampling, analysis, and visual updates, making the tool interactive and informative.

Visual aids are central to quick interpretation; we implement functions like CreateHLine_Pro(), DrawArrowAt(), and CreateOrUpdateLineText(). These functions draw horizontal lines indicating statistical levels like mean or median, plot arrows signaling breakouts or reversals, and display text annotations with detailed information.
void CreateHLine_Pro(string name, double price, double score, string friendlyLabel)
{
  int width = 1 + (int)MathRound(score * 3.0);
  color col = clrDodgerBlue;
  // Determine color/style based on label
  if(ObjectFind(0, name) >= 0)
  {
    ObjectSetDouble(0, name, OBJPROP_PRICE, price);
    ObjectSetInteger(0, name, OBJPROP_COLOR, col);
    ObjectSetInteger(0, name, OBJPROP_WIDTH, width);
    ObjectSetInteger(0, name, OBJPROP_STYLE, STYLE_SOLID);
  }
  else
  {
    ObjectCreate(0, name, OBJ_HLINE, 0, 0, price);
    ObjectSetDouble(0, name, OBJPROP_PRICE, price);
    ObjectSetInteger(0, name, OBJPROP_COLOR, col);
    ObjectSetInteger(0, name, OBJPROP_WIDTH, width);
    ObjectSetInteger(0, name, OBJPROP_STYLE, STYLE_SOLID);
  }
  // Add label
  CreateOrUpdateLineText(name + "_TXT", iTime(_Symbol, TF, 0), price, friendlyLabel);
}
These visual markers help traders instantly recognize critical levels or signals without sifting through numbers, enhancing decision speed and accuracy.
void DrawArrowAt(string name, datetime when, double price, bool isBuy)
{
  if(ObjectFind(0, name) >= 0)
    ObjectDelete(0, name);
  color col = isBuy ? clrLime : clrMaroon;
  int arrowCode = isBuy ? 233 : 234; // Up or down arrow
  ObjectCreate(0, name, OBJ_ARROW, 0, when, price);
  ObjectSetInteger(0, name, OBJPROP_ARROWCODE, arrowCode);
  ObjectSetInteger(0, name, OBJPROP_COLOR, col);
  ObjectSetInteger(0, name, OBJPROP_WIDTH, 1);
}
Monitoring market interactions with reference levels is handled by MonitorReferenceLevels(). This function tracks how the price interacts with predefined levels, detecting touches, breakouts, and reversals. It updates touch counts, highest and lowest observed prices, and persistence metrics to assess the significance of each level. When certain criteria are met—such as a level being touched multiple times or breaking through thresholds—the function resolves the level and triggers visual or alert notifications, aiding traders in capturing market turning points.
void MonitorReferenceLevels(const MqlRates &rates[], int copied)
{
  // For each level, check touch, breakout, or reversal conditions
  for(int i=0; i<ArraySize(refLevels); i++)
  {
    RefLevel &L = refLevels[i];
    // Touch detection
    if(!L.touched)
    {
      if(rates[0].high >= L.price - touchTol && rates[0].low <= L.price + touchTol)
      {
        L.touched = true;
        L.touchTime = rates[0].time;
        L.touchCount++;
        // Update visual
        CreateOrUpdateLineText(...);
      }
    }
    else
    {
      // Check for breakout or reversal
      if(rates[0].high >= L.price + breakoutThreshold)
        L.result = 1; // Breakout
      else if(rates[0].low <= L.price - reversalThreshold)
        L.result = -1; // Reversal
      // Draw outcome
      DrawOutcome(L, L.result == 1);
    }
  }
}
The indicator also supports capturing snapshots of the current market state through SnapshotReferenceLevels(). This function records levels' current values, computes scores based on touch activity, and stores them for future reference.
void SnapshotReferenceLevels(double mean_val, double p25, double p75, double median_val, double mode_b, double mode_k, double stddev)
{
  // Store snapshot data
  snapshot_mean = mean_val;
  snapshot_p25 = p25;
  snapshot_p75 = p75;
  snapshot_median = median_val;
  snapshot_modeb = mode_b;
  snapshot_modek = mode_k;
  // Visualize snapshot
  ClearSnapshotVisuals();
  // Create lines
  CreateHLine_Pro(...);
  CreateOrUpdateLineText(...);
  refSnapshotTaken = true;
  snapshotTakenTime = TimeCurrent();
}
The snapshot data can then be exported to CSV files via ExportSnapshotCSV(), allowing traders to analyze historical levels, compare different market regimes, or share data externally. This capability adds depth to market analysis, enabling offline review and strategic planning.
void ExportSnapshotCSV()
{
  // Save snapshot data to CSV file
  string filename = StringFormat("CSTATS_SNAPSHOT_%s_%d.csv", _Symbol, (int)TimeCurrent());
  int handle = FileOpen(filename, FILE_WRITE | FILE_CSV);
  // Write headers and data
  FileWrite(handle, "symbol", _Symbol);
  // ...
  FileClose(handle);
}
Throughout our implementation, we maintain a consistent approach to managing graphical objects and metadata. Functions like DeleteObjectIfExists(), SetObjTimestamp(), and CleanupMetaForObject() ensure that objects are correctly created, updated, and deleted, preventing clutter and ensuring data integrity. Proper timestamp management allows us to track when objects were last modified or created, which helps in cleaning up outdated visuals and maintaining an accurate chart overlay.
void CreatePanel()
  {
   if(ObjectFind(0, S_panel) >= 0)
      ObjectDelete(0, S_panel);
   if(!ObjectCreate(0, S_panel, OBJ_LABEL, 0, 0, 0))
     {
      if(DebugMode)
         Print("CreatePanel: ObjectCreate failed: ", GetLastError());
      return;
     }
   ObjectSetInteger(0, S_panel, OBJPROP_CORNER, CORNER_LEFT_UPPER);
   ObjectSetInteger(0, S_panel, OBJPROP_XDISTANCE, 6);
   ObjectSetInteger(0, S_panel, OBJPROP_YDISTANCE, 24);
   ObjectSetString(0, S_panel, OBJPROP_TEXT, "Statistical — Dashboard");
   ObjectSetInteger(0, S_panel, OBJPROP_FONTSIZE, 11);
   ObjectSetInteger(0, S_panel, OBJPROP_SELECTABLE, false);
#ifdef __MQL5__
   ObjectSetInteger(0, S_panel, OBJPROP_BACK, false);
#endif
   SetObjTimestamp(S_panel);
  }
Outcomes
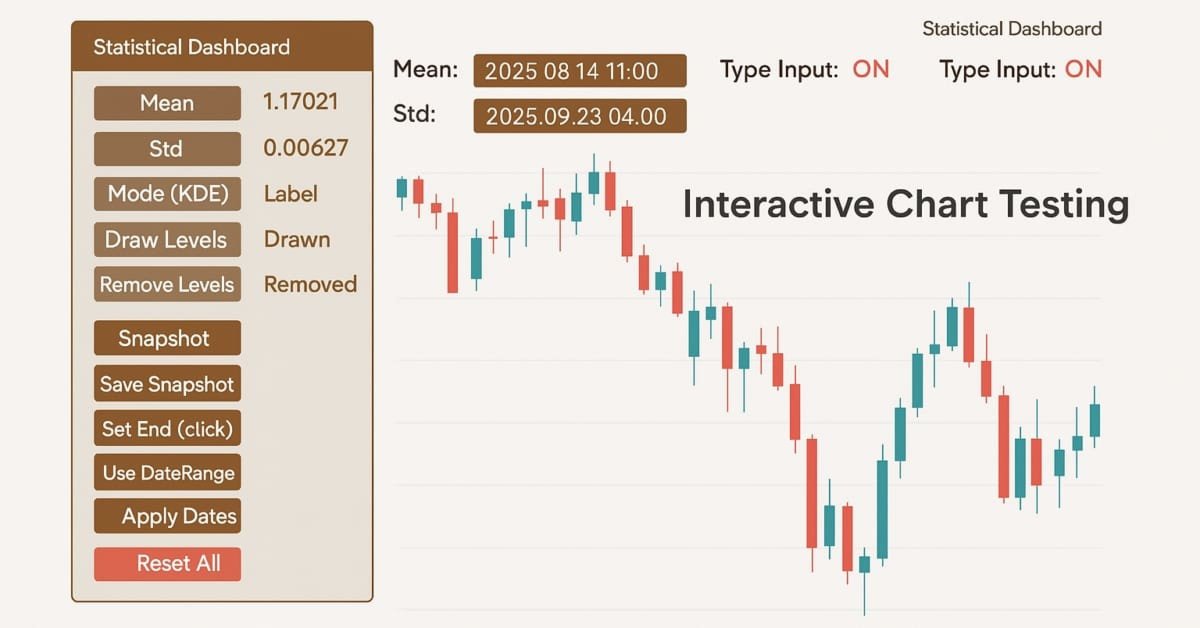
This section presents what the EA produces in practice and how to read those results. The diagram below shows the EA sitting quietly after being attached to the chart. On the left, you can see the Statistical Dashboard panel and toolbar, with buttons labeled "Mean," "Std," "Mode," "Draw Levels," "Snapshot," "Apply Dates," and "Reset All." Next to each button, there are placeholder labels that will update with the computed statistics once you press them. In the top-right corner, there's a control where you can enter custom date ranges or reference points. Currently, no statistical levels have been calculated, so the chart only shows some terminal primitives and a few leftover horizontal lines from previous runs.
When you click on buttons like "Mean" or "Draw Levels," the EA will sample the selected range, whether it's based on the lookback period or specific chart dates—and calculate metrics such as the mean, standard deviation, percentiles, median, and modes. It will then draw the relevant horizontal lines and labels, fill in the statistic fields, and if you choose to take a snapshot, it will start monitoring those levels for touches, persistence, and possible signals like breakouts or reversals.

Below, I will show you how to set the period range, which includes specifying the starting date and the ending date for your analysis.

Now, let's review the overall performance.
The EA is attached with the date range set (Start: 2025.08.14 11:00—End: 2025.09.23 04:00) and the two timestamp markers shown on the chart. Each dashboard button works immediately—pressing Mean, Std, Mode, Median, P75/P25, etc. calculates the metric for the selected interval and draws it on-chart as a horizontal line plus a text label. Draw Levels plots a group of chosen levels at once, Remove Levels clears them, and Snapshot/Save Snapshot captures the current setup for later.
Conclusion
The strength of this tool lies in its button-driven logic, which makes chart testing and analysis fast and interactive. With a single click, statistical levels like mean, standard deviation, mode, median, and percentiles are instantly calculated and displayed on the chart as labeled horizontal lines. This removes the need for manual calculations and allows quick comparisons, drawing, or removal of levels during testing. The ability to apply or reset ranges, save snapshots, and control levels directly through the dashboard makes it a powerful assistant for exploring how price reacts to different statistical zones, streamlining both research and real-time analysis.

The additional diagram reinforces this conclusion by showing how the calculated levels align with actual market behavior. The purple broken line (25th percentile) and the yellow solid line (mean plus deviation) demonstrate that these statistical outputs consistently act as real support and resistance zones. Seeing how price reacts around these levels provides clear evidence that the tool defines key bounce and retracement areas and highlights reliable points for anticipating breakouts and reversals.
This tool is designed to assist in analyzing price levels through statistical calculations. It does not execute trades on your behalf—the decision remains yours. Think of it as a level-helper EA that works best when used alongside your own trading strategy. The aim is to provide clarity on how price interacts with statistically derived levels, offering stronger context for breakouts, reversals, and retracements. Moving forward, I look forward to developing more tools that deepen price action analysis and support informed trading decisions.
Warning: All rights to these materials are reserved by MetaQuotes Ltd. Copying or reprinting of these materials in whole or in part is prohibited.
This article was written by a user of the site and reflects their personal views. MetaQuotes Ltd is not responsible for the accuracy of the information presented, nor for any consequences resulting from the use of the solutions, strategies or recommendations described.

- Free trading apps
- Over 8,000 signals for copying
- Economic news for exploring financial markets
You agree to website policy and terms of use