
Data Science and ML (Part 37): Using Candlestick patterns and AI to beat the market
Contents
- Introduction
- Basics of a candlestick
- Candlestick patterns
- Candlestick patterns detection indicator
- Collecting candlestick patterns for machine learning
- Training an AI model to make predictions based on candlestick patterns
- Finalizing it in a trading robot
- Conclusion
Introduction
The first strategy I ever used in trading was candlestick based, I wouldn't call it a strategy now but, my first time opening a trade was due to some candlestick patterns which I learned from reading a book named Candlestick Trading Bible by Honma Munehisa, which was referred to me by a friend of mine.
Candlestick patterns within financial charts are used by traders to determine possible price movements based on past patterns, they are generated by up and down price movements which despite seeming random, traders use them to forecast the price's short-term direction.
This concept originated in the 1700s by a trader named Honma Munehisa, who is considered to be the most successful trader in history. Known as the God of markets in his days, his discoveries made him more than $10 billion in today’s money.
Munehisa discovered that while the cost of supply and demand determine the cost of rice, markets were also influenced by human emotions.
These human emotions can be reflected in a candlestick, where the size of the price moves with different colors, often a black candle is used to represent a bearish movement and a white candle often represents a bullish movement, these colors don't matter nowadays because they can be changed in any trading platform.
The Basics of a Candlestick
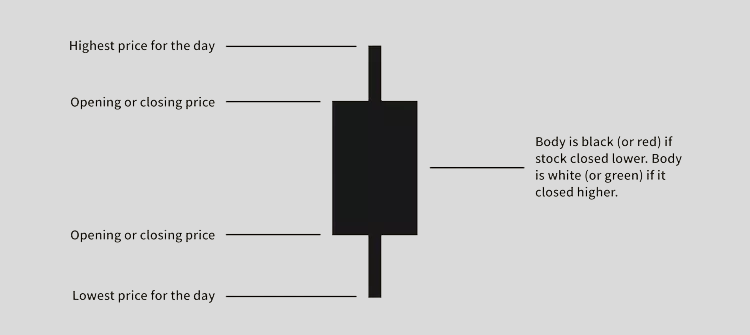
The candlesticks' shadows or wicks show the day's high and low prices and how they compare to Open and Close prices. The shape of the candle varies based on the relationship between the candle's OHLC (Open, High, Low, and Close) prices. There are a plenty of candlestick patterns introduced by Munehisa back in the day and some emerged by traders recently.
Based on these candlestick patterns, we are going to identify, collect, and apply these candlestick patterns to machine learning models and observe how these candlestick patterns can add value to our AI-based trading models and see if they can aid us in beating the financial markets.
Candlestick Patterns
Since there are plenty of candlestick patterns, we are going to discuss 10 patterns only, the main reason for these 10 is because they are simple to understand, and they solely rely on a single bar i.e. They can be detected on the current bar.
We will discard all candlestick patterns that involve processing multiple candles to detect.
The coding format for the CTALib class was inspired by TALib (Technical Analysis Library), A C#, C++, and Python based library for technical analysis which comes with several functions for detecting candlestick patterns.
A White Candle
This is a bullish candlestick where the close is higher than the open. This simple bullish candlestick indicates an upward momentum, it doesn't offer any prediction, it's just an indication of the candle's direction.
We can code it as follows.
bool CTALib::CDLWHITECANDLE(double open, double close)
 {
   return (close > open);
 }
A Black Candle
Contrary to the white candle, this is a bearish candlestick where the open is higher than the close. This simple bearish candlestick indicates a downward momentum.
Similarly to the white candle, it doesn't offer any prediction it's just an indication of the candle's direction.
bool CTALib::CDLBLACKCANDLE(double open,double close)
 {
   return (open > close);
 }
A Doji Candle Pattern
A doji candlestick is the one in which both open and close price levels are virtually equal. It looks like a cross, an inverted cross sometimes, or a plus sign. This candlestick pattern is rare as it often appears in clusters. It is usually a trend reversal signal, it can also signal indecision about future prices in the market.
It has some variations as shown in the image below.
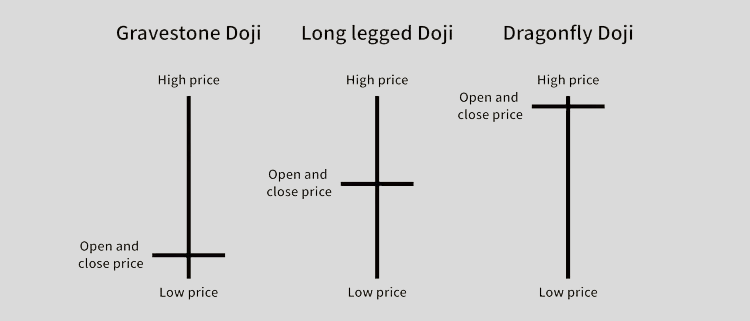
Coding a function to detect a doji candlestick can be tricky, simply because of the definition of a doji candle. For a candle to be considered a doji, both open and close prices must be equal. It is extremely rare to see an equal open and close price given the volume and volatility present in today's market, even if the price came too close for example; Open = 1.0000 and Close = 1.0001, these two are not equal to a computer.
To tackle this, we can use a tolerance value, whenever the difference between open and close is within this value we can consider the prices too close and conclude that, that's a doji candlestick pattern.
bool CTALib::CDLDOJI(double open,double close, double torrelance=3)
 {
   return (fabs(open-close)<torrelance*_Point); //A torrelance in market points
 }
Dragonfly Doji
Dragonfly Doji candlestick pattern signals a potential reversal in a security's price. If a dragonfly doji pattern appears on a downtrend, it is a good indication that the prices are about to go up or the downtrend might be over.
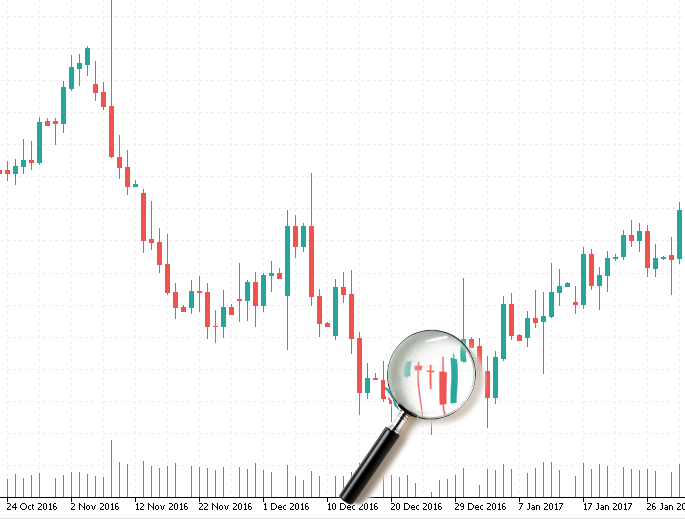
Since this is just a doji candlestick with a longer lower shadow than the upper shadow, in the code, we can ensure that the candle is a doji first then we have to explicitly ensure that the lower shadow is twice longer than the upper shadow.
bool CTALib::CDLDRAGONFLYDOJI(double open,
                              double high,
                              double low,
                              double close,
                              double body_torrelance = 3,
                              double shadow_ratio = 2.0)
{
   double body_size    = MathAbs(open - close);
   double upper_shadow = upperShadowCalc(open, close, high);
   double lower_shadow = lowerShadowCalc(open, close, low);

   //--- Body is very small (like a Doji)
   if (CDLDOJI(open, close, body_torrelance))
   {
      //--- Lower shadow is significantly longer than upper shadow
      if (lower_shadow > upper_shadow * shadow_ratio)
         return true;
   }

   return false;
}
Gravestone doji
This is a doji candlestick with a long upper shadow (wick). It is a bearish reversal strategy that indicates a change in market direction.
When this candle appears on an uptrend it indicates that the current trend might be over as a downtrend is about to happen.
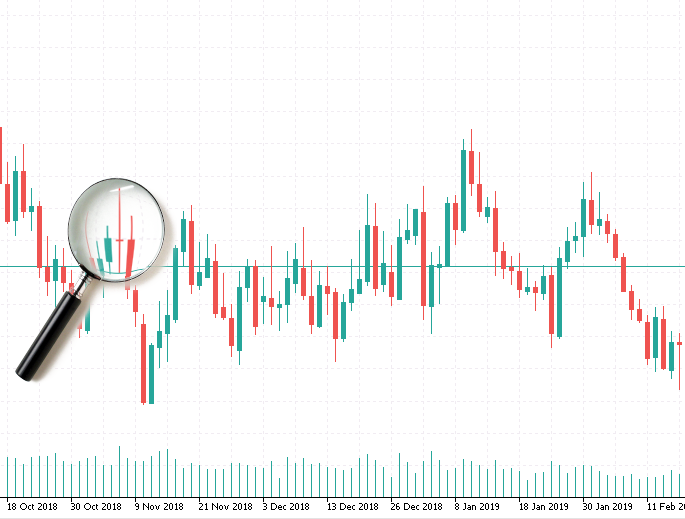
Since this is just a doji candlestick with a longer upper shadow than the lower shadow, in the code, we can ensure that the candle is a doji first then we have to explicitly ensure that the upper shadow is twice longer than the lower shadow.
bool CTALib::CDLGRAVESTONEDOJI(double open,
                               double high,
                               double low,
                               double close,
                               double body_torrelance = 3,
                               double shadow_ratio = 2.0)
{
   double body_size    = MathAbs(open - close);
   double upper_shadow = upperShadowCalc(open, close, high);
   double lower_shadow = lowerShadowCalc(open, close, low);

   //--- Body is very small (like a Doji)
   if (CDLDOJI(open, close, body_torrelance))
   {
      //--- Lower shadow is significantly longer than upper shadow
      if (upper_shadow > lower_shadow * shadow_ratio)
         return true;
   }

   return false;
}
Hammer
This is a candle with a small body at the top of the candle and a long lower shadow. It is a bullish reversal signal that when appears on a downtrend it signifies that there is a potential bullish movement ahead.
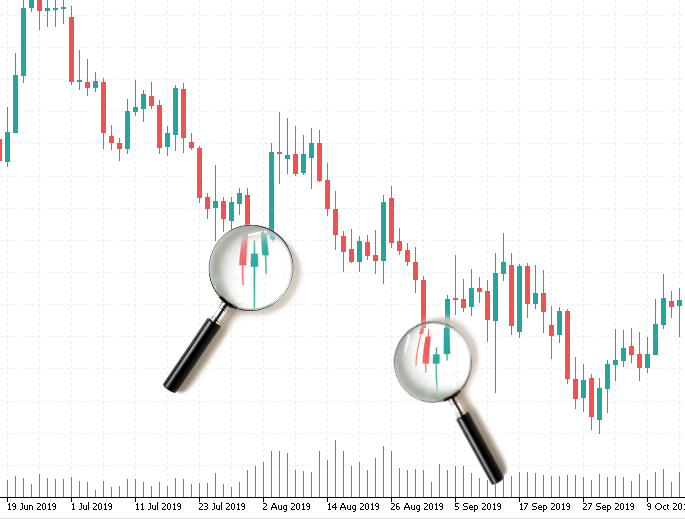
Candlestick patterns are abstract and confusing, sometimes a pattern can vary depending on how you look at it and what you are looking for at a time. A hammer pattern can be confused with a dragonfly doji because what differentiates these two is just their body sizes but they share the same characteristics.
This is one of the problems we often run through when working with candlestick patterns.
This issue can be tackled by setting explicit rules and threshold values which can be adjusted according to a particular instrument (symbol) and other needs.
bool CTALib::CDLHAMMER(double open,
                       double high,
                       double low,
                       double close,
                       double min_body_percentage = 0.2,       // To avoid being a doji
                       double lower_shadow_ratio = 2.0,        // Lower shadow at least 2x the body
                       double upper_shadow_max_ratio = 0.3)    // Upper shadow must be small
{
   double body_size      = MathAbs(open - close);
   double total_range    = high - low + DBL_EPSILON;
   double upper_shadow   = upperShadowCalc(open, close, high);
   double lower_shadow   = lowerShadowCalc(open, close, low);
   double body_percentage = body_size / total_range;

   return (
      body_percentage >= min_body_percentage &&
      lower_shadow >= lower_shadow_ratio * body_size &&
      upper_shadow <= upper_shadow_max_ratio * body_size
   );
}
Since both, the Dragonfly doji and the Hammer candles have longer lower shadow, a small body, and a short upper shadow, we had to introduce the min_body_percentage for checking how small a body needs to be relative to its total range (High-Low) for a candle to be a Hammer while also checking if its lower shadow is twice longer than its upper shadow by default.
Inverted Hammer
This is similar to the hammer but, with a small body at the bottom, a long upper shadow, and a small lower shadow.
This pattern is found in downtrends as it signifies a bullish reversal is about to happen in the market.
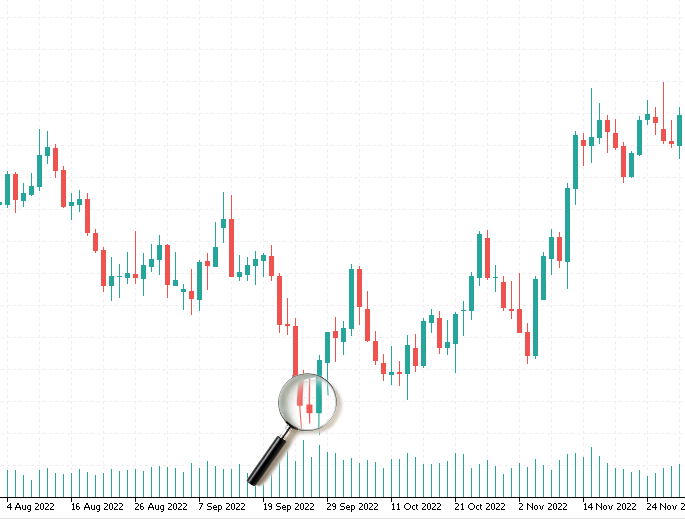
We can code it similarly to the hammer only with tiny modifications on the shadows.
bool CTALib::CDLINVERTEDHAMMER(double open,
                               double high,
                               double low,
                               double close,
                               double min_body_percentage = 0.2,        // Avoid doji
                               double upper_shadow_ratio = 2.0,         // Upper shadow must be long
                               double lower_shadow_max_ratio = 0.3)     // Lower shadow should be small
{
   double body_size        = MathAbs(open - close);
   double total_range      = high - low + DBL_EPSILON;
   double upper_shadow     = upperShadowCalc(open, close, high);
   double lower_shadow     = lowerShadowCalc(open, close, low);
   double body_percentage  = body_size / total_range;

   return (
      body_percentage >= min_body_percentage &&
      upper_shadow >= upper_shadow_ratio * body_size &&
      lower_shadow <= lower_shadow_max_ratio * body_size
   );
}
Spinning Top
This is a candlestick with a small body at the center and long shadows on both sides.
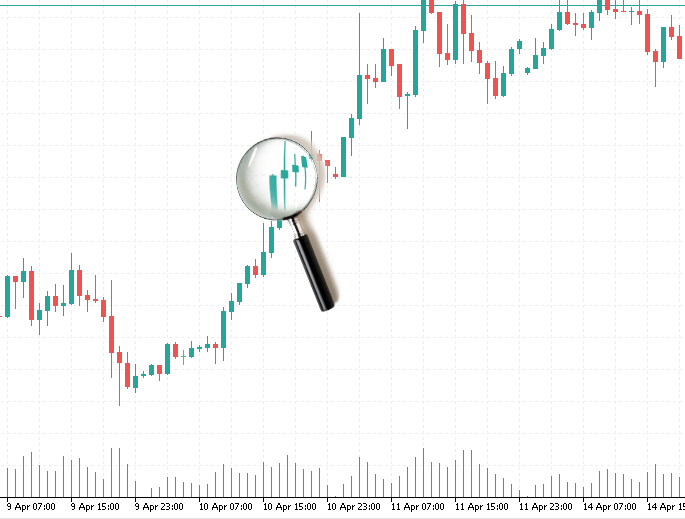
When this candle appears, it signifies indecision in the market which often means the continuation of the current trend as neither buyers nor sellers have the upper hand.
Since this candle is similar to a doji candlestick (only it has a larger body), we have to explicitly ensure the body isn't small like a doji and it is located at the center of the long shadows relative to the body.
bool CTALib::CDLSPINNINGTOP(double open,
                            double high,
                            double low,
                            double close,
                            double body_percentage_threshold = 0.3,
                            double shadow_ratio = 2.0,
                            double shadow_symmetry_tolerance = 0.3)
{
   double body_size      = MathAbs(open - close);
   double total_range    = high - low + DBL_EPSILON;
   double upper_shadow   = upperShadowCalc(open, close, high);
   double lower_shadow   = lowerShadowCalc(open, close, low);
   double body_percentage = body_size / total_range;

   //--- Calculate shadow symmetry ratio
   double shadow_diff = MathAbs(upper_shadow - lower_shadow);
   double shadow_sum = upper_shadow + lower_shadow + DBL_EPSILON;
   double symmetry_ratio = shadow_diff / shadow_sum; // Closer to 0 = more balanced

   return (
      body_percentage < body_percentage_threshold && // Body is small compared to candle size
      upper_shadow > body_size * shadow_ratio && // Both shadows are significantly larger than the body
      lower_shadow > body_size * shadow_ratio &&
      symmetry_ratio <= shadow_symmetry_tolerance //Shadows are roughly equal (symmetrical)
   );
}
Bullish Marubozu
The name "Marubozu" comes from the Japanese word for "close-cropped", indicating a candle with no shadow.
A bullish Marubozu candle is a bullish candle with small or no lower and upper shadows (wicks), It is a strong bullish signal that indicates momentum.
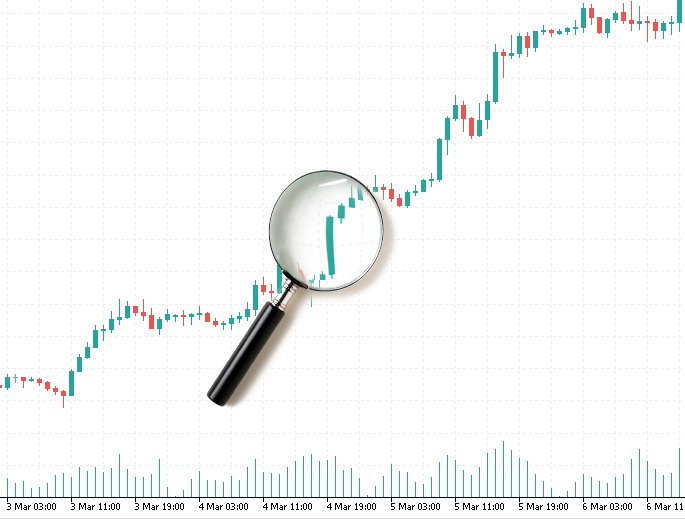
We can add a tolerance value in points for checking whether open and close prices are very close to their high and low prices.
bool CTALib::CDLBULLISHMARUBOZU(double open, double high, double low, double close, double tolerance = 2)
 {
   return (MathAbs(open - low) <= (tolerance*_Point) &&  MathAbs(close - high) <= (tolerance*_Point) && close > open);
 }
Bearish Marubozu
A bearish Marubozu candle is a bearish candle with small or no lower and upper shadows (wicks), It is a strong bearish signal that indicates momentum.
Similarly to the bullish Marubozu candlestick, we have a tolerance value in points for checking whether the open and close prices are very close to their high and low prices.
bool CTALib::CDLBEARISHMARUBOZU(double open, double high, double low, double close, double tolerance = 2)
 {
   return (MathAbs(open - high) <= (tolerance*_Point) && MathAbs(close - low) <= (tolerance*_Point) && close < open);
 }
Right now, we are only considering detecting candlestick patterns and their signals based on their appearance, but the right way to extract the signals from a candlestick according to my sources, must include trend detection for example, for a hammer to be considered a bullish signal it has to appear on a downtrend.
Trend is a crucial part of the equation that you might want to consider if you want to take this project further.
Candlestick Patterns Detection Indicator
Let's visualize the candlestick patterns using the code we used to derive them. Simply because I often find these patterns abstract and confusing frequently, and since we intend to use this data for machine learning purposes where we know the quality of the data matters the most. By visualizing these patterns after we ensure that you are informed on how these patterns were calculated and their visual outcome.
Don't hesitate to tweak some parameters and modify the code as you see fit.
Let's make sure that at least the code we just wrote can identify these patterns that we can also spot in the market as human beings.
This candlestick-based indicator is going to have 5 buffers and one plot on the main chart.
Filename: Candlestick Identifier.mq5
#property indicator_chart_window
#property indicator_buffers 5
#property indicator_plots 1

#property indicator_type1 DRAW_COLOR_CANDLES
#property indicator_color1 clrDodgerBlue, clrOrange, clrRed
#property indicator_style1  STYLE_SOLID
#property indicator_width1  1

double OpenBuff[];
double HighBuff[];
double LowBuff[];
double CloseBuff[];
double ColorBuff[];

#include <ta-lib.mqh> //!important for candlestick patterns
Since the ta-lib.mqh library is a static class, there is no need to initialize its classes, we can call the functions to detect candlestick patterns right away inside the OnCalculate function.
int OnCalculate(const int rates_total,
                const int prev_calculated,
                const datetime &time[],
                const double &open[],
                const double &high[],
                const double &low[],
                const double &close[],
                const long &tick_volume[],
                const long &volume[],
                const int &spread[])
  {
//---

   if (rates_total<1)
     return rates_total;

    for(int i = prev_calculated; i < rates_total; i++)
     {
      OpenBuff[i]  = open[i];
      HighBuff[i]  = high[i];
      LowBuff[i]   = low[i];
      CloseBuff[i] = close[i];

      //---

      if (close[i]>open[i])
         ColorBuff[i] = 1.0;
      else
         ColorBuff[i] = 0.0;

      //---

      double padding = MathAbs(high[i] - low[i]) * 0.2; // 20% padding

      if (CTALib::CDLDOJI(open[i], close[i]))
        {
          TextCreate(string(i)+(string)time[i], time[i]-PeriodSeconds(), high[i]+padding, "Doji", clrBlack, 90.0);
          ColorBuff[i] = 2.0;
        }

      if (CTALib::CDLDRAGONFLYDOJI(open[i], high[i], low[i], close[i]))
        {
          TextCreate(string(i)+(string)time[i], time[i]-PeriodSeconds(), high[i]+padding,"DragonFly Doji", clrBlack, 90.0);
          ColorBuff[i] = 2.0;
        }

      if (CTALib::CDLGRAVESTONEDOJI(open[i], high[i], low[i], close[i]))
        {
          TextCreate(string(i)+(string)time[i], time[i]-PeriodSeconds(), high[i]+padding,"GraveStone Doji", clrBlack, 90.0);
          ColorBuff[i] = 2.0;
        }

      if (CTALib::CDLHAMMER(open[i], high[i], low[i], close[i]))
        {
          TextCreate(string(i)+(string)time[i], time[i]-PeriodSeconds(), high[i]+padding,"Hammer", clrBlack, 90.0);
          ColorBuff[i] = 2.0;
        }

      if (CTALib::CDLINVERTEDHAMMER(open[i], high[i], low[i], close[i]))
        {
          TextCreate(string(i)+(string)time[i], time[i]-PeriodSeconds(), high[i]+padding,"Inverted Hammer", clrBlack, 90.0);
          ColorBuff[i] = 2.0;
        }

      if (CTALib::CDLSPINNINGTOP(open[i], high[i], low[i], close[i], 0.3, 2.0))
        {
          TextCreate(string(i)+(string)time[i], time[i]-PeriodSeconds(), high[i]+padding,"Spinning Top", clrBlack, 90.0);
          ColorBuff[i] = 2.0;
        }

      if (CTALib::CDLBULLISHMARUBOZU(open[i], high[i], low[i], close[i], 2))
        {
          TextCreate(string(i)+(string)time[i], time[i]-PeriodSeconds(), high[i]+padding,"Bullish Marubozu", clrBlack, 90.0);
          ColorBuff[i] = 2.0;
        }

      if (CTALib::CDLBEARISHMARUBOZU(open[i], high[i], low[i], close[i], 2))
        {
          TextCreate(string(i)+(string)time[i], time[i]-PeriodSeconds(), high[i]+padding,"Bearish Marubozu", clrBlack, 90.0);
          ColorBuff[i] = 2.0;
        }
     }

//--- return value of prev_calculated for next call
   return(rates_total);
  }
By default, the bullish candles are in orange while the bearish candles are in blue, any candle detected with the patterns discussed in this article above will be marked in red following a text oriented to a 90 degree angle, indicating the type of candlestick pattern the candle marked in red belongs to.
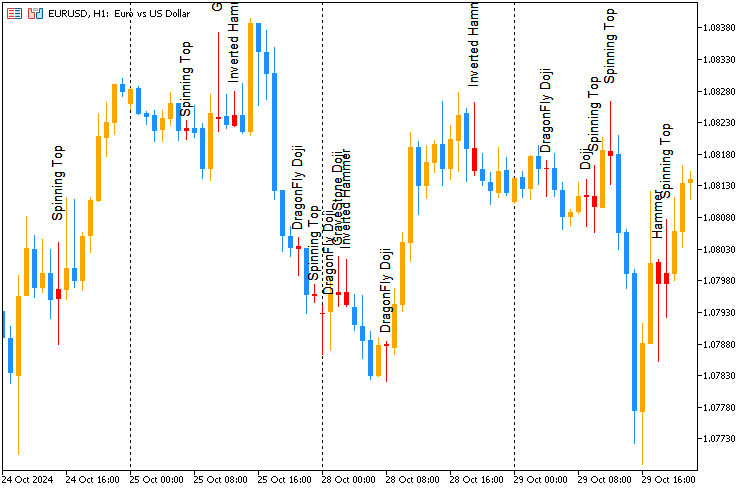
As you can see on the image above, our candlestick detection indicator does a decent job at identifying these candlestick patterns, we can now be confident of the logic we applied in our code.
Now let's proceed to collect these patterns and store them to a CSV file using a script then use this information in training machine learning models.
Collecting Candlestick Patterns for Machine Learning
Since some candlestick patterns don't appear frequently in the market, especially in higher timeframes where there are very few bars in history, let's collect our data starting from 01 January 2005 to 01 January 2023.
This 18-years period should give us a plenty of bars from the daily timeframe and hence, numerous patterns for our machine learning models to observe.
#include <ta-lib.mqh> //Contains CTALib class for candlestick patterns detection
#include <MALE5\Pandas\pandas.mqh> //https://www.mql5.com/en/articles/17030

input datetime start_date = D'2005.01.01';
input datetime end_date = D'2023.01.01';

input string symbol = "XAUUSD";
input ENUM_TIMEFRAMES timeframe = PERIOD_D1;
//+------------------------------------------------------------------+
//| Script program start function                                    |
//+------------------------------------------------------------------+
void OnStart()
  {
//---

   vector open, high, low, close;

   open.CopyRates(symbol, timeframe, COPY_RATES_OPEN, start_date, end_date);
   high.CopyRates(symbol, timeframe, COPY_RATES_HIGH, start_date, end_date);
   low.CopyRates(symbol, timeframe, COPY_RATES_LOW, start_date, end_date);
   close.CopyRates(symbol, timeframe, COPY_RATES_CLOSE, start_date, end_date);

   CDataFrame df;

   vector cdl_patterns = {};
   cdl_patterns = CTALib::CDLWHITECANDLE(open, close);
   df.insert("White Candle", cdl_patterns);

   cdl_patterns = CTALib::CDLBLACKCANDLE(open, close);
   df.insert("Black Candle", cdl_patterns);

   cdl_patterns = CTALib::CDLDOJI(open, close);
   df.insert("Doji Candle", cdl_patterns);

   cdl_patterns = CTALib::CDLDRAGONFLYDOJI(open, high, low, close);
   df.insert("Dragonflydoji Candle", cdl_patterns);

   cdl_patterns = CTALib::CDLGRAVESTONEDOJI(open, high, low, close);
   df.insert("Gravestonedoji Candle", cdl_patterns);

   cdl_patterns = CTALib::CDLHAMMER(open, high, low, close);
   df.insert("Hammer Candle", cdl_patterns);

   cdl_patterns = CTALib::CDLINVERTEDHAMMER(open, high, low, close);
   df.insert("Invertedhammer Candle", cdl_patterns);

   cdl_patterns = CTALib::CDLSPINNINGTOP(open, high, low, close);
   df.insert("Spinningtop Candle", cdl_patterns);

   cdl_patterns = CTALib::CDLBULLISHMARUBOZU(open, high, low, close);
   df.insert("BullishMarubozu Candle", cdl_patterns);

   cdl_patterns = CTALib::CDLBEARISHMARUBOZU(open, high, low, close);
   df.insert("BearishMarubozu Candle", cdl_patterns);

   df.insert("Open", open);
   df.insert("High", high);
   df.insert("Low", low);
   df.insert("Close", close);

   df.to_csv(StringFormat("CandlestickPatterns.%s.%s.csv",symbol,EnumToString(timeframe)), true);
  }
We also collect the OHLC (Open, High, Low, and Close) values for preparing the target variable, and just in case something happens and we need them.
Training an AI model to Make Predictions Based on Candlestick Patterns
Now that we have a dataset, let's load this data in a Python script (Jupyter Notebook).
import pandas as pd

symbol = "XAUUSD"
df = pd.read_csv(f"/kaggle/input/forex-candlestick-patterns/CandlestickPatterns.{symbol}.PERIOD_D1.csv")

df
Outputs
| White Candle | Black Candle | Doji Candle | Dragonflydoji Candle | Gravestonedoji Candle | Hammer Candle | Invertedhammer Candle | Spinningtop Candle | BullishMarubozu Candle | BearishMarubozu Candle | Open | High | Low | Close | |
|---|---|---|---|---|---|---|---|---|---|---|---|---|---|---|
| 0 | 0.0 | 1.0 | 0.0 | 0.0 | 0.0 | 0.0 | 0.0 | 0.0 | 0.0 | 0.0 | 438.45 | 438.71 | 426.72 | 429.55 |
| 1 | 0.0 | 1.0 | 0.0 | 0.0 | 0.0 | 0.0 | 0.0 | 0.0 | 0.0 | 0.0 | 429.52 | 430.18 | 423.71 | 427.51 |
| 2 | 0.0 | 1.0 | 0.0 | 0.0 | 0.0 | 0.0 | 0.0 | 0.0 | 0.0 | 0.0 | 427.50 | 428.77 | 425.10 | 426.58 |
| 3 | 0.0 | 1.0 | 0.0 | 0.0 | 0.0 | 0.0 | 0.0 | 0.0 | 0.0 | 0.0 | 426.31 | 427.85 | 420.17 | 421.37 |
| 4 | 0.0 | 1.0 | 0.0 | 0.0 | 0.0 | 0.0 | 0.0 | 0.0 | 0.0 | 0.0 | 421.39 | 425.48 | 416.57 | 419.02 |
| ... | ... | ... | ... | ... | ... | ... | ... | ... | ... | ... | ... | ... | ... | ... |
The biggest challenge that arises when working with this candlestick data is making the target variable.
In most classification problems related to financial markets, we often define the target variable based on the future price movement, using a parameter we often call "lookahead".
This parameter specifies how many bars (or time steps) we look ahead in the data. For example, if the lookahead is set to 1, we compare the closing price of the current bar to the closing price of the next bar:
If Close[next bar] > Close[current bar], it indicates a bullish movement, so we assign a target label of 1.
Otherwise, if this condition is not met, it suggests a bearish movement, so we assign a label of 0.
We can do the same thing here to ensure we use our features to predict the information ahead of time, but as outlined in the above table, we have many zeros in this data as we often don't have any special bar detected at every row other than the white and black candles which aren't special patterns and we don't consider them as candlestick patterns.
This means that we will be giving our machine learning models zero values more often than not and force the models to understand the relationship and predict the target variable given nothing of value, this will then cause our models to rely too much on white and black candles something we don't want.
We can tackle this issue by dropping all rows with zero values for all candlestick patterns and train the model with pure candlestick data, this would also require us to avoid the same situation on the model's runtime.
Another way to tackle this is by introducing the hold class signal indicated by -1 in all rows where all candlestick patterns were 0 (false) except for the White and Black candles columns, but this will raise a huge class imbalance problem which we addressed in the previous article, but, even so this approach couldn't fix the problem.
For now, let us proceed to prepare the target variable regardless.
lookahead = 1

new_df = df.copy()
new_df["future_close"] = new_df["Close"].shift(-lookahead)
new_df.dropna(inplace=True)  # Drop NaNs caused by the shift operation

signal = []
for i in range(len(new_df)):  # Iterate over rows, not columns
    if new_df["future_close"].iloc[i] > new_df["Close"].iloc[i]:
        signal.append(1)
    else:
        signal.append(0)

new_df["Signal"] = signal
We then split the predictors into a 2D array named X while dropping unwanted features such as the OHLC values, the column we want to predict (target), and the future_close close feature which we used to derive the target column. We also assign the target column named Signal to the y array.
X = new_df.drop(columns=[
    "Signal",
    "Open",
    "High",
    "Low",
    "Close",
    "future_close"
])

y = new_df["Signal"]

# Split data into train and test sets
X_train, X_test, y_train, y_test = train_test_split(X, y, test_size=0.2, random_state=42, shuffle=False)
I chose to work with a Catboost model for this problem as we have a plenty of categorical columns which in theory should work well with the Catboost classifier.
from catboost import CatBoostClassifier
from sklearn.utils.class_weight import compute_class_weight

# Automatically calculate class weights
classes = np.unique(y)
weights = compute_class_weight(class_weight='balanced', classes=classes, y=y)
class_weights = dict(zip(classes, weights))

# Define the base model
model = CatBoostClassifier(
    iterations=1000,
    learning_rate=0.01,
    depth=5,
    loss_function='Logloss',
    class_weights=class_weights,
    verbose=100
)

model.fit(X_train, y_train) # Training the classifier
Outputs.
0:      learn: 0.6930586        total: 3.64ms   remaining: 3.64s
100:    learn: 0.6897625        total: 136ms    remaining: 1.21s
200:    learn: 0.6888030        total: 269ms    remaining: 1.07s
300:    learn: 0.6883559        total: 401ms    remaining: 931ms
400:    learn: 0.6881469        total: 532ms    remaining: 795ms
500:    learn: 0.6879966        total: 661ms    remaining: 658ms
600:    learn: 0.6879013        total: 789ms    remaining: 524ms
700:    learn: 0.6878311        total: 916ms    remaining: 391ms
800:    learn: 0.6877729        total: 1.04s    remaining: 260ms
900:    learn: 0.6877273        total: 1.17s    remaining: 129ms
999:    learn: 0.6876900        total: 1.3s     remaining: 0us
<catboost.core.CatBoostClassifier at 0x798cc6d08dd0>
Let's evaluate this model on the data it hasn't seen before (the testing sample).
y_pred = model.predict(X_test)

print("\nClassification Report:\n", classification_report(y_test, y_pred))
Outputs.
Classification Report:
               precision    recall  f1-score   support

           0       0.49      0.55      0.52       429
           1       0.58      0.52      0.55       511

    accuracy                           0.53       940
   macro avg       0.53      0.53      0.53       940
weighted avg       0.54      0.53      0.53       940
The results indicate an average model with 0.58 and 0.49 precision for class 1 and 0 respectively, while we can rely on this model for predicting the class of 1 which it does with 58% certainity, we can't rely on it on predicting the class 0, we are better off guessing in this case.
An overall accuracy of 53% out of 100% which is realistic in this trading space, It is better than flipping the coin or randomly guessing which can guarantee a 50/50 winning rate.
Let us check the feature importance plot to observe which features were the most impactful to this model.
import matplotlib.pyplot as plt

# Get feature importances
importances = model.get_feature_importance()
feature_names = X_train.columns if hasattr(X_train, 'columns') else [f'feature_{i}' for i in range(X_train.shape[1])]

# Create DataFrame for plotting
feat_imp_df = pd.DataFrame({
    'Feature': feature_names,
    'Importance': importances
}).sort_values(by='Importance', ascending=False)

# Plot
plt.figure(figsize=(7, 3))
plt.barh(feat_imp_df['Feature'], feat_imp_df['Importance'])
plt.gca().invert_yaxis()  # Highest importance on top
plt.title('Feature Importances')
plt.xlabel('Importance')
plt.ylabel('Feature')
plt.tight_layout()
plt.show()
Outputs.
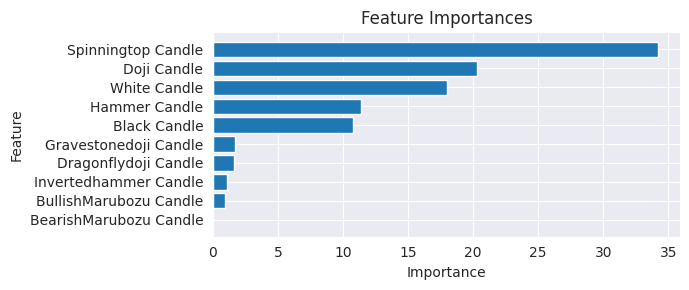
The spinning top candlestick pattern was the most impactful feature to this model followed with the Doji candlestick, the Bearish Marubozu candle was the one with the less impact.
According to what I have read on these candlestick patterns is that some patterns are meant to indicate the trend or whats going to happen in the market over some extended period of time or horizon for example, a doji candle appearing at the top of the uptrend could signify the downtrend is about to happen for some time.
We created the target variable based on the lookahead value of 1 so, we are using these candlestick patterns to signify one bar ahead instead of some number of bars ahead.
So feel free to explore different look ahead values greater than 1 to observe the impact these candlestick patterns have on some extended period or over different horizons, in my exploration so far, I found out that the model trained on the look-ahead value of 1 produced the most accurate model.
We are sticking with the look-ahead value of 1 for now as I believe we can tackle this predictive horizon problem inside our final trading robot by having stop loss and take profit values or by closing our trades after a certain number of bars have passed.
Finalizing it in a Trading Robot
Now that we have trained a model based on candlestick patterns, Let us test it on the actual trading environment and see if candlestick patterns could be useful in the Artificial Intelligence (AI) realm.
Firstly, we have to save our model to ONNX format which is compatible with MQL5 and MetaTrader 5.
model_onnx = convert_sklearn(
    model,
    "catboost",
    [("input", FloatTensorType([None, X_train.shape[1]]))],
    target_opset={"": 12, "ai.onnx.ml": 2},
)

# And save.
with open(f"CatBoost.CDLPatterns.{symbol}.onnx", "wb") as f:
    f.write(model_onnx.SerializeToString())
More information on saving this Catboost model can be found here.
Our Expert Advisor (EA) is fairly simple.
#include <Trade\Trade.mqh> //The trading module
#include <Trade\PositionInfo.mqh> //Position handling module
#include <ta-lib.mqh> //For candlestick patterns
#include <Catboost.mqh> //Has a class for deploying a catboost model

CTrade m_trade;
CPositionInfo m_position;

CCatboostClassifier catboost;

input int magic_number = 21042025;
input int slippage = 100;
input string symbol_ = "XAUUSD";
input ENUM_TIMEFRAMES timeframe_ = PERIOD_D1;
input int lookahead = 1;

//+------------------------------------------------------------------+
//| Expert initialization function                                   |
//+------------------------------------------------------------------+
int OnInit()
  {

   if (!MQLInfoInteger(MQL_TESTER))
     if (!ChartSetSymbolPeriod(0, symbol_, timeframe_))
       {
         printf("%s failed to set symbol %s and timeframe %s, Check these values. Err = %d",__FUNCTION__,symbol_,EnumToString(timeframe_),GetLastError());
         return INIT_FAILED;
       }

//---

   if (!catboost.Init(StringFormat("CatBoost.CDLPatterns.%s.onnx",symbol_), ONNX_COMMON_FOLDER)) //Initialize the catboost model
      return INIT_FAILED;

//---

   m_trade.SetExpertMagicNumber(magic_number);
   m_trade.SetDeviationInPoints(slippage);
   m_trade.SetMarginMode();
   m_trade.SetTypeFillingBySymbol(Symbol());

//---
   return(INIT_SUCCEEDED);
  }
//+------------------------------------------------------------------+
//| Expert deinitialization function                                 |
//+------------------------------------------------------------------+
void OnDeinit(const int reason)
  {
//---

  }
//+------------------------------------------------------------------+
//| Expert tick function                                             |
//+------------------------------------------------------------------+
void OnTick()
  {
//---

   double open = iOpen(Symbol(), Period(), 1),
          high = iHigh(Symbol(), Period(), 1),
          low  = iLow(Symbol(), Period(), 1),
          close = iClose(Symbol(), Period(), 1);

   vector x = {
               CTALib::CDLWHITECANDLE(open, close),
               CTALib::CDLBLACKCANDLE(open, close),
               CTALib::CDLDOJI(open, close),
               CTALib::CDLDRAGONFLYDOJI(open, high, low, close),
               CTALib::CDLGRAVESTONEDOJI(open, high, low, close),
               CTALib::CDLHAMMER(open, high, low, close),
               CTALib::CDLINVERTEDHAMMER(open, high, low, close),
               CTALib::CDLSPINNINGTOP(open, high, low, close),
               CTALib::CDLBULLISHMARUBOZU(open, high, low, close),
               CTALib::CDLBEARISHMARUBOZU(open, high, low, close)
              };

   long signal = catboost.predict(x).cls; //Predicted class

   MqlTick ticks;
   if (!SymbolInfoTick(Symbol(), ticks))
      {
         printf("Failed to obtain ticks information, Error = %d",GetLastError());
         return;
      }

   double volume_ = SymbolInfoDouble(Symbol(), SYMBOL_VOLUME_MIN);

   if (signal == 1)
     {
        if (!PosExists(POSITION_TYPE_BUY) && !PosExists(POSITION_TYPE_SELL))
            m_trade.Buy(volume_, Symbol(), ticks.ask,0,0);
     }

   if (signal == 0)
     {
        if (!PosExists(POSITION_TYPE_SELL) && !PosExists(POSITION_TYPE_BUY))
            m_trade.Sell(volume_, Symbol(), ticks.bid,0,0);
     }

    CloseTradeAfterTime((Timeframe2Minutes(Period())*lookahead)*60); //Close the trade after a certain lookahead and according the the trained timeframe
  }
After initializing the Catboost model in ONNX format which was saved in the Common Folder.
Inside the OnTick function, we get the previously closed bar Open, High, Low, and Close values and parse them to the functions from CTALib for detecting candlestick patterns then we use its outcomes to make predictions in a vector named x.
We have to be mindful of the features and their order as they were used in training the final Catboost model within the Python script.
X_train.columns
In our final model we had.
Index(['White Candle', 'Black Candle', 'Doji Candle', 'Dragonflydoji Candle',
       'Gravestonedoji Candle', 'Hammer Candle', 'Invertedhammer Candle',
       'Spinningtop Candle', 'BullishMarubozu Candle',
       'BearishMarubozu Candle'],
      dtype='object')
This order was preserved inside the expert advisor.
Presently, we don't have a stop loss and its respective take profit value, so we close the open trades (positions) after a certain look ahead value number of bars passed in the given timeframe.
Tester configurations.
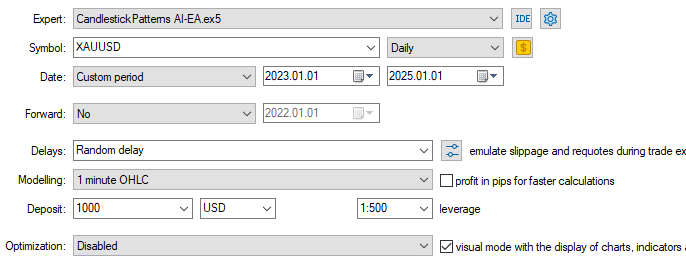
Results.
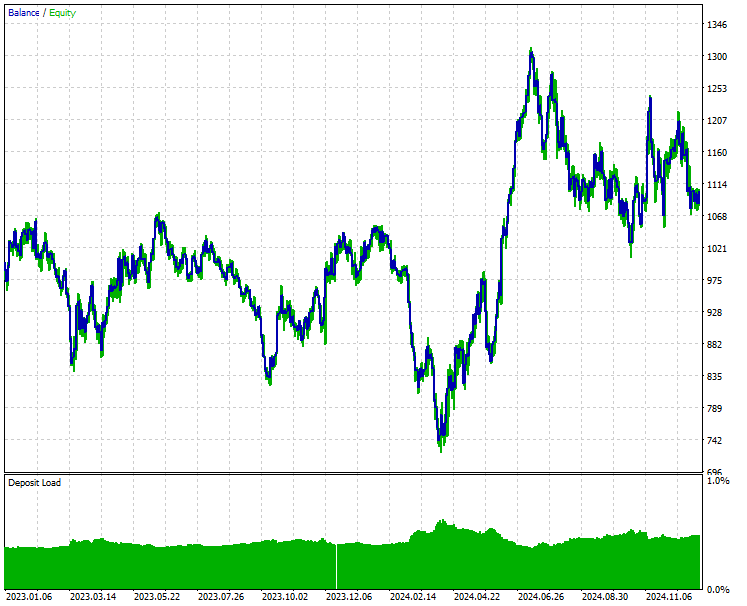
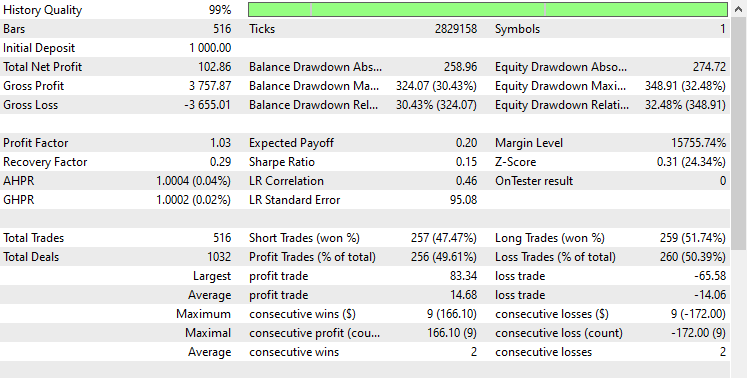
What fascinates me is the similarities in the outcome between long and short trades, short trades opened during these two years period were 257. 2 trades fewer than long trades which were 259.
This is inappropriate and we can say that despite the model regarding all the candlestick patterns the most impactful are the white and black candles since they are the ones appearing on every bar, we are also closing the trade after one bar (lookahead value = 1), this issue traces back to how we prepared the target variable and trained the model with the data containing zero (false) values in many features.
To ensure that the unique candlestick patterns are respected, we have to check whenever all special candlestick patterns were 0 (false) -- not detected by the model, and prevent opening a trade when this happens.
We only want to open a trade when there is some unique candlestick pattern detected other than the white and black candlestick.
void OnTick()
  {
//---

   double open = iOpen(Symbol(), Period(), 1),
          high = iHigh(Symbol(), Period(), 1),
          low  = iLow(Symbol(), Period(), 1),
          close = iClose(Symbol(), Period(), 1);


   vector x = {
               CTALib::CDLWHITECANDLE(open, close),
               CTALib::CDLBLACKCANDLE(open, close),
               CTALib::CDLDOJI(open, close),
               CTALib::CDLDRAGONFLYDOJI(open, high, low, close),
               CTALib::CDLGRAVESTONEDOJI(open, high, low, close),
               CTALib::CDLHAMMER(open, high, low, close),
               CTALib::CDLINVERTEDHAMMER(open, high, low, close),
               CTALib::CDLSPINNINGTOP(open, high, low, close),
               CTALib::CDLBULLISHMARUBOZU(open, high, low, close),
               CTALib::CDLBEARISHMARUBOZU(open, high, low, close)
              };

   vector patterns = {
                        CTALib::CDLDOJI(open, close),
                        CTALib::CDLDRAGONFLYDOJI(open, high, low, close),
                        CTALib::CDLGRAVESTONEDOJI(open, high, low, close),
                        CTALib::CDLHAMMER(open, high, low, close),
                        CTALib::CDLINVERTEDHAMMER(open, high, low, close),
                        CTALib::CDLSPINNINGTOP(open, high, low, close),
                        CTALib::CDLBULLISHMARUBOZU(open, high, low, close),
                        CTALib::CDLBEARISHMARUBOZU(open, high, low, close)
                     }; //Store all the special patterns

   long signal = catboost.predict(x).cls; //Predicted class

   MqlTick ticks;
   if (!SymbolInfoTick(Symbol(), ticks))
      {
         printf("Failed to obtain ticks information, Error = %d",GetLastError());
         return;
      }

   double volume_ = SymbolInfoDouble(Symbol(), SYMBOL_VOLUME_MIN);

   if (signal == 1 && patterns.Sum()>0) //Check if there are is atleast a special pattern before opening a trade
     {
        if (!PosExists(POSITION_TYPE_BUY) && !PosExists(POSITION_TYPE_SELL))
            m_trade.Buy(volume_, Symbol(), ticks.ask,0,0);
     }

   if (signal == 0 && patterns.Sum()>0) //Check if there are is atleast a special pattern before opening a trade
     {
        if (!PosExists(POSITION_TYPE_SELL) && !PosExists(POSITION_TYPE_BUY))
            m_trade.Sell(volume_, Symbol(), ticks.bid,0,0);
     }

    CloseTradeAfterTime((Timeframe2Minutes(Period())*lookahead)*60); //Close the trade after a certain lookahead and according the the trained timeframe
  }
Tester outcomes.
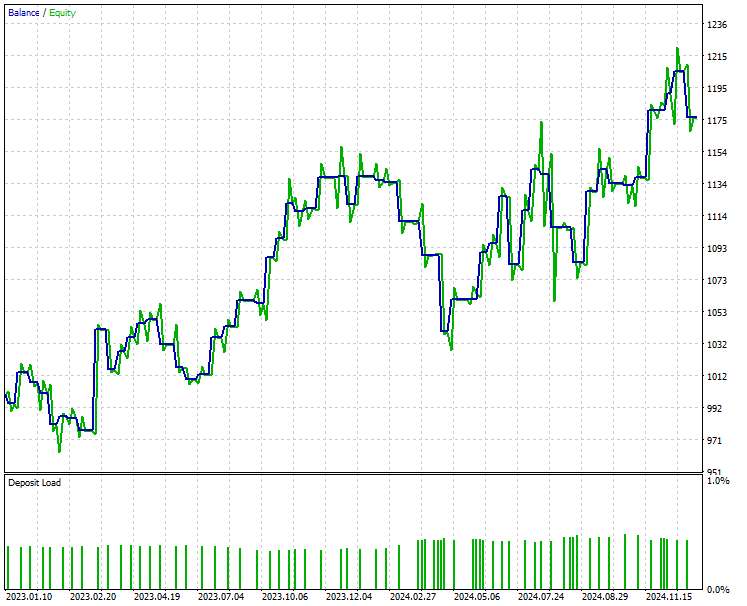
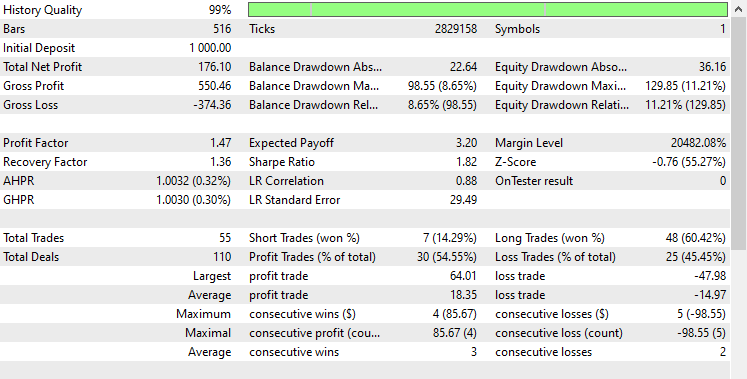
It looks a lot better now, a few trades were opened which resembles the scarcity of these candlestick patterns appearance in the upper timeframe as trained a our model on the daily timeframe.
The percentage number of profitable trades is 54.55% which is very close to the overall accuracy of 0.53 (53%) obtained in the classification report, this resemblance indicates that we are on the right path.
Conclusion
So it is possible to use candlestick patterns when working with Artificial Intelligence (AI) models and use the final outcome to make predictions on the market, however, unlike using indicators and mathematical calculations like any typical data that we often use in forecasting the markets, candlestick patterns require a lot of considerations and close attention to tiny details when collecting the data and creating features derived from the observable candlesticks in the market, a small misinterpretation of a candle could lead to a very different outcome.
It is said that our desires and beliefs influence how we perceive and interpret information. In other words, we see what we want to see.
I believe this is what happens mostly when working with candlestick patterns, if you are looking for a hammer, then a dragonfly doji could look like a hammer and viceversa.
I believe a plenty of trials and errors are required when preparing the candlestick-based data for optimal performance when using this data in machine learning.
Best regards.
Sources & References
- What Is a Doji Candle Pattern, and What Does It Tell You?
- Hammer Candlestick: What It Is and How Investors Use It
- Shooting Star: What It Means in Stock Trading, With an Example
- What is a Spinning top candlestick pattern?
- Marubozu: What it Means, How it Works, Why it's Used
- The candlestick trading bible
Attachments Table
| Filename | Description/Usage |
|---|---|
| Experts\CandlestickPatterns AI-EA.mq5 | An Expert Advisor (EA) that deploys catboost model which makes predictions based on candlestick patterns. |
| Indicators\Candlestick Identifier.mq5 | An indicator for displaying candlestick patterns on the chart. |
| Scripts\Candlestick Patterns Collect.mq5 | A script for collecting candlestick patterns and storing this information into a CSV file. |
| Include\Catboost.mqh | A library that contains classes for loading, initializing, and deploying the catboost classifier for making predictions on the market. |
| Include\pandas.mqh | Python-like Pandas module for data storage and manipulation. |
| Include\ta-lib.mqh | Technical analysis library that contains a class for detecting candlestick patterns. |
| Common\Files\*.csv | CSV files that contain candlestick data for machine learning usage. |
| Common\Files\*.onnx | Machine learning models in ONNX Format. |
| CandlestickMarket Prediction.ipynb | A Python script (Jupyter noteboot) for training the Catboost model. |
Warning: All rights to these materials are reserved by MetaQuotes Ltd. Copying or reprinting of these materials in whole or in part is prohibited.
This article was written by a user of the site and reflects their personal views. MetaQuotes Ltd is not responsible for the accuracy of the information presented, nor for any consequences resulting from the use of the solutions, strategies or recommendations described.
 DoEasy. Service functions (Part 3): Outside Bar pattern
 Price Action Analysis Toolkit Development (Part 21): Market Structure Flip Detector Tool
 Creating Dynamic MQL5 Graphical Interfaces through Resource-Driven Image Scaling with Bicubic Interpolation on Trading Charts
 MQL5 Wizard Techniques you should know (Part 61): Using Patterns of ADX and CCI with Supervised Learning
- Free trading apps
- Over 8,000 signals for copying
- Economic news for exploring financial markets
You agree to website policy and terms of use
Using candlestick configuration instead of underlying price action is similar to using 256-color indexed image instead of true color image - you loose a lot of nuances which can be important. Moreother, depending from the time offset of a broker candlestick patterns can completely change on the same history of quotes. And even if you'd not use a large timeframe (such as D1 (in your case) or H4), simple artificial shifting of time (minutes) inside an hour will produce completely different formations of candlesticks. Unreliable, does not produce any value.
I explained this in the article already.
Right now, we are only considering detecting candlestick patterns and their signals based on their appearance, but the right way to extract the signals from a candlestick according to my sources, must include trend detection for example, for a hammer to be considered a bullish signal it has to appear on a downtrend.
Trend is a crucial part of the equation that you might want to consider if you want to take this project further.
Price action is important, no denying that.
Your quote is not related to main idea of my point.
Hi @Omega J Msigwa
This is the perfect information I have been looking to integrate Candle Patterns into Machine Learning. Already got some meaningful ideas from this article and surely my next ML project will be on these lines.
Wish you Merry Christmas ...