MQL5 Programming Articles
Study the MQL5 language for programming trading strategies in numerous published articles mostly written by you - the community members. The articles are grouped into categories to help you quicker find answers to any questions related to programming: Integration, Tester, Trading Strategies, etc.
Follow our new publications and discuss them on the Forum!
Add a new article

You are missing trading opportunities:
- Free trading apps
- Over 8,000 signals for copying
- Economic news for exploring financial markets
Registration
Log in
You agree to website policy and terms of use
If you do not have an account, please register


Tracing, Debugging and Structural Analysis of Source Code
The entire complex of problems of creating a structure of an executed code and its tracing can be solved without serious difficulties. This possibility has appeared in MetaTrader 5 due to the new feature of the MQL5 language - automatic creation of variables of complex type of data (structures and classes) and their elimination when going out of local scope. The article contains the description of the methodology and the ready-made tool.
Indicator for Spindles Charting
The article regards spindle chart plotting and its usage in trading strategies and experts. First let's discuss the chart's appearance, plotting and connection with japanese candlestick chart. Next we analyze the indicator's implementation in the source code in the MQL5 language. Let's test the expert based on indicator and formulate the trading strategy.
MetaTrader AppStore Results for Q3 2013
Another quarter of the year has passed and we have decided to sum up its results for MetaTrader AppStore - the largest store of trading robots and technical indicators for MetaTrader platforms. More than 500 developers have placed over 1 200 products in the Market by the end of the reported quarter.

Price series discretization, random component and noise
We usually analyze the market using candlesticks or bars that slice the price series into regular intervals. Doesn't such discretization method distort the real structure of market movements? Discretization of an audio signal at regular intervals is an acceptable solution because an audio signal is a function that changes over time. The signal itself is an amplitude which depends on time. This signal property is fundamental.

From Novice to Expert: Developing a Liquidity Strategy
Liquidity zones are commonly traded by waiting for the price to return and retest the zone of interest, often through the placement of pending orders within these areas. In this article, we leverage MQL5 to bring this concept to life, demonstrating how such zones can be identified programmatically and how risk management can be systematically applied. Join the discussion as we explore both the logic behind liquidity-based trading and its practical implementation.
Graphical Interfaces XI: Refactoring the Library code (build 14.1)
As the library grows, its code must be optimized again in order to reduce its size. The version of the library described in this article has become even more object-oriented. This made the code easier to learn. A detailed description of the latest changes will allow the readers to develop the library independently based on their own needs.
Other classes in DoEasy library (Part 70): Expanding functionality and auto updating the chart object collection
In this article, I will expand the functionality of chart objects and arrange navigation through charts, creation of screenshots, as well as saving and applying templates to charts. Also, I will implement auto update of the collection of chart objects, their windows and indicators within them.

Develop a Proof-of-Concept DLL with C++ multi-threading support for MetaTrader 5 on Linux
We will begin the journey to explore the steps and workflow on how to base development for MetaTrader 5 platform solely on Linux system in which the final product works seamlessly on both Windows and Linux system. We will get to know Wine, and Mingw; both are the essential tools to make cross-platform development works. Especially Mingw for its threading implementations (POSIX, and Win32) that we need to consider in choosing which one to go with. We then build a proof-of-concept DLL and consume it in MQL5 code, finally compare the performance of both threading implementations. All for your foundation to expand further on your own. You should be comfortable building MT related tools on Linux after reading this article.
Graphics in DoEasy library (Part 81): Integrating graphics into library objects
It is time to start the integration of the already created objects into the previously created library objects. This will ultimately endow each library object with its own graphical object allowing users to interact with the program.

Automating Trading Strategies in MQL5 (Part 26): Building a Pin Bar Averaging System for Multi-Position Trading
In this article, we develop a Pin Bar Averaging system in MQL5 that detects pin bar patterns to initiate trades and employs an averaging strategy for multi-position management, enhanced by trailing stops and breakeven adjustments. We incorporate customizable parameters with a dashboard for real-time monitoring of positions and profits.

MQL5 Wizard techniques you should know (Part 05): Markov Chains
Markov chains are a powerful mathematical tool that can be used to model and forecast time series data in various fields, including finance. In financial time series modelling and forecasting, Markov chains are often used to model the evolution of financial assets over time, such as stock prices or exchange rates. One of the main advantages of Markov chain models is their simplicity and ease of use.
Library for easy and quick development of MetaTrader programs (part VI): Netting account events
In the previous articles, we started creating a large cross-platform library simplifying the development of programs for MetaTrader 5 and MetaTrader 4 platforms. In the fifth part of the article series, we created trading event classes and the event collection, from which the events are sent to the base object of the Engine library and the control program chart. In this part, we will let the library to work on netting accounts.

Developing a Trading Strategy: The Triple Sine Mean Reversion Method
This article introduces the Triple Sine Mean Reversion Method, a trading strategy built upon a new mathematical indicator — the Triple Sine Oscillator (TSO). The TSO is derived from the sine cube function, which oscillates between –1 and +1, making it suitable for identifying overbought and oversold market conditions. Overall, the study demonstrates how mathematical functions can be transformed into practical trading tools.

Graphical Interfaces VIII: The Tree View Control (Chapter 2)
The previous chapter of part VIII on graphical interfaces has focused on the elements of static and drop-down calendar. The second chapter will be dedicated to an equally complex element — a tree view, that is included in every complete library used for creating graphical interfaces. A tree view implemented in this article contains multiple flexible settings and modes, thus allowing to adjust this element of control to your needs.

Creating an MQL5 Expert Advisor Based on the PIRANHA Strategy by Utilizing Bollinger Bands
In this article, we create an Expert Advisor (EA) in MQL5 based on the PIRANHA strategy, utilizing Bollinger Bands to enhance trading effectiveness. We discuss the key principles of the strategy, the coding implementation, and methods for testing and optimization. This knowledge will enable you to deploy the EA in your trading scenarios effectively

Automating Trading Strategies in MQL5 (Part 19): Envelopes Trend Bounce Scalping — Trade Execution and Risk Management (Part II)
In this article, we implement trade execution and risk management for the Envelopes Trend Bounce Scalping Strategy in MQL5. We implement order placement and risk controls like stop-loss and position sizing. We conclude with backtesting and optimization, building on Part 18’s foundation.

Developing a Replay System — Market simulation (Part 01): First experiments (I)
How about creating a system that would allow us to study the market when it is closed or even to simulate market situations? Here we are going to start a new series of articles in which we will deal with this topic.

Creating Documentation Based on MQL5 Source Code
This article considers creation of documentation for MQL5 code starting with the automated markup of required tags. It also provides the description of how to use the Doxygen software, how to properly configure it and how to receive results in different formats, including html, HtmlHelp and PDF.

Complex indicators made easy using objects
This article provides a method to create complex indicators while also avoiding the problems that arise when dealing with multiple plots, buffers and/or combining data from multiple sources.
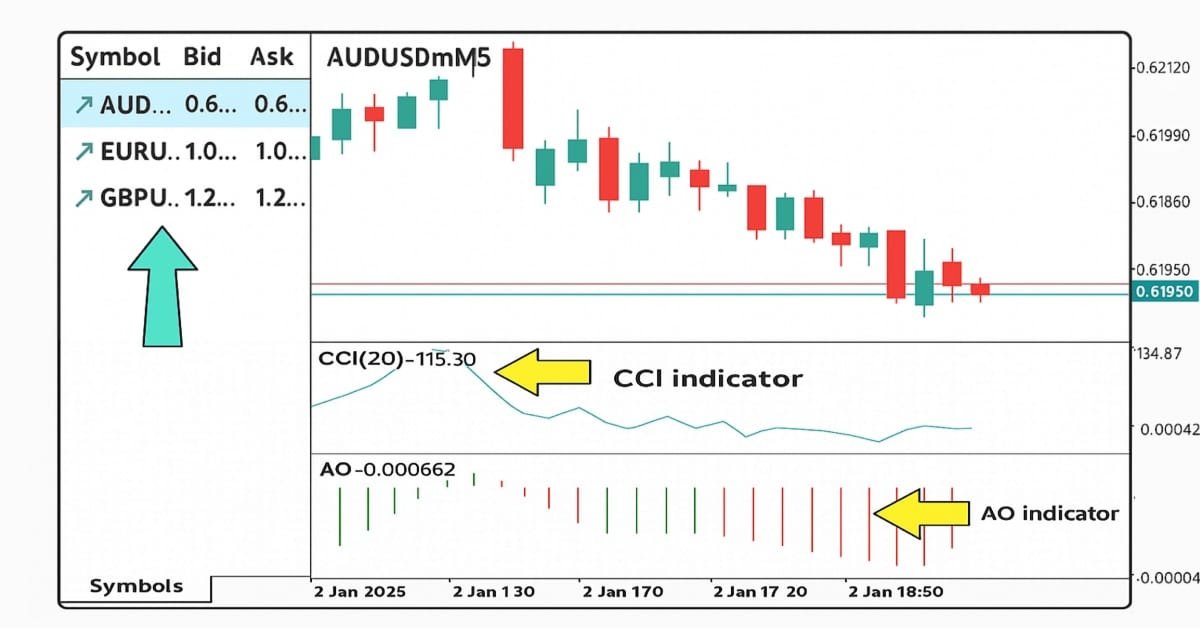
Automating Trading Strategies in MQL5 (Part 20): Multi-Symbol Strategy Using CCI and AO
In this article, we create a multi-symbol trading strategy using CCI and AO indicators to detect trend reversals. We cover its design, MQL5 implementation, and backtesting process. The article concludes with tips for performance improvement.
Timeseries in DoEasy library (part 45): Multi-period indicator buffers
In this article, I will start the improvement of the indicator buffer objects and collection class for working in multi-period and multi-symbol modes. I am going to consider the operation of buffer objects for receiving and displaying data from any timeframe on the current symbol chart.

Building a Spectrum Analyzer
This article is intended to get its readers acquainted with a possible variant of using graphical objects of the MQL5 language. It analyses an indicator, which implements a panel of managing a simple spectrum analyzer using the graphical objects. The article is meant for readers acquianted with basics of MQL5.
Graphics in DoEasy library (Part 89): Programming standard graphical objects. Basic functionality
Currently, the library is able to track standard graphical objects on the client terminal chart, including their removal and modification of some of their parameters. At the moment, it lacks the ability to create standard graphical objects from custom programs.

Creating an EA that works automatically (Part 12): Automation (IV)
If you think automated systems are simple, then you probably don't fully understand what it takes to create them. In this article, we will talk about the problem that kills a lot of Expert Advisors. The indiscriminate triggering of orders is a possible solution to this problem.

Statistical Estimations
Estimation of statistical parameters of a sequence is very important, since most of mathematical models and methods are based on different assumptions. For example, normality of distribution law or dispersion value, or other parameters. Thus, when analyzing and forecasting of time series we need a simple and convenient tool that allows quickly and clearly estimating the main statistical parameters. The article shortly describes the simplest statistical parameters of a random sequence and several methods of its visual analysis. It offers the implementation of these methods in MQL5 and the methods of visualization of the result of calculations using the Gnuplot application.

Learn how to design a trading system by Force Index
Welcome to a new article in our series about how to design a trading system by the most popular technical indicators. In this article, we will learn about a new technical indicator and how to create a trading system using the Force Index indicator.

Neural networks made easy (Part 30): Genetic algorithms
Today I want to introduce you to a slightly different learning method. We can say that it is borrowed from Darwin's theory of evolution. It is probably less controllable than the previously discussed methods but it allows training non-differentiable models.

Building A Candlestick Trend Constraint Model(Part 2): Merging Native Indicators
This article focuses on taking advantage of in-built meta trader 5 indicators to screen out off-trend signals. Advancing from the previous article we will explore how to do it using MQL5 code to communicate our idea to the final program.

Developing a trading robot in Python (Part 3): Implementing a model-based trading algorithm
We continue the series of articles on developing a trading robot in Python and MQL5. In this article, we will create a trading algorithm in Python.

Monte Carlo Permutation Tests in MetaTrader 5
In this article we take a look at how we can conduct permutation tests based on shuffled tick data on any expert advisor using only Metatrader 5.

Automated Parameter Optimization for Trading Strategies Using Python and MQL5
There are several types of algorithms for self-optimization of trading strategies and parameters. These algorithms are used to automatically improve trading strategies based on historical and current market data. In this article we will look at one of them with python and MQL5 examples.

Learn how to design a trading system by DeMarker
Here is a new article in our series about how to design a trading system by the most popular technical indicators. In this article, we will present how to create a trading system by the DeMarker indicator.
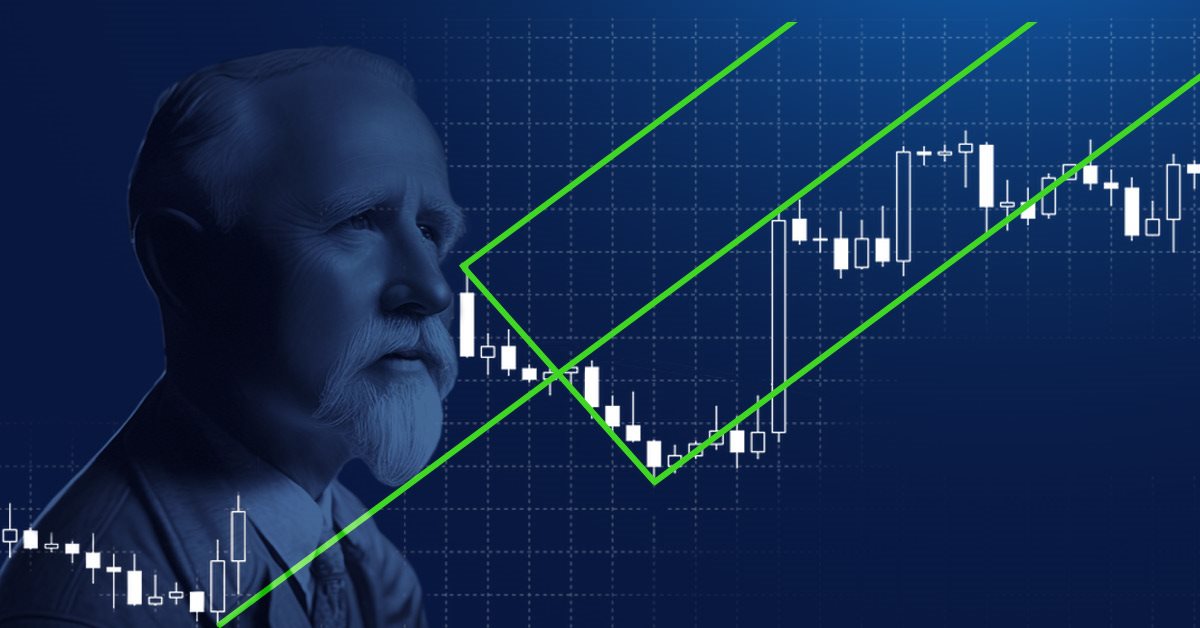
Alan Andrews and his methods of time series analysis
Alan Andrews is one of the most famous "educators" of the modern world in the field of trading. His "pitchfork" is included in almost all modern quote analysis programs. But most traders do not use even a fraction of the opportunities that this tool provides. Besides, Andrews' original training course includes a description not only of the pitchfork (although it remains the main tool), but also of some other useful constructions. The article provides an insight into the marvelous chart analysis methods that Andrews taught in his original course. Beware, there will be a lot of images.

Data Science and Machine Learning (Part 04): Predicting Current Stock Market Crash
In this article I am going to attempt to use our logistic model to predict the stock market crash based upon the fundamentals of the US economy, the NETFLIX and APPLE are the stocks we are going to focus on, Using the previous market crashes of 2019 and 2020 let's see how our model will perform in the current dooms and glooms.

Creating volatility forecast indicator using Python
In this article, we will forecast future extreme volatility using binary classification. Besides, we will develop an extreme volatility forecast indicator using machine learning.
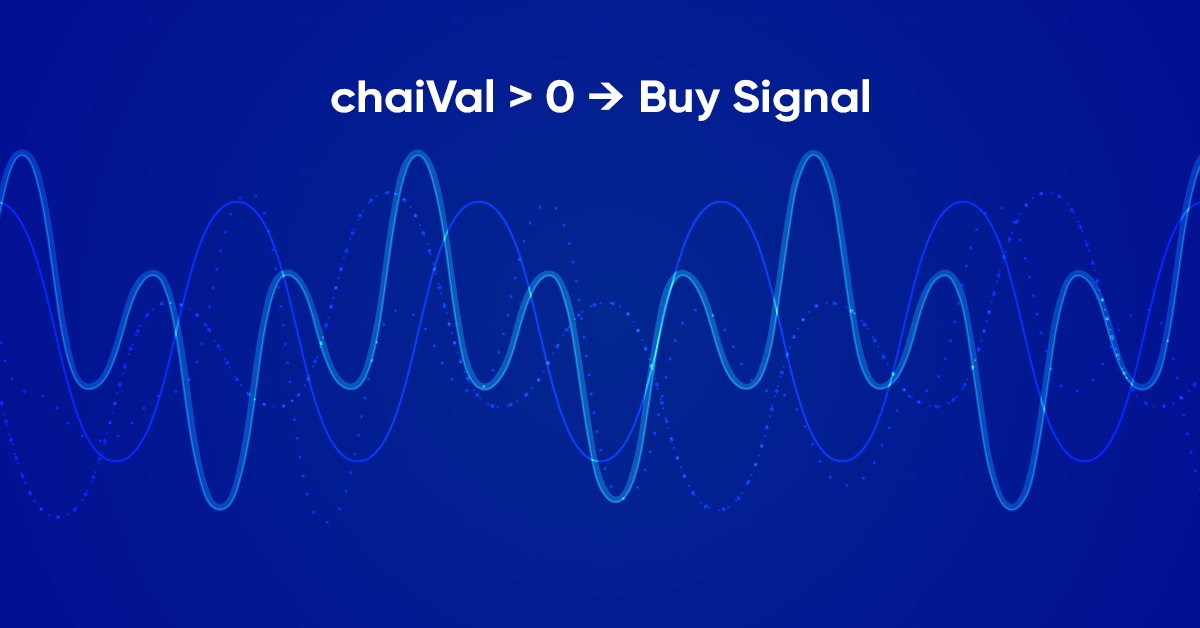
Learn how to design a trading system by Chaikin Oscillator
Welcome to our new article from our series about learning how to design a trading system by the most popular technical indicator. Through this new article, we will learn how to design a trading system by the Chaikin Oscillator indicator.

MQL5 Wizard techniques you should know (Part 01): Regression Analysis
Todays trader is a philomath who is almost always (either consciously or not...) looking up new ideas, trying them out, choosing to modify them or discard them; an exploratory process that should cost a fair amount of diligence. This clearly places a premium on the trader's time and the need to avoid mistakes. These series of articles will proposition that the MQL5 wizard should be a mainstay for traders. Why? Because not only does the trader save time by assembling his new ideas with the MQL5 wizard, and greatly reduce mistakes from duplicate coding; he is ultimately set-up to channel his energy on the few critical areas of his trading philosophy.
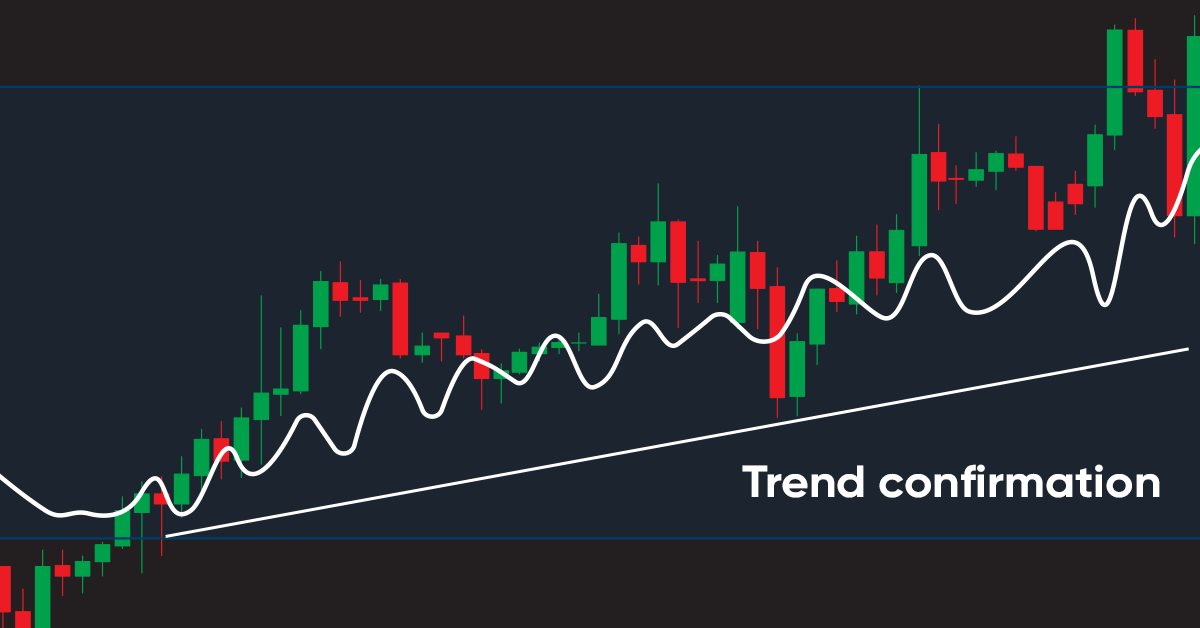
Learn how to design a trading system by Accumulation/Distribution (AD)
Welcome to the new article from our series about learning how to design trading systems based on the most popular technical indicators. In this article, we will learn about a new technical indicator called Accumulation/Distribution indicator and find out how to design an MQL5 trading system based on simple AD trading strategies.

Custom Indicator Workshop (Part 2) : Building a Practical Supertrend Expert Advisor in MQL5
Learn how to build a Supertrend-driven Expert Advisor in MQL5 from the ground up. The article covers embedding the indicator as a resource, reading buffer values on closed bars, detecting confirmed flips, aligning and switching positions, and configuring stop-loss modes and position sizing. It concludes with Strategy Tester setup and reproducible tests, leaving you with a configurable EA and a clear framework for further research and extensions.

Creating an EA that works automatically (Part 06): Account types (I)
Today we'll see how to create an Expert Advisor that simply and safely works in automatic mode. Our EA in its current state can work in any situation but it is not yet ready for automation. We still have to work on a few points.