MQL5 Programming Articles
Study the MQL5 language for programming trading strategies in numerous published articles mostly written by you - the community members. The articles are grouped into categories to help you quicker find answers to any questions related to programming: Integration, Tester, Trading Strategies, etc.
Follow our new publications and discuss them on the Forum!
Add a new article

You are missing trading opportunities:
- Free trading apps
- Over 8,000 signals for copying
- Economic news for exploring financial markets
Registration
Log in
You agree to website policy and terms of use
If you do not have an account, please register

Engineering Trading Discipline into Code (Part 1): Creating Structural Discipline in Live Trading with MQL5
Discipline becomes reliable when it is produced by system design, not willpower. Using MQL5, the article implements real-time constraints—trade-frequency caps and daily equity-based stops—that monitor behavior and trigger actions on breach. Readers gain a practical template for governance layers that stabilize execution under market pressure.

Automating Trading Strategies in MQL5 (Part 37): Regular RSI Divergence Convergence with Visual Indicators
In this article, we build an MQL5 EA that detects regular RSI divergences using swing points with strength, bar limits, and tolerance checks. It executes trades on bullish or bearish signals with fixed lots, SL/TP in pips, and optional trailing stops. Visuals include colored lines on charts and labeled swings for better strategy insights.

Neural Networks in Trading: A Multi-Agent Self-Adaptive Model (MASA)
I invite you to get acquainted with the Multi-Agent Self-Adaptive (MASA) framework, which combines reinforcement learning and adaptive strategies, providing a harmonious balance between profitability and risk management in turbulent market conditions.


Developing a cross-platform grider EA (part III): Correction-based grid with martingale
In this article, we will make an attempt to develop the best possible grid-based EA. As usual, this will be a cross-platform EA capable of working both with MetaTrader 4 and MetaTrader 5. The first EA was good enough, except that it could not make a profit over a long period of time. The second EA could work at intervals of more than several years. Unfortunately, it was unable to yield more than 50% of profit per year with a maximum drawdown of less than 50%.

The Player of Trading Based on Deal History
The player of trading. Only four words, no explanation is needed. Thoughts about a small box with buttons come to your mind. Press one button - it plays, move the lever - the playback speed changes. In reality, it is pretty similar. In this article, I want to show my development that plays trade history almost like it is in real time. The article covers some nuances of OOP, working with indicators and managing charts.

LifeHack for trader: four backtests are better than one
Before the first single test, every trader faces the same question — "Which of the four modes to use?" Each of the provided modes has its advantages and features, so we will do it the easy way - run all four modes at once with a single button! The article shows how to use the Win API and a little magic to see all four testing chart at the same time.

Neural networks made easy (Part 12): Dropout
As the next step in studying neural networks, I suggest considering the methods of increasing convergence during neural network training. There are several such methods. In this article we will consider one of them entitled Dropout.

Developing Zone Recovery Martingale strategy in MQL5
The article discusses, in a detailed perspective, the steps that need to be implemented towards the creation of an expert advisor based on the Zone Recovery trading algorithm. This helps aotomate the system saving time for algotraders.
Graphical Interfaces VII: The Tabs Control (Chapter 2)
The first chapter of seventh part introduced three classes of controls for creating tables: text label table (CLabelsTable), edit box table (CTable) and rendered table (CCanvasTable). In this article (chapter two) we are going to consider the Tabs control.
Library for easy and quick development of MetaTrader programs (part XVI): Symbol collection events
In this article, we will create a new base class of all library objects adding the event functionality to all its descendants and develop the class for tracking symbol collection events based on the new base class. We will also change account and account event classes for developing the new base object functionality.
Social Trading. Can a profitable signal be made even better?
Most subscribers choose a trade signal by the beauty of the balance curve and by the number of subscribers. This is why many today's providers care of beautiful statistics rather than of real signal quality, often playing with lot sizes and artificially reducing the balance curve to an ideal appearance. This paper deals with the reliability criteria and the methods a provider may use to enhance its signal quality. An exemplary analysis of a specific signal history is presented, as well as methods that would help a provider to make it more profitable and less risky.

Video: Simple automated trading – How to create a simple Expert Advisor with MQL5
The majority of students in my courses felt that MQL5 was really difficult to understand. In addition to this, they were searching for a straightforward method to automate a few processes. Find out how to begin working with MQL5 right now by reading the information contained in this article. Even if you have never done any form of programming before. And even in the event that you are unable to comprehend the previous illustrations that you have observed.

Universal Regression Model for Market Price Prediction
The market price is formed out of a stable balance between demand and supply which, in turn, depend on a variety of economic, political and psychological factors. Differences in nature as well as causes of influence of these factors make it difficult to directly consider all the components. This article sets forth an attempt to predict the market price on the basis of an elaborated regression model.
Graphics in DoEasy library (Part 76): Form object and predefined color themes
In this article, I will describe the concept of building various library GUI design themes, create the Form object, which is a descendant of the graphical element class object, and prepare data for creating shadows of the library graphical objects, as well as for further development of the functionality.
Automating Trading Strategies in MQL5 (Part 25): Trendline Trader with Least Squares Fit and Dynamic Signal Generation
In this article, we develop a trendline trader program that uses least squares fit to detect support and resistance trendlines, generating dynamic buy and sell signals based on price touches and open positions based on generated signals.

Gradient Boosting (CatBoost) in the development of trading systems. A naive approach
Training the CatBoost classifier in Python and exporting the model to mql5, as well as parsing the model parameters and a custom strategy tester. The Python language and the MetaTrader 5 library are used for preparing the data and for training the model.

Automating Trading Strategies in MQL5 (Part 8): Building an Expert Advisor with Butterfly Harmonic Patterns
In this article, we build an MQL5 Expert Advisor to detect Butterfly harmonic patterns. We identify pivot points and validate Fibonacci levels to confirm the pattern. We then visualize the pattern on the chart and automatically execute trades when confirmed.

Creating an Indicator with Graphical Control Options
Those who are familiar with market sentiments, know the MACD indicator (its full name is Moving Average Convergence/Divergence) - the powerful tool for analyzing the price movement, used by traders from the very first moments of appearance of the computer analysis methods. In this article we'll consider possible modifications of MACD and implement them in one indicator with the possibility to graphically switch between the modifications.

Statistical Carry Trade Strategy
An algorithm of statistical protection of open positive swap positions from unwanted price movements. This article features a variant of the carry trade protection strategy that allows to compensate for potential risk of the price movement in the direction opposite to that of the open position.

Developing a trading Expert Advisor from scratch (Part 7): Adding Volume at Price (I)
This is one of the most powerful indicators currently existing. Anyone who trades trying to have a certain degree of confidence must have this indicator on their chart. Most often the indicator is used by those who prefer “tape reading” while trading. Also, this indicator can be utilized by those who use only Price Action while trading.

Visualizing trading strategy optimization in MetaTrader 5
The article implements an MQL application with a graphical interface for extended visualization of the optimization process. The graphical interface applies the last version of EasyAndFast library. Many users may ask why they need graphical interfaces in MQL applications. This article demonstrates one of multiple cases where they can be useful for traders.

Neural networks made easy (Part 8): Attention mechanisms
In previous articles, we have already tested various options for organizing neural networks. We also considered convolutional networks borrowed from image processing algorithms. In this article, I suggest considering Attention Mechanisms, the appearance of which gave impetus to the development of language models.
Library for easy and quick development of MetaTrader programs (part XII): Account object class and collection of account objects
In the previous article, we defined position closure events for MQL4 in the library and got rid of the unused order properties. Here we will consider the creation of the Account object, develop the collection of account objects and prepare the functionality for tracking account events.

MQL5 Cookbook: ОСО Orders
Any trader's trading activity involves various mechanisms and interrelationships including relations among orders. This article suggests a solution of OCO orders processing. Standard library classes are extensively involved, as well as new data types are created herein.

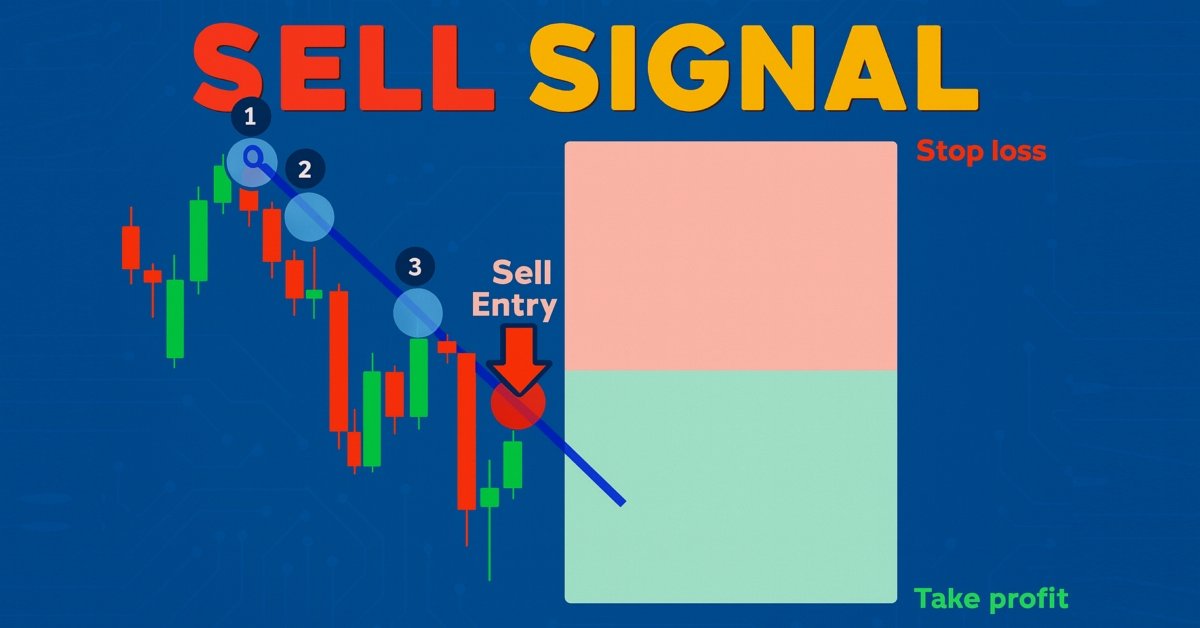
Price Action Analysis Toolkit Development (Part 44): Building a VWMA Crossover Signal EA in MQL5
This article introduces a VWMA crossover signal tool for MetaTrader 5, designed to help traders identify potential bullish and bearish reversals by combining price action with trading volume. The EA generates clear buy and sell signals directly on the chart, features an informative panel, and allows for full user customization, making it a practical addition to your trading strategy.

Learn how to design a trading system by VIDYA
Welcome to a new article from our series about learning how to design a trading system by the most popular technical indicators, in this article we will learn about a new technical tool and learn how to design a trading system by Variable Index Dynamic Average (VIDYA).

Getting Rid of Self-Made DLLs
If MQL5 language functional is not enough for fulfilling tasks, an MQL5 programmer has to use additional tools. He\she has to pass to another programming language and create an intermediate DLL. MQL5 has the possibility to present various data types and transfer them to API but, unfortunately, MQL5 cannot solve the issue concerning data extraction from the accepted pointer. In this article we will dot all the "i"s and show simple mechanisms of exchanging and working with complex data types.

Graphical Interfaces X: Time control, List of checkboxes control and table sorting (build 6)
Development of the library for creating graphical interfaces continues. The Time and List of checkboxes controls will be covered this time. In addition, the CTable class now provides the ability to sort data in ascending or descending order.

Applying OLAP in trading (part 2): Visualizing the interactive multidimensional data analysis results
In this article, we consider the creation of an interactive graphical interface for an MQL program, which is designed for the processing of account history and trading reports using OLAP techniques. To obtain a visual result, we will use maximizable and scalable windows, an adaptive layout of rubber controls and a new control for displaying diagrams. To provide the visualization functionality, we will implement a GUI with the selection of variables along coordinate axes, as well as with the selection of aggregate functions, diagram types and sorting options.

Risk Evaluation in the Sequence of Deals with One Asset
This article describes the use of methods of the theory of probability and mathematical statistics in the analysis of trading systems.

Price Action Analysis Toolkit Development (Part 53): Pattern Density Heatmap for Support and Resistance Zone Discovery
This article introduces the Pattern Density Heatmap, a price‑action mapping tool that transforms repeated candlestick pattern detections into statistically significant support and resistance zones. Rather than treating each signal in isolation, the EA aggregates detections into fixed price bins, scores their density with optional recency weighting, and confirms levels against higher‑timeframe data. The resulting heatmap reveals where the market has historically reacted—levels that can be used proactively for trade timing, risk management, and strategy confidence across any trading style.

How to Add New UI Languages to the MetaTrader 5 Platform
User interface of the MetaTrader 5 platform is translated into several languages. Don't worry if your native language is not among the supported ones. You can easily complete the translation using the special MetaTrader 5 MultiLanguage Pack utility, offered by MetaQuotes Software Corp. for free to all comers. In this article we will show some examples of how to add a new user interface languages to the MetaTrader 5 platform.

Building AI-Powered Trading Systems in MQL5 (Part 7): Further Modularization and Automated Trading
In this article, we enhance the AI-powered trading system's modularity by separating UI components into a dedicated include file. The system now automates trade execution based on AI-generated signals, parsing JSON responses for BUY/SELL/NONE with entry/SL/TP, visualizing patterns like engulfing or divergences on charts with arrows, lines, and labels, and optional auto-signal checks on new bars.

Improve Your Trading Charts With Interactive GUI's in MQL5 (Part III): Simple Movable Trading GUI
Join us in Part III of the "Improve Your Trading Charts With Interactive GUIs in MQL5" series as we explore the integration of interactive GUIs into movable trading dashboards in MQL5. This article builds on the foundations set in Parts I and II, guiding readers to transform static trading dashboards into dynamic, movable ones.

Learn how to design a trading system by Parabolic SAR
In this article, we will continue our series about how to design a trading system using the most popular indicators. In this article, we will learn about the Parabolic SAR indicator in detail and how we can design a trading system to be used in MetaTrader 5 using some simple strategies.
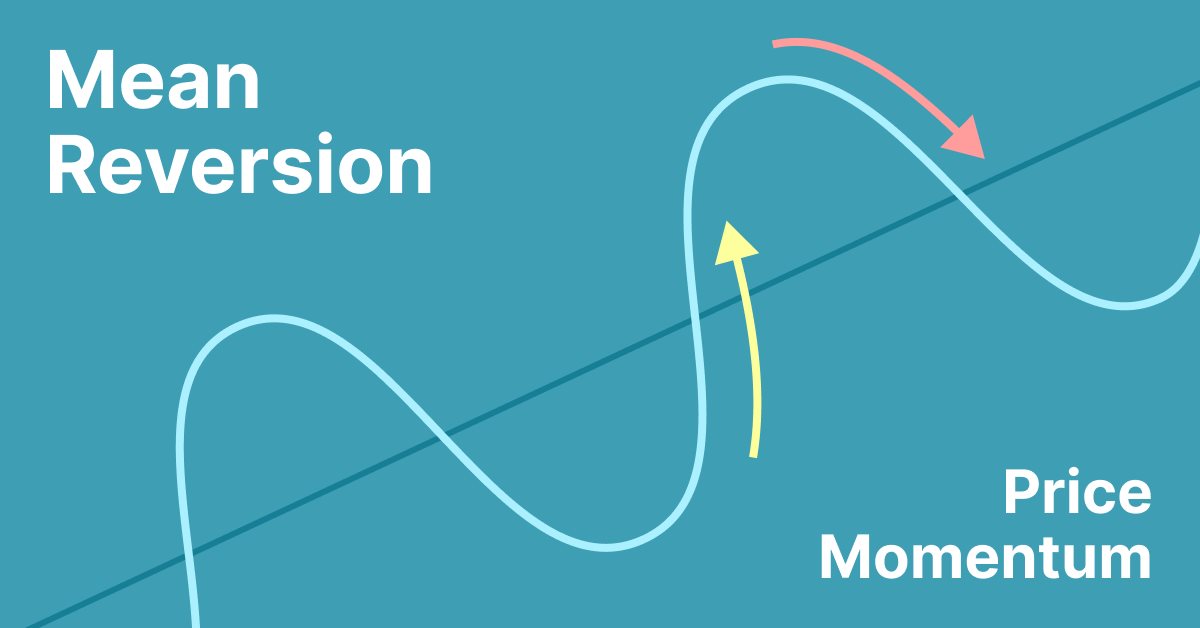
Simple Mean Reversion Trading Strategy
Mean reversion is a type of contrarian trading where the trader expects the price to return to some form of equilibrium which is generally measured by a mean or another central tendency statistic.

Testing Performance of Moving Averages Calculation in MQL5
A number of indicators have appeared since the time of first Moving Average indicator creation. Many of them use the similar smoothing methods, but the performances of different moving averages algorithms have not been studied. In this article, we will consider possible ways of use the Moving Averages in MQL5 and compare their performance.

Cross-Platform Expert Advisor: Stops
This article discusses an implementation of stop levels in an expert advisor in order to make it compatible with the two platforms MetaTrader 4 and MetaTrader 5.
MQL5 Cookbook: Developing a Multi-Currency Expert Advisor with Unlimited Number of Parameters
In this article, we will create a pattern that uses a single set of parameters for optimization of a trading system, while allowing for unlimited number of parameters. The list of symbols will be created in a standard text file (*.txt). Input parameters for each symbol will also be stored in files. This way we will be able to circumvent the restriction of the terminal on the number of input parameters of an Expert Advisor.

Horizontal diagrams on MеtaTrader 5 charts
Horizontal diagrams are not a common occurrence on the terminal charts but they can still be of use in a number of tasks, for example when developing indicators displaying volume or price distribution for a certain period, when creating various market depth versions, etc. The article considers constructing and managing horizontal diagrams as arrays of graphical primitives.