
Ready-made templates for including indicators to Expert Advisors (Part 3): Trend indicators

Contents
- Introduction
- Adaptive Moving Average
- Average Directional Movement Index
- Average Directional Movement Index Wilder
- Bollinger Bands®
- Double Exponential Moving Average
- Envelopes
- Fractal Adaptive Moving Average
- Ichimoku Kinko Hyo
- Moving Average
- Parabolic SAR Setting
- Standard Deviation
- Triple Exponential Moving Average
- Variable Index Dynamic Average
- Conclusion
Introduction
The article continues the topic of ready-made templates for using indicators in EAs. We have already considered the templates for connecting oscillators and volume and Bill Williams' indicators to EAs.
Here we will look at connecting to EAs and using trend indicators. As in the previous articles, we will display the data received from indicators on the dashboard created in the first article of this series.
The article will not differ in any way from the previous ones in terms of presentation - a brief background overview of each trend indicator and concise codes for connecting and using indicators in EAs.
The article will present ready-made templates for use in custom programs for each indicator:
- Input and global variables.
- Initializing variables and creating an indicator handle.
- Deinitialization.
- Receiving data in the EA from the indicator.
- An example of displaying the obtained data on the dashboard.
The article allows using the codes as Copy-Paste.
Adaptive Moving Average
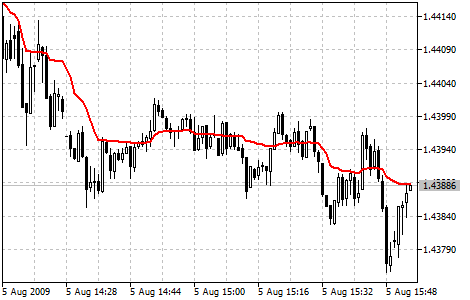
Adaptive Moving Average (AMA) technical indicator is used for constructing a moving average with low sensitivity to price series noises and is characterized by the minimal lag for trend detection. This indicator was developed and described by Perry Kaufman in his book "Smarter Trading".
One of disadvantages of different smoothing algorithms for price series is that accidental price leaps can result in the appearance of false trend signals. On the other hand, smoothing leads to the unavoidable lag of a signal about trend stop or change. This indicator was developed for eliminating these two disadvantages.
Parameters
iAMA() function is used to create the indicator handle:
Return the handle of the Adaptive Moving Average indicator. Only one buffer.
int  iAMA(
   string              symbol,             // symbol name
   ENUM_TIMEFRAMES     period,             // period
   int                 ama_period,         // AMA period
   int                 fast_ma_period,     // fast Moving Average period
   int                 slow_ma_period,     // slow Moving Average period
   int                 ama_shift,          // horizontal shift of the indicator
   ENUM_APPLIED_PRICE  applied_price       // price type or handle
   );
symbol
[in] The symbol name of the financial instrument whose data is to be used to calculate the indicator. NULL means the current symbol.
period
[in] The period value can be one of the ENUM_TIMEFRAMES enumeration values, 0 means the current timeframe.
ama_period
[in] Period for calculation of the efficiency rate.
fast_ma_period
[in] Fast period for calculation of the smoothing rate when the market moves fast.
slow_ma_period
[in] Slow period for calculation of the smoothing rate when there is no trend.
ama_shift
[in] Shift of the indicator in relation to the price chart.
applied_price
[in] Applied price. Any of the ENUM_APPLIED_PRICE price constants or another indicator handle.
Return the handle of the specified technical indicator. If failed, return INVALID_HANDLE. To free up computer memory from an unused indicator, use IndicatorRelease() the indicator handle is passed to.
Declare input and global variables in the EA to create the indicator:
//+------------------------------------------------------------------+
//|                                                 TestTrendAMA.mq5 |
//|                                  Copyright 2023, MetaQuotes Ltd. |
//|                                             https://www.mql5.com |
//+------------------------------------------------------------------+
#property copyright "Copyright 2023, MetaQuotes Ltd."
#property link      "https://www.mql5.com"
#property version   "1.00"
//--- enums
enum ENUM_LINE_STATE
  {
   LINE_STATE_NONE,        // Undefined state
   LINE_STATE_UP,          // Upward
   LINE_STATE_DOWN,        // Downward
   LINE_STATE_TURN_UP,     // Upward reversal
   LINE_STATE_TURN_DOWN,   // Downward reversal
   LINE_STATE_STOP_UP,     // Upward stop
   LINE_STATE_STOP_DOWN,   // Downward stop
   LINE_STATE_ABOVE,       // Above value
   LINE_STATE_UNDER,       // Below value
   LINE_STATE_CROSS_UP,    // Crossing value upwards
   LINE_STATE_CROSS_DOWN,  // Crossing value downwards
   LINE_STATE_TOUCH_BELOW, // Touching value from below
   LINE_STATE_TOUCH_ABOVE, // Touch value from above
   LINE_STATE_EQUALS,      // Equal to value
  };
//--- input parameters
input uint                 InpPeriod      =  9;             /* Period         */
input uint                 InpPeriodFast  =  2;             /* Fast EMA Period*/
input uint                 InpPeriodSlow  =  30;            /* Slow EMA Period*/
input int                  InpShift       =  0;             /* AMA Shift      */
input ENUM_APPLIED_PRICE   InpPrice       =  PRICE_CLOSE;   /* Applied Price  */
//--- global variables
int      handle=INVALID_HANDLE;  // Indicator handle
int      period=0;               // AMA calculation period
int      period_fast=0;          // Fast EMA calculation period
int      period_slow=0;          // Slow EMA calculation period
int      ind_digits=0;           // Number of decimal places in the indicator values
string   ind_title;              // Indicator description
The ENUM_LINE_STATE enumeration was created to simplify obtaining the state of an indicator line - its shape and location relative to the line of another indicator or any level.
Find out more about the enumeration in the article about oscillators in the ATR indicator parameters section.
When using the dashboard in the EA, declare global variables and include the panel class file:
//+------------------------------------------------------------------+
//|                                                 TestTrendAMA.mq5 |
//|                                  Copyright 2023, MetaQuotes Ltd. |
//|                                             https://www.mql5.com |
//+------------------------------------------------------------------+
#property copyright "Copyright 2023, MetaQuotes Ltd."
#property link      "https://www.mql5.com"
#property version   "1.00"
//--- includes
#include <Dashboard\Dashboard.mqh>
//--- enums
enum ENUM_LINE_STATE
  {
   LINE_STATE_NONE,        // Undefined state
   LINE_STATE_UP,          // Upward
   LINE_STATE_DOWN,        // Downward
   LINE_STATE_TURN_UP,     // Upward reversal
   LINE_STATE_TURN_DOWN,   // Downward reversal
   LINE_STATE_STOP_UP,     // Upward stop
   LINE_STATE_STOP_DOWN,   // Downward stop
   LINE_STATE_ABOVE,       // Above value
   LINE_STATE_UNDER,       // Below value
   LINE_STATE_CROSS_UP,    // Crossing value upwards
   LINE_STATE_CROSS_DOWN,  // Crossing value downwards
   LINE_STATE_TOUCH_BELOW, // Touching value from below
   LINE_STATE_TOUCH_ABOVE, // Touch value from above
   LINE_STATE_EQUALS,      // Equal to value
  };
//--- input parameters
input uint                 InpPeriod      =  9;             /* Period         */
input uint                 InpPeriodFast  =  2;             /* Fast EMA Period*/
input uint                 InpPeriodSlow  =  30;            /* Slow EMA Period*/
input int                  InpShift       =  0;             /* AMA Shift      */
input ENUM_APPLIED_PRICE   InpPrice       =  PRICE_CLOSE;   /* Applied Price  */
//--- global variables
int      handle=INVALID_HANDLE;  // Indicator handle
int      period=0;               // AMA calculation period
int      period_fast=0;          // Fast EMA calculation period
int      period_slow=0;          // Slow EMA calculation period
int      ind_digits=0;           // Number of decimal places in the indicator values
string   ind_title;              // Indicator description
//--- variables for the panel
int      mouse_bar_index;        // Index of the bar the data is taken from
CDashboard *panel=NULL;          // Pointer to the panel object
Initialization
Setting the values of global variables for the indicator and creating its handle:
//+------------------------------------------------------------------+
//| Expert initialization function                                   |
//+------------------------------------------------------------------+
int OnInit()
  {
//--- create timer
   EventSetTimer(60);

//--- Indicator
//--- Set and adjust the calculation period and levels if necessary
   period=int(InpPeriod<1 ? 9 : InpPeriod);
   period_fast=int(InpPeriodFast<1 ? 2 : InpPeriodFast);
   period_slow=int(InpPeriodSlow<1 ? 30 : InpPeriodSlow);
//--- Set the indicator name and the number of decimal places
   ind_title=StringFormat("AMA(%lu,%lu,%lu)",period,period_fast,period_slow);
   ind_digits=Digits()+1;
//--- Create indicator handle
   ResetLastError();
   handle=iAMA(Symbol(),PERIOD_CURRENT,period,period_fast,period_slow,InpShift,InpPrice);
   if(handle==INVALID_HANDLE)
     {
      PrintFormat("%s: Failed to create indicator handle %s. Error %ld",__FUNCTION__,ind_title,GetLastError());
      return INIT_FAILED;
     }

//--- Successful initialization
   return(INIT_SUCCEEDED);
  }
If the EA involves using the dashboard, we should create it:
//+------------------------------------------------------------------+
//| Expert initialization function                                   |
//+------------------------------------------------------------------+
int OnInit()
  {
//--- create timer
   EventSetTimer(60);

//--- Indicator
//--- Set and adjust the calculation period and levels if necessary
   period=int(InpPeriod<1 ? 9 : InpPeriod);
   period_fast=int(InpPeriodFast<1 ? 2 : InpPeriodFast);
   period_slow=int(InpPeriodSlow<1 ? 30 : InpPeriodSlow);
//--- Set the indicator name and the number of decimal places
   ind_title=StringFormat("AMA(%lu,%lu,%lu)",period,period_fast,period_slow);
   ind_digits=Digits()+1;
//--- Create indicator handle
   ResetLastError();
   handle=iAMA(Symbol(),PERIOD_CURRENT,period,period_fast,period_slow,InpShift,InpPrice);
   if(handle==INVALID_HANDLE)
     {
      PrintFormat("%s: Failed to create indicator handle %s. Error %ld",__FUNCTION__,ind_title,GetLastError());
      return INIT_FAILED;
     }

//--- Dashboard
//--- Create the panel
   panel=new CDashboard(1,20,20,197,225);
   if(panel==NULL)
     {
      Print("Error. Failed to create panel object");
      return INIT_FAILED;
     }
//--- Set font parameters
   panel.SetFontParams("Calibri",9);
//--- Display the panel with the "Symbol, Timeframe description" header text
   panel.View(Symbol()+", "+StringSubstr(EnumToString(Period()),7));
//--- Create a table with ID 0 to display bar data in it
   panel.CreateNewTable(0);
//--- Draw a table with ID 0 on the panel background
   panel.DrawGrid(0,2,20,6,2,18,96);

//--- Create a table with ID 1 to display indicator data in it
   panel.CreateNewTable(1);
//--- Get the Y2 table coordinate with ID 0 and
//--- set the Y1 coordinate for the table with ID 1
   int y1=panel.TableY2(0)+22;
//--- Draw a table with ID 1 on the panel background
   panel.DrawGrid(1,2,y1,3,2,18,96);

//--- Display tabular data in the journal
   panel.GridPrint(0,2);
   panel.GridPrint(1,2);
//--- Initialize the variable with the index of the mouse cursor bar
   mouse_bar_index=0;
//--- Display the data of the current bar on the panel
   DrawData(mouse_bar_index,TimeCurrent());

//--- Successful initialization
   return(INIT_SUCCEEDED);
  }
Deinitialization
Release the indicator handle in the EA OnDeinit() handle:
//+------------------------------------------------------------------+
//| Expert deinitialization function                                 |
//+------------------------------------------------------------------+
void OnDeinit(const int reason)
  {
//--- destroy timer
   EventKillTimer();

//--- Release handle of the indicator
   ResetLastError();
   if(!IndicatorRelease(handle))
      PrintFormat("%s: IndicatorRelease failed. Error %ld",__FUNCTION__,GetLastError());
//--- Clear all comments on the chart
   Comment("");
  }
The created dashboard object is removed when using the dashboard:
//+------------------------------------------------------------------+
//| Expert deinitialization function                                 |
//+------------------------------------------------------------------+
void OnDeinit(const int reason)
  {
//--- destroy timer
   EventKillTimer();

//--- Release handle of the indicator
   ResetLastError();
   if(!IndicatorRelease(handle))
      PrintFormat("%s: IndicatorRelease failed. Error %ld",__FUNCTION__,GetLastError());
//--- Clear all comments on the chart
   Comment("");

//--- If the panel object exists, delete it
   if(panel!=NULL)
      delete panel;
  }
Data retrieval
General functions for obtaining data by the indicator handle are provided below. The functions have been reviewed in the article about connecting oscillators to EAs. The presented functions can be used "as is" in custom programs:
//+------------------------------------------------------------------+
//| Return the indicator data on the specified bar                   |
//+------------------------------------------------------------------+
double IndicatorValue(const int ind_handle,const int index,const int buffer_num)
  {
   double array[1]={0};
   ResetLastError();
   if(CopyBuffer(ind_handle,buffer_num,index,1,array)!=1)
     {
      PrintFormat("%s: CopyBuffer failed. Error %ld",__FUNCTION__,GetLastError());
      return EMPTY_VALUE;
     }
   return array[0];
  }
//+------------------------------------------------------------------+
//| Return the state of the indicator line                           |
//+------------------------------------------------------------------+
ENUM_LINE_STATE LineState(const int ind_handle,const int index,const int buffer_num)
  {
//--- Get the values of the indicator line with the shift (0,1,2) relative to the passed index
   const double value0=IndicatorValue(ind_handle,index,  buffer_num);
   const double value1=IndicatorValue(ind_handle,index+1,buffer_num);
   const double value2=IndicatorValue(ind_handle,index+2,buffer_num);
//--- If at least one of the values could not be obtained, return an undefined value
   if(value0==EMPTY_VALUE || value1==EMPTY_VALUE || value2==EMPTY_VALUE)
      return LINE_STATE_NONE;
//--- Line upward reversal (value2>value1 && value0>value1)
   if(NormalizeDouble(value2-value1,ind_digits)>0 && NormalizeDouble(value0-value1,ind_digits)>0)
      return LINE_STATE_TURN_UP;
//--- Line upward direction (value2<=value1 && value0>value1)
   else if(NormalizeDouble(value2-value1,ind_digits)<=0 && NormalizeDouble(value0-value1,ind_digits)>0)
      return LINE_STATE_UP;
//--- Line upward stop (value2<=value1 && value0==value1)
   else if(NormalizeDouble(value2-value1,ind_digits)<=0 && NormalizeDouble(value0-value1,ind_digits)==0)
      return LINE_STATE_STOP_UP;
//--- Line downward reversal (value2<value1 && value0<value1)
   if(NormalizeDouble(value2-value1,ind_digits)<0 && NormalizeDouble(value0-value1,ind_digits)<0)
      return LINE_STATE_TURN_DOWN;
//--- Line downward direction (value2>=value1 && value0<value1)
   else if(NormalizeDouble(value2-value1,ind_digits)>=0 && NormalizeDouble(value0-value1,ind_digits)<0)
      return LINE_STATE_DOWN;
//--- Line downward stop (value2>=value1 && value0==value1)
   else if(NormalizeDouble(value2-value1,ind_digits)>=0 && NormalizeDouble(value0-value1,ind_digits)==0)
      return LINE_STATE_STOP_DOWN;
//--- Undefined state
   return LINE_STATE_NONE;
  }
//+------------------------------------------------------------------+
//| Return the state of the line relative to the specified level     |
//+------------------------------------------------------------------+
ENUM_LINE_STATE LineStateRelative(const int ind_handle,const int index,const int buffer_num,const double level0,const double level1=EMPTY_VALUE)
  {
//--- Get the values of the indicator line with the shift (0,1) relative to the passed index
   const double value0=IndicatorValue(ind_handle,index,  buffer_num);
   const double value1=IndicatorValue(ind_handle,index+1,buffer_num);
//--- If at least one of the values could not be obtained, return an undefined value
   if(value0==EMPTY_VALUE || value1==EMPTY_VALUE)
      return LINE_STATE_NONE;
//--- Define the second level to compare
   double level=(level1==EMPTY_VALUE ? level0 : level1);
//--- The line is below the level (value1<level && value0<level0)
   if(NormalizeDouble(value1-level,ind_digits)<0 && NormalizeDouble(value0-level0,ind_digits)<0)
      return LINE_STATE_UNDER;
//--- The line is above the level (value1>level && value0>level0)
   if(NormalizeDouble(value1-level,ind_digits)>0 && NormalizeDouble(value0-level0,ind_digits)>0)
      return LINE_STATE_ABOVE;
//--- The line crossed the level upwards (value1<=level && value0>level0)
   if(NormalizeDouble(value1-level,ind_digits)<=0 && NormalizeDouble(value0-level0,ind_digits)>0)
      return LINE_STATE_CROSS_UP;
//--- The line crossed the level downwards (value1>=level && value0<level0)
   if(NormalizeDouble(value1-level,ind_digits)>=0 && NormalizeDouble(value0-level0,ind_digits)<0)
      return LINE_STATE_CROSS_DOWN;
//--- The line touched the level from below (value1<level0 && value0==level0)
   if(NormalizeDouble(value1-level,ind_digits)<0 && NormalizeDouble(value0-level0,ind_digits)==0)
      return LINE_STATE_TOUCH_BELOW;
//--- The line touched the level from above (value1>level0 && value0==level0)
   if(NormalizeDouble(value1-level,ind_digits)>0 && NormalizeDouble(value0-level0,ind_digits)==0)
      return LINE_STATE_TOUCH_BELOW;
//--- Line is equal to the level value (value1==level0 && value0==level0)
   if(NormalizeDouble(value1-level,ind_digits)==0 && NormalizeDouble(value0-level0,ind_digits)==0)
      return LINE_STATE_EQUALS;
//--- Undefined state
   return LINE_STATE_NONE;
  }
//+------------------------------------------------------------------+
//| Return the indicator line state description                      |
//+------------------------------------------------------------------+
string LineStateDescription(const ENUM_LINE_STATE state)
  {
   switch(state)
     {
      case LINE_STATE_UP         :  return "Up";
      case LINE_STATE_STOP_UP    :  return "Stop Up";
      case LINE_STATE_TURN_UP    :  return "Turn Up";
      case LINE_STATE_DOWN       :  return "Down";
      case LINE_STATE_STOP_DOWN  :  return "Stop Down";
      case LINE_STATE_TURN_DOWN  :  return "Turn Down";
      case LINE_STATE_ABOVE      :  return "Above level";
      case LINE_STATE_UNDER      :  return "Under level";
      case LINE_STATE_CROSS_UP   :  return "Crossing Up";
      case LINE_STATE_CROSS_DOWN :  return "Crossing Down";
      case LINE_STATE_TOUCH_BELOW:  return "Touch from Below";
      case LINE_STATE_TOUCH_ABOVE:  return "Touch from Above";
      case LINE_STATE_EQUALS     :  return "Equals";
      default                    :  return "Unknown";
     }
  }
When using the dashboard, data is displayed on the panel using the function:
//+------------------------------------------------------------------+
//| Display data from the specified timeseries index to the panel    |
//+------------------------------------------------------------------+
void DrawData(const int index,const datetime time)
  {
//--- Declare the variables to receive data in them
   MqlTick  tick={0};
   MqlRates rates[1];

//--- Exit if unable to get the current prices
   if(!SymbolInfoTick(Symbol(),tick))
      return;
//--- Exit if unable to get the bar data by the specified index
   if(CopyRates(Symbol(),PERIOD_CURRENT,index,1,rates)!=1)
      return;

//--- Set font parameters for bar and indicator data headers
   int  size=0;
   uint flags=0;
   uint angle=0;
   string name=panel.FontParams(size,flags,angle);
   panel.SetFontParams(name,9,FW_BOLD);
   panel.DrawText("Bar data ["+(string)index+"]",3,panel.TableY1(0)-16,clrMaroon,panel.Width()-6);
   panel.DrawText("Indicator data ["+(string)index+"]",3,panel.TableY1(1)-16,clrGreen,panel.Width()-6);
//--- Set font parameters for bar and indicator data
   panel.SetFontParams(name,9);

//--- Display the data of the specified bar in table 0 on the panel
   panel.DrawText("Date",  panel.CellX(0,0,0)+2, panel.CellY(0,0,0)+2); panel.DrawText(TimeToString(  rates[0].time,TIME_DATE),     panel.CellX(0,0,1)+2, panel.CellY(0,0,1)+2,clrNONE,90);
   panel.DrawText("Time",  panel.CellX(0,1,0)+2, panel.CellY(0,1,0)+2); panel.DrawText(TimeToString(  rates[0].time,TIME_MINUTES),  panel.CellX(0,1,1)+2, panel.CellY(0,1,1)+2,clrNONE,90);
   panel.DrawText("Open",  panel.CellX(0,2,0)+2, panel.CellY(0,2,0)+2); panel.DrawText(DoubleToString(rates[0].open,Digits()),      panel.CellX(0,2,1)+2, panel.CellY(0,2,1)+2,clrNONE,90);
   panel.DrawText("High",  panel.CellX(0,3,0)+2, panel.CellY(0,3,0)+2); panel.DrawText(DoubleToString(rates[0].high,Digits()),      panel.CellX(0,3,1)+2, panel.CellY(0,3,1)+2,clrNONE,90);
   panel.DrawText("Low",   panel.CellX(0,4,0)+2, panel.CellY(0,4,0)+2); panel.DrawText(DoubleToString(rates[0].low,Digits()),       panel.CellX(0,4,1)+2, panel.CellY(0,4,1)+2,clrNONE,90);
   panel.DrawText("Close", panel.CellX(0,5,0)+2, panel.CellY(0,5,0)+2); panel.DrawText(DoubleToString(rates[0].close,Digits()),     panel.CellX(0,5,1)+2, panel.CellY(0,5,1)+2,clrNONE,90);

//--- Display the indicator data from the specified bar on the panel in table 1
   panel.DrawText(ind_title, panel.CellX(1,0,0)+2, panel.CellY(1,0,0)+2);
   double value=IndicatorValue(handle,index,0);
   string value_str=(value!=EMPTY_VALUE ? DoubleToString(value,ind_digits) : "");
   panel.DrawText(value_str,panel.CellX(1,0,1)+2,panel.CellY(1,0,1)+2,clrNONE,100);

//--- Display a description of the indicator line state
   panel.DrawText("Line state", panel.CellX(1,1,0)+2, panel.CellY(1,1,0)+2);
   ENUM_LINE_STATE state=LineState(handle,index,0);
   panel.DrawText(LineStateDescription(state),panel.CellX(1,1,1)+2,panel.CellY(1,1,1)+2,clrNONE,90);

//--- Redraw the chart to immediately display all changes on the panel
   ChartRedraw(ChartID());
  }
Besides, when using the dashboard, the panel events handler is called in the OnChartEvent() EA event handler, as well as the events for receiving the bar index under the cursor are handled:
//+------------------------------------------------------------------+
//| ChartEvent function                                              |
//+------------------------------------------------------------------+
void OnChartEvent(const int id,
                  const long &lparam,
                  const double &dparam,
                  const string &sparam)
  {
//--- Handling the panel
//--- Call the panel event handler
   panel.OnChartEvent(id,lparam,dparam,sparam);

//--- If the cursor moves or a click is made on the chart
   if(id==CHARTEVENT_MOUSE_MOVE || id==CHARTEVENT_CLICK)
     {
      //--- Declare the variables to record time and price coordinates in them
      datetime time=0;
      double price=0;
      int wnd=0;
      //--- If the cursor coordinates are converted to date and time
      if(ChartXYToTimePrice(ChartID(),(int)lparam,(int)dparam,wnd,time,price))
        {
         //--- write the bar index where the cursor is located to a global variable
         mouse_bar_index=iBarShift(Symbol(),PERIOD_CURRENT,time);
         //--- Display the bar data under the cursor on the panel
         DrawData(mouse_bar_index,time);
        }
     }

//--- If we received a custom event, display the appropriate message in the journal
   if(id>CHARTEVENT_CUSTOM)
     {
      //--- Here we can implement handling a click on the close button on the panel
      PrintFormat("%s: Event id=%ld, object id (lparam): %lu, event message (sparam): %s",__FUNCTION__,id,lparam,sparam);
     }
  }
After compiling the EA and launching it on the chart, we can monitor the state of the indicator value and line on the panel:
You can view the TestTrendAMA.mq5 test EA in the files attached to the article.
Average Directional Movement Index
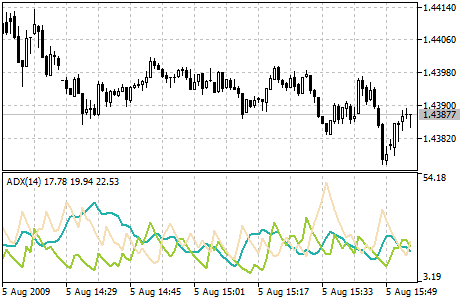
Average Directional Movement Index (ADX) helps to determine if there is a price trend. It was developed and described in detail by Welles Wilder in his book "New concepts in technical trading systems".
The simplest trading method based on the system of directional movement implies comparison of two direction indicators: the 14-period +DI one and the 14-period -DI. To do this, one either puts the charts of indicators one on top of the other, or +DI is subtracted from -DI. W. Wilder recommends buying when +DI is higher than -DI, and selling when +DI sinks lower than -DI.
To these simple trading rules, Wells Wilder added "a rule of points of extremum". It is used to eliminate false signals and decrease the number of deals. According to the principle of points of extremum, the "point of extremum" is the point when +DI and -DI cross each other. If +DI raises higher than -DI, this point will be the maximum price of the day when they cross. If +DI is lower than -DI, this point will be the minimum price of the day they cross.
The point of extremum is used then as the market entry level. Thus, after the signal to buy (+DI is higher than -DI) one must wait till the price has exceeded the point of extremum, and only then buy. However, if the price fails to exceed the level of the point of extremum, one should retain the short position.
Parameters
iADX() function is used to create the indicator handle:
Return Average Directional Movement Index indicator handle.
int  iADX(
   string           symbol,         // symbol name
   ENUM_TIMEFRAMES  period,         // period
   int              adx_period      // averaging period
   );
symbol
[in] The symbol name of the financial instrument whose data is to be used to calculate the indicator. NULL means the current symbol.
period
[in] The period value can be one of the ENUM_TIMEFRAMES enumeration values, 0 means the current timeframe.
adx_period
[in] Index calculation period.
Buffer indexes: 0 — MAIN_LINE, 1 — PLUSDI_LINE, 2 — MINUSDI_LINE.
Return the handle of the specified technical indicator. If failed, return INVALID_HANDLE. To free up computer memory from an unused indicator, use IndicatorRelease() the indicator handle is passed to.
Declare input and global variables in the EA to create the indicator:
//+------------------------------------------------------------------+
//|                                                 TestTrendADX.mq5 |
//|                                  Copyright 2023, MetaQuotes Ltd. |
//|                                             https://www.mql5.com |
//+------------------------------------------------------------------+
#property copyright "Copyright 2023, MetaQuotes Ltd."
#property link      "https://www.mql5.com"
#property version   "1.00"
//--- enums
enum ENUM_LINE_STATE
  {
   LINE_STATE_NONE,        // Undefined state
   LINE_STATE_UP,          // Upward
   LINE_STATE_DOWN,        // Downward
   LINE_STATE_TURN_UP,     // Upward reversal
   LINE_STATE_TURN_DOWN,   // Downward reversal
   LINE_STATE_STOP_UP,     // Upward stop
   LINE_STATE_STOP_DOWN,   // Downward stop
   LINE_STATE_ABOVE,       // Above value
   LINE_STATE_UNDER,       // Below value
   LINE_STATE_CROSS_UP,    // Crossing value upwards
   LINE_STATE_CROSS_DOWN,  // Crossing value downwards
   LINE_STATE_TOUCH_BELOW, // Touching value from below
   LINE_STATE_TOUCH_ABOVE, // Touch value from above
   LINE_STATE_EQUALS,      // Equal to value
  };
//--- input parameters
input uint  InpPeriod   =  14;   /* Period   */
//--- global variables
int      handle=INVALID_HANDLE;  // Indicator handle
int      period=0;               // ADX calculation period
int      ind_digits=0;           // Number of decimal places in the indicator values
string   ind_title;              // Indicator description
When using the dashboard in the EA, declare global variables and include the panel class file:
//+------------------------------------------------------------------+
//|                                                 TestTrendADX.mq5 |
//|                                  Copyright 2023, MetaQuotes Ltd. |
//|                                             https://www.mql5.com |
//+------------------------------------------------------------------+
#property copyright "Copyright 2023, MetaQuotes Ltd."
#property link      "https://www.mql5.com"
#property version   "1.00"
//--- includes
#include <Dashboard\Dashboard.mqh>
//--- enums
enum ENUM_LINE_STATE
  {
   LINE_STATE_NONE,        // Undefined state
   LINE_STATE_UP,          // Upward
   LINE_STATE_DOWN,        // Downward
   LINE_STATE_TURN_UP,     // Upward reversal
   LINE_STATE_TURN_DOWN,   // Downward reversal
   LINE_STATE_STOP_UP,     // Upward stop
   LINE_STATE_STOP_DOWN,   // Downward stop
   LINE_STATE_ABOVE,       // Above value
   LINE_STATE_UNDER,       // Below value
   LINE_STATE_CROSS_UP,    // Crossing value upwards
   LINE_STATE_CROSS_DOWN,  // Crossing value downwards
   LINE_STATE_TOUCH_BELOW, // Touching value from below
   LINE_STATE_TOUCH_ABOVE, // Touch value from above
   LINE_STATE_EQUALS,      // Equal to value
  };
//--- input parameters
input uint  InpPeriod   =  14;   /* Period   */
//--- global variables
int      handle=INVALID_HANDLE;  // Indicator handle
int      period=0;               // ADX calculation period
int      ind_digits=0;           // Number of decimal places in the indicator values
string   ind_title;              // Indicator description
//--- variables for the panel
int      mouse_bar_index;        // Index of the bar the data is taken from
CDashboard *panel=NULL;          // Pointer to the panel object
Initialization
Setting the values of global variables for the indicator and creating its handle:
//+------------------------------------------------------------------+
//| Expert initialization function                                   |
//+------------------------------------------------------------------+
int OnInit()
  {
//--- create timer
   EventSetTimer(60);

//--- Indicator
//--- Set and adjust the calculation period and levels if necessary
   period=int(InpPeriod<1 ? 14 : InpPeriod);
//--- Set the indicator name and the number of decimal places
   ind_title=StringFormat("ADX(%lu)",period);
   ind_digits=2;
//--- Create indicator handle
   ResetLastError();
   handle=iADX(Symbol(),PERIOD_CURRENT,period);
   if(handle==INVALID_HANDLE)
     {
      PrintFormat("%s: Failed to create indicator handle %s. Error %ld",__FUNCTION__,ind_title,GetLastError());
      return INIT_FAILED;
     }

//--- Successful initialization
   return(INIT_SUCCEEDED);
  }
If the EA involves using the dashboard, we should create it:
//+------------------------------------------------------------------+
//| Expert initialization function                                   |
//+------------------------------------------------------------------+
int OnInit()
  {
//--- create timer
   EventSetTimer(60);

//--- Indicator
//--- Set and adjust the calculation period and levels if necessary
   period=int(InpPeriod<1 ? 14 : InpPeriod);
//--- Set the indicator name and the number of decimal places
   ind_title=StringFormat("ADX(%lu)",period);
   ind_digits=2;
//--- Create indicator handle
   ResetLastError();
   handle=iADX(Symbol(),PERIOD_CURRENT,period);
   if(handle==INVALID_HANDLE)
     {
      PrintFormat("%s: Failed to create indicator handle %s. Error %ld",__FUNCTION__,ind_title,GetLastError());
      return INIT_FAILED;
     }

//--- Dashboard
//--- Create the panel
   panel=new CDashboard(1,20,20,197,243);
   if(panel==NULL)
     {
      Print("Error. Failed to create panel object");
      return INIT_FAILED;
     }
//--- Set font parameters
   panel.SetFontParams("Calibri",9);
//--- Display the panel with the "Symbol, Timeframe description" header text
   panel.View(Symbol()+", "+StringSubstr(EnumToString(Period()),7));
//--- Create a table with ID 0 to display bar data in it
   panel.CreateNewTable(0);
//--- Draw a table with ID 0 on the panel background
   panel.DrawGrid(0,2,20,6,2,18,96);

//--- Create a table with ID 1 to display indicator data in it
   panel.CreateNewTable(1);
//--- Get the Y2 table coordinate with ID 0 and
//--- set the Y1 coordinate for the table with ID 1
   int y1=panel.TableY2(0)+22;
//--- Draw a table with ID 1 on the panel background
   panel.DrawGrid(1,2,y1,4,2,18,96);

//--- Display tabular data in the journal
   panel.GridPrint(0,2);
   panel.GridPrint(1,2);
//--- Initialize the variable with the index of the mouse cursor bar
   mouse_bar_index=0;
//--- Display the data of the current bar on the panel
   DrawData(mouse_bar_index,TimeCurrent());

//--- Successful initialization
   return(INIT_SUCCEEDED);
  }
Deinitialization
Release the indicator handle in the EA OnDeinit() handle:
//+------------------------------------------------------------------+
//| Expert deinitialization function                                 |
//+------------------------------------------------------------------+
void OnDeinit(const int reason)
  {
//--- destroy timer
   EventKillTimer();

//--- Release handle of the indicator
   ResetLastError();
   if(!IndicatorRelease(handle))
      PrintFormat("%s: IndicatorRelease failed. Error %ld",__FUNCTION__,GetLastError());
//--- Clear all comments on the chart
   Comment("");
  }
The created dashboard object is removed when using the dashboard:
//+------------------------------------------------------------------+
//| Expert deinitialization function                                 |
//+------------------------------------------------------------------+
void OnDeinit(const int reason)
  {
//--- destroy timer
   EventKillTimer();

//--- Release handle of the indicator
   ResetLastError();
   if(!IndicatorRelease(handle))
      PrintFormat("%s: IndicatorRelease failed. Error %ld",__FUNCTION__,GetLastError());
//--- Clear all comments on the chart
   Comment("");

//--- If the panel object exists, delete it
   if(panel!=NULL)
      delete panel;
  }
Data retrieval
General functions for obtaining data by the indicator handle:
//+------------------------------------------------------------------+
//| Return the indicator data on the specified bar                   |
//+------------------------------------------------------------------+
double IndicatorValue(const int ind_handle,const int index,const int buffer_num)
  {
   double array[1]={0};
   ResetLastError();
   if(CopyBuffer(ind_handle,buffer_num,index,1,array)!=1)
     {
      PrintFormat("%s: CopyBuffer failed. Error %ld",__FUNCTION__,GetLastError());
      return EMPTY_VALUE;
     }
   return array[0];
  }
//+------------------------------------------------------------------+
//| Return the state of the indicator line                           |
//+------------------------------------------------------------------+
ENUM_LINE_STATE LineState(const int ind_handle,const int index,const int buffer_num)
  {
//--- Get the values of the indicator line with the shift (0,1,2) relative to the passed index
   const double value0=IndicatorValue(ind_handle,index,  buffer_num);
   const double value1=IndicatorValue(ind_handle,index+1,buffer_num);
   const double value2=IndicatorValue(ind_handle,index+2,buffer_num);
//--- If at least one of the values could not be obtained, return an undefined value
   if(value0==EMPTY_VALUE || value1==EMPTY_VALUE || value2==EMPTY_VALUE)
      return LINE_STATE_NONE;
//--- Line upward reversal (value2>value1 && value0>value1)
   if(NormalizeDouble(value2-value1,ind_digits)>0 && NormalizeDouble(value0-value1,ind_digits)>0)
      return LINE_STATE_TURN_UP;
//--- Line upward direction (value2<=value1 && value0>value1)
   else if(NormalizeDouble(value2-value1,ind_digits)<=0 && NormalizeDouble(value0-value1,ind_digits)>0)
      return LINE_STATE_UP;
//--- Line upward stop (value2<=value1 && value0==value1)
   else if(NormalizeDouble(value2-value1,ind_digits)<=0 && NormalizeDouble(value0-value1,ind_digits)==0)
      return LINE_STATE_STOP_UP;
//--- Line downward reversal (value2<value1 && value0<value1)
   if(NormalizeDouble(value2-value1,ind_digits)<0 && NormalizeDouble(value0-value1,ind_digits)<0)
      return LINE_STATE_TURN_DOWN;
//--- Line downward direction (value2>=value1 && value0<value1)
   else if(NormalizeDouble(value2-value1,ind_digits)>=0 && NormalizeDouble(value0-value1,ind_digits)<0)
      return LINE_STATE_DOWN;
//--- Line downward stop (value2>=value1 && value0==value1)
   else if(NormalizeDouble(value2-value1,ind_digits)>=0 && NormalizeDouble(value0-value1,ind_digits)==0)
      return LINE_STATE_STOP_DOWN;
//--- Undefined state
   return LINE_STATE_NONE;
  }
//+------------------------------------------------------------------+
//| Return the state of the line relative to the specified level     |
//+------------------------------------------------------------------+
ENUM_LINE_STATE LineStateRelative(const int ind_handle,const int index,const int buffer_num,const double level0,const double level1=EMPTY_VALUE)
  {
//--- Get the values of the indicator line with the shift (0,1) relative to the passed index
   const double value0=IndicatorValue(ind_handle,index,  buffer_num);
   const double value1=IndicatorValue(ind_handle,index+1,buffer_num);
//--- If at least one of the values could not be obtained, return an undefined value
   if(value0==EMPTY_VALUE || value1==EMPTY_VALUE)
      return LINE_STATE_NONE;
//--- Define the second level to compare
   double level=(level1==EMPTY_VALUE ? level0 : level1);
//--- The line is below the level (value1<level && value0<level0)
   if(NormalizeDouble(value1-level,ind_digits)<0 && NormalizeDouble(value0-level0,ind_digits)<0)
      return LINE_STATE_UNDER;
//--- The line is above the level (value1>level && value0>level0)
   if(NormalizeDouble(value1-level,ind_digits)>0 && NormalizeDouble(value0-level0,ind_digits)>0)
      return LINE_STATE_ABOVE;
//--- The line crossed the level upwards (value1<=level && value0>level0)
   if(NormalizeDouble(value1-level,ind_digits)<=0 && NormalizeDouble(value0-level0,ind_digits)>0)
      return LINE_STATE_CROSS_UP;
//--- The line crossed the level downwards (value1>=level && value0<level0)
   if(NormalizeDouble(value1-level,ind_digits)>=0 && NormalizeDouble(value0-level0,ind_digits)<0)
      return LINE_STATE_CROSS_DOWN;
//--- The line touched the level from below (value1<level0 && value0==level0)
   if(NormalizeDouble(value1-level,ind_digits)<0 && NormalizeDouble(value0-level0,ind_digits)==0)
      return LINE_STATE_TOUCH_BELOW;
//--- The line touched the level from above (value1>level0 && value0==level0)
   if(NormalizeDouble(value1-level,ind_digits)>0 && NormalizeDouble(value0-level0,ind_digits)==0)
      return LINE_STATE_TOUCH_BELOW;
//--- Line is equal to the level value (value1==level0 && value0==level0)
   if(NormalizeDouble(value1-level,ind_digits)==0 && NormalizeDouble(value0-level0,ind_digits)==0)
      return LINE_STATE_EQUALS;
//--- Undefined state
   return LINE_STATE_NONE;
  }
//+------------------------------------------------------------------+
//| Return the indicator line state description                      |
//+------------------------------------------------------------------+
string LineStateDescription(const ENUM_LINE_STATE state)
  {
   switch(state)
     {
      case LINE_STATE_UP         :  return "Up";
      case LINE_STATE_STOP_UP    :  return "Stop Up";
      case LINE_STATE_TURN_UP    :  return "Turn Up";
      case LINE_STATE_DOWN       :  return "Down";
      case LINE_STATE_STOP_DOWN  :  return "Stop Down";
      case LINE_STATE_TURN_DOWN  :  return "Turn Down";
      case LINE_STATE_ABOVE      :  return "Above level";
      case LINE_STATE_UNDER      :  return "Under level";
      case LINE_STATE_CROSS_UP   :  return "Crossing Up";
      case LINE_STATE_CROSS_DOWN :  return "Crossing Down";
      case LINE_STATE_TOUCH_BELOW:  return "Touch from Below";
      case LINE_STATE_TOUCH_ABOVE:  return "Touch from Above";
      case LINE_STATE_EQUALS     :  return "Equals";
      default                    :  return "Unknown";
     }
  }
When using the dashboard, data is displayed on the panel using the function:
//+------------------------------------------------------------------+
//| Display data from the specified timeseries index to the panel    |
//+------------------------------------------------------------------+
void DrawData(const int index,const datetime time)
  {
//--- Declare the variables to receive data in them
   MqlTick  tick={0};
   MqlRates rates[1];

//--- Exit if unable to get the current prices
   if(!SymbolInfoTick(Symbol(),tick))
      return;
//--- Exit if unable to get the bar data by the specified index
   if(CopyRates(Symbol(),PERIOD_CURRENT,index,1,rates)!=1)
      return;

//--- Set font parameters for bar and indicator data headers
   int  size=0;
   uint flags=0;
   uint angle=0;
   string name=panel.FontParams(size,flags,angle);
   panel.SetFontParams(name,9,FW_BOLD);
   panel.DrawText("Bar data ["+(string)index+"]",3,panel.TableY1(0)-16,clrMaroon,panel.Width()-6);
   panel.DrawText("Indicator data ["+(string)index+"]",3,panel.TableY1(1)-16,clrGreen,panel.Width()-6);
//--- Set font parameters for bar and indicator data
   panel.SetFontParams(name,9);

//--- Display the data of the specified bar in table 0 on the panel
   panel.DrawText("Date",  panel.CellX(0,0,0)+2, panel.CellY(0,0,0)+2); panel.DrawText(TimeToString(  rates[0].time,TIME_DATE),     panel.CellX(0,0,1)+2, panel.CellY(0,0,1)+2,clrNONE,90);
   panel.DrawText("Time",  panel.CellX(0,1,0)+2, panel.CellY(0,1,0)+2); panel.DrawText(TimeToString(  rates[0].time,TIME_MINUTES),  panel.CellX(0,1,1)+2, panel.CellY(0,1,1)+2,clrNONE,90);
   panel.DrawText("Open",  panel.CellX(0,2,0)+2, panel.CellY(0,2,0)+2); panel.DrawText(DoubleToString(rates[0].open,Digits()),      panel.CellX(0,2,1)+2, panel.CellY(0,2,1)+2,clrNONE,90);
   panel.DrawText("High",  panel.CellX(0,3,0)+2, panel.CellY(0,3,0)+2); panel.DrawText(DoubleToString(rates[0].high,Digits()),      panel.CellX(0,3,1)+2, panel.CellY(0,3,1)+2,clrNONE,90);
   panel.DrawText("Low",   panel.CellX(0,4,0)+2, panel.CellY(0,4,0)+2); panel.DrawText(DoubleToString(rates[0].low,Digits()),       panel.CellX(0,4,1)+2, panel.CellY(0,4,1)+2,clrNONE,90);
   panel.DrawText("Close", panel.CellX(0,5,0)+2, panel.CellY(0,5,0)+2); panel.DrawText(DoubleToString(rates[0].close,Digits()),     panel.CellX(0,5,1)+2, panel.CellY(0,5,1)+2,clrNONE,90);

//--- Display the ADX line data from the specified bar on the panel in table 1
   panel.DrawText(ind_title, panel.CellX(1,0,0)+2, panel.CellY(1,0,0)+2);
   double value=IndicatorValue(handle,index,MAIN_LINE);
   string value_str=(value!=EMPTY_VALUE ? DoubleToString(value,ind_digits) : "");
   panel.DrawText(value_str,panel.CellX(1,0,1)+2,panel.CellY(1,0,1)+2,clrNONE,100);

//--- Display the +DI line data from the specified bar on the panel in table 1
   panel.DrawText("+DI", panel.CellX(1,1,0)+2, panel.CellY(1,1,0)+2);
   double value_dip=IndicatorValue(handle,index,PLUSDI_LINE);
   string value_dip_str=(value_dip!=EMPTY_VALUE ? DoubleToString(value_dip,ind_digits) : "");
   panel.DrawText(value_dip_str,panel.CellX(1,1,1)+2,panel.CellY(1,1,1)+2,clrNONE,100);

//--- Display the -DI line data from the specified bar on the panel in table 1
   panel.DrawText("-DI", panel.CellX(1,2,0)+2, panel.CellY(1,2,0)+2);
   double value_dim=IndicatorValue(handle,index,MINUSDI_LINE);
   string value_dim_str=(value_dim!=EMPTY_VALUE ? DoubleToString(value_dim,ind_digits) : "");
   panel.DrawText(value_dim_str,panel.CellX(1,2,1)+2,panel.CellY(1,2,1)+2,clrNONE,100);

//--- Display a description of +DI and -DI lines ratio
   panel.DrawText("+DI vs -DI", panel.CellX(1,3,0)+2, panel.CellY(1,3,0)+2);
   ENUM_LINE_STATE state=LineStateRelative(handle,index,1,value_dim,IndicatorValue(handle,index+1,2));
   string state_di_str=LineStateDescription(state);
   color clr=clrNONE;
   if(state==LINE_STATE_ABOVE)
     {
      state_di_str="+DI > -DI";
      clr=clrGreen;
     }
   if(state==LINE_STATE_CROSS_UP)
      clr=clrGreen;
   if(state==LINE_STATE_UNDER)
     {
      state_di_str="+DI < -DI";
      clr=clrRed;
     }
   if(state==LINE_STATE_CROSS_DOWN)
      clr=clrRed;
   panel.DrawText(state_di_str,panel.CellX(1,3,1)+2,panel.CellY(1,3,1)+2,clr,90);

//--- Redraw the chart to immediately display all changes on the panel
   ChartRedraw(ChartID());
  }
In addition to these indicator lines, the panel displays a description of the relationship between the +DI and -DI lines, which are essentially signal lines of the indicator.
Besides, when using the dashboard, the panel events handler is called in the OnChartEvent() EA event handler, as well as the events for receiving the bar index under the cursor are handled:
//+------------------------------------------------------------------+
//| ChartEvent function                                              |
//+------------------------------------------------------------------+
void OnChartEvent(const int id,
                  const long &lparam,
                  const double &dparam,
                  const string &sparam)
  {
//--- Handling the panel
//--- Call the panel event handler
   panel.OnChartEvent(id,lparam,dparam,sparam);

//--- If the cursor moves or a click is made on the chart
   if(id==CHARTEVENT_MOUSE_MOVE || id==CHARTEVENT_CLICK)
     {
      //--- Declare the variables to record time and price coordinates in them
      datetime time=0;
      double price=0;
      int wnd=0;
      //--- If the cursor coordinates are converted to date and time
      if(ChartXYToTimePrice(ChartID(),(int)lparam,(int)dparam,wnd,time,price))
        {
         //--- write the bar index where the cursor is located to a global variable
         mouse_bar_index=iBarShift(Symbol(),PERIOD_CURRENT,time);
         //--- Display the bar data under the cursor on the panel
         DrawData(mouse_bar_index,time);
        }
     }

//--- If we received a custom event, display the appropriate message in the journal
   if(id>CHARTEVENT_CUSTOM)
     {
      //--- Here we can implement handling a click on the close button on the panel
      PrintFormat("%s: Event id=%ld, object id (lparam): %lu, event message (sparam): %s",__FUNCTION__,id,lparam,sparam);
     }
  }
After compiling the EA and launching it on the chart, we can monitor the state of the indicator value and line on the panel:
You can view the TestTrendADX.mq5 test EA in the files attached to the article.
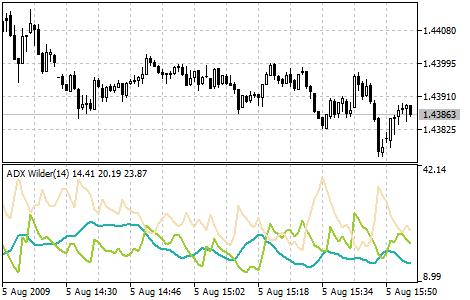
Average Directional Movement Index Wilder
Average Directional Movement Index Wilder (ADX Wilder) helps to determine if there is a price trend. This technical indicator is constructed as a strict correspondence with the algorithm described by Welles Wilder in his book "New concepts in technical trading systems".
Trading rules for this indicator are described in the Average Directional Movement Index section.
Parameters
iADXWilder() function is used to create the indicator handle:
Return the handle of the Average Directional Movement Index by Welles Wilder.

int  iADXWilder(
   string           symbol,         // symbol name
   ENUM_TIMEFRAMES  period,         // period
   int              adx_period      // averaging period
   );
symbol
[in] The symbol name of the financial instrument whose data is to be used to calculate the indicator. NULL means the current symbol.
period
[in] The period value can be one of the ENUM_TIMEFRAMES enumeration values, 0 means the current timeframe.
adx_period
[in] Index calculation period.
Buffer indexes: 0 — MAIN_LINE, 1 — PLUSDI_LINE, 2 — MINUSDI_LINE.
Return the handle of the specified technical indicator. If failed, return INVALID_HANDLE. To free up computer memory from an unused indicator, use IndicatorRelease() the indicator handle is passed to.
Declare input and global variables in the EA to create the indicator:
//+------------------------------------------------------------------+
//|                                           TestTrendADXWilder.mq5 |
//|                                  Copyright 2023, MetaQuotes Ltd. |
//|                                             https://www.mql5.com |
//+------------------------------------------------------------------+
#property copyright "Copyright 2023, MetaQuotes Ltd."
#property link      "https://www.mql5.com"
#property version   "1.00"
//--- enums
enum ENUM_LINE_STATE
  {
   LINE_STATE_NONE,        // Undefined state
   LINE_STATE_UP,          // Upward
   LINE_STATE_DOWN,        // Downward
   LINE_STATE_TURN_UP,     // Upward reversal
   LINE_STATE_TURN_DOWN,   // Downward reversal
   LINE_STATE_STOP_UP,     // Upward stop
   LINE_STATE_STOP_DOWN,   // Downward stop
   LINE_STATE_ABOVE,       // Above value
   LINE_STATE_UNDER,       // Below value
   LINE_STATE_CROSS_UP,    // Crossing value upwards
   LINE_STATE_CROSS_DOWN,  // Crossing value downwards
   LINE_STATE_TOUCH_BELOW, // Touching value from below
   LINE_STATE_TOUCH_ABOVE, // Touch value from above
   LINE_STATE_EQUALS,      // Equal to value
  };
//--- input parameters
input uint  InpPeriod   =  14;   /* Period   */
//--- global variables
int      handle=INVALID_HANDLE;  // Indicator handle
int      period=0;               // ADX Wilder calculation period
int      ind_digits=0;           // Number of decimal places in the indicator values
string   ind_title;              // Indicator description
When using the dashboard in the EA, declare global variables and include the panel class file:
//+------------------------------------------------------------------+
//|                                           TestTrendADXWilder.mq5 |
//|                                  Copyright 2023, MetaQuotes Ltd. |
//|                                             https://www.mql5.com |
//+------------------------------------------------------------------+
#property copyright "Copyright 2023, MetaQuotes Ltd."
#property link      "https://www.mql5.com"
#property version   "1.00"
//--- includes
#include <Dashboard\Dashboard.mqh>
//--- enums
enum ENUM_LINE_STATE
  {
   LINE_STATE_NONE,        // Undefined state
   LINE_STATE_UP,          // Upward
   LINE_STATE_DOWN,        // Downward
   LINE_STATE_TURN_UP,     // Upward reversal
   LINE_STATE_TURN_DOWN,   // Downward reversal
   LINE_STATE_STOP_UP,     // Upward stop
   LINE_STATE_STOP_DOWN,   // Downward stop
   LINE_STATE_ABOVE,       // Above value
   LINE_STATE_UNDER,       // Below value
   LINE_STATE_CROSS_UP,    // Crossing value upwards
   LINE_STATE_CROSS_DOWN,  // Crossing value downwards
   LINE_STATE_TOUCH_BELOW, // Touching value from below
   LINE_STATE_TOUCH_ABOVE, // Touch value from above
   LINE_STATE_EQUALS,      // Equal to value
  };
//--- input parameters
input uint  InpPeriod   =  14;   /* Period   */
//--- global variables
int      handle=INVALID_HANDLE;  // Indicator handle
int      period=0;               // ADX Wilder calculation period
int      ind_digits=0;           // Number of decimal places in the indicator values
string   ind_title;              // Indicator description
//--- variables for the panel
int      mouse_bar_index;        // Index of the bar the data is taken from
CDashboard *panel=NULL;          // Pointer to the panel object
Initialization
Setting the values of global variables for the indicator and creating its handle:
//+------------------------------------------------------------------+
//| Expert initialization function                                   |
//+------------------------------------------------------------------+
int OnInit()
  {
//--- create timer
   EventSetTimer(60);

//--- Indicator
//--- Set and adjust the calculation period and levels if necessary
   period=int(InpPeriod<1 ? 14 : InpPeriod);
//--- Set the indicator name and the number of decimal places
   ind_title=StringFormat("ADX Wilder(%lu)",period);
   ind_digits=2;
//--- Create indicator handle
   ResetLastError();
   handle=iADXWilder(Symbol(),PERIOD_CURRENT,period);
   if(handle==INVALID_HANDLE)
     {
      PrintFormat("%s: Failed to create indicator handle %s. Error %ld",__FUNCTION__,ind_title,GetLastError());
      return INIT_FAILED;
     }

//--- Successful initialization
   return(INIT_SUCCEEDED);
  }
If the EA involves using the dashboard, we should create it:
//+------------------------------------------------------------------+
//| Expert initialization function                                   |
//+------------------------------------------------------------------+
int OnInit()
  {
//--- create timer
   EventSetTimer(60);

//--- Indicator
//--- Set and adjust the calculation period and levels if necessary
   period=int(InpPeriod<1 ? 14 : InpPeriod);
//--- Set the indicator name and the number of decimal places
   ind_title=StringFormat("ADX Wilder(%lu)",period);
   ind_digits=2;
//--- Create indicator handle
   ResetLastError();
   handle=iADXWilder(Symbol(),PERIOD_CURRENT,period);
   if(handle==INVALID_HANDLE)
     {
      PrintFormat("%s: Failed to create indicator handle %s. Error %ld",__FUNCTION__,ind_title,GetLastError());
      return INIT_FAILED;
     }

//--- Dashboard
//--- Create the panel
   panel=new CDashboard(1,20,20,197,243);
   if(panel==NULL)
     {
      Print("Error. Failed to create panel object");
      return INIT_FAILED;
     }
//--- Set font parameters
   panel.SetFontParams("Calibri",9);
//--- Display the panel with the "Symbol, Timeframe description" header text
   panel.View(Symbol()+", "+StringSubstr(EnumToString(Period()),7));
//--- Create a table with ID 0 to display bar data in it
   panel.CreateNewTable(0);
//--- Draw a table with ID 0 on the panel background
   panel.DrawGrid(0,2,20,6,2,18,96);

//--- Create a table with ID 1 to display indicator data in it
   panel.CreateNewTable(1);
//--- Get the Y2 table coordinate with ID 0 and
//--- set the Y1 coordinate for the table with ID 1
   int y1=panel.TableY2(0)+22;
//--- Draw a table with ID 1 on the panel background
   panel.DrawGrid(1,2,y1,4,2,18,96);

//--- Display tabular data in the journal
   panel.GridPrint(0,2);
   panel.GridPrint(1,2);
//--- Initialize the variable with the index of the mouse cursor bar
   mouse_bar_index=0;
//--- Display the data of the current bar on the panel
   DrawData(mouse_bar_index,TimeCurrent());

//--- Successful initialization
   return(INIT_SUCCEEDED);
  }
Deinitialization
Release the indicator handle in the EA OnDeinit() handle:
//+------------------------------------------------------------------+
//| Expert deinitialization function                                 |
//+------------------------------------------------------------------+
void OnDeinit(const int reason)
  {
//--- destroy timer
   EventKillTimer();

//--- Release handle of the indicator
   ResetLastError();
   if(!IndicatorRelease(handle))
      PrintFormat("%s: IndicatorRelease failed. Error %ld",__FUNCTION__,GetLastError());
//--- Clear all comments on the chart
   Comment("");
  }
The created dashboard object is removed when using the dashboard:
//+------------------------------------------------------------------+
//| Expert deinitialization function                                 |
//+------------------------------------------------------------------+
void OnDeinit(const int reason)
  {
//--- destroy timer
   EventKillTimer();

//--- Release handle of the indicator
   ResetLastError();
   if(!IndicatorRelease(handle))
      PrintFormat("%s: IndicatorRelease failed. Error %ld",__FUNCTION__,GetLastError());
//--- Clear all comments on the chart
   Comment("");

//--- If the panel object exists, delete it
   if(panel!=NULL)
      delete panel;
  }
Data retrieval
General functions for obtaining data by the indicator handle:
//+------------------------------------------------------------------+
//| Return the indicator data on the specified bar                   |
//+------------------------------------------------------------------+
double IndicatorValue(const int ind_handle,const int index,const int buffer_num)
  {
   double array[1]={0};
   ResetLastError();
   if(CopyBuffer(ind_handle,buffer_num,index,1,array)!=1)
     {
      PrintFormat("%s: CopyBuffer failed. Error %ld",__FUNCTION__,GetLastError());
      return EMPTY_VALUE;
     }
   return array[0];
  }
//+------------------------------------------------------------------+
//| Return the state of the indicator line                           |
//+------------------------------------------------------------------+
ENUM_LINE_STATE LineState(const int ind_handle,const int index,const int buffer_num)
  {
//--- Get the values of the indicator line with the shift (0,1,2) relative to the passed index
   const double value0=IndicatorValue(ind_handle,index,  buffer_num);
   const double value1=IndicatorValue(ind_handle,index+1,buffer_num);
   const double value2=IndicatorValue(ind_handle,index+2,buffer_num);
//--- If at least one of the values could not be obtained, return an undefined value
   if(value0==EMPTY_VALUE || value1==EMPTY_VALUE || value2==EMPTY_VALUE)
      return LINE_STATE_NONE;
//--- Line upward reversal (value2>value1 && value0>value1)
   if(NormalizeDouble(value2-value1,ind_digits)>0 && NormalizeDouble(value0-value1,ind_digits)>0)
      return LINE_STATE_TURN_UP;
//--- Line upward direction (value2<=value1 && value0>value1)
   else if(NormalizeDouble(value2-value1,ind_digits)<=0 && NormalizeDouble(value0-value1,ind_digits)>0)
      return LINE_STATE_UP;
//--- Line upward stop (value2<=value1 && value0==value1)
   else if(NormalizeDouble(value2-value1,ind_digits)<=0 && NormalizeDouble(value0-value1,ind_digits)==0)
      return LINE_STATE_STOP_UP;
//--- Line downward reversal (value2<value1 && value0<value1)
   if(NormalizeDouble(value2-value1,ind_digits)<0 && NormalizeDouble(value0-value1,ind_digits)<0)
      return LINE_STATE_TURN_DOWN;
//--- Line downward direction (value2>=value1 && value0<value1)
   else if(NormalizeDouble(value2-value1,ind_digits)>=0 && NormalizeDouble(value0-value1,ind_digits)<0)
      return LINE_STATE_DOWN;
//--- Line downward stop (value2>=value1 && value0==value1)
   else if(NormalizeDouble(value2-value1,ind_digits)>=0 && NormalizeDouble(value0-value1,ind_digits)==0)
      return LINE_STATE_STOP_DOWN;
//--- Undefined state
   return LINE_STATE_NONE;
  }
//+------------------------------------------------------------------+
//| Return the state of the line relative to the specified level     |
//+------------------------------------------------------------------+
ENUM_LINE_STATE LineStateRelative(const int ind_handle,const int index,const int buffer_num,const double level0,const double level1=EMPTY_VALUE)
  {
//--- Get the values of the indicator line with the shift (0,1) relative to the passed index
   const double value0=IndicatorValue(ind_handle,index,  buffer_num);
   const double value1=IndicatorValue(ind_handle,index+1,buffer_num);
//--- If at least one of the values could not be obtained, return an undefined value
   if(value0==EMPTY_VALUE || value1==EMPTY_VALUE)
      return LINE_STATE_NONE;
//--- Define the second level to compare
   double level=(level1==EMPTY_VALUE ? level0 : level1);
//--- The line is below the level (value1<level && value0<level0)
   if(NormalizeDouble(value1-level,ind_digits)<0 && NormalizeDouble(value0-level0,ind_digits)<0)
      return LINE_STATE_UNDER;
//--- The line is above the level (value1>level && value0>level0)
   if(NormalizeDouble(value1-level,ind_digits)>0 && NormalizeDouble(value0-level0,ind_digits)>0)
      return LINE_STATE_ABOVE;
//--- The line crossed the level upwards (value1<=level && value0>level0)
   if(NormalizeDouble(value1-level,ind_digits)<=0 && NormalizeDouble(value0-level0,ind_digits)>0)
      return LINE_STATE_CROSS_UP;
//--- The line crossed the level downwards (value1>=level && value0<level0)
   if(NormalizeDouble(value1-level,ind_digits)>=0 && NormalizeDouble(value0-level0,ind_digits)<0)
      return LINE_STATE_CROSS_DOWN;
//--- The line touched the level from below (value1<level0 && value0==level0)
   if(NormalizeDouble(value1-level,ind_digits)<0 && NormalizeDouble(value0-level0,ind_digits)==0)
      return LINE_STATE_TOUCH_BELOW;
//--- The line touched the level from above (value1>level0 && value0==level0)
   if(NormalizeDouble(value1-level,ind_digits)>0 && NormalizeDouble(value0-level0,ind_digits)==0)
      return LINE_STATE_TOUCH_BELOW;
//--- Line is equal to the level value (value1==level0 && value0==level0)
   if(NormalizeDouble(value1-level,ind_digits)==0 && NormalizeDouble(value0-level0,ind_digits)==0)
      return LINE_STATE_EQUALS;
//--- Undefined state
   return LINE_STATE_NONE;
  }
//+------------------------------------------------------------------+
//| Return the indicator line state description                      |
//+------------------------------------------------------------------+
string LineStateDescription(const ENUM_LINE_STATE state)
  {
   switch(state)
     {
      case LINE_STATE_UP         :  return "Up";
      case LINE_STATE_STOP_UP    :  return "Stop Up";
      case LINE_STATE_TURN_UP    :  return "Turn Up";
      case LINE_STATE_DOWN       :  return "Down";
      case LINE_STATE_STOP_DOWN  :  return "Stop Down";
      case LINE_STATE_TURN_DOWN  :  return "Turn Down";
      case LINE_STATE_ABOVE      :  return "Above level";
      case LINE_STATE_UNDER      :  return "Under level";
      case LINE_STATE_CROSS_UP   :  return "Crossing Up";
      case LINE_STATE_CROSS_DOWN :  return "Crossing Down";
      case LINE_STATE_TOUCH_BELOW:  return "Touch from Below";
      case LINE_STATE_TOUCH_ABOVE:  return "Touch from Above";
      case LINE_STATE_EQUALS     :  return "Equals";
      default                    :  return "Unknown";
     }
  }
When using the dashboard, data is displayed on the panel using the function:
//+------------------------------------------------------------------+
//| Display data from the specified timeseries index to the panel    |
//+------------------------------------------------------------------+
void DrawData(const int index,const datetime time)
  {
//--- Declare the variables to receive data in them
   MqlTick  tick={0};
   MqlRates rates[1];

//--- Exit if unable to get the current prices
   if(!SymbolInfoTick(Symbol(),tick))
      return;
//--- Exit if unable to get the bar data by the specified index
   if(CopyRates(Symbol(),PERIOD_CURRENT,index,1,rates)!=1)
      return;

//--- Set font parameters for bar and indicator data headers
   int  size=0;
   uint flags=0;
   uint angle=0;
   string name=panel.FontParams(size,flags,angle);
   panel.SetFontParams(name,9,FW_BOLD);
   panel.DrawText("Bar data ["+(string)index+"]",3,panel.TableY1(0)-16,clrMaroon,panel.Width()-6);
   panel.DrawText("Indicator data ["+(string)index+"]",3,panel.TableY1(1)-16,clrGreen,panel.Width()-6);
//--- Set font parameters for bar and indicator data
   panel.SetFontParams(name,9);

//--- Display the data of the specified bar in table 0 on the panel
   panel.DrawText("Date",  panel.CellX(0,0,0)+2, panel.CellY(0,0,0)+2); panel.DrawText(TimeToString(  rates[0].time,TIME_DATE),     panel.CellX(0,0,1)+2, panel.CellY(0,0,1)+2,clrNONE,90);
   panel.DrawText("Time",  panel.CellX(0,1,0)+2, panel.CellY(0,1,0)+2); panel.DrawText(TimeToString(  rates[0].time,TIME_MINUTES),  panel.CellX(0,1,1)+2, panel.CellY(0,1,1)+2,clrNONE,90);
   panel.DrawText("Open",  panel.CellX(0,2,0)+2, panel.CellY(0,2,0)+2); panel.DrawText(DoubleToString(rates[0].open,Digits()),      panel.CellX(0,2,1)+2, panel.CellY(0,2,1)+2,clrNONE,90);
   panel.DrawText("High",  panel.CellX(0,3,0)+2, panel.CellY(0,3,0)+2); panel.DrawText(DoubleToString(rates[0].high,Digits()),      panel.CellX(0,3,1)+2, panel.CellY(0,3,1)+2,clrNONE,90);
   panel.DrawText("Low",   panel.CellX(0,4,0)+2, panel.CellY(0,4,0)+2); panel.DrawText(DoubleToString(rates[0].low,Digits()),       panel.CellX(0,4,1)+2, panel.CellY(0,4,1)+2,clrNONE,90);
   panel.DrawText("Close", panel.CellX(0,5,0)+2, panel.CellY(0,5,0)+2); panel.DrawText(DoubleToString(rates[0].close,Digits()),     panel.CellX(0,5,1)+2, panel.CellY(0,5,1)+2,clrNONE,90);

//--- Display the ADX line data from the specified bar on the panel in table 1
   panel.DrawText(ind_title, panel.CellX(1,0,0)+2, panel.CellY(1,0,0)+2);
   double value=IndicatorValue(handle,index,MAIN_LINE);
   string value_str=(value!=EMPTY_VALUE ? DoubleToString(value,ind_digits) : "");
   panel.DrawText(value_str,panel.CellX(1,0,1)+2,panel.CellY(1,0,1)+2,clrNONE,100);

//--- Display the +DI line data from the specified bar on the panel in table 1
   panel.DrawText("+DI", panel.CellX(1,1,0)+2, panel.CellY(1,1,0)+2);
   double value_dip=IndicatorValue(handle,index,PLUSDI_LINE);
   string value_dip_str=(value_dip!=EMPTY_VALUE ? DoubleToString(value_dip,ind_digits) : "");
   panel.DrawText(value_dip_str,panel.CellX(1,1,1)+2,panel.CellY(1,1,1)+2,clrNONE,100);

//--- Display the -DI line data from the specified bar on the panel in table 1
   panel.DrawText("-DI", panel.CellX(1,2,0)+2, panel.CellY(1,2,0)+2);
   double value_dim=IndicatorValue(handle,index,MINUSDI_LINE);
   string value_dim_str=(value_dim!=EMPTY_VALUE ? DoubleToString(value_dim,ind_digits) : "");
   panel.DrawText(value_dim_str,panel.CellX(1,2,1)+2,panel.CellY(1,2,1)+2,clrNONE,100);

//--- Display a description of +DI and -DI lines ratio
   panel.DrawText("+DI vs -DI", panel.CellX(1,3,0)+2, panel.CellY(1,3,0)+2);
   ENUM_LINE_STATE state=LineStateRelative(handle,index,1,value_dim,IndicatorValue(handle,index+1,2));
   string state_di_str=LineStateDescription(state);
   color clr=clrNONE;
   if(state==LINE_STATE_ABOVE)
     {
      state_di_str="+DI > -DI";
      clr=clrGreen;
     }
   if(state==LINE_STATE_CROSS_UP)
      clr=clrGreen;
   if(state==LINE_STATE_UNDER)
     {
      state_di_str="+DI < -DI";
      clr=clrRed;
     }
   if(state==LINE_STATE_CROSS_DOWN)
      clr=clrRed;
   panel.DrawText(state_di_str,panel.CellX(1,3,1)+2,panel.CellY(1,3,1)+2,clr,90);

//--- Redraw the chart to immediately display all changes on the panel
   ChartRedraw(ChartID());
  }
The panel displays the data of the indicator lines and the description of the relationship between the +DI and -DI lines, which are essentially signal lines of the indicator.
Besides, when using the dashboard, the panel events handler is called in the OnChartEvent() EA event handler, as well as the events for receiving the bar index under the cursor are handled:
//+------------------------------------------------------------------+
//| ChartEvent function                                              |
//+------------------------------------------------------------------+
void OnChartEvent(const int id,
                  const long &lparam,
                  const double &dparam,
                  const string &sparam)
  {
//--- Handling the panel
//--- Call the panel event handler
   panel.OnChartEvent(id,lparam,dparam,sparam);

//--- If the cursor moves or a click is made on the chart
   if(id==CHARTEVENT_MOUSE_MOVE || id==CHARTEVENT_CLICK)
     {
      //--- Declare the variables to record time and price coordinates in them
      datetime time=0;
      double price=0;
      int wnd=0;
      //--- If the cursor coordinates are converted to date and time
      if(ChartXYToTimePrice(ChartID(),(int)lparam,(int)dparam,wnd,time,price))
        {
         //--- write the bar index where the cursor is located to a global variable
         mouse_bar_index=iBarShift(Symbol(),PERIOD_CURRENT,time);
         //--- Display the bar data under the cursor on the panel
         DrawData(mouse_bar_index,time);
        }
     }

//--- If we received a custom event, display the appropriate message in the journal
   if(id>CHARTEVENT_CUSTOM)
     {
      //--- Here we can implement handling a click on the close button on the panel
      PrintFormat("%s: Event id=%ld, object id (lparam): %lu, event message (sparam): %s",__FUNCTION__,id,lparam,sparam);
     }
  }
After compiling the EA and launching it on the chart, we can monitor the state of the indicator value and line on the panel:
You can view the TestTrendADXWilder.mq5 test EA in the files attached to the article.
Bollinger Bands®
Bollinger Bands (BB) are similar to the Envelopes. The only difference is that the bands of Envelopes are plotted a fixed distance (%) away from the moving average, while the Bollinger Bands are plotted a certain number of standard deviations away from it. Standard deviation is a measure of volatility, therefore Bollinger Bands adjust themselves to the market conditions. When the markets become more volatile, the bands widen and they contract during less volatile periods.
Bollinger Bands are usually drawn on the price chart, but they can be also added to the indicator chart. Just like in case of the Envelopes, the interpretation of the Bollinger Bands is based on the fact that the prices tend to remain in between the top and the bottom line of the bands. A distinctive feature of the Bollinger Band indicator is its variable width due to the volatility of prices. In periods of considerable price changes (i.e. of high volatility) the bands widen leaving a lot of room to the prices to move in. During standstill periods, or the periods of low volatility the band contracts keeping the prices within their limits.
The following traits are particular to the Bollinger Band:
- abrupt changes in prices tend to happen after the band has contracted due to decrease of volatility;
- if prices break through the upper band, a continuation of the current trend is to be expected;
- if the pikes and hollows outside the band are followed by pikes and hollows inside the band, a reverse of trend may occur;
- the price movement that has started from one of the band’s lines usually reaches the opposite one.
The last observation is useful for forecasting price guideposts.

Parameters
iBands() function is used to create the indicator handle:
Return Bollinger Bands® indicator handle.
int  iBands(
   string              symbol,            // symbol name
   ENUM_TIMEFRAMES     period,            // period
   int                 bands_period,      // central line calculation period
   int                 bands_shift,       // horizontal shift of the indicator
   double              deviation,         // number of standard deviations
   ENUM_APPLIED_PRICE  applied_price      // price type or handle
   );
symbol
[in] The symbol name of the financial instrument whose data is to be used to calculate the indicator. NULL means the current symbol.
period
[in] The period value can be one of the ENUM_TIMEFRAMES enumeration values, 0 means the current timeframe.
bands_period
[in] The averaging period of the main line of the indicator.
bands_shift
[in] Shift of the indicator in relation to the price chart.
deviation
[in] Deviation from the main line.
applied_price
[in] Applied price. Any of the ENUM_APPLIED_PRICE price constants or another indicator handle.
Return the handle of the specified technical indicator. If failed, return INVALID_HANDLE. To free up computer memory from an unused indicator, use IndicatorRelease() the indicator handle is passed to.
Buffer indexes: 0 — BASE_LINE, 1 — UPPER_BAND, 2 — LOWER_BAND
Declare input and global variables in the EA to create the indicator:
//+------------------------------------------------------------------+
//|                                               TestTrendBands.mq5 |
//|                                  Copyright 2023, MetaQuotes Ltd. |
//|                                             https://www.mql5.com |
//+------------------------------------------------------------------+
#property copyright "Copyright 2023, MetaQuotes Ltd."
#property link      "https://www.mql5.com"
#property version   "1.00"
//--- enums
enum ENUM_LINE_STATE
  {
   LINE_STATE_NONE,        // Undefined state
   LINE_STATE_UP,          // Upward
   LINE_STATE_DOWN,        // Downward
   LINE_STATE_TURN_UP,     // Upward reversal
   LINE_STATE_TURN_DOWN,   // Downward reversal
   LINE_STATE_STOP_UP,     // Upward stop
   LINE_STATE_STOP_DOWN,   // Downward stop
   LINE_STATE_ABOVE,       // Above value
   LINE_STATE_UNDER,       // Below value
   LINE_STATE_CROSS_UP,    // Crossing value upwards
   LINE_STATE_CROSS_DOWN,  // Crossing value downwards
   LINE_STATE_TOUCH_BELOW, // Touching value from below
   LINE_STATE_TOUCH_ABOVE, // Touch value from above
   LINE_STATE_EQUALS,      // Equal to value
  };
//--- input parameters
input uint                 InpPeriod   =  20;            /* Period         */
input double               InpDeviation=  2.0;           /* Deviation      */
input int                  InpShift    =  0;             /* Shift          */
input ENUM_APPLIED_PRICE   InpPrice    =  PRICE_CLOSE;   /* Applied Price  */
//--- global variables
int      handle=INVALID_HANDLE;  // Indicator handle
int      period=0;               // Bollinger Bands calculation period
int      ind_digits=0;           // Number of decimal places in the indicator values
string   ind_title;              // Indicator description
When using the dashboard in the EA, declare global variables and include the panel class file:
//+------------------------------------------------------------------+
//|                                               TestTrendBands.mq5 |
//|                                  Copyright 2023, MetaQuotes Ltd. |
//|                                             https://www.mql5.com |
//+------------------------------------------------------------------+
#property copyright "Copyright 2023, MetaQuotes Ltd."
#property link      "https://www.mql5.com"
#property version   "1.00"
//--- includes
#include <Dashboard\Dashboard.mqh>
//--- enums
enum ENUM_LINE_STATE
  {
   LINE_STATE_NONE,        // Undefined state
   LINE_STATE_UP,          // Upward
   LINE_STATE_DOWN,        // Downward
   LINE_STATE_TURN_UP,     // Upward reversal
   LINE_STATE_TURN_DOWN,   // Downward reversal
   LINE_STATE_STOP_UP,     // Upward stop
   LINE_STATE_STOP_DOWN,   // Downward stop
   LINE_STATE_ABOVE,       // Above value
   LINE_STATE_UNDER,       // Below value
   LINE_STATE_CROSS_UP,    // Crossing value upwards
   LINE_STATE_CROSS_DOWN,  // Crossing value downwards
   LINE_STATE_TOUCH_BELOW, // Touching value from below
   LINE_STATE_TOUCH_ABOVE, // Touch value from above
   LINE_STATE_EQUALS,      // Equal to value
  };
//--- input parameters
input uint                 InpPeriod   =  20;            /* Period         */
input double               InpDeviation=  2.0;           /* Deviation      */
input int                  InpShift    =  0;             /* Shift          */
input ENUM_APPLIED_PRICE   InpPrice    =  PRICE_CLOSE;   /* Applied Price  */
//--- global variables
int      handle=INVALID_HANDLE;  // Indicator handle
int      period=0;               // Bollinger Bands calculation period
int      ind_digits=0;           // Number of decimal places in the indicator values
string   ind_title;              // Indicator description
//--- variables for the panel
int      mouse_bar_index;        // Index of the bar the data is taken from
CDashboard *panel=NULL;          // Pointer to the panel object
Initialization
Setting the values of global variables for the indicator and creating its handle:
//+------------------------------------------------------------------+
//| Expert initialization function                                   |
//+------------------------------------------------------------------+
int OnInit()
  {
//--- create timer
   EventSetTimer(60);

//--- Indicator
//--- Set and adjust the calculation period and levels if necessary
   period=int(InpPeriod<1 ? 20 : InpPeriod);
//--- Set the indicator name and the number of decimal places
   ind_title=StringFormat("Bands(%lu)",period);
   ind_digits=Digits()+1;
//--- Create indicator handle
   ResetLastError();
   handle=iBands(Symbol(),PERIOD_CURRENT,period,InpShift,InpDeviation,InpPrice);
   if(handle==INVALID_HANDLE)
     {
      PrintFormat("%s: Failed to create indicator handle %s. Error %ld",__FUNCTION__,ind_title,GetLastError());
      return INIT_FAILED;
     }

//--- Successful initialization
   return(INIT_SUCCEEDED);
  }
If the EA involves using the dashboard, we should create it:
//+------------------------------------------------------------------+
//| Expert initialization function                                   |
//+------------------------------------------------------------------+
int OnInit()
  {
//--- create timer
   EventSetTimer(60);

//--- Indicator
//--- Set and adjust the calculation period and levels if necessary
   period=int(InpPeriod<1 ? 20 : InpPeriod);
//--- Set the indicator name and the number of decimal places
   ind_title=StringFormat("Bands(%lu)",period);
   ind_digits=Digits()+1;
//--- Create indicator handle
   ResetLastError();
   handle=iBands(Symbol(),PERIOD_CURRENT,period,InpShift,InpDeviation,InpPrice);
   if(handle==INVALID_HANDLE)
     {
      PrintFormat("%s: Failed to create indicator handle %s. Error %ld",__FUNCTION__,ind_title,GetLastError());
      return INIT_FAILED;
     }

//--- Dashboard
//--- Create the panel
   panel=new CDashboard(1,20,20,225,243);
   if(panel==NULL)
     {
      Print("Error. Failed to create panel object");
      return INIT_FAILED;
     }
//--- Set font parameters
   panel.SetFontParams("Calibri",9);
//--- Display the panel with the "Symbol, Timeframe description" header text
   panel.View(Symbol()+", "+StringSubstr(EnumToString(Period()),7));
//--- Create a table with ID 0 to display bar data in it
   panel.CreateNewTable(0);
//--- Draw a table with ID 0 on the panel background
   panel.DrawGrid(0,2,20,6,2,18,110);

//--- Create a table with ID 1 to display indicator data in it
   panel.CreateNewTable(1);
//--- Get the Y2 table coordinate with ID 0 and
//--- set the Y1 coordinate for the table with ID 1
   int y1=panel.TableY2(0)+22;
//--- Draw a table with ID 1 on the panel background
   panel.DrawGrid(1,2,y1,4,2,18,110);

//--- Display tabular data in the journal
   panel.GridPrint(0,2);
   panel.GridPrint(1,2);
//--- Initialize the variable with the index of the mouse cursor bar
   mouse_bar_index=0;
//--- Display the data of the current bar on the panel
   DrawData(mouse_bar_index,TimeCurrent());

//--- Successful initialization
   return(INIT_SUCCEEDED);
  }
Deinitialization
Release the indicator handle in the EA OnDeinit() handle:
//+------------------------------------------------------------------+
//| Expert deinitialization function                                 |
//+------------------------------------------------------------------+
void OnDeinit(const int reason)
  {
//--- destroy timer
   EventKillTimer();

//--- Release handle of the indicator
   ResetLastError();
   if(!IndicatorRelease(handle))
      PrintFormat("%s: IndicatorRelease failed. Error %ld",__FUNCTION__,GetLastError());
//--- Clear all comments on the chart
   Comment("");
  }
The created dashboard object is removed when using the dashboard:
//+------------------------------------------------------------------+
//| Expert deinitialization function                                 |
//+------------------------------------------------------------------+
void OnDeinit(const int reason)
  {
//--- destroy timer
   EventKillTimer();

//--- Release handle of the indicator
   ResetLastError();
   if(!IndicatorRelease(handle))
      PrintFormat("%s: IndicatorRelease failed. Error %ld",__FUNCTION__,GetLastError());
//--- Clear all comments on the chart
   Comment("");

//--- If the panel object exists, delete it
   if(panel!=NULL)
      delete panel;
  }
Data retrieval
General functions for obtaining data by the indicator handle:
//+------------------------------------------------------------------+
//| Return the indicator data on the specified bar                   |
//+------------------------------------------------------------------+
double IndicatorValue(const int ind_handle,const int index,const int buffer_num)
  {
   double array[1]={0};
   ResetLastError();
   if(CopyBuffer(ind_handle,buffer_num,index,1,array)!=1)
     {
      PrintFormat("%s: CopyBuffer failed. Error %ld",__FUNCTION__,GetLastError());
      return EMPTY_VALUE;
     }
   return array[0];
  }
//+------------------------------------------------------------------+
//| Return the state of the indicator line                           |
//+------------------------------------------------------------------+
ENUM_LINE_STATE LineState(const int ind_handle,const int index,const int buffer_num)
  {
//--- Get the values of the indicator line with the shift (0,1,2) relative to the passed index
   const double value0=IndicatorValue(ind_handle,index,  buffer_num);
   const double value1=IndicatorValue(ind_handle,index+1,buffer_num);
   const double value2=IndicatorValue(ind_handle,index+2,buffer_num);
//--- If at least one of the values could not be obtained, return an undefined value
   if(value0==EMPTY_VALUE || value1==EMPTY_VALUE || value2==EMPTY_VALUE)
      return LINE_STATE_NONE;
//--- Line upward reversal (value2>value1 && value0>value1)
   if(NormalizeDouble(value2-value1,ind_digits)>0 && NormalizeDouble(value0-value1,ind_digits)>0)
      return LINE_STATE_TURN_UP;
//--- Line upward direction (value2<=value1 && value0>value1)
   else if(NormalizeDouble(value2-value1,ind_digits)<=0 && NormalizeDouble(value0-value1,ind_digits)>0)
      return LINE_STATE_UP;
//--- Line upward stop (value2<=value1 && value0==value1)
   else if(NormalizeDouble(value2-value1,ind_digits)<=0 && NormalizeDouble(value0-value1,ind_digits)==0)
      return LINE_STATE_STOP_UP;
//--- Line downward reversal (value2<value1 && value0<value1)
   if(NormalizeDouble(value2-value1,ind_digits)<0 && NormalizeDouble(value0-value1,ind_digits)<0)
      return LINE_STATE_TURN_DOWN;
//--- Line downward direction (value2>=value1 && value0<value1)
   else if(NormalizeDouble(value2-value1,ind_digits)>=0 && NormalizeDouble(value0-value1,ind_digits)<0)
      return LINE_STATE_DOWN;
//--- Line downward stop (value2>=value1 && value0==value1)
   else if(NormalizeDouble(value2-value1,ind_digits)>=0 && NormalizeDouble(value0-value1,ind_digits)==0)
      return LINE_STATE_STOP_DOWN;
//--- Undefined state
   return LINE_STATE_NONE;
  }
//+------------------------------------------------------------------+
//| Return the state of the line relative to the specified level     |
//+------------------------------------------------------------------+
ENUM_LINE_STATE LineStateRelative(const int ind_handle,const int index,const int buffer_num,const double level0,const double level1=EMPTY_VALUE)
  {
//--- Get the values of the indicator line with the shift (0,1) relative to the passed index
   const double value0=IndicatorValue(ind_handle,index,  buffer_num);
   const double value1=IndicatorValue(ind_handle,index+1,buffer_num);
//--- If at least one of the values could not be obtained, return an undefined value
   if(value0==EMPTY_VALUE || value1==EMPTY_VALUE)
      return LINE_STATE_NONE;
//--- Define the second level to compare
   double level=(level1==EMPTY_VALUE ? level0 : level1);
//--- The line is below the level (value1<level && value0<level0)
   if(NormalizeDouble(value1-level,ind_digits)<0 && NormalizeDouble(value0-level0,ind_digits)<0)
      return LINE_STATE_UNDER;
//--- The line is above the level (value1>level && value0>level0)
   if(NormalizeDouble(value1-level,ind_digits)>0 && NormalizeDouble(value0-level0,ind_digits)>0)
      return LINE_STATE_ABOVE;
//--- The line crossed the level upwards (value1<=level && value0>level0)
   if(NormalizeDouble(value1-level,ind_digits)<=0 && NormalizeDouble(value0-level0,ind_digits)>0)
      return LINE_STATE_CROSS_UP;
//--- The line crossed the level downwards (value1>=level && value0<level0)
   if(NormalizeDouble(value1-level,ind_digits)>=0 && NormalizeDouble(value0-level0,ind_digits)<0)
      return LINE_STATE_CROSS_DOWN;
//--- The line touched the level from below (value1<level0 && value0==level0)
   if(NormalizeDouble(value1-level,ind_digits)<0 && NormalizeDouble(value0-level0,ind_digits)==0)
      return LINE_STATE_TOUCH_BELOW;
//--- The line touched the level from above (value1>level0 && value0==level0)
   if(NormalizeDouble(value1-level,ind_digits)>0 && NormalizeDouble(value0-level0,ind_digits)==0)
      return LINE_STATE_TOUCH_BELOW;
//--- Line is equal to the level value (value1==level0 && value0==level0)
   if(NormalizeDouble(value1-level,ind_digits)==0 && NormalizeDouble(value0-level0,ind_digits)==0)
      return LINE_STATE_EQUALS;
//--- Undefined state
   return LINE_STATE_NONE;
  }
//+------------------------------------------------------------------+
//| Return the indicator line state description                      |
//+------------------------------------------------------------------+
string LineStateDescription(const ENUM_LINE_STATE state)
  {
   switch(state)
     {
      case LINE_STATE_UP         :  return "Up";
      case LINE_STATE_STOP_UP    :  return "Stop Up";
      case LINE_STATE_TURN_UP    :  return "Turn Up";
      case LINE_STATE_DOWN       :  return "Down";
      case LINE_STATE_STOP_DOWN  :  return "Stop Down";
      case LINE_STATE_TURN_DOWN  :  return "Turn Down";
      case LINE_STATE_ABOVE      :  return "Above level";
      case LINE_STATE_UNDER      :  return "Under level";
      case LINE_STATE_CROSS_UP   :  return "Crossing Up";
      case LINE_STATE_CROSS_DOWN :  return "Crossing Down";
      case LINE_STATE_TOUCH_BELOW:  return "Touch from Below";
      case LINE_STATE_TOUCH_ABOVE:  return "Touch from Above";
      case LINE_STATE_EQUALS     :  return "Equals";
      default                    :  return "Unknown";
     }
  }
When using the dashboard, data is displayed on the panel using the function:
//+------------------------------------------------------------------+
//| Display data from the specified timeseries index to the panel    |
//+------------------------------------------------------------------+
void DrawData(const int index,const datetime time)
  {
//--- Declare the variables to receive data in them
   MqlTick  tick={0};
   MqlRates rates[1];

//--- Exit if unable to get the current prices
   if(!SymbolInfoTick(Symbol(),tick))
      return;
//--- Exit if unable to get the bar data by the specified index
   if(CopyRates(Symbol(),PERIOD_CURRENT,index,1,rates)!=1)
      return;

//--- Set font parameters for bar and indicator data headers
   int  size=0;
   uint flags=0;
   uint angle=0;
   string name=panel.FontParams(size,flags,angle);
   panel.SetFontParams(name,9,FW_BOLD);
   panel.DrawText("Bar data ["+(string)index+"]",3,panel.TableY1(0)-16,clrMaroon,panel.Width()-6);
   panel.DrawText("Indicator data ["+(string)index+"]",3,panel.TableY1(1)-16,clrGreen,panel.Width()-6);
//--- Set font parameters for bar and indicator data
   panel.SetFontParams(name,9);

//--- Display the data of the specified bar in table 0 on the panel
   panel.DrawText("Date",  panel.CellX(0,0,0)+2, panel.CellY(0,0,0)+2); panel.DrawText(TimeToString(  rates[0].time,TIME_DATE),     panel.CellX(0,0,1)+2, panel.CellY(0,0,1)+2,clrNONE,90);
   panel.DrawText("Time",  panel.CellX(0,1,0)+2, panel.CellY(0,1,0)+2); panel.DrawText(TimeToString(  rates[0].time,TIME_MINUTES),  panel.CellX(0,1,1)+2, panel.CellY(0,1,1)+2,clrNONE,90);
   panel.DrawText("Open",  panel.CellX(0,2,0)+2, panel.CellY(0,2,0)+2); panel.DrawText(DoubleToString(rates[0].open,Digits()),      panel.CellX(0,2,1)+2, panel.CellY(0,2,1)+2,clrNONE,90);
   panel.DrawText("High",  panel.CellX(0,3,0)+2, panel.CellY(0,3,0)+2); panel.DrawText(DoubleToString(rates[0].high,Digits()),      panel.CellX(0,3,1)+2, panel.CellY(0,3,1)+2,clrNONE,90);
   panel.DrawText("Low",   panel.CellX(0,4,0)+2, panel.CellY(0,4,0)+2); panel.DrawText(DoubleToString(rates[0].low,Digits()),       panel.CellX(0,4,1)+2, panel.CellY(0,4,1)+2,clrNONE,90);
   panel.DrawText("Close", panel.CellX(0,5,0)+2, panel.CellY(0,5,0)+2); panel.DrawText(DoubleToString(rates[0].close,Digits()),     panel.CellX(0,5,1)+2, panel.CellY(0,5,1)+2,clrNONE,90);

//--- Display the Bands Upper line data from the specified bar on the panel in table 1
   panel.DrawText(ind_title+" Upper", panel.CellX(1,0,0)+2, panel.CellY(1,0,0)+2);
   double value=IndicatorValue(handle,index,UPPER_BAND);
   string value_str=(value!=EMPTY_VALUE ? DoubleToString(value,ind_digits) : "");
   panel.DrawText(value_str,panel.CellX(1,0,1)+2,panel.CellY(1,0,1)+2,clrNONE,100);

//--- Display the Bands Lower line data from the specified bar on the panel in table 1
   panel.DrawText(ind_title+" Lower", panel.CellX(1,1,0)+2, panel.CellY(1,1,0)+2);
   double value_dip=IndicatorValue(handle,index,LOWER_BAND);
   string value_dip_str=(value_dip!=EMPTY_VALUE ? DoubleToString(value_dip,ind_digits) : "");
   panel.DrawText(value_dip_str,panel.CellX(1,1,1)+2,panel.CellY(1,1,1)+2,clrNONE,100);

//--- Display the Bands Middle line data from the specified bar on the panel in table 1
   panel.DrawText(ind_title+" Middle", panel.CellX(1,2,0)+2, panel.CellY(1,2,0)+2);
   double value_dim=IndicatorValue(handle,index,BASE_LINE);
   string value_dim_str=(value_dim!=EMPTY_VALUE ? DoubleToString(value_dim,ind_digits) : "");
   panel.DrawText(value_dim_str,panel.CellX(1,2,1)+2,panel.CellY(1,2,1)+2,clrNONE,100);

//--- Redraw the chart to immediately display all changes on the panel
   ChartRedraw(ChartID());
  }
Besides, when using the dashboard, the panel events handler is called in the OnChartEvent() EA event handler, as well as the events for receiving the bar index under the cursor are handled:
//+------------------------------------------------------------------+
//| ChartEvent function                                              |
//+------------------------------------------------------------------+
void OnChartEvent(const int id,
                  const long &lparam,
                  const double &dparam,
                  const string &sparam)
  {
//--- Handling the panel
//--- Call the panel event handler
   panel.OnChartEvent(id,lparam,dparam,sparam);

//--- If the cursor moves or a click is made on the chart
   if(id==CHARTEVENT_MOUSE_MOVE || id==CHARTEVENT_CLICK)
     {
      //--- Declare the variables to record time and price coordinates in them
      datetime time=0;
      double price=0;
      int wnd=0;
      //--- If the cursor coordinates are converted to date and time
      if(ChartXYToTimePrice(ChartID(),(int)lparam,(int)dparam,wnd,time,price))
        {
         //--- write the bar index where the cursor is located to a global variable
         mouse_bar_index=iBarShift(Symbol(),PERIOD_CURRENT,time);
         //--- Display the bar data under the cursor on the panel
         DrawData(mouse_bar_index,time);
        }
     }

//--- If we received a custom event, display the appropriate message in the journal
   if(id>CHARTEVENT_CUSTOM)
     {
      //--- Here we can implement handling a click on the close button on the panel
      PrintFormat("%s: Event id=%ld, object id (lparam): %lu, event message (sparam): %s",__FUNCTION__,id,lparam,sparam);
     }
  }
After compiling the EA and launching it on the chart, we can monitor the state of the indicator value and line on the panel:
You can view the TestTrendBands.mq5 test EA in the files attached to the article.
Double Exponential Moving Average
Double Exponential Moving Average (DEMA) was developed by Patrick Mulloy and published in February 1994 in the "Technical Analysis of Stocks & Commodities" magazine. It is used for smoothing price series and is applied directly on a price chart of a financial security. Besides, it can be used for smoothing values of other indicators.
The advantage of this indicator is that it eliminates false signals at the saw-toothed price movement and allows saving a position at a strong trend.
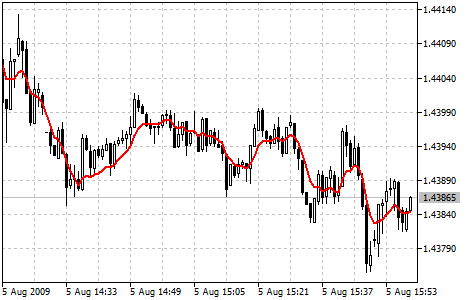
Parameters
iDEMA() function is used to create the indicator handle:
Return the handle of the Double Exponential Moving Average indicator. Only one buffer.
int  iDEMA(
   string              symbol,            // symbol name
   ENUM_TIMEFRAMES     period,            // period
   int                 ma_period,         // averaging period
   int                 ma_shift,          // horizontal shift of the indicator
   ENUM_APPLIED_PRICE  applied_price      // price type or handle
   );
symbol
[in] The symbol name of the financial instrument whose data is to be used to calculate the indicator. NULL means the current symbol.
period
[in] The period value can be one of the ENUM_TIMEFRAMES enumeration values, 0 means the current timeframe.
ma_period
[in] Period (number of bars) for the indicator calculation.
ma_shift
[in] Shift of the indicator in relation to the price chart.
applied_price
[in] Applied price. Any of the ENUM_APPLIED_PRICE price constants or another indicator handle.
Return the handle of the specified technical indicator. If failed, return INVALID_HANDLE. To free up computer memory from an unused indicator, use IndicatorRelease() the indicator handle is passed to.
Declare input and global variables in the EA to create the indicator:
//+------------------------------------------------------------------+
//|                                                TestTrendDEMA.mq5 |
//|                                  Copyright 2023, MetaQuotes Ltd. |
//|                                             https://www.mql5.com |
//+------------------------------------------------------------------+
#property copyright "Copyright 2023, MetaQuotes Ltd."
#property link      "https://www.mql5.com"
#property version   "1.00"
//--- enums
enum ENUM_LINE_STATE
  {
   LINE_STATE_NONE,        // Undefined state
   LINE_STATE_UP,          // Upward
   LINE_STATE_DOWN,        // Downward
   LINE_STATE_TURN_UP,     // Upward reversal
   LINE_STATE_TURN_DOWN,   // Downward reversal
   LINE_STATE_STOP_UP,     // Upward stop
   LINE_STATE_STOP_DOWN,   // Downward stop
   LINE_STATE_ABOVE,       // Above value
   LINE_STATE_UNDER,       // Below value
   LINE_STATE_CROSS_UP,    // Crossing value upwards
   LINE_STATE_CROSS_DOWN,  // Crossing value downwards
   LINE_STATE_TOUCH_BELOW, // Touching value from below
   LINE_STATE_TOUCH_ABOVE, // Touch value from above
   LINE_STATE_EQUALS,      // Equal to value
  };
//--- input parameters
input uint                 InpPeriod      =  14;            /* Period         */
input int                  InpShift       =  0;             /* DEMA Shift     */
input ENUM_APPLIED_PRICE   InpPrice       =  PRICE_CLOSE;   /* Applied Price  */
//--- global variables
int      handle=INVALID_HANDLE;  // Indicator handle
int      period=0;               // DEMA calculation period
int      ind_digits=0;           // Number of decimal places in the indicator values
string   ind_title;              // Indicator description
When using the dashboard in the EA, declare global variables and include the panel class file:
//+------------------------------------------------------------------+
//|                                                TestTrendDEMA.mq5 |
//|                                  Copyright 2023, MetaQuotes Ltd. |
//|                                             https://www.mql5.com |
//+------------------------------------------------------------------+
#property copyright "Copyright 2023, MetaQuotes Ltd."
#property link      "https://www.mql5.com"
#property version   "1.00"
//--- includes
#include <Dashboard\Dashboard.mqh>
//--- enums
enum ENUM_LINE_STATE
  {
   LINE_STATE_NONE,        // Undefined state
   LINE_STATE_UP,          // Upward
   LINE_STATE_DOWN,        // Downward
   LINE_STATE_TURN_UP,     // Upward reversal
   LINE_STATE_TURN_DOWN,   // Downward reversal
   LINE_STATE_STOP_UP,     // Upward stop
   LINE_STATE_STOP_DOWN,   // Downward stop
   LINE_STATE_ABOVE,       // Above value
   LINE_STATE_UNDER,       // Below value
   LINE_STATE_CROSS_UP,    // Crossing value upwards
   LINE_STATE_CROSS_DOWN,  // Crossing value downwards
   LINE_STATE_TOUCH_BELOW, // Touching value from below
   LINE_STATE_TOUCH_ABOVE, // Touch value from above
   LINE_STATE_EQUALS,      // Equal to value
  };
//--- input parameters
input uint                 InpPeriod      =  14;            /* Period         */
input int                  InpShift       =  0;             /* DEMA Shift     */
input ENUM_APPLIED_PRICE   InpPrice       =  PRICE_CLOSE;   /* Applied Price  */
//--- global variables
int      handle=INVALID_HANDLE;  // Indicator handle
int      period=0;               // DEMA calculation period
int      ind_digits=0;           // Number of decimal places in the indicator values
string   ind_title;              // Indicator description
//--- variables for the panel
int      mouse_bar_index;        // Index of the bar the data is taken from
CDashboard *panel=NULL;          // Pointer to the panel object
Initialization
Setting the values of global variables for the indicator and creating its handle:
//+------------------------------------------------------------------+
//| Expert initialization function                                   |
//+------------------------------------------------------------------+
int OnInit()
  {
//--- create timer
   EventSetTimer(60);

//--- Indicator
//--- Set and adjust the calculation period and levels if necessary
   period=int(InpPeriod<1 ? 14 : InpPeriod);
//--- Set the indicator name and the number of decimal places
   ind_title=StringFormat("DEMA(%lu)",period);
   ind_digits=Digits()+1;
//--- Create indicator handle
   ResetLastError();
   handle=iDEMA(Symbol(),PERIOD_CURRENT,period,InpShift,InpPrice);
   if(handle==INVALID_HANDLE)
     {
      PrintFormat("%s: Failed to create indicator handle %s. Error %ld",__FUNCTION__,ind_title,GetLastError());
      return INIT_FAILED;
     }

//--- Successful initialization
   return(INIT_SUCCEEDED);
  }
If the EA involves using the dashboard, we should create it:
//+------------------------------------------------------------------+
//| Expert initialization function                                   |
//+------------------------------------------------------------------+
int OnInit()
  {
//--- create timer
   EventSetTimer(60);

//--- Indicator
//--- Set and adjust the calculation period and levels if necessary
   period=int(InpPeriod<1 ? 14 : InpPeriod);
//--- Set the indicator name and the number of decimal places
   ind_title=StringFormat("DEMA(%lu)",period);
   ind_digits=Digits()+1;
//--- Create indicator handle
   ResetLastError();
   handle=iDEMA(Symbol(),PERIOD_CURRENT,period,InpShift,InpPrice);
   if(handle==INVALID_HANDLE)
     {
      PrintFormat("%s: Failed to create indicator handle %s. Error %ld",__FUNCTION__,ind_title,GetLastError());
      return INIT_FAILED;
     }

//--- Dashboard
//--- Create the panel
   panel=new CDashboard(1,20,20,197,225);
   if(panel==NULL)
     {
      Print("Error. Failed to create panel object");
      return INIT_FAILED;
     }
//--- Set font parameters
   panel.SetFontParams("Calibri",9);
//--- Display the panel with the "Symbol, Timeframe description" header text
   panel.View(Symbol()+", "+StringSubstr(EnumToString(Period()),7));
//--- Create a table with ID 0 to display bar data in it
   panel.CreateNewTable(0);
//--- Draw a table with ID 0 on the panel background
   panel.DrawGrid(0,2,20,6,2,18,96);

//--- Create a table with ID 1 to display indicator data in it
   panel.CreateNewTable(1);
//--- Get the Y2 table coordinate with ID 0 and
//--- set the Y1 coordinate for the table with ID 1
   int y1=panel.TableY2(0)+22;
//--- Draw a table with ID 1 on the panel background
   panel.DrawGrid(1,2,y1,3,2,18,96);

//--- Display tabular data in the journal
   panel.GridPrint(0,2);
   panel.GridPrint(1,2);
//--- Initialize the variable with the index of the mouse cursor bar
   mouse_bar_index=0;
//--- Display the data of the current bar on the panel
   DrawData(mouse_bar_index,TimeCurrent());

//--- Successful initialization
   return(INIT_SUCCEEDED);
  }
Deinitialization
Release the indicator handle in the EA OnDeinit() handle:
//+------------------------------------------------------------------+
//| Expert deinitialization function                                 |
//+------------------------------------------------------------------+
void OnDeinit(const int reason)
  {
//--- destroy timer
   EventKillTimer();

//--- Release handle of the indicator
   ResetLastError();
   if(!IndicatorRelease(handle))
      PrintFormat("%s: IndicatorRelease failed. Error %ld",__FUNCTION__,GetLastError());
//--- Clear all comments on the chart
   Comment("");
  }
The created dashboard object is removed when using the dashboard:
//+------------------------------------------------------------------+
//| Expert deinitialization function                                 |
//+------------------------------------------------------------------+
void OnDeinit(const int reason)
  {
//--- destroy timer
   EventKillTimer();

//--- Release handle of the indicator
   ResetLastError();
   if(!IndicatorRelease(handle))
      PrintFormat("%s: IndicatorRelease failed. Error %ld",__FUNCTION__,GetLastError());
//--- Clear all comments on the chart
   Comment("");

//--- If the panel object exists, delete it
   if(panel!=NULL)
      delete panel;
  }
Data retrieval
General functions for obtaining data by the indicator handle:
//+------------------------------------------------------------------+
//| Return the indicator data on the specified bar                   |
//+------------------------------------------------------------------+
double IndicatorValue(const int ind_handle,const int index,const int buffer_num)
  {
   double array[1]={0};
   ResetLastError();
   if(CopyBuffer(ind_handle,buffer_num,index,1,array)!=1)
     {
      PrintFormat("%s: CopyBuffer failed. Error %ld",__FUNCTION__,GetLastError());
      return EMPTY_VALUE;
     }
   return array[0];
  }
//+------------------------------------------------------------------+
//| Return the state of the indicator line                           |
//+------------------------------------------------------------------+
ENUM_LINE_STATE LineState(const int ind_handle,const int index,const int buffer_num)
  {
//--- Get the values of the indicator line with the shift (0,1,2) relative to the passed index
   const double value0=IndicatorValue(ind_handle,index,  buffer_num);
   const double value1=IndicatorValue(ind_handle,index+1,buffer_num);
   const double value2=IndicatorValue(ind_handle,index+2,buffer_num);
//--- If at least one of the values could not be obtained, return an undefined value
   if(value0==EMPTY_VALUE || value1==EMPTY_VALUE || value2==EMPTY_VALUE)
      return LINE_STATE_NONE;
//--- Line upward reversal (value2>value1 && value0>value1)
   if(NormalizeDouble(value2-value1,ind_digits)>0 && NormalizeDouble(value0-value1,ind_digits)>0)
      return LINE_STATE_TURN_UP;
//--- Line upward direction (value2<=value1 && value0>value1)
   else if(NormalizeDouble(value2-value1,ind_digits)<=0 && NormalizeDouble(value0-value1,ind_digits)>0)
      return LINE_STATE_UP;
//--- Line upward stop (value2<=value1 && value0==value1)
   else if(NormalizeDouble(value2-value1,ind_digits)<=0 && NormalizeDouble(value0-value1,ind_digits)==0)
      return LINE_STATE_STOP_UP;
//--- Line downward reversal (value2<value1 && value0<value1)
   if(NormalizeDouble(value2-value1,ind_digits)<0 && NormalizeDouble(value0-value1,ind_digits)<0)
      return LINE_STATE_TURN_DOWN;
//--- Line downward direction (value2>=value1 && value0<value1)
   else if(NormalizeDouble(value2-value1,ind_digits)>=0 && NormalizeDouble(value0-value1,ind_digits)<0)
      return LINE_STATE_DOWN;
//--- Line downward stop (value2>=value1 && value0==value1)
   else if(NormalizeDouble(value2-value1,ind_digits)>=0 && NormalizeDouble(value0-value1,ind_digits)==0)
      return LINE_STATE_STOP_DOWN;
//--- Undefined state
   return LINE_STATE_NONE;
  }
//+------------------------------------------------------------------+
//| Return the state of the line relative to the specified level     |
//+------------------------------------------------------------------+
ENUM_LINE_STATE LineStateRelative(const int ind_handle,const int index,const int buffer_num,const double level0,const double level1=EMPTY_VALUE)
  {
//--- Get the values of the indicator line with the shift (0,1) relative to the passed index
   const double value0=IndicatorValue(ind_handle,index,  buffer_num);
   const double value1=IndicatorValue(ind_handle,index+1,buffer_num);
//--- If at least one of the values could not be obtained, return an undefined value
   if(value0==EMPTY_VALUE || value1==EMPTY_VALUE)
      return LINE_STATE_NONE;
//--- Define the second level to compare
   double level=(level1==EMPTY_VALUE ? level0 : level1);
//--- The line is below the level (value1<level && value0<level0)
   if(NormalizeDouble(value1-level,ind_digits)<0 && NormalizeDouble(value0-level0,ind_digits)<0)
      return LINE_STATE_UNDER;
//--- The line is above the level (value1>level && value0>level0)
   if(NormalizeDouble(value1-level,ind_digits)>0 && NormalizeDouble(value0-level0,ind_digits)>0)
      return LINE_STATE_ABOVE;
//--- The line crossed the level upwards (value1<=level && value0>level0)
   if(NormalizeDouble(value1-level,ind_digits)<=0 && NormalizeDouble(value0-level0,ind_digits)>0)
      return LINE_STATE_CROSS_UP;
//--- The line crossed the level downwards (value1>=level && value0<level0)
   if(NormalizeDouble(value1-level,ind_digits)>=0 && NormalizeDouble(value0-level0,ind_digits)<0)
      return LINE_STATE_CROSS_DOWN;
//--- The line touched the level from below (value1<level0 && value0==level0)
   if(NormalizeDouble(value1-level,ind_digits)<0 && NormalizeDouble(value0-level0,ind_digits)==0)
      return LINE_STATE_TOUCH_BELOW;
//--- The line touched the level from above (value1>level0 && value0==level0)
   if(NormalizeDouble(value1-level,ind_digits)>0 && NormalizeDouble(value0-level0,ind_digits)==0)
      return LINE_STATE_TOUCH_BELOW;
//--- Line is equal to the level value (value1==level0 && value0==level0)
   if(NormalizeDouble(value1-level,ind_digits)==0 && NormalizeDouble(value0-level0,ind_digits)==0)
      return LINE_STATE_EQUALS;
//--- Undefined state
   return LINE_STATE_NONE;
  }
//+------------------------------------------------------------------+
//| Return the indicator line state description                      |
//+------------------------------------------------------------------+
string LineStateDescription(const ENUM_LINE_STATE state)
  {
   switch(state)
     {
      case LINE_STATE_UP         :  return "Up";
      case LINE_STATE_STOP_UP    :  return "Stop Up";
      case LINE_STATE_TURN_UP    :  return "Turn Up";
      case LINE_STATE_DOWN       :  return "Down";
      case LINE_STATE_STOP_DOWN  :  return "Stop Down";
      case LINE_STATE_TURN_DOWN  :  return "Turn Down";
      case LINE_STATE_ABOVE      :  return "Above level";
      case LINE_STATE_UNDER      :  return "Under level";
      case LINE_STATE_CROSS_UP   :  return "Crossing Up";
      case LINE_STATE_CROSS_DOWN :  return "Crossing Down";
      case LINE_STATE_TOUCH_BELOW:  return "Touch from Below";
      case LINE_STATE_TOUCH_ABOVE:  return "Touch from Above";
      case LINE_STATE_EQUALS     :  return "Equals";
      default                    :  return "Unknown";
     }
  }
When using the dashboard, data is displayed on the panel using the function:
//+------------------------------------------------------------------+
//| Display data from the specified timeseries index to the panel    |
//+------------------------------------------------------------------+
void DrawData(const int index,const datetime time)
  {
//--- Declare the variables to receive data in them
   MqlTick  tick={0};
   MqlRates rates[1];

//--- Exit if unable to get the current prices
   if(!SymbolInfoTick(Symbol(),tick))
      return;
//--- Exit if unable to get the bar data by the specified index
   if(CopyRates(Symbol(),PERIOD_CURRENT,index,1,rates)!=1)
      return;

//--- Set font parameters for bar and indicator data headers
   int  size=0;
   uint flags=0;
   uint angle=0;
   string name=panel.FontParams(size,flags,angle);
   panel.SetFontParams(name,9,FW_BOLD);
   panel.DrawText("Bar data ["+(string)index+"]",3,panel.TableY1(0)-16,clrMaroon,panel.Width()-6);
   panel.DrawText("Indicator data ["+(string)index+"]",3,panel.TableY1(1)-16,clrGreen,panel.Width()-6);
//--- Set font parameters for bar and indicator data
   panel.SetFontParams(name,9);

//--- Display the data of the specified bar in table 0 on the panel
   panel.DrawText("Date",  panel.CellX(0,0,0)+2, panel.CellY(0,0,0)+2); panel.DrawText(TimeToString(  rates[0].time,TIME_DATE),     panel.CellX(0,0,1)+2, panel.CellY(0,0,1)+2,clrNONE,90);
   panel.DrawText("Time",  panel.CellX(0,1,0)+2, panel.CellY(0,1,0)+2); panel.DrawText(TimeToString(  rates[0].time,TIME_MINUTES),  panel.CellX(0,1,1)+2, panel.CellY(0,1,1)+2,clrNONE,90);
   panel.DrawText("Open",  panel.CellX(0,2,0)+2, panel.CellY(0,2,0)+2); panel.DrawText(DoubleToString(rates[0].open,Digits()),      panel.CellX(0,2,1)+2, panel.CellY(0,2,1)+2,clrNONE,90);
   panel.DrawText("High",  panel.CellX(0,3,0)+2, panel.CellY(0,3,0)+2); panel.DrawText(DoubleToString(rates[0].high,Digits()),      panel.CellX(0,3,1)+2, panel.CellY(0,3,1)+2,clrNONE,90);
   panel.DrawText("Low",   panel.CellX(0,4,0)+2, panel.CellY(0,4,0)+2); panel.DrawText(DoubleToString(rates[0].low,Digits()),       panel.CellX(0,4,1)+2, panel.CellY(0,4,1)+2,clrNONE,90);
   panel.DrawText("Close", panel.CellX(0,5,0)+2, panel.CellY(0,5,0)+2); panel.DrawText(DoubleToString(rates[0].close,Digits()),     panel.CellX(0,5,1)+2, panel.CellY(0,5,1)+2,clrNONE,90);

//--- Display the indicator data from the specified bar on the panel in table 1
   panel.DrawText(ind_title, panel.CellX(1,0,0)+2, panel.CellY(1,0,0)+2);
   double value=IndicatorValue(handle,index,0);
   string value_str=(value!=EMPTY_VALUE ? DoubleToString(value,ind_digits) : "");
   panel.DrawText(value_str,panel.CellX(1,0,1)+2,panel.CellY(1,0,1)+2,clrNONE,100);

//--- Display a description of the indicator line state
   panel.DrawText("Line state", panel.CellX(1,1,0)+2, panel.CellY(1,1,0)+2);
   ENUM_LINE_STATE state=LineState(handle,index,0);
   panel.DrawText(LineStateDescription(state),panel.CellX(1,1,1)+2,panel.CellY(1,1,1)+2,clrNONE,90);

//--- Redraw the chart to immediately display all changes on the panel
   ChartRedraw(ChartID());
  }
Besides, when using the dashboard, the panel events handler is called in the OnChartEvent() EA event handler, as well as the events for receiving the bar index under the cursor are handled:
//+------------------------------------------------------------------+
//| ChartEvent function                                              |
//+------------------------------------------------------------------+
void OnChartEvent(const int id,
                  const long &lparam,
                  const double &dparam,
                  const string &sparam)
  {
//--- Handling the panel
//--- Call the panel event handler
   panel.OnChartEvent(id,lparam,dparam,sparam);

//--- If the cursor moves or a click is made on the chart
   if(id==CHARTEVENT_MOUSE_MOVE || id==CHARTEVENT_CLICK)
     {
      //--- Declare the variables to record time and price coordinates in them
      datetime time=0;
      double price=0;
      int wnd=0;
      //--- If the cursor coordinates are converted to date and time
      if(ChartXYToTimePrice(ChartID(),(int)lparam,(int)dparam,wnd,time,price))
        {
         //--- write the bar index where the cursor is located to a global variable
         mouse_bar_index=iBarShift(Symbol(),PERIOD_CURRENT,time);
         //--- Display the bar data under the cursor on the panel
         DrawData(mouse_bar_index,time);
        }
     }

//--- If we received a custom event, display the appropriate message in the journal
   if(id>CHARTEVENT_CUSTOM)
     {
      //--- Here we can implement handling a click on the close button on the panel
      PrintFormat("%s: Event id=%ld, object id (lparam): %lu, event message (sparam): %s",__FUNCTION__,id,lparam,sparam);
     }
  }
After compiling the EA and launching it on the chart, we can monitor the state of the indicator value and line on the panel:
You can view the TestTrendDEMA.mq5 test EA in the files attached to the article
Envelopes
Envelopes technical indicator (Envelopes) is formed with two moving averages, one of which is shifted upward and another one is shifted downward. The selection of optimum relative number of band margins shifting is determined with the market volatility: the higher the latter is, the stronger the shift is.
Envelopes define the upper and the lower margins of the price range. Signal to sell appears when the price reaches the upper margin of the band; signal to buy appears when the price reaches the lower margin.
The logic behind envelopes is that overzealous buyers and sellers push the price to the extremes (i.e., the upper and lower bands), at which point the prices often stabilize by moving to more realistic levels. This is similar to the interpretation of Bollinger Bands® (BB).
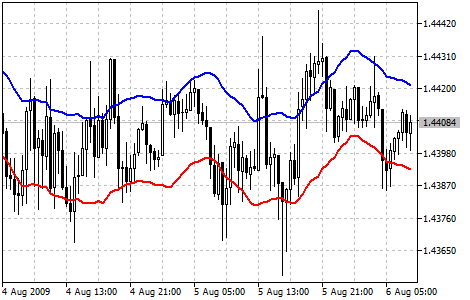
Parameters
iEnvelopes() function is used to create the indicator handle:
Return Envelopes indicator handle.
int  iEnvelopes(
   string              symbol,            // symbol name
   ENUM_TIMEFRAMES     period,            // period
   int                 ma_period,         // central line calculation period
   int                 ma_shift,          // horizontal shift of the indicator
   ENUM_MA_METHOD      ma_method,         // smoothing type
   ENUM_APPLIED_PRICE  applied_price,     // price type or handle
   double              deviation          // deviation of channel borders from the central line
   );
[in] The symbol name of the financial instrument whose data is to be used to calculate the indicator. NULL means the current symbol.
period
[in] The period value can be one of the ENUM_TIMEFRAMES enumeration values, 0 means the current timeframe.
ma_period
[in] The averaging period of the main line of the indicator.
ma_shift
[in] Shift of the indicator in relation to the price chart.
ma_method
[in] Averaging method. Any of the ENUM_MA_METHOD enumeration values.
applied_price
[in] Applied price. Any of the ENUM_APPLIED_PRICE price constants or another indicator handle.
deviation
[in] Percent deviation from main line.
Return the handle of the specified technical indicator. If failed, return INVALID_HANDLE. To free up computer memory from an unused indicator, use IndicatorRelease() the indicator handle is passed to.
Buffer indexes: 0 — UPPER_LINE, 1 — LOWER_LINE.
Declare input and global variables in the EA to create the indicator:
//+------------------------------------------------------------------+
//|                                           TestTrendEnvelopes.mq5 |
//|                                  Copyright 2023, MetaQuotes Ltd. |
//|                                             https://www.mql5.com |
//+------------------------------------------------------------------+
#property copyright "Copyright 2023, MetaQuotes Ltd."
#property link      "https://www.mql5.com"
#property version   "1.00"
//--- enums
enum ENUM_LINE_STATE
  {
   LINE_STATE_NONE,        // Undefined state
   LINE_STATE_UP,          // Upward
   LINE_STATE_DOWN,        // Downward
   LINE_STATE_TURN_UP,     // Upward reversal
   LINE_STATE_TURN_DOWN,   // Downward reversal
   LINE_STATE_STOP_UP,     // Upward stop
   LINE_STATE_STOP_DOWN,   // Downward stop
   LINE_STATE_ABOVE,       // Above value
   LINE_STATE_UNDER,       // Below value
   LINE_STATE_CROSS_UP,    // Crossing value upwards
   LINE_STATE_CROSS_DOWN,  // Crossing value downwards
   LINE_STATE_TOUCH_BELOW, // Touching value from below
   LINE_STATE_TOUCH_ABOVE, // Touch value from above
   LINE_STATE_EQUALS,      // Equal to value
  };
//--- input parameters
input uint                 InpPeriod   =  14;            /* Period         */
input double               InpDeviation=  0.1;           /* Deviation      */
input int                  InpShift    =  0;             /* Shift          */
input ENUM_MA_METHOD       InpMethod   =  MODE_SMA;      /* Method         */
input ENUM_APPLIED_PRICE   InpPrice    =  PRICE_CLOSE;   /* Applied Price  */
//--- global variables
int      handle=INVALID_HANDLE;  // Indicator handle
int      period=0;               // Envelopes calculation period
int      ind_digits=0;           // Number of decimal places in the indicator values
string   ind_title;              // Indicator description
When using the dashboard in the EA, declare global variables and include the panel class file:
//+------------------------------------------------------------------+
//|                                           TestTrendEnvelopes.mq5 |
//|                                  Copyright 2023, MetaQuotes Ltd. |
//|                                             https://www.mql5.com |
//+------------------------------------------------------------------+
#property copyright "Copyright 2023, MetaQuotes Ltd."
#property link      "https://www.mql5.com"
#property version   "1.00"
//--- includes
#include <Dashboard\Dashboard.mqh>
//--- enums
enum ENUM_LINE_STATE
  {
   LINE_STATE_NONE,        // Undefined state
   LINE_STATE_UP,          // Upward
   LINE_STATE_DOWN,        // Downward
   LINE_STATE_TURN_UP,     // Upward reversal
   LINE_STATE_TURN_DOWN,   // Downward reversal
   LINE_STATE_STOP_UP,     // Upward stop
   LINE_STATE_STOP_DOWN,   // Downward stop
   LINE_STATE_ABOVE,       // Above value
   LINE_STATE_UNDER,       // Below value
   LINE_STATE_CROSS_UP,    // Crossing value upwards
   LINE_STATE_CROSS_DOWN,  // Crossing value downwards
   LINE_STATE_TOUCH_BELOW, // Touching value from below
   LINE_STATE_TOUCH_ABOVE, // Touch value from above
   LINE_STATE_EQUALS,      // Equal to value
  };
//--- input parameters
input uint                 InpPeriod   =  14;            /* Period         */
input double               InpDeviation=  0.1;           /* Deviation      */
input int                  InpShift    =  0;             /* Shift          */
input ENUM_MA_METHOD       InpMethod   =  MODE_SMA;      /* Method         */
input ENUM_APPLIED_PRICE   InpPrice    =  PRICE_CLOSE;   /* Applied Price  */
//--- global variables
int      handle=INVALID_HANDLE;  // Indicator handle
int      period=0;               // Envelopes calculation period
int      ind_digits=0;           // Number of decimal places in the indicator values
string   ind_title;              // Indicator description
//--- variables for the panel
int      mouse_bar_index;        // Index of the bar the data is taken from
CDashboard *panel=NULL;          // Pointer to the panel object
Initialization
Setting the values of global variables for the indicator and creating its handle:
//+------------------------------------------------------------------+
//| Expert initialization function                                   |
//+------------------------------------------------------------------+
int OnInit()
  {
//--- create timer
   EventSetTimer(60);

//--- Indicator
//--- Set and adjust the calculation period and levels if necessary
   period=int(InpPeriod<1 ? 14 : InpPeriod);
//--- Set the indicator name and the number of decimal places
   ind_title=StringFormat("Envelopes(%lu)",period);
   ind_digits=Digits()+1;
//--- Create indicator handle
   ResetLastError();
   handle=iEnvelopes(Symbol(),PERIOD_CURRENT,period,InpShift,InpMethod,InpPrice,InpDeviation);
   if(handle==INVALID_HANDLE)
     {
      PrintFormat("%s: Failed to create indicator handle %s. Error %ld",__FUNCTION__,ind_title,GetLastError());
      return INIT_FAILED;
     }

//--- Successful initialization
   return(INIT_SUCCEEDED);
  }
If the EA involves using the dashboard, we should create it:
//+------------------------------------------------------------------+
//| Expert initialization function                                   |
//+------------------------------------------------------------------+
int OnInit()
  {
//--- create timer
   EventSetTimer(60);

//--- Indicator
//--- Set and adjust the calculation period and levels if necessary
   period=int(InpPeriod<1 ? 14 : InpPeriod);
//--- Set the indicator name and the number of decimal places
   ind_title=StringFormat("Envelopes(%lu)",period);
   ind_digits=Digits()+1;
//--- Create indicator handle
   ResetLastError();
   handle=iEnvelopes(Symbol(),PERIOD_CURRENT,period,InpShift,InpMethod,InpPrice,InpDeviation);
   if(handle==INVALID_HANDLE)
     {
      PrintFormat("%s: Failed to create indicator handle %s. Error %ld",__FUNCTION__,ind_title,GetLastError());
      return INIT_FAILED;
     }

//--- Dashboard
//--- Create the panel
   panel=new CDashboard(1,20,20,257,225);
   if(panel==NULL)
     {
      Print("Error. Failed to create panel object");
      return INIT_FAILED;
     }
//--- Set font parameters
   panel.SetFontParams("Calibri",9);
//--- Display the panel with the "Symbol, Timeframe description" header text
   panel.View(Symbol()+", "+StringSubstr(EnumToString(Period()),7));
//--- Create a table with ID 0 to display bar data in it
   panel.CreateNewTable(0);
//--- Draw a table with ID 0 on the panel background
   panel.DrawGrid(0,2,20,6,2,18,126);

//--- Create a table with ID 1 to display indicator data in it
   panel.CreateNewTable(1);
//--- Get the Y2 table coordinate with ID 0 and
//--- set the Y1 coordinate for the table with ID 1
   int y1=panel.TableY2(0)+22;
//--- Draw a table with ID 1 on the panel background
   panel.DrawGrid(1,2,y1,3,2,18,126);

//--- Display tabular data in the journal
   panel.GridPrint(0,2);
   panel.GridPrint(1,2);
//--- Initialize the variable with the index of the mouse cursor bar
   mouse_bar_index=0;
//--- Display the data of the current bar on the panel
   DrawData(mouse_bar_index,TimeCurrent());

//--- Successful initialization
   return(INIT_SUCCEEDED);
  }
Deinitialization
Release the indicator handle in the EA OnDeinit() handle:
//+------------------------------------------------------------------+
//| Expert deinitialization function                                 |
//+------------------------------------------------------------------+
void OnDeinit(const int reason)
  {
//--- destroy timer
   EventKillTimer();

//--- Release handle of the indicator
   ResetLastError();
   if(!IndicatorRelease(handle))
      PrintFormat("%s: IndicatorRelease failed. Error %ld",__FUNCTION__,GetLastError());
//--- Clear all comments on the chart
   Comment("");
  }
The created dashboard object is removed when using the dashboard:
//+------------------------------------------------------------------+
//| Expert deinitialization function                                 |
//+------------------------------------------------------------------+
void OnDeinit(const int reason)
  {
//--- destroy timer
   EventKillTimer();

//--- Release handle of the indicator
   ResetLastError();
   if(!IndicatorRelease(handle))
      PrintFormat("%s: IndicatorRelease failed. Error %ld",__FUNCTION__,GetLastError());
//--- Clear all comments on the chart
   Comment("");

//--- If the panel object exists, delete it
   if(panel!=NULL)
      delete panel;
  }
Data retrieval
General functions for obtaining data by the indicator handle:
//+------------------------------------------------------------------+
//| Return the indicator data on the specified bar                   |
//+------------------------------------------------------------------+
double IndicatorValue(const int ind_handle,const int index,const int buffer_num)
  {
   double array[1]={0};
   ResetLastError();
   if(CopyBuffer(ind_handle,buffer_num,index,1,array)!=1)
     {
      PrintFormat("%s: CopyBuffer failed. Error %ld",__FUNCTION__,GetLastError());
      return EMPTY_VALUE;
     }
   return array[0];
  }
//+------------------------------------------------------------------+
//| Return the state of the indicator line                           |
//+------------------------------------------------------------------+
ENUM_LINE_STATE LineState(const int ind_handle,const int index,const int buffer_num)
  {
//--- Get the values of the indicator line with the shift (0,1,2) relative to the passed index
   const double value0=IndicatorValue(ind_handle,index,  buffer_num);
   const double value1=IndicatorValue(ind_handle,index+1,buffer_num);
   const double value2=IndicatorValue(ind_handle,index+2,buffer_num);
//--- If at least one of the values could not be obtained, return an undefined value
   if(value0==EMPTY_VALUE || value1==EMPTY_VALUE || value2==EMPTY_VALUE)
      return LINE_STATE_NONE;
//--- Line upward reversal (value2>value1 && value0>value1)
   if(NormalizeDouble(value2-value1,ind_digits)>0 && NormalizeDouble(value0-value1,ind_digits)>0)
      return LINE_STATE_TURN_UP;
//--- Line upward direction (value2<=value1 && value0>value1)
   else if(NormalizeDouble(value2-value1,ind_digits)<=0 && NormalizeDouble(value0-value1,ind_digits)>0)
      return LINE_STATE_UP;
//--- Line upward stop (value2<=value1 && value0==value1)
   else if(NormalizeDouble(value2-value1,ind_digits)<=0 && NormalizeDouble(value0-value1,ind_digits)==0)
      return LINE_STATE_STOP_UP;
//--- Line downward reversal (value2<value1 && value0<value1)
   if(NormalizeDouble(value2-value1,ind_digits)<0 && NormalizeDouble(value0-value1,ind_digits)<0)
      return LINE_STATE_TURN_DOWN;
//--- Line downward direction (value2>=value1 && value0<value1)
   else if(NormalizeDouble(value2-value1,ind_digits)>=0 && NormalizeDouble(value0-value1,ind_digits)<0)
      return LINE_STATE_DOWN;
//--- Line downward stop (value2>=value1 && value0==value1)
   else if(NormalizeDouble(value2-value1,ind_digits)>=0 && NormalizeDouble(value0-value1,ind_digits)==0)
      return LINE_STATE_STOP_DOWN;
//--- Undefined state
   return LINE_STATE_NONE;
  }
//+------------------------------------------------------------------+
//| Return the state of the line relative to the specified level     |
//+------------------------------------------------------------------+
ENUM_LINE_STATE LineStateRelative(const int ind_handle,const int index,const int buffer_num,const double level0,const double level1=EMPTY_VALUE)
  {
//--- Get the values of the indicator line with the shift (0,1) relative to the passed index
   const double value0=IndicatorValue(ind_handle,index,  buffer_num);
   const double value1=IndicatorValue(ind_handle,index+1,buffer_num);
//--- If at least one of the values could not be obtained, return an undefined value
   if(value0==EMPTY_VALUE || value1==EMPTY_VALUE)
      return LINE_STATE_NONE;
//--- Define the second level to compare
   double level=(level1==EMPTY_VALUE ? level0 : level1);
//--- The line is below the level (value1<level && value0<level0)
   if(NormalizeDouble(value1-level,ind_digits)<0 && NormalizeDouble(value0-level0,ind_digits)<0)
      return LINE_STATE_UNDER;
//--- The line is above the level (value1>level && value0>level0)
   if(NormalizeDouble(value1-level,ind_digits)>0 && NormalizeDouble(value0-level0,ind_digits)>0)
      return LINE_STATE_ABOVE;
//--- The line crossed the level upwards (value1<=level && value0>level0)
   if(NormalizeDouble(value1-level,ind_digits)<=0 && NormalizeDouble(value0-level0,ind_digits)>0)
      return LINE_STATE_CROSS_UP;
//--- The line crossed the level downwards (value1>=level && value0<level0)
   if(NormalizeDouble(value1-level,ind_digits)>=0 && NormalizeDouble(value0-level0,ind_digits)<0)
      return LINE_STATE_CROSS_DOWN;
//--- The line touched the level from below (value1<level0 && value0==level0)
   if(NormalizeDouble(value1-level,ind_digits)<0 && NormalizeDouble(value0-level0,ind_digits)==0)
      return LINE_STATE_TOUCH_BELOW;
//--- The line touched the level from above (value1>level0 && value0==level0)
   if(NormalizeDouble(value1-level,ind_digits)>0 && NormalizeDouble(value0-level0,ind_digits)==0)
      return LINE_STATE_TOUCH_BELOW;
//--- Line is equal to the level value (value1==level0 && value0==level0)
   if(NormalizeDouble(value1-level,ind_digits)==0 && NormalizeDouble(value0-level0,ind_digits)==0)
      return LINE_STATE_EQUALS;
//--- Undefined state
   return LINE_STATE_NONE;
  }
//+------------------------------------------------------------------+
//| Return the indicator line state description                      |
//+------------------------------------------------------------------+
string LineStateDescription(const ENUM_LINE_STATE state)
  {
   switch(state)
     {
      case LINE_STATE_UP         :  return "Up";
      case LINE_STATE_STOP_UP    :  return "Stop Up";
      case LINE_STATE_TURN_UP    :  return "Turn Up";
      case LINE_STATE_DOWN       :  return "Down";
      case LINE_STATE_STOP_DOWN  :  return "Stop Down";
      case LINE_STATE_TURN_DOWN  :  return "Turn Down";
      case LINE_STATE_ABOVE      :  return "Above level";
      case LINE_STATE_UNDER      :  return "Under level";
      case LINE_STATE_CROSS_UP   :  return "Crossing Up";
      case LINE_STATE_CROSS_DOWN :  return "Crossing Down";
      case LINE_STATE_TOUCH_BELOW:  return "Touch from Below";
      case LINE_STATE_TOUCH_ABOVE:  return "Touch from Above";
      case LINE_STATE_EQUALS     :  return "Equals";
      default                    :  return "Unknown";
     }
  }
When using the dashboard, data is displayed on the panel using the function:
//+------------------------------------------------------------------+
//| Display data from the specified timeseries index to the panel    |
//+------------------------------------------------------------------+
void DrawData(const int index,const datetime time)
  {
//--- Declare the variables to receive data in them
   MqlTick  tick={0};
   MqlRates rates[1];

//--- Exit if unable to get the current prices
   if(!SymbolInfoTick(Symbol(),tick))
      return;
//--- Exit if unable to get the bar data by the specified index
   if(CopyRates(Symbol(),PERIOD_CURRENT,index,1,rates)!=1)
      return;

//--- Set font parameters for bar and indicator data headers
   int  size=0;
   uint flags=0;
   uint angle=0;
   string name=panel.FontParams(size,flags,angle);
   panel.SetFontParams(name,9,FW_BOLD);
   panel.DrawText("Bar data ["+(string)index+"]",3,panel.TableY1(0)-16,clrMaroon,panel.Width()-6);
   panel.DrawText("Indicator data ["+(string)index+"]",3,panel.TableY1(1)-16,clrGreen,panel.Width()-6);
//--- Set font parameters for bar and indicator data
   panel.SetFontParams(name,9);

//--- Display the data of the specified bar in table 0 on the panel
   panel.DrawText("Date",  panel.CellX(0,0,0)+2, panel.CellY(0,0,0)+2); panel.DrawText(TimeToString(  rates[0].time,TIME_DATE),     panel.CellX(0,0,1)+2, panel.CellY(0,0,1)+2,clrNONE,90);
   panel.DrawText("Time",  panel.CellX(0,1,0)+2, panel.CellY(0,1,0)+2); panel.DrawText(TimeToString(  rates[0].time,TIME_MINUTES),  panel.CellX(0,1,1)+2, panel.CellY(0,1,1)+2,clrNONE,90);
   panel.DrawText("Open",  panel.CellX(0,2,0)+2, panel.CellY(0,2,0)+2); panel.DrawText(DoubleToString(rates[0].open,Digits()),      panel.CellX(0,2,1)+2, panel.CellY(0,2,1)+2,clrNONE,90);
   panel.DrawText("High",  panel.CellX(0,3,0)+2, panel.CellY(0,3,0)+2); panel.DrawText(DoubleToString(rates[0].high,Digits()),      panel.CellX(0,3,1)+2, panel.CellY(0,3,1)+2,clrNONE,90);
   panel.DrawText("Low",   panel.CellX(0,4,0)+2, panel.CellY(0,4,0)+2); panel.DrawText(DoubleToString(rates[0].low,Digits()),       panel.CellX(0,4,1)+2, panel.CellY(0,4,1)+2,clrNONE,90);
   panel.DrawText("Close", panel.CellX(0,5,0)+2, panel.CellY(0,5,0)+2); panel.DrawText(DoubleToString(rates[0].close,Digits()),     panel.CellX(0,5,1)+2, panel.CellY(0,5,1)+2,clrNONE,90);

//--- Display the Envelopes Upper line data from the specified bar on the panel in table 1
   panel.DrawText(ind_title+" Upper", panel.CellX(1,0,0)+2, panel.CellY(1,0,0)+2);
   double value=IndicatorValue(handle,index,UPPER_LINE);
   string value_str=(value!=EMPTY_VALUE ? DoubleToString(value,ind_digits) : "");
   panel.DrawText(value_str,panel.CellX(1,0,1)+2,panel.CellY(1,0,1)+2,clrNONE,100);

//--- Display the Envelopes Lower line data from the specified bar on the panel in table 1
   panel.DrawText(ind_title+" Lower", panel.CellX(1,1,0)+2, panel.CellY(1,1,0)+2);
   double value_dip=IndicatorValue(handle,index,LOWER_LINE);
   string value_dip_str=(value_dip!=EMPTY_VALUE ? DoubleToString(value_dip,ind_digits) : "");
   panel.DrawText(value_dip_str,panel.CellX(1,1,1)+2,panel.CellY(1,1,1)+2,clrNONE,100);

//--- Redraw the chart to immediately display all changes on the panel
   ChartRedraw(ChartID());
  }
Besides, when using the dashboard, the panel events handler is called in the OnChartEvent() EA event handler, as well as the events for receiving the bar index under the cursor are handled:
//+------------------------------------------------------------------+
//| ChartEvent function                                              |
//+------------------------------------------------------------------+
void OnChartEvent(const int id,
                  const long &lparam,
                  const double &dparam,
                  const string &sparam)
  {
//--- Handling the panel
//--- Call the panel event handler
   panel.OnChartEvent(id,lparam,dparam,sparam);

//--- If the cursor moves or a click is made on the chart
   if(id==CHARTEVENT_MOUSE_MOVE || id==CHARTEVENT_CLICK)
     {
      //--- Declare the variables to record time and price coordinates in them
      datetime time=0;
      double price=0;
      int wnd=0;
      //--- If the cursor coordinates are converted to date and time
      if(ChartXYToTimePrice(ChartID(),(int)lparam,(int)dparam,wnd,time,price))
        {
         //--- write the bar index where the cursor is located to a global variable
         mouse_bar_index=iBarShift(Symbol(),PERIOD_CURRENT,time);
         //--- Display the bar data under the cursor on the panel
         DrawData(mouse_bar_index,time);
        }
     }

//--- If we received a custom event, display the appropriate message in the journal
   if(id>CHARTEVENT_CUSTOM)
     {
      //--- Here we can implement handling a click on the close button on the panel
      PrintFormat("%s: Event id=%ld, object id (lparam): %lu, event message (sparam): %s",__FUNCTION__,id,lparam,sparam);
     }
  }
After compiling the EA and launching it on the chart, we can monitor the state of the indicator value and line on the panel:
You can view the TestTrendEnvelopes.mq5 test EA in the files attached to the article.
Fractal Adaptive Moving Average
Fractal Adaptive Moving Average (FRAMA) was developed by John Ehlers. This indicator is built on the basis of the exponential moving average algorithm, where the smoothing factor is calculated based on the current fractal dimension of the price range. The FRAMA indicator follows strong trend movements and slows down significantly during price consolidation.
All types of analysis used to work with moving averages can be applied to this indicator as well.
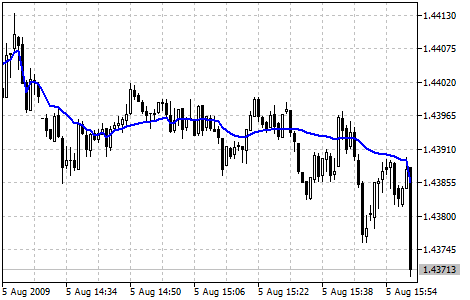
Parameters
iFrAMA() function is used to create the indicator handle:
Return the handle of the Fractal Adaptive Moving Average indicator. Only one buffer.
int  iFrAMA(
   string              symbol,            // symbol name
   ENUM_TIMEFRAMES     period,            // period
   int                 ma_period,         // averaging period
   int                 ma_shift,          // horizontal shift of the indicator
   ENUM_APPLIED_PRICE  applied_price      // price type or handle
   );
[in] The symbol name of the financial instrument whose data is to be used to calculate the indicator. NULL means the current symbol.
period
[in] The period value can be one of the ENUM_TIMEFRAMES enumeration values, 0 means the current timeframe.
ma_period
[in] Period (number of bars) for the indicator calculation.
ma_shift
[in] Shift of the indicator in relation to the price chart.
applied_price
[in] Applied price. Any of the ENUM_APPLIED_PRICE price constants or another indicator handle.
Return the handle of the specified technical indicator. If failed, return INVALID_HANDLE. To free up computer memory from an unused indicator, use IndicatorRelease() the indicator handle is passed to.
Declare input and global variables in the EA to create the indicator:
//+------------------------------------------------------------------+
//|                                               TestTrendFRAMA.mq5 |
//|                                  Copyright 2023, MetaQuotes Ltd. |
//|                                             https://www.mql5.com |
//+------------------------------------------------------------------+
#property copyright "Copyright 2023, MetaQuotes Ltd."
#property link      "https://www.mql5.com"
#property version   "1.00"
//--- enums
enum ENUM_LINE_STATE
  {
   LINE_STATE_NONE,        // Undefined state
   LINE_STATE_UP,          // Upward
   LINE_STATE_DOWN,        // Downward
   LINE_STATE_TURN_UP,     // Upward reversal
   LINE_STATE_TURN_DOWN,   // Downward reversal
   LINE_STATE_STOP_UP,     // Upward stop
   LINE_STATE_STOP_DOWN,   // Downward stop
   LINE_STATE_ABOVE,       // Above value
   LINE_STATE_UNDER,       // Below value
   LINE_STATE_CROSS_UP,    // Crossing value upwards
   LINE_STATE_CROSS_DOWN,  // Crossing value downwards
   LINE_STATE_TOUCH_BELOW, // Touching value from below
   LINE_STATE_TOUCH_ABOVE, // Touch value from above
   LINE_STATE_EQUALS,      // Equal to value
  };
//--- input parameters
input uint                 InpPeriod      =  14;            /* Period         */
input int                  InpShift       =  0;             /* FRAMA Shift    */
input ENUM_APPLIED_PRICE   InpPrice       =  PRICE_CLOSE;   /* Applied Price  */
//--- global variables
int      handle=INVALID_HANDLE;  // Indicator handle
int      period=0;               // FRAMA calculation period
int      ind_digits=0;           // Number of decimal places in the indicator values
string   ind_title;              // Indicator description
When using the dashboard in the EA, declare global variables and include the panel class file:
//+------------------------------------------------------------------+
//|                                               TestTrendFRAMA.mq5 |
//|                                  Copyright 2023, MetaQuotes Ltd. |
//|                                             https://www.mql5.com |
//+------------------------------------------------------------------+
#property copyright "Copyright 2023, MetaQuotes Ltd."
#property link      "https://www.mql5.com"
#property version   "1.00"
//--- includes
#include <Dashboard\Dashboard.mqh>
//--- enums
enum ENUM_LINE_STATE
  {
   LINE_STATE_NONE,        // Undefined state
   LINE_STATE_UP,          // Upward
   LINE_STATE_DOWN,        // Downward
   LINE_STATE_TURN_UP,     // Upward reversal
   LINE_STATE_TURN_DOWN,   // Downward reversal
   LINE_STATE_STOP_UP,     // Upward stop
   LINE_STATE_STOP_DOWN,   // Downward stop
   LINE_STATE_ABOVE,       // Above value
   LINE_STATE_UNDER,       // Below value
   LINE_STATE_CROSS_UP,    // Crossing value upwards
   LINE_STATE_CROSS_DOWN,  // Crossing value downwards
   LINE_STATE_TOUCH_BELOW, // Touching value from below
   LINE_STATE_TOUCH_ABOVE, // Touch value from above
   LINE_STATE_EQUALS,      // Equal to value
  };
//--- input parameters
input uint                 InpPeriod      =  14;            /* Period         */
input int                  InpShift       =  0;             /* FRAMA Shift    */
input ENUM_APPLIED_PRICE   InpPrice       =  PRICE_CLOSE;   /* Applied Price  */
//--- global variables
int      handle=INVALID_HANDLE;  // Indicator handle
int      period=0;               // FRAMA calculation period
int      ind_digits=0;           // Number of decimal places in the indicator values
string   ind_title;              // Indicator description
//--- variables for the panel
int      mouse_bar_index;        // Index of the bar the data is taken from
CDashboard *panel=NULL;          // Pointer to the panel object
Initialization
Setting the values of global variables for the indicator and creating its handle:
//+------------------------------------------------------------------+
//| Expert initialization function                                   |
//+------------------------------------------------------------------+
int OnInit()
  {
//--- create timer
   EventSetTimer(60);

//--- Indicator
//--- Set and adjust the calculation period and levels if necessary
   period=int(InpPeriod<1 ? 14 : InpPeriod);
//--- Set the indicator name and the number of decimal places
   ind_title=StringFormat("FRAMA(%lu)",period);
   ind_digits=Digits()+1;
//--- Create indicator handle
   ResetLastError();
   handle=iFrAMA(Symbol(),PERIOD_CURRENT,period,InpShift,InpPrice);
   if(handle==INVALID_HANDLE)
     {
      PrintFormat("%s: Failed to create indicator handle %s. Error %ld",__FUNCTION__,ind_title,GetLastError());
      return INIT_FAILED;
     }

//--- Successful initialization
   return(INIT_SUCCEEDED);
  }
If the EA involves using the dashboard, we should create it:
//+------------------------------------------------------------------+
//| Expert initialization function                                   |
//+------------------------------------------------------------------+
int OnInit()
  {
//--- create timer
   EventSetTimer(60);

//--- Indicator
//--- Set and adjust the calculation period and levels if necessary
   period=int(InpPeriod<1 ? 14 : InpPeriod);
//--- Set the indicator name and the number of decimal places
   ind_title=StringFormat("FRAMA(%lu)",period);
   ind_digits=Digits()+1;
//--- Create indicator handle
   ResetLastError();
   handle=iFrAMA(Symbol(),PERIOD_CURRENT,period,InpShift,InpPrice);
   if(handle==INVALID_HANDLE)
     {
      PrintFormat("%s: Failed to create indicator handle %s. Error %ld",__FUNCTION__,ind_title,GetLastError());
      return INIT_FAILED;
     }

//--- Dashboard
//--- Create the panel
   panel=new CDashboard(1,20,20,197,225);
   if(panel==NULL)
     {
      Print("Error. Failed to create panel object");
      return INIT_FAILED;
     }
//--- Set font parameters
   panel.SetFontParams("Calibri",9);
//--- Display the panel with the "Symbol, Timeframe description" header text
   panel.View(Symbol()+", "+StringSubstr(EnumToString(Period()),7));
//--- Create a table with ID 0 to display bar data in it
   panel.CreateNewTable(0);
//--- Draw a table with ID 0 on the panel background
   panel.DrawGrid(0,2,20,6,2,18,96);

//--- Create a table with ID 1 to display indicator data in it
   panel.CreateNewTable(1);
//--- Get the Y2 table coordinate with ID 0 and
//--- set the Y1 coordinate for the table with ID 1
   int y1=panel.TableY2(0)+22;
//--- Draw a table with ID 1 on the panel background
   panel.DrawGrid(1,2,y1,3,2,18,96);

//--- Display tabular data in the journal
   panel.GridPrint(0,2);
   panel.GridPrint(1,2);
//--- Initialize the variable with the index of the mouse cursor bar
   mouse_bar_index=0;
//--- Display the data of the current bar on the panel
   DrawData(mouse_bar_index,TimeCurrent());

//--- Successful initialization
   return(INIT_SUCCEEDED);
  }
Deinitialization
Release the indicator handle in the EA OnDeinit() handle:
//+------------------------------------------------------------------+
//| Expert deinitialization function                                 |
//+------------------------------------------------------------------+
void OnDeinit(const int reason)
  {
//--- destroy timer
   EventKillTimer();

//--- Release handle of the indicator
   ResetLastError();
   if(!IndicatorRelease(handle))
      PrintFormat("%s: IndicatorRelease failed. Error %ld",__FUNCTION__,GetLastError());
//--- Clear all comments on the chart
   Comment("");
  }
The created dashboard object is removed when using the dashboard:
//+------------------------------------------------------------------+
//| Expert deinitialization function                                 |
//+------------------------------------------------------------------+
void OnDeinit(const int reason)
  {
//--- destroy timer
   EventKillTimer();

//--- Release handle of the indicator
   ResetLastError();
   if(!IndicatorRelease(handle))
      PrintFormat("%s: IndicatorRelease failed. Error %ld",__FUNCTION__,GetLastError());
//--- Clear all comments on the chart
   Comment("");

//--- If the panel object exists, delete it
   if(panel!=NULL)
      delete panel;
  }
Data retrieval
General functions for obtaining data by the indicator handle:
//+------------------------------------------------------------------+
//| Return the indicator data on the specified bar                   |
//+------------------------------------------------------------------+
double IndicatorValue(const int ind_handle,const int index,const int buffer_num)
  {
   double array[1]={0};
   ResetLastError();
   if(CopyBuffer(ind_handle,buffer_num,index,1,array)!=1)
     {
      PrintFormat("%s: CopyBuffer failed. Error %ld",__FUNCTION__,GetLastError());
      return EMPTY_VALUE;
     }
   return array[0];
  }
//+------------------------------------------------------------------+
//| Return the state of the indicator line                           |
//+------------------------------------------------------------------+
ENUM_LINE_STATE LineState(const int ind_handle,const int index,const int buffer_num)
  {
//--- Get the values of the indicator line with the shift (0,1,2) relative to the passed index
   const double value0=IndicatorValue(ind_handle,index,  buffer_num);
   const double value1=IndicatorValue(ind_handle,index+1,buffer_num);
   const double value2=IndicatorValue(ind_handle,index+2,buffer_num);
//--- If at least one of the values could not be obtained, return an undefined value
   if(value0==EMPTY_VALUE || value1==EMPTY_VALUE || value2==EMPTY_VALUE)
      return LINE_STATE_NONE;
//--- Line upward reversal (value2>value1 && value0>value1)
   if(NormalizeDouble(value2-value1,ind_digits)>0 && NormalizeDouble(value0-value1,ind_digits)>0)
      return LINE_STATE_TURN_UP;
//--- Line upward direction (value2<=value1 && value0>value1)
   else if(NormalizeDouble(value2-value1,ind_digits)<=0 && NormalizeDouble(value0-value1,ind_digits)>0)
      return LINE_STATE_UP;
//--- Line upward stop (value2<=value1 && value0==value1)
   else if(NormalizeDouble(value2-value1,ind_digits)<=0 && NormalizeDouble(value0-value1,ind_digits)==0)
      return LINE_STATE_STOP_UP;
//--- Line downward reversal (value2<value1 && value0<value1)
   if(NormalizeDouble(value2-value1,ind_digits)<0 && NormalizeDouble(value0-value1,ind_digits)<0)
      return LINE_STATE_TURN_DOWN;
//--- Line downward direction (value2>=value1 && value0<value1)
   else if(NormalizeDouble(value2-value1,ind_digits)>=0 && NormalizeDouble(value0-value1,ind_digits)<0)
      return LINE_STATE_DOWN;
//--- Line downward stop (value2>=value1 && value0==value1)
   else if(NormalizeDouble(value2-value1,ind_digits)>=0 && NormalizeDouble(value0-value1,ind_digits)==0)
      return LINE_STATE_STOP_DOWN;
//--- Undefined state
   return LINE_STATE_NONE;
  }
//+------------------------------------------------------------------+
//| Return the state of the line relative to the specified level     |
//+------------------------------------------------------------------+
ENUM_LINE_STATE LineStateRelative(const int ind_handle,const int index,const int buffer_num,const double level0,const double level1=EMPTY_VALUE)
  {
//--- Get the values of the indicator line with the shift (0,1) relative to the passed index
   const double value0=IndicatorValue(ind_handle,index,  buffer_num);
   const double value1=IndicatorValue(ind_handle,index+1,buffer_num);
//--- If at least one of the values could not be obtained, return an undefined value
   if(value0==EMPTY_VALUE || value1==EMPTY_VALUE)
      return LINE_STATE_NONE;
//--- Define the second level to compare
   double level=(level1==EMPTY_VALUE ? level0 : level1);
//--- The line is below the level (value1<level && value0<level0)
   if(NormalizeDouble(value1-level,ind_digits)<0 && NormalizeDouble(value0-level0,ind_digits)<0)
      return LINE_STATE_UNDER;
//--- The line is above the level (value1>level && value0>level0)
   if(NormalizeDouble(value1-level,ind_digits)>0 && NormalizeDouble(value0-level0,ind_digits)>0)
      return LINE_STATE_ABOVE;
//--- The line crossed the level upwards (value1<=level && value0>level0)
   if(NormalizeDouble(value1-level,ind_digits)<=0 && NormalizeDouble(value0-level0,ind_digits)>0)
      return LINE_STATE_CROSS_UP;
//--- The line crossed the level downwards (value1>=level && value0<level0)
   if(NormalizeDouble(value1-level,ind_digits)>=0 && NormalizeDouble(value0-level0,ind_digits)<0)
      return LINE_STATE_CROSS_DOWN;
//--- The line touched the level from below (value1<level0 && value0==level0)
   if(NormalizeDouble(value1-level,ind_digits)<0 && NormalizeDouble(value0-level0,ind_digits)==0)
      return LINE_STATE_TOUCH_BELOW;
//--- The line touched the level from above (value1>level0 && value0==level0)
   if(NormalizeDouble(value1-level,ind_digits)>0 && NormalizeDouble(value0-level0,ind_digits)==0)
      return LINE_STATE_TOUCH_BELOW;
//--- Line is equal to the level value (value1==level0 && value0==level0)
   if(NormalizeDouble(value1-level,ind_digits)==0 && NormalizeDouble(value0-level0,ind_digits)==0)
      return LINE_STATE_EQUALS;
//--- Undefined state
   return LINE_STATE_NONE;
  }
//+------------------------------------------------------------------+
//| Return the indicator line state description                      |
//+------------------------------------------------------------------+
string LineStateDescription(const ENUM_LINE_STATE state)
  {
   switch(state)
     {
      case LINE_STATE_UP         :  return "Up";
      case LINE_STATE_STOP_UP    :  return "Stop Up";
      case LINE_STATE_TURN_UP    :  return "Turn Up";
      case LINE_STATE_DOWN       :  return "Down";
      case LINE_STATE_STOP_DOWN  :  return "Stop Down";
      case LINE_STATE_TURN_DOWN  :  return "Turn Down";
      case LINE_STATE_ABOVE      :  return "Above level";
      case LINE_STATE_UNDER      :  return "Under level";
      case LINE_STATE_CROSS_UP   :  return "Crossing Up";
      case LINE_STATE_CROSS_DOWN :  return "Crossing Down";
      case LINE_STATE_TOUCH_BELOW:  return "Touch from Below";
      case LINE_STATE_TOUCH_ABOVE:  return "Touch from Above";
      case LINE_STATE_EQUALS     :  return "Equals";
      default                    :  return "Unknown";
     }
  }
When using the dashboard, data is displayed on the panel using the function:
//+------------------------------------------------------------------+
//| Display data from the specified timeseries index to the panel    |
//+------------------------------------------------------------------+
void DrawData(const int index,const datetime time)
  {
//--- Declare the variables to receive data in them
   MqlTick  tick={0};
   MqlRates rates[1];

//--- Exit if unable to get the current prices
   if(!SymbolInfoTick(Symbol(),tick))
      return;
//--- Exit if unable to get the bar data by the specified index
   if(CopyRates(Symbol(),PERIOD_CURRENT,index,1,rates)!=1)
      return;

//--- Set font parameters for bar and indicator data headers
   int  size=0;
   uint flags=0;
   uint angle=0;
   string name=panel.FontParams(size,flags,angle);
   panel.SetFontParams(name,9,FW_BOLD);
   panel.DrawText("Bar data ["+(string)index+"]",3,panel.TableY1(0)-16,clrMaroon,panel.Width()-6);
   panel.DrawText("Indicator data ["+(string)index+"]",3,panel.TableY1(1)-16,clrGreen,panel.Width()-6);
//--- Set font parameters for bar and indicator data
   panel.SetFontParams(name,9);

//--- Display the data of the specified bar in table 0 on the panel
   panel.DrawText("Date",  panel.CellX(0,0,0)+2, panel.CellY(0,0,0)+2); panel.DrawText(TimeToString(  rates[0].time,TIME_DATE),     panel.CellX(0,0,1)+2, panel.CellY(0,0,1)+2,clrNONE,90);
   panel.DrawText("Time",  panel.CellX(0,1,0)+2, panel.CellY(0,1,0)+2); panel.DrawText(TimeToString(  rates[0].time,TIME_MINUTES),  panel.CellX(0,1,1)+2, panel.CellY(0,1,1)+2,clrNONE,90);
   panel.DrawText("Open",  panel.CellX(0,2,0)+2, panel.CellY(0,2,0)+2); panel.DrawText(DoubleToString(rates[0].open,Digits()),      panel.CellX(0,2,1)+2, panel.CellY(0,2,1)+2,clrNONE,90);
   panel.DrawText("High",  panel.CellX(0,3,0)+2, panel.CellY(0,3,0)+2); panel.DrawText(DoubleToString(rates[0].high,Digits()),      panel.CellX(0,3,1)+2, panel.CellY(0,3,1)+2,clrNONE,90);
   panel.DrawText("Low",   panel.CellX(0,4,0)+2, panel.CellY(0,4,0)+2); panel.DrawText(DoubleToString(rates[0].low,Digits()),       panel.CellX(0,4,1)+2, panel.CellY(0,4,1)+2,clrNONE,90);
   panel.DrawText("Close", panel.CellX(0,5,0)+2, panel.CellY(0,5,0)+2); panel.DrawText(DoubleToString(rates[0].close,Digits()),     panel.CellX(0,5,1)+2, panel.CellY(0,5,1)+2,clrNONE,90);

//--- Display the indicator data from the specified bar on the panel in table 1
   panel.DrawText(ind_title, panel.CellX(1,0,0)+2, panel.CellY(1,0,0)+2);
   double value=IndicatorValue(handle,index,0);
   string value_str=(value!=EMPTY_VALUE ? DoubleToString(value,ind_digits) : "");
   panel.DrawText(value_str,panel.CellX(1,0,1)+2,panel.CellY(1,0,1)+2,clrNONE,100);

//--- Display a description of the indicator line state
   panel.DrawText("Line state", panel.CellX(1,1,0)+2, panel.CellY(1,1,0)+2);
   ENUM_LINE_STATE state=LineState(handle,index,0);
   panel.DrawText(LineStateDescription(state),panel.CellX(1,1,1)+2,panel.CellY(1,1,1)+2,clrNONE,90);

//--- Redraw the chart to immediately display all changes on the panel
   ChartRedraw(ChartID());
  }
Besides, when using the dashboard, the panel events handler is called in the OnChartEvent() EA event handler, as well as the events for receiving the bar index under the cursor are handled:
//+------------------------------------------------------------------+
//| ChartEvent function                                              |
//+------------------------------------------------------------------+
void OnChartEvent(const int id,
                  const long &lparam,
                  const double &dparam,
                  const string &sparam)
  {
//--- Handling the panel
//--- Call the panel event handler
   panel.OnChartEvent(id,lparam,dparam,sparam);

//--- If the cursor moves or a click is made on the chart
   if(id==CHARTEVENT_MOUSE_MOVE || id==CHARTEVENT_CLICK)
     {
      //--- Declare the variables to record time and price coordinates in them
      datetime time=0;
      double price=0;
      int wnd=0;
      //--- If the cursor coordinates are converted to date and time
      if(ChartXYToTimePrice(ChartID(),(int)lparam,(int)dparam,wnd,time,price))
        {
         //--- write the bar index where the cursor is located to a global variable
         mouse_bar_index=iBarShift(Symbol(),PERIOD_CURRENT,time);
         //--- Display the bar data under the cursor on the panel
         DrawData(mouse_bar_index,time);
        }
     }

//--- If we received a custom event, display the appropriate message in the journal
   if(id>CHARTEVENT_CUSTOM)
     {
      //--- Here we can implement handling a click on the close button on the panel
      PrintFormat("%s: Event id=%ld, object id (lparam): %lu, event message (sparam): %s",__FUNCTION__,id,lparam,sparam);
     }
  }
After compiling the EA and launching it on the chart, we can monitor the state of the indicator value and line on the panel:
You can view the TestTrendFRAMA.mq5 test EA in the files attached to the article.
Ichimoku Kinko Hyo
Ichimoku Kinko Hyo Technical Indicator is predefined to characterize the market Trend, Support and Resistance Levels, and to generate signals of buying and selling. This indicator works best at weekly and daily charts.
When defining the dimension of parameters, four time intervals of different length are used. The values of individual lines composing this indicator are based on these intervals:
- Tenkan-sen shows the average price value during the first time interval defined as the sum of maximum and minimum within this time, divided by two;
- Kijun-sen shows the average price value during the second time interval;
- Senkou Span A shows the middle of the distance between two previous lines shifted forwards by the value of the second time interval;
- Senkou Span B shows the average price value during the third time interval shifted forwards by the value of the second time interval.
Chikou Span shows the closing price of the current candle shifted backwards by the value of the second time interval. The distance between the Senkou lines is hatched with another color and called "cloud". If the price is between these lines, the market should be considered as non-trend, and then the cloud margins form the support and resistance levels.
- If the price is above the cloud, its upper line forms the first support level, and the second line forms the second support level;
- If the price is below cloud, the lower line forms the first resistance level, and the upper one forms the second level;
- If the Chikou Span line traverses the price chart in the bottom-up direction it is signal to buy. If the Chikou Span line traverses the price chart in the top-down direction it is signal to sell.
Kijun-sen is used as an indicator of the market movement. If the price is higher than this indicator, the prices will probably continue to increase. When the price traverses this line the further trend changing is possible. Another kind of using the Kijun-sen is giving signals. The signal to buy is generated when the Tenkan-sen line crosses the Kijun-sen bottom-up. Top-down direction is the signal to sell. Tenkan-sen is used as an indicator of the market trend. If this line increases or decreases, the trend exists. When it goes horizontally, it means that the market has come into the channel.
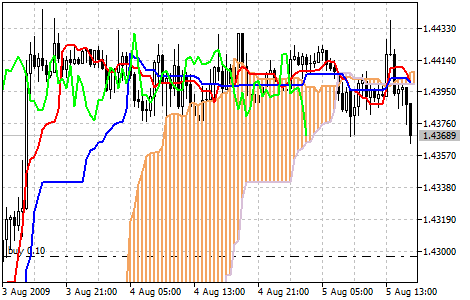
Parameters
iIchimoku() function is used to create the indicator handle:
Returns the Ichimoku Kinko Hyo indicator handle.
int  iIchimoku(
   string           symbol,            // symbol name
   ENUM_TIMEFRAMES  period,            // period
   int              tenkan_sen,        // Tenkan-sen period
   int              kijun_sen,         // Kijun-sen period
   int              senkou_span_b      // Senkou Span B period
   );
[in] The symbol name of the financial instrument whose data is to be used to calculate the indicator. NULL means the current symbol.
period
[in] The period value can be one of the ENUM_TIMEFRAMES enumeration values, 0 means the current timeframe.
tenkan_sen
[in] Tenkan Sen averaging period.
kijun_sen
[in] Kijun Sen averaging period.
senkou_span_b
[in] Senkou Span B averaging period.
Return the handle of the specified technical indicator. If failed, return INVALID_HANDLE. To free up computer memory from an unused indicator, use IndicatorRelease() the indicator handle is passed to.
Buffer indexes: 0 — TENKANSEN_LINE, 1 — KIJUNSEN_LINE, 2 — SENKOUSPANA_LINE, 3 — SENKOUSPANB_LINE, 4 — CHIKOUSPAN_LINE.
Declare input and global variables in the EA to create the indicator:
//+------------------------------------------------------------------+
//|                                            TestTrendIchimoku.mq5 |
//|                                  Copyright 2023, MetaQuotes Ltd. |
//|                                             https://www.mql5.com |
//+------------------------------------------------------------------+
#property copyright "Copyright 2023, MetaQuotes Ltd."
#property link      "https://www.mql5.com"
#property version   "1.00"
//--- enums
enum ENUM_LINE_STATE
  {
   LINE_STATE_NONE,        // Undefined state
   LINE_STATE_UP,          // Upward
   LINE_STATE_DOWN,        // Downward
   LINE_STATE_TURN_UP,     // Upward reversal
   LINE_STATE_TURN_DOWN,   // Downward reversal
   LINE_STATE_STOP_UP,     // Upward stop
   LINE_STATE_STOP_DOWN,   // Downward stop
   LINE_STATE_ABOVE,       // Above value
   LINE_STATE_UNDER,       // Below value
   LINE_STATE_CROSS_UP,    // Crossing value upwards
   LINE_STATE_CROSS_DOWN,  // Crossing value downwards
   LINE_STATE_TOUCH_BELOW, // Touching value from below
   LINE_STATE_TOUCH_ABOVE, // Touch value from above
   LINE_STATE_EQUALS,      // Equal to value
  };
//--- input parameters
input uint                 InpPeriodTenkan=  9;    /* Tenkan-sen     */
input uint                 InpPeriodKijun =  26;   /* Kijun-sen      */
input uint                 InpPeriodSpanB =  52;   /* Senkou Span B  */
//--- global variables
int      handle=INVALID_HANDLE;  // Indicator handle
int      period_tenkan=0;        // Tenkan-sen line calculation period
int      period_kijun=0;         // Kijun-sen line calculation period
int      period_spanb=0;         // Senkou Span B line calculation period
int      ind_digits=0;           // Number of decimal places in the indicator values
string   ind_title;              // Indicator description
When using the dashboard in the EA, declare global variables and include the panel class file:
//+------------------------------------------------------------------+
//|                                            TestTrendIchimoku.mq5 |
//|                                  Copyright 2023, MetaQuotes Ltd. |
//|                                             https://www.mql5.com |
//+------------------------------------------------------------------+
#property copyright "Copyright 2023, MetaQuotes Ltd."
#property link      "https://www.mql5.com"
#property version   "1.00"
//--- includes
#include <Dashboard\Dashboard.mqh>
//--- enums
enum ENUM_LINE_STATE
  {
   LINE_STATE_NONE,        // Undefined state
   LINE_STATE_UP,          // Upward
   LINE_STATE_DOWN,        // Downward
   LINE_STATE_TURN_UP,     // Upward reversal
   LINE_STATE_TURN_DOWN,   // Downward reversal
   LINE_STATE_STOP_UP,     // Upward stop
   LINE_STATE_STOP_DOWN,   // Downward stop
   LINE_STATE_ABOVE,       // Above value
   LINE_STATE_UNDER,       // Below value
   LINE_STATE_CROSS_UP,    // Crossing value upwards
   LINE_STATE_CROSS_DOWN,  // Crossing value downwards
   LINE_STATE_TOUCH_BELOW, // Touching value from below
   LINE_STATE_TOUCH_ABOVE, // Touch value from above
   LINE_STATE_EQUALS,      // Equal to value
  };
//--- input parameters
input uint                 InpPeriodTenkan=  9;    /* Tenkan-sen     */
input uint                 InpPeriodKijun =  26;   /* Kijun-sen      */
input uint                 InpPeriodSpanB =  52;   /* Senkou Span B  */
//--- global variables
int      handle=INVALID_HANDLE;  // Indicator handle
int      period_tenkan=0;        // Tenkan-sen line calculation period
int      period_kijun=0;         // Kijun-sen line calculation period
int      period_spanb=0;         // Senkou Span B line calculation period
int      ind_digits=0;           // Number of decimal places in the indicator values
string   ind_title;              // Indicator description
//--- variables for the panel
int      mouse_bar_index;        // Index of the bar the data is taken from
CDashboard *panel=NULL;          // Pointer to the panel object
Initialization
Setting the values of global variables for the indicator and creating its handle:
//+------------------------------------------------------------------+
//| Expert initialization function                                   |
//+------------------------------------------------------------------+
int OnInit()
  {
//--- create timer
   EventSetTimer(60);

//--- Indicator
//--- Set and adjust the calculation period if necessary
   period_tenkan=int(InpPeriodTenkan<1 ? 9 : InpPeriodTenkan);
   period_kijun=int(InpPeriodKijun<1 ? 26 : InpPeriodKijun);
   period_spanb=int(InpPeriodSpanB<1 ? 52 : InpPeriodSpanB);
//--- Set the indicator name and the number of decimal places
   ind_title=StringFormat("Ichimoku Kinko Hyo (%lu,%lu,%lu)",period_tenkan,period_kijun,period_spanb);
   ind_digits=Digits()+1;
//--- Create indicator handle
   ResetLastError();
   handle=iIchimoku(Symbol(),PERIOD_CURRENT,period_tenkan,period_kijun,period_spanb);
   if(handle==INVALID_HANDLE)
     {
      PrintFormat("%s: Failed to create indicator handle %s. Error %ld",__FUNCTION__,ind_title,GetLastError());
      return INIT_FAILED;
     }

//--- Successful initialization
   return(INIT_SUCCEEDED);
  }
If the EA involves using the dashboard, we should create it:
//+------------------------------------------------------------------+
//| Expert initialization function                                   |
//+------------------------------------------------------------------+
int OnInit()
  {
//--- create timer
   EventSetTimer(60);

//--- Indicator
//--- Set and adjust the calculation period if necessary
   period_tenkan=int(InpPeriodTenkan<1 ? 9 : InpPeriodTenkan);
   period_kijun=int(InpPeriodKijun<1 ? 26 : InpPeriodKijun);
   period_spanb=int(InpPeriodSpanB<1 ? 52 : InpPeriodSpanB);
//--- Set the indicator name and the number of decimal places
   ind_title=StringFormat("Ichimoku Kinko Hyo (%lu,%lu,%lu)",period_tenkan,period_kijun,period_spanb);
   ind_digits=Digits()+1;
//--- Create indicator handle
   ResetLastError();
   handle=iIchimoku(Symbol(),PERIOD_CURRENT,period_tenkan,period_kijun,period_spanb);
   if(handle==INVALID_HANDLE)
     {
      PrintFormat("%s: Failed to create indicator handle %s. Error %ld",__FUNCTION__,ind_title,GetLastError());
      return INIT_FAILED;
     }

//--- Dashboard
//--- Create the panel
   panel=new CDashboard(1,20,20,229,261);
   if(panel==NULL)
     {
      Print("Error. Failed to create panel object");
      return INIT_FAILED;
     }
//--- Set font parameters
   panel.SetFontParams("Calibri",9);
//--- Display the panel with the "Symbol, Timeframe description" header text
   panel.View(Symbol()+", "+StringSubstr(EnumToString(Period()),7));
//--- Create a table with ID 0 to display bar data in it
   panel.CreateNewTable(0);
//--- Draw a table with ID 0 on the panel background
   panel.DrawGrid(0,2,20,6,2,18,112);

//--- Create a table with ID 1 to display indicator data in it
   panel.CreateNewTable(1);
//--- Get the Y2 table coordinate with ID 0 and
//--- set the Y1 coordinate for the table with ID 1
   int y1=panel.TableY2(0)+22;
//--- Draw a table with ID 1 on the panel background
   panel.DrawGrid(1,2,y1,5,2,18,112);

//--- Display tabular data in the journal
   panel.GridPrint(0,2);
   panel.GridPrint(1,2);
//--- Initialize the variable with the index of the mouse cursor bar
   mouse_bar_index=0;
//--- Display the data of the current bar on the panel
   DrawData(mouse_bar_index,TimeCurrent());

//--- Successful initialization
   return(INIT_SUCCEEDED);
  }
Deinitialization
Release the indicator handle in the EA OnDeinit() handle:
//+------------------------------------------------------------------+
//| Expert deinitialization function                                 |
//+------------------------------------------------------------------+
void OnDeinit(const int reason)
  {
//--- destroy timer
   EventKillTimer();

//--- Release handle of the indicator
   ResetLastError();
   if(!IndicatorRelease(handle))
      PrintFormat("%s: IndicatorRelease failed. Error %ld",__FUNCTION__,GetLastError());
//--- Clear all comments on the chart
   Comment("");
  }
The created dashboard object is removed when using the dashboard:
//+------------------------------------------------------------------+
//| Expert deinitialization function                                 |
//+------------------------------------------------------------------+
void OnDeinit(const int reason)
  {
//--- destroy timer
   EventKillTimer();

//--- Release handle of the indicator
   ResetLastError();
   if(!IndicatorRelease(handle))
      PrintFormat("%s: IndicatorRelease failed. Error %ld",__FUNCTION__,GetLastError());
//--- Clear all comments on the chart
   Comment("");

//--- If the panel object exists, delete it
   if(panel!=NULL)
      delete panel;
  }
Data retrieval
General functions for obtaining data by the indicator handle:
//+------------------------------------------------------------------+
//| Return the indicator data on the specified bar                   |
//+------------------------------------------------------------------+
double IndicatorValue(const int ind_handle,const int index,const int buffer_num)
  {
   double array[1]={0};
   ResetLastError();
   if(CopyBuffer(ind_handle,buffer_num,index,1,array)!=1)
     {
      PrintFormat("%s: CopyBuffer failed. Error %ld",__FUNCTION__,GetLastError());
      return EMPTY_VALUE;
     }
   return array[0];
  }
//+------------------------------------------------------------------+
//| Return the state of the indicator line                           |
//+------------------------------------------------------------------+
ENUM_LINE_STATE LineState(const int ind_handle,const int index,const int buffer_num)
  {
//--- Get the values of the indicator line with the shift (0,1,2) relative to the passed index
   const double value0=IndicatorValue(ind_handle,index,  buffer_num);
   const double value1=IndicatorValue(ind_handle,index+1,buffer_num);
   const double value2=IndicatorValue(ind_handle,index+2,buffer_num);
//--- If at least one of the values could not be obtained, return an undefined value
   if(value0==EMPTY_VALUE || value1==EMPTY_VALUE || value2==EMPTY_VALUE)
      return LINE_STATE_NONE;
//--- Line upward reversal (value2>value1 && value0>value1)
   if(NormalizeDouble(value2-value1,ind_digits)>0 && NormalizeDouble(value0-value1,ind_digits)>0)
      return LINE_STATE_TURN_UP;
//--- Line upward direction (value2<=value1 && value0>value1)
   else if(NormalizeDouble(value2-value1,ind_digits)<=0 && NormalizeDouble(value0-value1,ind_digits)>0)
      return LINE_STATE_UP;
//--- Line upward stop (value2<=value1 && value0==value1)
   else if(NormalizeDouble(value2-value1,ind_digits)<=0 && NormalizeDouble(value0-value1,ind_digits)==0)
      return LINE_STATE_STOP_UP;
//--- Line downward reversal (value2<value1 && value0<value1)
   if(NormalizeDouble(value2-value1,ind_digits)<0 && NormalizeDouble(value0-value1,ind_digits)<0)
      return LINE_STATE_TURN_DOWN;
//--- Line downward direction (value2>=value1 && value0<value1)
   else if(NormalizeDouble(value2-value1,ind_digits)>=0 && NormalizeDouble(value0-value1,ind_digits)<0)
      return LINE_STATE_DOWN;
//--- Line downward stop (value2>=value1 && value0==value1)
   else if(NormalizeDouble(value2-value1,ind_digits)>=0 && NormalizeDouble(value0-value1,ind_digits)==0)
      return LINE_STATE_STOP_DOWN;
//--- Undefined state
   return LINE_STATE_NONE;
  }
//+------------------------------------------------------------------+
//| Return the state of the line relative to the specified level     |
//+------------------------------------------------------------------+
ENUM_LINE_STATE LineStateRelative(const int ind_handle,const int index,const int buffer_num,const double level0,const double level1=EMPTY_VALUE)
  {
//--- Get the values of the indicator line with the shift (0,1) relative to the passed index
   const double value0=IndicatorValue(ind_handle,index,  buffer_num);
   const double value1=IndicatorValue(ind_handle,index+1,buffer_num);
//--- If at least one of the values could not be obtained, return an undefined value
   if(value0==EMPTY_VALUE || value1==EMPTY_VALUE)
      return LINE_STATE_NONE;
//--- Define the second level to compare
   double level=(level1==EMPTY_VALUE ? level0 : level1);
//--- The line is below the level (value1<level && value0<level0)
   if(NormalizeDouble(value1-level,ind_digits)<0 && NormalizeDouble(value0-level0,ind_digits)<0)
      return LINE_STATE_UNDER;
//--- The line is above the level (value1>level && value0>level0)
   if(NormalizeDouble(value1-level,ind_digits)>0 && NormalizeDouble(value0-level0,ind_digits)>0)
      return LINE_STATE_ABOVE;
//--- The line crossed the level upwards (value1<=level && value0>level0)
   if(NormalizeDouble(value1-level,ind_digits)<=0 && NormalizeDouble(value0-level0,ind_digits)>0)
      return LINE_STATE_CROSS_UP;
//--- The line crossed the level downwards (value1>=level && value0<level0)
   if(NormalizeDouble(value1-level,ind_digits)>=0 && NormalizeDouble(value0-level0,ind_digits)<0)
      return LINE_STATE_CROSS_DOWN;
//--- The line touched the level from below (value1<level0 && value0==level0)
   if(NormalizeDouble(value1-level,ind_digits)<0 && NormalizeDouble(value0-level0,ind_digits)==0)
      return LINE_STATE_TOUCH_BELOW;
//--- The line touched the level from above (value1>level0 && value0==level0)
   if(NormalizeDouble(value1-level,ind_digits)>0 && NormalizeDouble(value0-level0,ind_digits)==0)
      return LINE_STATE_TOUCH_BELOW;
//--- Line is equal to the level value (value1==level0 && value0==level0)
   if(NormalizeDouble(value1-level,ind_digits)==0 && NormalizeDouble(value0-level0,ind_digits)==0)
      return LINE_STATE_EQUALS;
//--- Undefined state
   return LINE_STATE_NONE;
  }
//+------------------------------------------------------------------+
//| Return the indicator line state description                      |
//+------------------------------------------------------------------+
string LineStateDescription(const ENUM_LINE_STATE state)
  {
   switch(state)
     {
      case LINE_STATE_UP         :  return "Up";
      case LINE_STATE_STOP_UP    :  return "Stop Up";
      case LINE_STATE_TURN_UP    :  return "Turn Up";
      case LINE_STATE_DOWN       :  return "Down";
      case LINE_STATE_STOP_DOWN  :  return "Stop Down";
      case LINE_STATE_TURN_DOWN  :  return "Turn Down";
      case LINE_STATE_ABOVE      :  return "Above level";
      case LINE_STATE_UNDER      :  return "Under level";
      case LINE_STATE_CROSS_UP   :  return "Crossing Up";
      case LINE_STATE_CROSS_DOWN :  return "Crossing Down";
      case LINE_STATE_TOUCH_BELOW:  return "Touch from Below";
      case LINE_STATE_TOUCH_ABOVE:  return "Touch from Above";
      case LINE_STATE_EQUALS     :  return "Equals";
      default                    :  return "Unknown";
     }
  }
When using the dashboard, data is displayed on the panel using the function:
//+------------------------------------------------------------------+
//| Display data from the specified timeseries index to the panel    |
//+------------------------------------------------------------------+
void DrawData(const int index,const datetime time)
  {
//--- Declare the variables to receive data in them
   MqlTick  tick={0};
   MqlRates rates[1];

//--- Exit if unable to get the current prices
   if(!SymbolInfoTick(Symbol(),tick))
      return;
//--- Exit if unable to get the bar data by the specified index
   if(CopyRates(Symbol(),PERIOD_CURRENT,index,1,rates)!=1)
      return;

//--- Set font parameters for bar and indicator data headers
   int  size=0;
   uint flags=0;
   uint angle=0;
   string name=panel.FontParams(size,flags,angle);
   panel.SetFontParams(name,9,FW_BOLD);
   panel.DrawText("Bar data ["+(string)index+"]",3,panel.TableY1(0)-16,clrMaroon,panel.Width()-6);
   panel.DrawText("Indicator data ["+(string)index+"]",3,panel.TableY1(1)-16,clrGreen,panel.Width()-6);
//--- Set font parameters for bar and indicator data
   panel.SetFontParams(name,9);

//--- Display the data of the specified bar in table 0 on the panel
   panel.DrawText("Date",  panel.CellX(0,0,0)+2, panel.CellY(0,0,0)+2); panel.DrawText(TimeToString(  rates[0].time,TIME_DATE),     panel.CellX(0,0,1)+2, panel.CellY(0,0,1)+2,clrNONE,90);
   panel.DrawText("Time",  panel.CellX(0,1,0)+2, panel.CellY(0,1,0)+2); panel.DrawText(TimeToString(  rates[0].time,TIME_MINUTES),  panel.CellX(0,1,1)+2, panel.CellY(0,1,1)+2,clrNONE,90);
   panel.DrawText("Open",  panel.CellX(0,2,0)+2, panel.CellY(0,2,0)+2); panel.DrawText(DoubleToString(rates[0].open,Digits()),      panel.CellX(0,2,1)+2, panel.CellY(0,2,1)+2,clrNONE,90);
   panel.DrawText("High",  panel.CellX(0,3,0)+2, panel.CellY(0,3,0)+2); panel.DrawText(DoubleToString(rates[0].high,Digits()),      panel.CellX(0,3,1)+2, panel.CellY(0,3,1)+2,clrNONE,90);
   panel.DrawText("Low",   panel.CellX(0,4,0)+2, panel.CellY(0,4,0)+2); panel.DrawText(DoubleToString(rates[0].low,Digits()),       panel.CellX(0,4,1)+2, panel.CellY(0,4,1)+2,clrNONE,90);
   panel.DrawText("Close", panel.CellX(0,5,0)+2, panel.CellY(0,5,0)+2); panel.DrawText(DoubleToString(rates[0].close,Digits()),     panel.CellX(0,5,1)+2, panel.CellY(0,5,1)+2,clrNONE,90);

//--- Get the indicator buffers data
   double tenkan=IndicatorValue(handle,index,TENKANSEN_LINE);     // Tenkan Sen line
   double kijun =IndicatorValue(handle,index,KIJUNSEN_LINE);      // Kijun Sen line
   double spana =IndicatorValue(handle,index,SENKOUSPANA_LINE);   // Senkou Span A line
   double spanb =IndicatorValue(handle,index,SENKOUSPANB_LINE);   // Senkou Span B line
   double chikou=IndicatorValue(handle,index,CHIKOUSPAN_LINE);    // Chikou Span line
   color clr=clrNONE;

//--- Display the Tenkan Sen line data from the specified bar on the panel in table 1
   string tenkan_str=StringFormat("Tenkan-sen(%lu)",period_tenkan);
   panel.DrawText(tenkan_str, panel.CellX(1,0,0)+2, panel.CellY(1,0,0)+2);
   string value_str=(tenkan!=EMPTY_VALUE ? DoubleToString(tenkan,ind_digits) : " ");
   ENUM_LINE_STATE state_tenkan=LineStateRelative(handle,index,TENKANSEN_LINE,kijun,IndicatorValue(handle,index+1,KIJUNSEN_LINE));
   clr=(state_tenkan==LINE_STATE_CROSS_UP ? clrBlue : state_tenkan==LINE_STATE_CROSS_DOWN ? clrRed : clrNONE);
   panel.DrawText(value_str,panel.CellX(1,0,1)+2,panel.CellY(1,0,1)+2,clr,100);

//--- Display the Kijun Sen line data from the specified bar on the panel in table 1
   string kijun_str=StringFormat("Kijun-sen(%lu)",period_kijun);
   panel.DrawText(kijun_str, panel.CellX(1,1,0)+2, panel.CellY(1,1,0)+2);
   value_str=(kijun!=EMPTY_VALUE ? DoubleToString(kijun,ind_digits) : " ");
   ENUM_LINE_STATE state_kijun=LineState(handle,index,KIJUNSEN_LINE);
   clr=
     (
      state_kijun==LINE_STATE_UP || state_kijun==LINE_STATE_TURN_UP ? clrBlue :
      state_kijun==LINE_STATE_DOWN || state_kijun==LINE_STATE_TURN_DOWN ? clrRed : clrNONE
     );
   panel.DrawText(value_str,panel.CellX(1,1,1)+2,panel.CellY(1,1,1)+2,clr,100);

//--- Display the Senkou Span A line data from the specified bar on the panel in table 1
   panel.DrawText("Senkou Span A", panel.CellX(1,2,0)+2, panel.CellY(1,2,0)+2);
   value_str=(spana!=EMPTY_VALUE ? DoubleToString(spana,ind_digits) : " ");
   panel.DrawText(value_str,panel.CellX(1,2,1)+2,panel.CellY(1,2,1)+2,clrNONE,100);

//--- Display the Senkou Span B line data from the specified bar on the panel in table 1
   string spanb_str=StringFormat("Senkou Span B(%lu)",period_spanb);
   panel.DrawText(spanb_str, panel.CellX(1,3,0)+2, panel.CellY(1,3,0)+2);
   value_str=(spanb!=EMPTY_VALUE ? DoubleToString(spanb,ind_digits) : " ");
   panel.DrawText(value_str,panel.CellX(1,3,1)+2,panel.CellY(1,3,1)+2,clrNONE,100);

//--- Display the Chikou Span line data from the specified bar on the panel in table 1
   panel.DrawText("Chikou Span", panel.CellX(1,4,0)+2, panel.CellY(1,4,0)+2);
   value_str=(chikou!=EMPTY_VALUE ? DoubleToString(chikou,ind_digits) : " ");
   panel.DrawText(value_str,panel.CellX(1,4,1)+2,panel.CellY(1,4,1)+2,clrNONE,100);

//--- Redraw the chart to immediately display all changes on the panel
   ChartRedraw(ChartID());
  }
The color of the Tenkan-sen and Kijun-sen line values depends on their relative position and direction.
Besides, when using the dashboard, the panel events handler is called in the OnChartEvent() EA event handler, as well as the events for receiving the bar index under the cursor are handled:
//+------------------------------------------------------------------+
//| ChartEvent function                                              |
//+------------------------------------------------------------------+
void OnChartEvent(const int id,
                  const long &lparam,
                  const double &dparam,
                  const string &sparam)
  {
//--- Handling the panel
//--- Call the panel event handler
   panel.OnChartEvent(id,lparam,dparam,sparam);

//--- If the cursor moves or a click is made on the chart
   if(id==CHARTEVENT_MOUSE_MOVE || id==CHARTEVENT_CLICK)
     {
      //--- Declare the variables to record time and price coordinates in them
      datetime time=0;
      double price=0;
      int wnd=0;
      //--- If the cursor coordinates are converted to date and time
      if(ChartXYToTimePrice(ChartID(),(int)lparam,(int)dparam,wnd,time,price))
        {
         //--- write the bar index where the cursor is located to a global variable
         mouse_bar_index=iBarShift(Symbol(),PERIOD_CURRENT,time);
         //--- Display the bar data under the cursor on the panel
         DrawData(mouse_bar_index,time);
        }
     }

//--- If we received a custom event, display the appropriate message in the journal
   if(id>CHARTEVENT_CUSTOM)
     {
      //--- Here we can implement handling a click on the close button on the panel
      PrintFormat("%s: Event id=%ld, object id (lparam): %lu, event message (sparam): %s",__FUNCTION__,id,lparam,sparam);
     }
  }
After compiling the EA and launching it on the chart, we can monitor the state of the indicator value and line on the panel:
You can view the TestTrendIchimoku.mq5 test EA in the files attached to the article.
Moving Average
Moving Average (MA) shows the mean instrument price value for a certain period of time. When one calculates the moving average, one averages out the instrument price for this time period. As the price changes, its moving average either increases, or decreases.
There are four different types of moving averages: simple (also referred to as Arithmetic), exponential, smoothed and weighted. Moving Average may be calculated for any sequential data set, including opening and closing prices, highest and lowest prices, trading volume or any other indicators. It is often the case when double moving averages are used.
The only thing where moving averages of different types diverge considerably from each other, is when weight coefficients, which are assigned to the latest data, are different. In case of the (Simple Moving Average), all prices of the time period in question are equal in weight. Exponential Moving Average and Linear Weighted Moving Average assign more weight to the latest prices.
The most common way to interpreting the price moving average is to compare its dynamics to the price action. When the instrument price rises above its moving average, a buy signal appears, if the price falls below its moving average, what we have is a sell signal.
This trading system, which is based on the moving average, is not designed to provide entrance into the market right in its lowest point, and its exit right on the peak. It allows to act according to the following trend: to buy soon after the prices reach the bottom, and to sell soon after the prices have reached their peak.
Moving averages may also be applied to indicators. That is where the interpretation of indicator moving averages is similar to the interpretation of price moving averages: if the indicator rises above its moving average, that means that the ascending indicator movement is likely to continue: if the indicator falls below its moving average, this means that it is likely to continue going downward.
Here are the types of moving averages on the chart:
- Simple Moving Average (SMA)
- Exponential Moving Average (EMA)
- Smoothed Moving Average (SMMA)
- Linear Weighted Moving Average (LWMA)
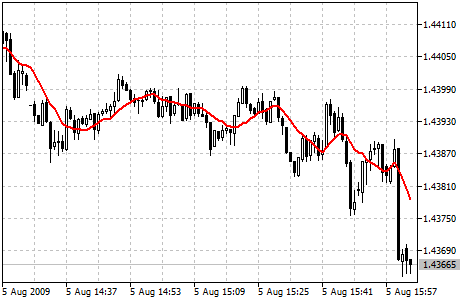
Parameters
iMA() function is used to create the indicator handle:
Return moving average indicator handle. Only one buffer.

int  iMA(
   string               symbol,            // symbol name
   ENUM_TIMEFRAMES      period,            // period
   int                  ma_period,         // averaging period
   int                  ma_shift,          // horizontal shift of the indicator
   ENUM_MA_METHOD       ma_method,         // smoothing type
   ENUM_APPLIED_PRICE   applied_price      // price type or handle
   );
[in] The symbol name of the financial instrument whose data is to be used to calculate the indicator. NULL means the current symbol.
period
[in] The period value can be one of the ENUM_TIMEFRAMES enumeration values, 0 means the current timeframe.
ma_period
[in] The period of averaging for calculation of the Moving Average.
ma_shift
[in] Shift of the indicator in relation to the price chart.
ma_method
[in] Averaging method. Can have any values of the enumeration ENUM_MA_METHOD.
applied_price
[in] Applied price. Any of the ENUM_APPLIED_PRICE price constants or another indicator handle.
Return the handle of the specified technical indicator. If failed, return INVALID_HANDLE. To free up computer memory from an unused indicator, use IndicatorRelease() the indicator handle is passed to.
Declare input and global variables in the EA to create the indicator:
//+------------------------------------------------------------------+
//|                                                  TestTrendMA.mq5 |
//|                                  Copyright 2023, MetaQuotes Ltd. |
//|                                             https://www.mql5.com |
//+------------------------------------------------------------------+
#property copyright "Copyright 2023, MetaQuotes Ltd."
#property link      "https://www.mql5.com"
#property version   "1.00"
//--- enums
enum ENUM_LINE_STATE
  {
   LINE_STATE_NONE,        // Undefined state
   LINE_STATE_UP,          // Upward
   LINE_STATE_DOWN,        // Downward
   LINE_STATE_TURN_UP,     // Upward reversal
   LINE_STATE_TURN_DOWN,   // Downward reversal
   LINE_STATE_STOP_UP,     // Upward stop
   LINE_STATE_STOP_DOWN,   // Downward stop
   LINE_STATE_ABOVE,       // Above value
   LINE_STATE_UNDER,       // Below value
   LINE_STATE_CROSS_UP,    // Crossing value upwards
   LINE_STATE_CROSS_DOWN,  // Crossing value downwards
   LINE_STATE_TOUCH_BELOW, // Touching value from below
   LINE_STATE_TOUCH_ABOVE, // Touch value from above
   LINE_STATE_EQUALS,      // Equal to value
  };
//--- input parameters
input uint                 InpPeriod=  10;            /* Period         */
input int                  InpShift =  0;             /* MA Shift       */
input ENUM_MA_METHOD       InpMethod=  MODE_SMA;      /* Method         */
input ENUM_APPLIED_PRICE   InpPrice =  PRICE_CLOSE;   /* Applied Price  */
//--- global variables
int      handle=INVALID_HANDLE;  // Indicator handle
int      period=0;               // MA calculation period
int      ind_digits=0;           // Number of decimal places in the indicator values
string   ind_title;              // Indicator description
When using the dashboard in the EA, declare global variables and include the panel class file:
//+------------------------------------------------------------------+
//|                                                  TestTrendMA.mq5 |
//|                                  Copyright 2023, MetaQuotes Ltd. |
//|                                             https://www.mql5.com |
//+------------------------------------------------------------------+
#property copyright "Copyright 2023, MetaQuotes Ltd."
#property link      "https://www.mql5.com"
#property version   "1.00"
//--- includes
#include <Dashboard\Dashboard.mqh>
//--- enums
enum ENUM_LINE_STATE
  {
   LINE_STATE_NONE,        // Undefined state
   LINE_STATE_UP,          // Upward
   LINE_STATE_DOWN,        // Downward
   LINE_STATE_TURN_UP,     // Upward reversal
   LINE_STATE_TURN_DOWN,   // Downward reversal
   LINE_STATE_STOP_UP,     // Upward stop
   LINE_STATE_STOP_DOWN,   // Downward stop
   LINE_STATE_ABOVE,       // Above value
   LINE_STATE_UNDER,       // Below value
   LINE_STATE_CROSS_UP,    // Crossing value upwards
   LINE_STATE_CROSS_DOWN,  // Crossing value downwards
   LINE_STATE_TOUCH_BELOW, // Touching value from below
   LINE_STATE_TOUCH_ABOVE, // Touch value from above
   LINE_STATE_EQUALS,      // Equal to value
  };
//--- input parameters
input uint                 InpPeriod=  10;            /* Period         */
input int                  InpShift =  0;             /* MA Shift       */
input ENUM_MA_METHOD       InpMethod=  MODE_SMA;      /* Method         */
input ENUM_APPLIED_PRICE   InpPrice =  PRICE_CLOSE;   /* Applied Price  */
//--- global variables
int      handle=INVALID_HANDLE;  // Indicator handle
int      period=0;               // MA calculation period
int      ind_digits=0;           // Number of decimal places in the indicator values
string   ind_title;              // Indicator description
//--- variables for the panel
int      mouse_bar_index;        // Index of the bar the data is taken from
CDashboard *panel=NULL;          // Pointer to the panel object
Initialization
Setting the values of global variables for the indicator and creating its handle:
//+------------------------------------------------------------------+
//| Expert initialization function                                   |
//+------------------------------------------------------------------+
int OnInit()
  {
//--- create timer
   EventSetTimer(60);

//--- Indicator
//--- Set and adjust the calculation period and levels if necessary
   period=int(InpPeriod<1 ? 10 : InpPeriod);
//--- Set the indicator name and the number of decimal places
   ind_title=StringFormat("MA(%lu)",period);
   ind_digits=Digits()+1;
//--- Create indicator handle
   ResetLastError();
   handle=iMA(Symbol(),PERIOD_CURRENT,period,InpShift,InpMethod,InpPrice);
   if(handle==INVALID_HANDLE)
     {
      PrintFormat("%s: Failed to create indicator handle %s. Error %ld",__FUNCTION__,ind_title,GetLastError());
      return INIT_FAILED;
     }

//--- Successful initialization
   return(INIT_SUCCEEDED);
  }
If the EA involves using the dashboard, we should create it:
//+------------------------------------------------------------------+
//| Expert initialization function                                   |
//+------------------------------------------------------------------+
int OnInit()
  {
//--- create timer
   EventSetTimer(60);

//--- Indicator
//--- Set and adjust the calculation period and levels if necessary
   period=int(InpPeriod<1 ? 10 : InpPeriod);
//--- Set the indicator name and the number of decimal places
   ind_title=StringFormat("MA(%lu)",period);
   ind_digits=Digits()+1;
//--- Create indicator handle
   ResetLastError();
   handle=iMA(Symbol(),PERIOD_CURRENT,period,InpShift,InpMethod,InpPrice);
   if(handle==INVALID_HANDLE)
     {
      PrintFormat("%s: Failed to create indicator handle %s. Error %ld",__FUNCTION__,ind_title,GetLastError());
      return INIT_FAILED;
     }

//--- Dashboard
//--- Create the panel
   panel=new CDashboard(1,20,20,197,225);
   if(panel==NULL)
     {
      Print("Error. Failed to create panel object");
      return INIT_FAILED;
     }
//--- Set font parameters
   panel.SetFontParams("Calibri",9);
//--- Display the panel with the "Symbol, Timeframe description" header text
   panel.View(Symbol()+", "+StringSubstr(EnumToString(Period()),7));
//--- Create a table with ID 0 to display bar data in it
   panel.CreateNewTable(0);
//--- Draw a table with ID 0 on the panel background
   panel.DrawGrid(0,2,20,6,2,18,96);

//--- Create a table with ID 1 to display indicator data in it
   panel.CreateNewTable(1);
//--- Get the Y2 table coordinate with ID 0 and
//--- set the Y1 coordinate for the table with ID 1
   int y1=panel.TableY2(0)+22;
//--- Draw a table with ID 1 on the panel background
   panel.DrawGrid(1,2,y1,3,2,18,96);

//--- Display tabular data in the journal
   panel.GridPrint(0,2);
   panel.GridPrint(1,2);
//--- Initialize the variable with the index of the mouse cursor bar
   mouse_bar_index=0;
//--- Display the data of the current bar on the panel
   DrawData(mouse_bar_index,TimeCurrent());

//--- Successful initialization
   return(INIT_SUCCEEDED);
  }
Deinitialization
Release the indicator handle in the EA OnDeinit() handle:
//+------------------------------------------------------------------+
//| Expert deinitialization function                                 |
//+------------------------------------------------------------------+
void OnDeinit(const int reason)
  {
//--- destroy timer
   EventKillTimer();

//--- Release handle of the indicator
   ResetLastError();
   if(!IndicatorRelease(handle))
      PrintFormat("%s: IndicatorRelease failed. Error %ld",__FUNCTION__,GetLastError());
//--- Clear all comments on the chart
   Comment("");
  }
The created dashboard object is removed when using the dashboard:
//+------------------------------------------------------------------+
//| Expert deinitialization function                                 |
//+------------------------------------------------------------------+
void OnDeinit(const int reason)
  {
//--- destroy timer
   EventKillTimer();

//--- Release handle of the indicator
   ResetLastError();
   if(!IndicatorRelease(handle))
      PrintFormat("%s: IndicatorRelease failed. Error %ld",__FUNCTION__,GetLastError());
//--- Clear all comments on the chart
   Comment("");

//--- If the panel object exists, delete it
   if(panel!=NULL)
      delete panel;
  }
Data retrieval
General functions for obtaining data by the indicator handle:
//+------------------------------------------------------------------+
//| Return the indicator data on the specified bar                   |
//+------------------------------------------------------------------+
double IndicatorValue(const int ind_handle,const int index,const int buffer_num)
  {
   double array[1]={0};
   ResetLastError();
   if(CopyBuffer(ind_handle,buffer_num,index,1,array)!=1)
     {
      PrintFormat("%s: CopyBuffer failed. Error %ld",__FUNCTION__,GetLastError());
      return EMPTY_VALUE;
     }
   return array[0];
  }
//+------------------------------------------------------------------+
//| Return the state of the indicator line                           |
//+------------------------------------------------------------------+
ENUM_LINE_STATE LineState(const int ind_handle,const int index,const int buffer_num)
  {
//--- Get the values of the indicator line with the shift (0,1,2) relative to the passed index
   const double value0=IndicatorValue(ind_handle,index,  buffer_num);
   const double value1=IndicatorValue(ind_handle,index+1,buffer_num);
   const double value2=IndicatorValue(ind_handle,index+2,buffer_num);
//--- If at least one of the values could not be obtained, return an undefined value
   if(value0==EMPTY_VALUE || value1==EMPTY_VALUE || value2==EMPTY_VALUE)
      return LINE_STATE_NONE;
//--- Line upward reversal (value2>value1 && value0>value1)
   if(NormalizeDouble(value2-value1,ind_digits)>0 && NormalizeDouble(value0-value1,ind_digits)>0)
      return LINE_STATE_TURN_UP;
//--- Line upward direction (value2<=value1 && value0>value1)
   else if(NormalizeDouble(value2-value1,ind_digits)<=0 && NormalizeDouble(value0-value1,ind_digits)>0)
      return LINE_STATE_UP;
//--- Line upward stop (value2<=value1 && value0==value1)
   else if(NormalizeDouble(value2-value1,ind_digits)<=0 && NormalizeDouble(value0-value1,ind_digits)==0)
      return LINE_STATE_STOP_UP;
//--- Line downward reversal (value2<value1 && value0<value1)
   if(NormalizeDouble(value2-value1,ind_digits)<0 && NormalizeDouble(value0-value1,ind_digits)<0)
      return LINE_STATE_TURN_DOWN;
//--- Line downward direction (value2>=value1 && value0<value1)
   else if(NormalizeDouble(value2-value1,ind_digits)>=0 && NormalizeDouble(value0-value1,ind_digits)<0)
      return LINE_STATE_DOWN;
//--- Line downward stop (value2>=value1 && value0==value1)
   else if(NormalizeDouble(value2-value1,ind_digits)>=0 && NormalizeDouble(value0-value1,ind_digits)==0)
      return LINE_STATE_STOP_DOWN;
//--- Undefined state
   return LINE_STATE_NONE;
  }
//+------------------------------------------------------------------+
//| Return the state of the line relative to the specified level     |
//+------------------------------------------------------------------+
ENUM_LINE_STATE LineStateRelative(const int ind_handle,const int index,const int buffer_num,const double level0,const double level1=EMPTY_VALUE)
  {
//--- Get the values of the indicator line with the shift (0,1) relative to the passed index
   const double value0=IndicatorValue(ind_handle,index,  buffer_num);
   const double value1=IndicatorValue(ind_handle,index+1,buffer_num);
//--- If at least one of the values could not be obtained, return an undefined value
   if(value0==EMPTY_VALUE || value1==EMPTY_VALUE)
      return LINE_STATE_NONE;
//--- Define the second level to compare
   double level=(level1==EMPTY_VALUE ? level0 : level1);
//--- The line is below the level (value1<level && value0<level0)
   if(NormalizeDouble(value1-level,ind_digits)<0 && NormalizeDouble(value0-level0,ind_digits)<0)
      return LINE_STATE_UNDER;
//--- The line is above the level (value1>level && value0>level0)
   if(NormalizeDouble(value1-level,ind_digits)>0 && NormalizeDouble(value0-level0,ind_digits)>0)
      return LINE_STATE_ABOVE;
//--- The line crossed the level upwards (value1<=level && value0>level0)
   if(NormalizeDouble(value1-level,ind_digits)<=0 && NormalizeDouble(value0-level0,ind_digits)>0)
      return LINE_STATE_CROSS_UP;
//--- The line crossed the level downwards (value1>=level && value0<level0)
   if(NormalizeDouble(value1-level,ind_digits)>=0 && NormalizeDouble(value0-level0,ind_digits)<0)
      return LINE_STATE_CROSS_DOWN;
//--- The line touched the level from below (value1<level0 && value0==level0)
   if(NormalizeDouble(value1-level,ind_digits)<0 && NormalizeDouble(value0-level0,ind_digits)==0)
      return LINE_STATE_TOUCH_BELOW;
//--- The line touched the level from above (value1>level0 && value0==level0)
   if(NormalizeDouble(value1-level,ind_digits)>0 && NormalizeDouble(value0-level0,ind_digits)==0)
      return LINE_STATE_TOUCH_BELOW;
//--- Line is equal to the level value (value1==level0 && value0==level0)
   if(NormalizeDouble(value1-level,ind_digits)==0 && NormalizeDouble(value0-level0,ind_digits)==0)
      return LINE_STATE_EQUALS;
//--- Undefined state
   return LINE_STATE_NONE;
  }
//+------------------------------------------------------------------+
//| Return the indicator line state description                      |
//+------------------------------------------------------------------+
string LineStateDescription(const ENUM_LINE_STATE state)
  {
   switch(state)
     {
      case LINE_STATE_UP         :  return "Up";
      case LINE_STATE_STOP_UP    :  return "Stop Up";
      case LINE_STATE_TURN_UP    :  return "Turn Up";
      case LINE_STATE_DOWN       :  return "Down";
      case LINE_STATE_STOP_DOWN  :  return "Stop Down";
      case LINE_STATE_TURN_DOWN  :  return "Turn Down";
      case LINE_STATE_ABOVE      :  return "Above level";
      case LINE_STATE_UNDER      :  return "Under level";
      case LINE_STATE_CROSS_UP   :  return "Crossing Up";
      case LINE_STATE_CROSS_DOWN :  return "Crossing Down";
      case LINE_STATE_TOUCH_BELOW:  return "Touch from Below";
      case LINE_STATE_TOUCH_ABOVE:  return "Touch from Above";
      case LINE_STATE_EQUALS     :  return "Equals";
      default                    :  return "Unknown";
     }
  }
When using the dashboard, data is displayed on the panel using the function:
//+------------------------------------------------------------------+
//| Display data from the specified timeseries index to the panel    |
//+------------------------------------------------------------------+
void DrawData(const int index,const datetime time)
  {
//--- Declare the variables to receive data in them
   MqlTick  tick={0};
   MqlRates rates[1];

//--- Exit if unable to get the current prices
   if(!SymbolInfoTick(Symbol(),tick))
      return;
//--- Exit if unable to get the bar data by the specified index
   if(CopyRates(Symbol(),PERIOD_CURRENT,index,1,rates)!=1)
      return;

//--- Set font parameters for bar and indicator data headers
   int  size=0;
   uint flags=0;
   uint angle=0;
   string name=panel.FontParams(size,flags,angle);
   panel.SetFontParams(name,9,FW_BOLD);
   panel.DrawText("Bar data ["+(string)index+"]",3,panel.TableY1(0)-16,clrMaroon,panel.Width()-6);
   panel.DrawText("Indicator data ["+(string)index+"]",3,panel.TableY1(1)-16,clrGreen,panel.Width()-6);
//--- Set font parameters for bar and indicator data
   panel.SetFontParams(name,9);

//--- Display the data of the specified bar in table 0 on the panel
   panel.DrawText("Date",  panel.CellX(0,0,0)+2, panel.CellY(0,0,0)+2); panel.DrawText(TimeToString(  rates[0].time,TIME_DATE),     panel.CellX(0,0,1)+2, panel.CellY(0,0,1)+2,clrNONE,90);
   panel.DrawText("Time",  panel.CellX(0,1,0)+2, panel.CellY(0,1,0)+2); panel.DrawText(TimeToString(  rates[0].time,TIME_MINUTES),  panel.CellX(0,1,1)+2, panel.CellY(0,1,1)+2,clrNONE,90);
   panel.DrawText("Open",  panel.CellX(0,2,0)+2, panel.CellY(0,2,0)+2); panel.DrawText(DoubleToString(rates[0].open,Digits()),      panel.CellX(0,2,1)+2, panel.CellY(0,2,1)+2,clrNONE,90);
   panel.DrawText("High",  panel.CellX(0,3,0)+2, panel.CellY(0,3,0)+2); panel.DrawText(DoubleToString(rates[0].high,Digits()),      panel.CellX(0,3,1)+2, panel.CellY(0,3,1)+2,clrNONE,90);
   panel.DrawText("Low",   panel.CellX(0,4,0)+2, panel.CellY(0,4,0)+2); panel.DrawText(DoubleToString(rates[0].low,Digits()),       panel.CellX(0,4,1)+2, panel.CellY(0,4,1)+2,clrNONE,90);
   panel.DrawText("Close", panel.CellX(0,5,0)+2, panel.CellY(0,5,0)+2); panel.DrawText(DoubleToString(rates[0].close,Digits()),     panel.CellX(0,5,1)+2, panel.CellY(0,5,1)+2,clrNONE,90);

//--- Display the indicator data from the specified bar on the panel in table 1
   panel.DrawText(ind_title, panel.CellX(1,0,0)+2, panel.CellY(1,0,0)+2);
   double value=IndicatorValue(handle,index,0);
   string value_str=(value!=EMPTY_VALUE ? DoubleToString(value,ind_digits) : "");
   panel.DrawText(value_str,panel.CellX(1,0,1)+2,panel.CellY(1,0,1)+2,clrNONE,100);

//--- Display a description of the indicator line state
   panel.DrawText("Line state", panel.CellX(1,1,0)+2, panel.CellY(1,1,0)+2);
   ENUM_LINE_STATE state=LineState(handle,index,0);
   panel.DrawText(LineStateDescription(state),panel.CellX(1,1,1)+2,panel.CellY(1,1,1)+2,clrNONE,90);

//--- Redraw the chart to immediately display all changes on the panel
   ChartRedraw(ChartID());
  }
The panel displays the indicator values and the state of its line.
Besides, when using the dashboard, the panel events handler is called in the OnChartEvent() EA event handler, as well as the events for receiving the bar index under the cursor are handled:
//+------------------------------------------------------------------+
//| ChartEvent function                                              |
//+------------------------------------------------------------------+
void OnChartEvent(const int id,
                  const long &lparam,
                  const double &dparam,
                  const string &sparam)
  {
//--- Handling the panel
//--- Call the panel event handler
   panel.OnChartEvent(id,lparam,dparam,sparam);

//--- If the cursor moves or a click is made on the chart
   if(id==CHARTEVENT_MOUSE_MOVE || id==CHARTEVENT_CLICK)
     {
      //--- Declare the variables to record time and price coordinates in them
      datetime time=0;
      double price=0;
      int wnd=0;
      //--- If the cursor coordinates are converted to date and time
      if(ChartXYToTimePrice(ChartID(),(int)lparam,(int)dparam,wnd,time,price))
        {
         //--- write the bar index where the cursor is located to a global variable
         mouse_bar_index=iBarShift(Symbol(),PERIOD_CURRENT,time);
         //--- Display the bar data under the cursor on the panel
         DrawData(mouse_bar_index,time);
        }
     }

//--- If we received a custom event, display the appropriate message in the journal
   if(id>CHARTEVENT_CUSTOM)
     {
      //--- Here we can implement handling a click on the close button on the panel
      PrintFormat("%s: Event id=%ld, object id (lparam): %lu, event message (sparam): %s",__FUNCTION__,id,lparam,sparam);
     }
  }
After compiling the EA and launching it on the chart, we can monitor the state of the indicator value and line on the panel:
You can view the TestTrendMA.mq5 test EA in the files attached to the article.
Parabolic SAR Setting
Parabolic SAR was developed for analyzing the trending markets. The indicator is constructed on the price chart. This indicator is similar to Moving Average with the only difference that Parabolic SAR moves with higher acceleration and may change its position in terms of the price. The indicator is below the prices on the bull market (Up Trend), when the market is bearish (Down Trend), it is above the prices.
If the price crosses Parabolic SAR line, the indicator turns, and its further values are situated on the other side of the price. When such an indicator turn does take place, the maximum or the minimum price for the previous period would serve as the starting point. When the indicator makes a turn, it gives a signal of the trend end (correction stage or flat), or of its turn.
The Parabolic SAR is an outstanding indicator for providing exit points. Long positions should be closed when the price sinks below the SAR line, short positions should be closed when the price rises above the SAR line. That is, it is necessary to track the direction of Parabolic SAR and hold open only the positions that are in the same direction as the Parabolic SAR. The indicator is often used as the trailing stop line.
If the long position is open (i.e., the price is above the SAR line), the Parabolic SAR line will go up, regardless of what direction the prices take. The amount of movement of the Parabolic SAR line depends on the value of the price movement.
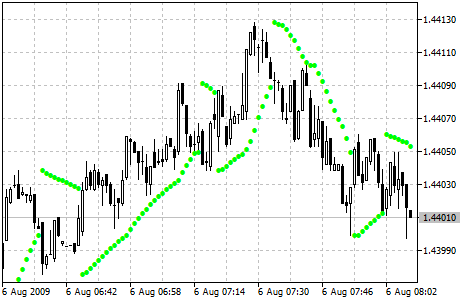
Parameters
iSAR() function is used to create the indicator handle:
Return Parabolic Stop and Reverse system indicator handle. Only one buffer.
int  iSAR(
   string           symbol,      // symbol name
   ENUM_TIMEFRAMES  period,      // period
   double           step,        // price change step — acceleration factor
   double           maximum      // maximum step
   );
[in] The symbol name of the financial instrument whose data is to be used to calculate the indicator. NULL means the current symbol.
period
[in] The period value can be one of the ENUM_TIMEFRAMES enumeration values, 0 means the current timeframe.
step
[in] Price change step, usually 0.02.
maximum
[in] Maximum step, usually 0.2.
Return the handle of the specified technical indicator. If failed, return INVALID_HANDLE. To free up computer memory from an unused indicator, use IndicatorRelease() the indicator handle is passed to.
Declare input and global variables in the EA to create the indicator:
//+------------------------------------------------------------------+
//|                                                 TestTrendSAR.mq5 |
//|                                  Copyright 2023, MetaQuotes Ltd. |
//|                                             https://www.mql5.com |
//+------------------------------------------------------------------+
#property copyright "Copyright 2023, MetaQuotes Ltd."
#property link      "https://www.mql5.com"
#property version   "1.00"
//--- enums
enum ENUM_LINE_STATE
  {
   LINE_STATE_NONE,        // Undefined state
   LINE_STATE_UP,          // Upward
   LINE_STATE_DOWN,        // Downward
   LINE_STATE_TURN_UP,     // Upward reversal
   LINE_STATE_TURN_DOWN,   // Downward reversal
   LINE_STATE_STOP_UP,     // Upward stop
   LINE_STATE_STOP_DOWN,   // Downward stop
   LINE_STATE_ABOVE,       // Above value
   LINE_STATE_UNDER,       // Below value
   LINE_STATE_CROSS_UP,    // Crossing value upwards
   LINE_STATE_CROSS_DOWN,  // Crossing value downwards
   LINE_STATE_TOUCH_BELOW, // Touching value from below
   LINE_STATE_TOUCH_ABOVE, // Touch value from above
   LINE_STATE_EQUALS,      // Equal to value
  };
//--- input parameters
input double   InpStep  =  0.02; /* Step     */
input double   InpMax   =  0.2;  /* Maximum  */
//--- global variables
int      handle=INVALID_HANDLE;  // Indicator handle
int      period=0;               // MA calculation period
int      ind_digits=0;           // Number of decimal places in the indicator values
string   ind_title;              // Indicator description
When using the dashboard in the EA, declare global variables and include the panel class file:
//+------------------------------------------------------------------+
//|                                                 TestTrendSAR.mq5 |
//|                                  Copyright 2023, MetaQuotes Ltd. |
//|                                             https://www.mql5.com |
//+------------------------------------------------------------------+
#property copyright "Copyright 2023, MetaQuotes Ltd."
#property link      "https://www.mql5.com"
#property version   "1.00"
//--- includes
#include <Dashboard\Dashboard.mqh>
//--- enums
enum ENUM_LINE_STATE
  {
   LINE_STATE_NONE,        // Undefined state
   LINE_STATE_UP,          // Upward
   LINE_STATE_DOWN,        // Downward
   LINE_STATE_TURN_UP,     // Upward reversal
   LINE_STATE_TURN_DOWN,   // Downward reversal
   LINE_STATE_STOP_UP,     // Upward stop
   LINE_STATE_STOP_DOWN,   // Downward stop
   LINE_STATE_ABOVE,       // Above value
   LINE_STATE_UNDER,       // Below value
   LINE_STATE_CROSS_UP,    // Crossing value upwards
   LINE_STATE_CROSS_DOWN,  // Crossing value downwards
   LINE_STATE_TOUCH_BELOW, // Touching value from below
   LINE_STATE_TOUCH_ABOVE, // Touch value from above
   LINE_STATE_EQUALS,      // Equal to value
  };
//--- input parameters
input double   InpStep  =  0.02; /* Step     */
input double   InpMax   =  0.2;  /* Maximum  */
//--- global variables
int      handle=INVALID_HANDLE;  // Indicator handle
int      period=0;               // MA calculation period
int      ind_digits=0;           // Number of decimal places in the indicator values
string   ind_title;              // Indicator description
//--- variables for the panel
int      mouse_bar_index;        // Index of the bar the data is taken from
CDashboard *panel=NULL;          // Pointer to the panel object
Initialization
Setting the values of global variables for the indicator and creating its handle:
//+------------------------------------------------------------------+
//| Expert initialization function                                   |
//+------------------------------------------------------------------+
int OnInit()
  {
//--- create timer
   EventSetTimer(60);

//--- Indicator
//--- Set the indicator name and the number of decimal places
   ind_title=StringFormat("SAR(%.2f,%.2f)",InpStep,InpMax);
   ind_digits=Digits();
//--- Create indicator handle
   ResetLastError();
   handle=iSAR(Symbol(),PERIOD_CURRENT,InpStep,InpMax);
   if(handle==INVALID_HANDLE)
     {
      PrintFormat("%s: Failed to create indicator handle %s. Error %ld",__FUNCTION__,ind_title,GetLastError());
      return INIT_FAILED;
     }

//--- Successful initialization
   return(INIT_SUCCEEDED);
  }
If the EA involves using the dashboard, we should create it:
//+------------------------------------------------------------------+
//| Expert initialization function                                   |
//+------------------------------------------------------------------+
int OnInit()
  {
//--- create timer
   EventSetTimer(60);

//--- Indicator
//--- Set the indicator name and the number of decimal places
   ind_title=StringFormat("SAR(%.2f,%.2f)",InpStep,InpMax);
   ind_digits=Digits();
//--- Create indicator handle
   ResetLastError();
   handle=iSAR(Symbol(),PERIOD_CURRENT,InpStep,InpMax);
   if(handle==INVALID_HANDLE)
     {
      PrintFormat("%s: Failed to create indicator handle %s. Error %ld",__FUNCTION__,ind_title,GetLastError());
      return INIT_FAILED;
     }

//--- Dashboard
//--- Create the panel
   panel=new CDashboard(1,20,20,197,225);
   if(panel==NULL)
     {
      Print("Error. Failed to create panel object");
      return INIT_FAILED;
     }
//--- Set font parameters
   panel.SetFontParams("Calibri",9);
//--- Display the panel with the "Symbol, Timeframe description" header text
   panel.View(Symbol()+", "+StringSubstr(EnumToString(Period()),7));
//--- Create a table with ID 0 to display bar data in it
   panel.CreateNewTable(0);
//--- Draw a table with ID 0 on the panel background
   panel.DrawGrid(0,2,20,6,2,18,96);

//--- Create a table with ID 1 to display indicator data in it
   panel.CreateNewTable(1);
//--- Get the Y2 table coordinate with ID 0 and
//--- set the Y1 coordinate for the table with ID 1
   int y1=panel.TableY2(0)+22;
//--- Draw a table with ID 1 on the panel background
   panel.DrawGrid(1,2,y1,3,2,18,96);

//--- Display tabular data in the journal
   panel.GridPrint(0,2);
   panel.GridPrint(1,2);
//--- Initialize the variable with the index of the mouse cursor bar
   mouse_bar_index=0;
//--- Display the data of the current bar on the panel
   DrawData(mouse_bar_index,TimeCurrent());

//--- Successful initialization
   return(INIT_SUCCEEDED);
  }
Deinitialization
Release the indicator handle in the EA OnDeinit() handle:
//+------------------------------------------------------------------+
//| Expert deinitialization function                                 |
//+------------------------------------------------------------------+
void OnDeinit(const int reason)
  {
//--- destroy timer
   EventKillTimer();

//--- Release handle of the indicator
   ResetLastError();
   if(!IndicatorRelease(handle))
      PrintFormat("%s: IndicatorRelease failed. Error %ld",__FUNCTION__,GetLastError());
//--- Clear all comments on the chart
   Comment("");
  }
The created dashboard object is removed when using the dashboard:
//+------------------------------------------------------------------+
//| Expert deinitialization function                                 |
//+------------------------------------------------------------------+
void OnDeinit(const int reason)
  {
//--- destroy timer
   EventKillTimer();

//--- Release handle of the indicator
   ResetLastError();
   if(!IndicatorRelease(handle))
      PrintFormat("%s: IndicatorRelease failed. Error %ld",__FUNCTION__,GetLastError());
//--- Clear all comments on the chart
   Comment("");

//--- If the panel object exists, delete it
   if(panel!=NULL)
      delete panel;
  }
Data retrieval
General functions for obtaining data by the indicator handle:
//+------------------------------------------------------------------+
//| Return the indicator data on the specified bar                   |
//+------------------------------------------------------------------+
double IndicatorValue(const int ind_handle,const int index,const int buffer_num)
  {
   double array[1]={0};
   ResetLastError();
   if(CopyBuffer(ind_handle,buffer_num,index,1,array)!=1)
     {
      PrintFormat("%s: CopyBuffer failed. Error %ld",__FUNCTION__,GetLastError());
      return EMPTY_VALUE;
     }
   return array[0];
  }
//+------------------------------------------------------------------+
//| Return the state of the indicator line                           |
//+------------------------------------------------------------------+
ENUM_LINE_STATE LineState(const int ind_handle,const int index,const int buffer_num)
  {
//--- Get the values of the indicator line with the shift (0,1,2) relative to the passed index
   const double value0=IndicatorValue(ind_handle,index,  buffer_num);
   const double value1=IndicatorValue(ind_handle,index+1,buffer_num);
   const double value2=IndicatorValue(ind_handle,index+2,buffer_num);
//--- If at least one of the values could not be obtained, return an undefined value
   if(value0==EMPTY_VALUE || value1==EMPTY_VALUE || value2==EMPTY_VALUE)
      return LINE_STATE_NONE;
//--- Line upward reversal (value2>value1 && value0>value1)
   if(NormalizeDouble(value2-value1,ind_digits)>0 && NormalizeDouble(value0-value1,ind_digits)>0)
      return LINE_STATE_TURN_UP;
//--- Line upward direction (value2<=value1 && value0>value1)
   else if(NormalizeDouble(value2-value1,ind_digits)<=0 && NormalizeDouble(value0-value1,ind_digits)>0)
      return LINE_STATE_UP;
//--- Line upward stop (value2<=value1 && value0==value1)
   else if(NormalizeDouble(value2-value1,ind_digits)<=0 && NormalizeDouble(value0-value1,ind_digits)==0)
      return LINE_STATE_STOP_UP;
//--- Line downward reversal (value2<value1 && value0<value1)
   if(NormalizeDouble(value2-value1,ind_digits)<0 && NormalizeDouble(value0-value1,ind_digits)<0)
      return LINE_STATE_TURN_DOWN;
//--- Line downward direction (value2>=value1 && value0<value1)
   else if(NormalizeDouble(value2-value1,ind_digits)>=0 && NormalizeDouble(value0-value1,ind_digits)<0)
      return LINE_STATE_DOWN;
//--- Line downward stop (value2>=value1 && value0==value1)
   else if(NormalizeDouble(value2-value1,ind_digits)>=0 && NormalizeDouble(value0-value1,ind_digits)==0)
      return LINE_STATE_STOP_DOWN;
//--- Undefined state
   return LINE_STATE_NONE;
  }
//+------------------------------------------------------------------+
//| Return the state of the line relative to the specified level     |
//+------------------------------------------------------------------+
ENUM_LINE_STATE LineStateRelative(const int ind_handle,const int index,const int buffer_num,const double level0,const double level1=EMPTY_VALUE)
  {
//--- Get the values of the indicator line with the shift (0,1) relative to the passed index
   const double value0=IndicatorValue(ind_handle,index,  buffer_num);
   const double value1=IndicatorValue(ind_handle,index+1,buffer_num);
//--- If at least one of the values could not be obtained, return an undefined value
   if(value0==EMPTY_VALUE || value1==EMPTY_VALUE)
      return LINE_STATE_NONE;
//--- Define the second level to compare
   double level=(level1==EMPTY_VALUE ? level0 : level1);
//--- The line is below the level (value1<level && value0<level0)
   if(NormalizeDouble(value1-level,ind_digits)<0 && NormalizeDouble(value0-level0,ind_digits)<0)
      return LINE_STATE_UNDER;
//--- The line is above the level (value1>level && value0>level0)
   if(NormalizeDouble(value1-level,ind_digits)>0 && NormalizeDouble(value0-level0,ind_digits)>0)
      return LINE_STATE_ABOVE;
//--- The line crossed the level upwards (value1<=level && value0>level0)
   if(NormalizeDouble(value1-level,ind_digits)<=0 && NormalizeDouble(value0-level0,ind_digits)>0)
      return LINE_STATE_CROSS_UP;
//--- The line crossed the level downwards (value1>=level && value0<level0)
   if(NormalizeDouble(value1-level,ind_digits)>=0 && NormalizeDouble(value0-level0,ind_digits)<0)
      return LINE_STATE_CROSS_DOWN;
//--- The line touched the level from below (value1<level0 && value0==level0)
   if(NormalizeDouble(value1-level,ind_digits)<0 && NormalizeDouble(value0-level0,ind_digits)==0)
      return LINE_STATE_TOUCH_BELOW;
//--- The line touched the level from above (value1>level0 && value0==level0)
   if(NormalizeDouble(value1-level,ind_digits)>0 && NormalizeDouble(value0-level0,ind_digits)==0)
      return LINE_STATE_TOUCH_BELOW;
//--- Line is equal to the level value (value1==level0 && value0==level0)
   if(NormalizeDouble(value1-level,ind_digits)==0 && NormalizeDouble(value0-level0,ind_digits)==0)
      return LINE_STATE_EQUALS;
//--- Undefined state
   return LINE_STATE_NONE;
  }
//+------------------------------------------------------------------+
//| Return the indicator line state description                      |
//+------------------------------------------------------------------+
string LineStateDescription(const ENUM_LINE_STATE state)
  {
   switch(state)
     {
      case LINE_STATE_UP         :  return "Up";
      case LINE_STATE_STOP_UP    :  return "Stop Up";
      case LINE_STATE_TURN_UP    :  return "Turn Up";
      case LINE_STATE_DOWN       :  return "Down";
      case LINE_STATE_STOP_DOWN  :  return "Stop Down";
      case LINE_STATE_TURN_DOWN  :  return "Turn Down";
      case LINE_STATE_ABOVE      :  return "Above level";
      case LINE_STATE_UNDER      :  return "Under level";
      case LINE_STATE_CROSS_UP   :  return "Crossing Up";
      case LINE_STATE_CROSS_DOWN :  return "Crossing Down";
      case LINE_STATE_TOUCH_BELOW:  return "Touch from Below";
      case LINE_STATE_TOUCH_ABOVE:  return "Touch from Above";
      case LINE_STATE_EQUALS     :  return "Equals";
      default                    :  return "Unknown";
     }
  }
When using the dashboard, data is displayed on the panel using the function:
//+------------------------------------------------------------------+
//| Display data from the specified timeseries index to the panel    |
//+------------------------------------------------------------------+
void DrawData(const int index,const datetime time)
  {
//--- Declare the variables to receive data in them
   MqlTick  tick={0};
   MqlRates rates[1];

//--- Exit if unable to get the current prices
   if(!SymbolInfoTick(Symbol(),tick))
      return;
//--- Exit if unable to get the bar data by the specified index
   if(CopyRates(Symbol(),PERIOD_CURRENT,index,1,rates)!=1)
      return;

//--- Set font parameters for bar and indicator data headers
   int  size=0;
   uint flags=0;
   uint angle=0;
   string name=panel.FontParams(size,flags,angle);
   panel.SetFontParams(name,9,FW_BOLD);
   panel.DrawText("Bar data ["+(string)index+"]",3,panel.TableY1(0)-16,clrMaroon,panel.Width()-6);
   panel.DrawText("Indicator data ["+(string)index+"]",3,panel.TableY1(1)-16,clrGreen,panel.Width()-6);
//--- Set font parameters for bar and indicator data
   panel.SetFontParams(name,9);

//--- Display the data of the specified bar in table 0 on the panel
   panel.DrawText("Date",  panel.CellX(0,0,0)+2, panel.CellY(0,0,0)+2); panel.DrawText(TimeToString(  rates[0].time,TIME_DATE),     panel.CellX(0,0,1)+2, panel.CellY(0,0,1)+2,clrNONE,90);
   panel.DrawText("Time",  panel.CellX(0,1,0)+2, panel.CellY(0,1,0)+2); panel.DrawText(TimeToString(  rates[0].time,TIME_MINUTES),  panel.CellX(0,1,1)+2, panel.CellY(0,1,1)+2,clrNONE,90);
   panel.DrawText("Open",  panel.CellX(0,2,0)+2, panel.CellY(0,2,0)+2); panel.DrawText(DoubleToString(rates[0].open,Digits()),      panel.CellX(0,2,1)+2, panel.CellY(0,2,1)+2,clrNONE,90);
   panel.DrawText("High",  panel.CellX(0,3,0)+2, panel.CellY(0,3,0)+2); panel.DrawText(DoubleToString(rates[0].high,Digits()),      panel.CellX(0,3,1)+2, panel.CellY(0,3,1)+2,clrNONE,90);
   panel.DrawText("Low",   panel.CellX(0,4,0)+2, panel.CellY(0,4,0)+2); panel.DrawText(DoubleToString(rates[0].low,Digits()),       panel.CellX(0,4,1)+2, panel.CellY(0,4,1)+2,clrNONE,90);
   panel.DrawText("Close", panel.CellX(0,5,0)+2, panel.CellY(0,5,0)+2); panel.DrawText(DoubleToString(rates[0].close,Digits()),     panel.CellX(0,5,1)+2, panel.CellY(0,5,1)+2,clrNONE,90);

//--- Display the indicator data from the specified bar on the panel in table 1
   panel.DrawText(ind_title, panel.CellX(1,0,0)+2, panel.CellY(1,0,0)+2);
   double value=IndicatorValue(handle,index,0);
   string value_str=(value!=EMPTY_VALUE ? DoubleToString(value,ind_digits) : "");
   panel.DrawText(value_str,panel.CellX(1,0,1)+2,panel.CellY(1,0,1)+2,clrNONE,100);

//--- Display the header of the indicator line state description
   panel.DrawText("Line state", panel.CellX(1,1,0)+2, panel.CellY(1,1,0)+2);

//--- Save Close value on 'index' bar to the variable
   double close0=rates[0].close;
//--- If failed to get bar data by index+1, leave
   if(CopyRates(Symbol(),PERIOD_CURRENT,index+1,1,rates)!=1)
      return;
//--- Save Close value on 'index+1' bar to the variable and get the indicator value on 'index+1' bar
   double close1=rates[0].close;
   double value1=IndicatorValue(handle,index+1,0);
//--- Get and adjust the state of the indicator line
   ENUM_LINE_STATE state=LineState(handle,index,0);
   if(value<close0 && value1>close1)
      state=LINE_STATE_TURN_UP;
   if(state==LINE_STATE_STOP_DOWN)
      state=LINE_STATE_UP;
   if(value>close0 && value1<close1)
      state=LINE_STATE_TURN_DOWN;
   if(state==LINE_STATE_STOP_UP)
      state=LINE_STATE_DOWN;
//--- Display a description of the indicator line state
   panel.DrawText(LineStateDescription(state),panel.CellX(1,1,1)+2,panel.CellY(1,1,1)+2,clrNONE,90);

//--- Redraw the chart to immediately display all changes on the panel
   ChartRedraw(ChartID());
  }
Besides, when using the dashboard, the panel events handler is called in the OnChartEvent() EA event handler, as well as the events for receiving the bar index under the cursor are handled:
//+------------------------------------------------------------------+
//| ChartEvent function                                              |
//+------------------------------------------------------------------+
void OnChartEvent(const int id,
                  const long &lparam,
                  const double &dparam,
                  const string &sparam)
  {
//--- Handling the panel
//--- Call the panel event handler
   panel.OnChartEvent(id,lparam,dparam,sparam);

//--- If the cursor moves or a click is made on the chart
   if(id==CHARTEVENT_MOUSE_MOVE || id==CHARTEVENT_CLICK)
     {
      //--- Declare the variables to record time and price coordinates in them
      datetime time=0;
      double price=0;
      int wnd=0;
      //--- If the cursor coordinates are converted to date and time
      if(ChartXYToTimePrice(ChartID(),(int)lparam,(int)dparam,wnd,time,price))
        {
         //--- write the bar index where the cursor is located to a global variable
         mouse_bar_index=iBarShift(Symbol(),PERIOD_CURRENT,time);
         //--- Display the bar data under the cursor on the panel
         DrawData(mouse_bar_index,time);
        }
     }

//--- If we received a custom event, display the appropriate message in the journal
   if(id>CHARTEVENT_CUSTOM)
     {
      //--- Here we can implement handling a click on the close button on the panel
      PrintFormat("%s: Event id=%ld, object id (lparam): %lu, event message (sparam): %s",__FUNCTION__,id,lparam,sparam);
     }
  }
After compiling the EA and launching it on the chart, we can monitor the state of the indicator value and line on the panel:
You can view the TestTrendSAR.mq5 test EA in the files attached to the article.
Standard Deviation
Standard Deviation (StdDev) measures the market volatility. This indicator describes the range of price fluctuations relative to Moving Average. So, if the value of this indicator is high, the market is volatile, and prices of bars are rather spread relative to the moving average. If the indicator value is low, the market can described as having a low volatility, and prices of bars are rather close to the moving average.
Normally, this indicator is used as a constituent of other indicators. For instance, when calculating Bollinger Bands®, the value of the standard deviation of the symbol is added to its moving average.
The market dynamics is represented by the interchange of flat and high activity periods, so the approach to this indicator is simple:
- if its value is too low, i.e., the market is absolutely inactive, it makes sense to expect a spike soon;
- otherwise, if it is extremely high, it most probably means that activity will decline soon.
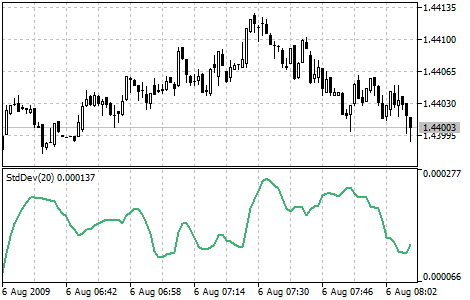
Parameters
iStdDev() function is used to create the indicator handle:
Return the Standard Deviation indicator handle. Only one buffer.
int  iStdDev(
   string              symbol,            // symbol name
   ENUM_TIMEFRAMES     period,            // period
   int                 ma_period,         // averaging period
   int                 ma_shift,          // horizontal shift of the indicator
   ENUM_MA_METHOD      ma_method,         // smoothing type
   ENUM_APPLIED_PRICE  applied_price      // price type or handle
   );
[in] The symbol name of the financial instrument whose data is to be used to calculate the indicator. NULL means the current symbol.
period
[in] The period value can be one of the ENUM_TIMEFRAMES enumeration values, 0 means the current timeframe.
ma_period
[in] Period of averaging for calculation of the indicator.
ma_shift
[in] Shift of the indicator in relation to the price chart.
ma_method
[in] Averaging method. Can have any values of the enumeration ENUM_MA_METHOD.
applied_price
[in] Applied price. Any of the ENUM_APPLIED_PRICE price constants or another indicator handle.
Return the handle of the specified technical indicator. If failed, return INVALID_HANDLE. To free up computer memory from an unused indicator, use IndicatorRelease() the indicator handle is passed to.
Declare input and global variables in the EA to create the indicator:
//+------------------------------------------------------------------+
//|                                              TestTrendStdDev.mq5 |
//|                                  Copyright 2023, MetaQuotes Ltd. |
//|                                             https://www.mql5.com |
//+------------------------------------------------------------------+
#property copyright "Copyright 2023, MetaQuotes Ltd."
#property link      "https://www.mql5.com"
#property version   "1.00"
//--- enums
enum ENUM_LINE_STATE
  {
   LINE_STATE_NONE,        // Undefined state
   LINE_STATE_UP,          // Upward
   LINE_STATE_DOWN,        // Downward
   LINE_STATE_TURN_UP,     // Upward reversal
   LINE_STATE_TURN_DOWN,   // Downward reversal
   LINE_STATE_STOP_UP,     // Upward stop
   LINE_STATE_STOP_DOWN,   // Downward stop
   LINE_STATE_ABOVE,       // Above value
   LINE_STATE_UNDER,       // Below value
   LINE_STATE_CROSS_UP,    // Crossing value upwards
   LINE_STATE_CROSS_DOWN,  // Crossing value downwards
   LINE_STATE_TOUCH_BELOW, // Touching value from below
   LINE_STATE_TOUCH_ABOVE, // Touch value from above
   LINE_STATE_EQUALS,      // Equal to value
  };
//--- input parameters
input uint                 InpPeriod=  20;            /* Period         */
input int                  InpShift =  0;             /* StdDev Shift   */
input ENUM_MA_METHOD       InpMethod=  MODE_SMA;      /* Method         */
input ENUM_APPLIED_PRICE   InpPrice =  PRICE_CLOSE;   /* Applied Price  */
//--- global variables
int      handle=INVALID_HANDLE;  // Indicator handle
int      period=0;               // Standard Deviation calculation period
int      ind_digits=0;           // Number of decimal places in the indicator values
string   ind_title;              // Indicator description
When using the dashboard in the EA, declare global variables and include the panel class file:
//+------------------------------------------------------------------+
//|                                              TestTrendStdDev.mq5 |
//|                                  Copyright 2023, MetaQuotes Ltd. |
//|                                             https://www.mql5.com |
//+------------------------------------------------------------------+
#property copyright "Copyright 2023, MetaQuotes Ltd."
#property link      "https://www.mql5.com"
#property version   "1.00"
//--- includes
#include <Dashboard\Dashboard.mqh>
//--- enums
enum ENUM_LINE_STATE
  {
   LINE_STATE_NONE,        // Undefined state
   LINE_STATE_UP,          // Upward
   LINE_STATE_DOWN,        // Downward
   LINE_STATE_TURN_UP,     // Upward reversal
   LINE_STATE_TURN_DOWN,   // Downward reversal
   LINE_STATE_STOP_UP,     // Upward stop
   LINE_STATE_STOP_DOWN,   // Downward stop
   LINE_STATE_ABOVE,       // Above value
   LINE_STATE_UNDER,       // Below value
   LINE_STATE_CROSS_UP,    // Crossing value upwards
   LINE_STATE_CROSS_DOWN,  // Crossing value downwards
   LINE_STATE_TOUCH_BELOW, // Touching value from below
   LINE_STATE_TOUCH_ABOVE, // Touch value from above
   LINE_STATE_EQUALS,      // Equal to value
  };
//--- input parameters
input uint                 InpPeriod=  20;            /* Period         */
input int                  InpShift =  0;             /* StdDev Shift   */
input ENUM_MA_METHOD       InpMethod=  MODE_SMA;      /* Method         */
input ENUM_APPLIED_PRICE   InpPrice =  PRICE_CLOSE;   /* Applied Price  */
//--- global variables
int      handle=INVALID_HANDLE;  // Indicator handle
int      period=0;               // Standard Deviation calculation period
int      ind_digits=0;           // Number of decimal places in the indicator values
string   ind_title;              // Indicator description
//--- variables for the panel
int      mouse_bar_index;        // Index of the bar the data is taken from
CDashboard *panel=NULL;          // Pointer to the panel object
Initialization
Setting the values of global variables for the indicator and creating its handle:
//+------------------------------------------------------------------+
//| Expert initialization function                                   |
//+------------------------------------------------------------------+
int OnInit()
  {
//--- create timer
   EventSetTimer(60);

//--- Indicator
//--- Set and adjust the calculation period and levels if necessary
   period=int(InpPeriod<1 ? 20 : InpPeriod<2 ? 2 : InpPeriod);
//--- Set the indicator name and the number of decimal places
   ind_title=StringFormat("StdDev(%lu)",period);
   ind_digits=Digits()+1;
//--- Create indicator handle
   ResetLastError();
   handle=iStdDev(Symbol(),PERIOD_CURRENT,period,InpShift,InpMethod,InpPrice);
   if(handle==INVALID_HANDLE)
     {
      PrintFormat("%s: Failed to create indicator handle %s. Error %ld",__FUNCTION__,ind_title,GetLastError());
      return INIT_FAILED;
     }

//--- Successful initialization
   return(INIT_SUCCEEDED);
  }
If the EA involves using the dashboard, we should create it:
//+------------------------------------------------------------------+
//| Expert initialization function                                   |
//+------------------------------------------------------------------+
int OnInit()
  {
//--- create timer
   EventSetTimer(60);

//--- Indicator
//--- Set and adjust the calculation period and levels if necessary
   period=int(InpPeriod<1 ? 20 : InpPeriod<2 ? 2 : InpPeriod);
//--- Set the indicator name and the number of decimal places
   ind_title=StringFormat("StdDev(%lu)",period);
   ind_digits=Digits()+1;
//--- Create indicator handle
   ResetLastError();
   handle=iStdDev(Symbol(),PERIOD_CURRENT,period,InpShift,InpMethod,InpPrice);
   if(handle==INVALID_HANDLE)
     {
      PrintFormat("%s: Failed to create indicator handle %s. Error %ld",__FUNCTION__,ind_title,GetLastError());
      return INIT_FAILED;
     }

//--- Dashboard
//--- Create the panel
   panel=new CDashboard(1,20,20,197,225);
   if(panel==NULL)
     {
      Print("Error. Failed to create panel object");
      return INIT_FAILED;
     }
//--- Set font parameters
   panel.SetFontParams("Calibri",9);
//--- Display the panel with the "Symbol, Timeframe description" header text
   panel.View(Symbol()+", "+StringSubstr(EnumToString(Period()),7));
//--- Create a table with ID 0 to display bar data in it
   panel.CreateNewTable(0);
//--- Draw a table with ID 0 on the panel background
   panel.DrawGrid(0,2,20,6,2,18,96);

//--- Create a table with ID 1 to display indicator data in it
   panel.CreateNewTable(1);
//--- Get the Y2 table coordinate with ID 0 and
//--- set the Y1 coordinate for the table with ID 1
   int y1=panel.TableY2(0)+22;
//--- Draw a table with ID 1 on the panel background
   panel.DrawGrid(1,2,y1,3,2,18,96);

//--- Display tabular data in the journal
   panel.GridPrint(0,2);
   panel.GridPrint(1,2);
//--- Initialize the variable with the index of the mouse cursor bar
   mouse_bar_index=0;
//--- Display the data of the current bar on the panel
   DrawData(mouse_bar_index,TimeCurrent());

//--- Successful initialization
   return(INIT_SUCCEEDED);
  }
Deinitialization
Release the indicator handle in the EA OnDeinit() handle:
//+------------------------------------------------------------------+
//| Expert deinitialization function                                 |
//+------------------------------------------------------------------+
void OnDeinit(const int reason)
  {
//--- destroy timer
   EventKillTimer();

//--- Release handle of the indicator
   ResetLastError();
   if(!IndicatorRelease(handle))
      PrintFormat("%s: IndicatorRelease failed. Error %ld",__FUNCTION__,GetLastError());
//--- Clear all comments on the chart
   Comment("");
  }
The created dashboard object is removed when using the dashboard:
//+------------------------------------------------------------------+
//| Expert deinitialization function                                 |
//+------------------------------------------------------------------+
void OnDeinit(const int reason)
  {
//--- destroy timer
   EventKillTimer();

//--- Release handle of the indicator
   ResetLastError();
   if(!IndicatorRelease(handle))
      PrintFormat("%s: IndicatorRelease failed. Error %ld",__FUNCTION__,GetLastError());
//--- Clear all comments on the chart
   Comment("");

//--- If the panel object exists, delete it
   if(panel!=NULL)
      delete panel;
  }
Data retrieval
General functions for obtaining data by the indicator handle:
//+------------------------------------------------------------------+
//| Return the indicator data on the specified bar                   |
//+------------------------------------------------------------------+
double IndicatorValue(const int ind_handle,const int index,const int buffer_num)
  {
   double array[1]={0};
   ResetLastError();
   if(CopyBuffer(ind_handle,buffer_num,index,1,array)!=1)
     {
      PrintFormat("%s: CopyBuffer failed. Error %ld",__FUNCTION__,GetLastError());
      return EMPTY_VALUE;
     }
   return array[0];
  }
//+------------------------------------------------------------------+
//| Return the state of the indicator line                           |
//+------------------------------------------------------------------+
ENUM_LINE_STATE LineState(const int ind_handle,const int index,const int buffer_num)
  {
//--- Get the values of the indicator line with the shift (0,1,2) relative to the passed index
   const double value0=IndicatorValue(ind_handle,index,  buffer_num);
   const double value1=IndicatorValue(ind_handle,index+1,buffer_num);
   const double value2=IndicatorValue(ind_handle,index+2,buffer_num);
//--- If at least one of the values could not be obtained, return an undefined value
   if(value0==EMPTY_VALUE || value1==EMPTY_VALUE || value2==EMPTY_VALUE)
      return LINE_STATE_NONE;
//--- Line upward reversal (value2>value1 && value0>value1)
   if(NormalizeDouble(value2-value1,ind_digits)>0 && NormalizeDouble(value0-value1,ind_digits)>0)
      return LINE_STATE_TURN_UP;
//--- Line upward direction (value2<=value1 && value0>value1)
   else if(NormalizeDouble(value2-value1,ind_digits)<=0 && NormalizeDouble(value0-value1,ind_digits)>0)
      return LINE_STATE_UP;
//--- Line upward stop (value2<=value1 && value0==value1)
   else if(NormalizeDouble(value2-value1,ind_digits)<=0 && NormalizeDouble(value0-value1,ind_digits)==0)
      return LINE_STATE_STOP_UP;
//--- Line downward reversal (value2<value1 && value0<value1)
   if(NormalizeDouble(value2-value1,ind_digits)<0 && NormalizeDouble(value0-value1,ind_digits)<0)
      return LINE_STATE_TURN_DOWN;
//--- Line downward direction (value2>=value1 && value0<value1)
   else if(NormalizeDouble(value2-value1,ind_digits)>=0 && NormalizeDouble(value0-value1,ind_digits)<0)
      return LINE_STATE_DOWN;
//--- Line downward stop (value2>=value1 && value0==value1)
   else if(NormalizeDouble(value2-value1,ind_digits)>=0 && NormalizeDouble(value0-value1,ind_digits)==0)
      return LINE_STATE_STOP_DOWN;
//--- Undefined state
   return LINE_STATE_NONE;
  }
//+------------------------------------------------------------------+
//| Return the state of the line relative to the specified level     |
//+------------------------------------------------------------------+
ENUM_LINE_STATE LineStateRelative(const int ind_handle,const int index,const int buffer_num,const double level0,const double level1=EMPTY_VALUE)
  {
//--- Get the values of the indicator line with the shift (0,1) relative to the passed index
   const double value0=IndicatorValue(ind_handle,index,  buffer_num);
   const double value1=IndicatorValue(ind_handle,index+1,buffer_num);
//--- If at least one of the values could not be obtained, return an undefined value
   if(value0==EMPTY_VALUE || value1==EMPTY_VALUE)
      return LINE_STATE_NONE;
//--- Define the second level to compare
   double level=(level1==EMPTY_VALUE ? level0 : level1);
//--- The line is below the level (value1<level && value0<level0)
   if(NormalizeDouble(value1-level,ind_digits)<0 && NormalizeDouble(value0-level0,ind_digits)<0)
      return LINE_STATE_UNDER;
//--- The line is above the level (value1>level && value0>level0)
   if(NormalizeDouble(value1-level,ind_digits)>0 && NormalizeDouble(value0-level0,ind_digits)>0)
      return LINE_STATE_ABOVE;
//--- The line crossed the level upwards (value1<=level && value0>level0)
   if(NormalizeDouble(value1-level,ind_digits)<=0 && NormalizeDouble(value0-level0,ind_digits)>0)
      return LINE_STATE_CROSS_UP;
//--- The line crossed the level downwards (value1>=level && value0<level0)
   if(NormalizeDouble(value1-level,ind_digits)>=0 && NormalizeDouble(value0-level0,ind_digits)<0)
      return LINE_STATE_CROSS_DOWN;
//--- The line touched the level from below (value1<level0 && value0==level0)
   if(NormalizeDouble(value1-level,ind_digits)<0 && NormalizeDouble(value0-level0,ind_digits)==0)
      return LINE_STATE_TOUCH_BELOW;
//--- The line touched the level from above (value1>level0 && value0==level0)
   if(NormalizeDouble(value1-level,ind_digits)>0 && NormalizeDouble(value0-level0,ind_digits)==0)
      return LINE_STATE_TOUCH_BELOW;
//--- Line is equal to the level value (value1==level0 && value0==level0)
   if(NormalizeDouble(value1-level,ind_digits)==0 && NormalizeDouble(value0-level0,ind_digits)==0)
      return LINE_STATE_EQUALS;
//--- Undefined state
   return LINE_STATE_NONE;
  }
//+------------------------------------------------------------------+
//| Return the indicator line state description                      |
//+------------------------------------------------------------------+
string LineStateDescription(const ENUM_LINE_STATE state)
  {
   switch(state)
     {
      case LINE_STATE_UP         :  return "Up";
      case LINE_STATE_STOP_UP    :  return "Stop Up";
      case LINE_STATE_TURN_UP    :  return "Turn Up";
      case LINE_STATE_DOWN       :  return "Down";
      case LINE_STATE_STOP_DOWN  :  return "Stop Down";
      case LINE_STATE_TURN_DOWN  :  return "Turn Down";
      case LINE_STATE_ABOVE      :  return "Above level";
      case LINE_STATE_UNDER      :  return "Under level";
      case LINE_STATE_CROSS_UP   :  return "Crossing Up";
      case LINE_STATE_CROSS_DOWN :  return "Crossing Down";
      case LINE_STATE_TOUCH_BELOW:  return "Touch from Below";
      case LINE_STATE_TOUCH_ABOVE:  return "Touch from Above";
      case LINE_STATE_EQUALS     :  return "Equals";
      default                    :  return "Unknown";
     }
  }
When using the dashboard, data is displayed on the panel using the function:
//+------------------------------------------------------------------+
//| Display data from the specified timeseries index to the panel    |
//+------------------------------------------------------------------+
void DrawData(const int index,const datetime time)
  {
//--- Declare the variables to receive data in them
   MqlTick  tick={0};
   MqlRates rates[1];

//--- Exit if unable to get the current prices
   if(!SymbolInfoTick(Symbol(),tick))
      return;
//--- Exit if unable to get the bar data by the specified index
   if(CopyRates(Symbol(),PERIOD_CURRENT,index,1,rates)!=1)
      return;

//--- Set font parameters for bar and indicator data headers
   int  size=0;
   uint flags=0;
   uint angle=0;
   string name=panel.FontParams(size,flags,angle);
   panel.SetFontParams(name,9,FW_BOLD);
   panel.DrawText("Bar data ["+(string)index+"]",3,panel.TableY1(0)-16,clrMaroon,panel.Width()-6);
   panel.DrawText("Indicator data ["+(string)index+"]",3,panel.TableY1(1)-16,clrGreen,panel.Width()-6);
//--- Set font parameters for bar and indicator data
   panel.SetFontParams(name,9);

//--- Display the data of the specified bar in table 0 on the panel
   panel.DrawText("Date",  panel.CellX(0,0,0)+2, panel.CellY(0,0,0)+2); panel.DrawText(TimeToString(  rates[0].time,TIME_DATE),     panel.CellX(0,0,1)+2, panel.CellY(0,0,1)+2,clrNONE,90);
   panel.DrawText("Time",  panel.CellX(0,1,0)+2, panel.CellY(0,1,0)+2); panel.DrawText(TimeToString(  rates[0].time,TIME_MINUTES),  panel.CellX(0,1,1)+2, panel.CellY(0,1,1)+2,clrNONE,90);
   panel.DrawText("Open",  panel.CellX(0,2,0)+2, panel.CellY(0,2,0)+2); panel.DrawText(DoubleToString(rates[0].open,Digits()),      panel.CellX(0,2,1)+2, panel.CellY(0,2,1)+2,clrNONE,90);
   panel.DrawText("High",  panel.CellX(0,3,0)+2, panel.CellY(0,3,0)+2); panel.DrawText(DoubleToString(rates[0].high,Digits()),      panel.CellX(0,3,1)+2, panel.CellY(0,3,1)+2,clrNONE,90);
   panel.DrawText("Low",   panel.CellX(0,4,0)+2, panel.CellY(0,4,0)+2); panel.DrawText(DoubleToString(rates[0].low,Digits()),       panel.CellX(0,4,1)+2, panel.CellY(0,4,1)+2,clrNONE,90);
   panel.DrawText("Close", panel.CellX(0,5,0)+2, panel.CellY(0,5,0)+2); panel.DrawText(DoubleToString(rates[0].close,Digits()),     panel.CellX(0,5,1)+2, panel.CellY(0,5,1)+2,clrNONE,90);

//--- Display the indicator data from the specified bar on the panel in table 1
   panel.DrawText(ind_title, panel.CellX(1,0,0)+2, panel.CellY(1,0,0)+2);
   double value=IndicatorValue(handle,index,0);
   string value_str=(value!=EMPTY_VALUE ? DoubleToString(value,ind_digits) : "");
   panel.DrawText(value_str,panel.CellX(1,0,1)+2,panel.CellY(1,0,1)+2,clrNONE,100);

//--- Display a description of the indicator line state
   panel.DrawText("Line state", panel.CellX(1,1,0)+2, panel.CellY(1,1,0)+2);
   ENUM_LINE_STATE state=LineState(handle,index,0);
   panel.DrawText(LineStateDescription(state),panel.CellX(1,1,1)+2,panel.CellY(1,1,1)+2,clrNONE,90);

//--- Redraw the chart to immediately display all changes on the panel
   ChartRedraw(ChartID());
  }
The panel displays the value of the indicator line and its status.
Besides, when using the dashboard, the panel events handler is called in the OnChartEvent() EA event handler, as well as the events for receiving the bar index under the cursor are handled:
//+------------------------------------------------------------------+
//| ChartEvent function                                              |
//+------------------------------------------------------------------+
void OnChartEvent(const int id,
                  const long &lparam,
                  const double &dparam,
                  const string &sparam)
  {
//--- Handling the panel
//--- Call the panel event handler
   panel.OnChartEvent(id,lparam,dparam,sparam);

//--- If the cursor moves or a click is made on the chart
   if(id==CHARTEVENT_MOUSE_MOVE || id==CHARTEVENT_CLICK)
     {
      //--- Declare the variables to record time and price coordinates in them
      datetime time=0;
      double price=0;
      int wnd=0;
      //--- If the cursor coordinates are converted to date and time
      if(ChartXYToTimePrice(ChartID(),(int)lparam,(int)dparam,wnd,time,price))
        {
         //--- write the bar index where the cursor is located to a global variable
         mouse_bar_index=iBarShift(Symbol(),PERIOD_CURRENT,time);
         //--- Display the bar data under the cursor on the panel
         DrawData(mouse_bar_index,time);
        }
     }

//--- If we received a custom event, display the appropriate message in the journal
   if(id>CHARTEVENT_CUSTOM)
     {
      //--- Here we can implement handling a click on the close button on the panel
      PrintFormat("%s: Event id=%ld, object id (lparam): %lu, event message (sparam): %s",__FUNCTION__,id,lparam,sparam);
     }
  }
After compiling the EA and launching it on the chart, we can monitor the state of the indicator value and line on the panel:
You can view the TestTrendStdDev.mq5 test EA in the files attached to the article.
Triple Exponential Moving Average
Triple Exponential Moving Average (TEMA) was developed by Patrick Mulloy and published in the "Technical Analysis of Stocks & Commodities" magazine. Its calculation principles are similar to that of DEMA (Double Exponential Moving Average). The name "Triple Exponential Moving Average" does not very correctly reflect its algorithm. It is a unique blend of single, double and triple exponential moving averages, providing less latency than either one alone.
TEMA can be used instead of traditional moving averages. It can be used for smoothing price data, as well as for smoothing other indicators.
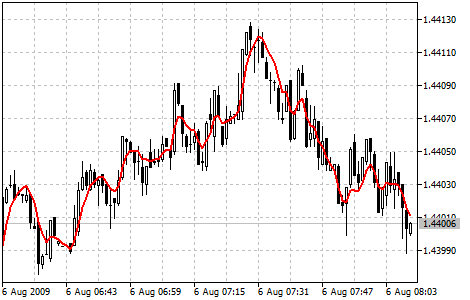
Parameters
iTEMA() function is used to create the indicator handle:
Return the handle of the Triple Exponential Moving Average indicator. Only one buffer.
int  iTEMA(
   string              symbol,            // symbol name
   ENUM_TIMEFRAMES     period,            // period
   int                 ma_period,         // averaging period
   int                 ma_shift,          // horizontal shift of the indicator
   ENUM_APPLIED_PRICE  applied_price      // price type or handle
   );
symbol
[in] The symbol name of the financial instrument whose data is to be used to calculate the indicator. NULL means the current symbol.
period
[in] The period value can be one of the ENUM_TIMEFRAMES enumeration values, 0 means the current timeframe.
ma_period
[in] Period (number of bars) for the indicator calculation.
ma_shift
[in] Shift of the indicator in relation to the price chart.
applied_price
[in] Applied price. Any of the ENUM_APPLIED_PRICE price constants or another indicator handle.
Return the handle of the specified technical indicator. If failed, return INVALID_HANDLE. To free up computer memory from an unused indicator, use IndicatorRelease() the indicator handle is passed to.
Declare input and global variables in the EA to create the indicator:
//+------------------------------------------------------------------+
//|                                                TestTrendTEMA.mq5 |
//|                                  Copyright 2023, MetaQuotes Ltd. |
//|                                             https://www.mql5.com |
//+------------------------------------------------------------------+
#property copyright "Copyright 2023, MetaQuotes Ltd."
#property link      "https://www.mql5.com"
#property version   "1.00"
//--- enums
enum ENUM_LINE_STATE
  {
   LINE_STATE_NONE,        // Undefined state
   LINE_STATE_UP,          // Upward
   LINE_STATE_DOWN,        // Downward
   LINE_STATE_TURN_UP,     // Upward reversal
   LINE_STATE_TURN_DOWN,   // Downward reversal
   LINE_STATE_STOP_UP,     // Upward stop
   LINE_STATE_STOP_DOWN,   // Downward stop
   LINE_STATE_ABOVE,       // Above value
   LINE_STATE_UNDER,       // Below value
   LINE_STATE_CROSS_UP,    // Crossing value upwards
   LINE_STATE_CROSS_DOWN,  // Crossing value downwards
   LINE_STATE_TOUCH_BELOW, // Touching value from below
   LINE_STATE_TOUCH_ABOVE, // Touch value from above
   LINE_STATE_EQUALS,      // Equal to value
  };
//--- input parameters
input uint                 InpPeriod=  14;            /* Period         */
input int                  InpShift =  0;             /* TEMA Shift     */
input ENUM_APPLIED_PRICE   InpPrice =  PRICE_CLOSE;   /* Applied Price  */
//--- global variables
int      handle=INVALID_HANDLE;  // Indicator handle
int      period=0;               // Triple Exponential Moving Average calculation period
int      ind_digits=0;           // Number of decimal places in the indicator values
string   ind_title;              // Indicator description
When using the dashboard in the EA, declare global variables and include the panel class file:
//+------------------------------------------------------------------+
//|                                                TestTrendTEMA.mq5 |
//|                                  Copyright 2023, MetaQuotes Ltd. |
//|                                             https://www.mql5.com |
//+------------------------------------------------------------------+
#property copyright "Copyright 2023, MetaQuotes Ltd."
#property link      "https://www.mql5.com"
#property version   "1.00"
//--- includes
#include <Dashboard\Dashboard.mqh>
//--- enums
enum ENUM_LINE_STATE
  {
   LINE_STATE_NONE,        // Undefined state
   LINE_STATE_UP,          // Upward
   LINE_STATE_DOWN,        // Downward
   LINE_STATE_TURN_UP,     // Upward reversal
   LINE_STATE_TURN_DOWN,   // Downward reversal
   LINE_STATE_STOP_UP,     // Upward stop
   LINE_STATE_STOP_DOWN,   // Downward stop
   LINE_STATE_ABOVE,       // Above value
   LINE_STATE_UNDER,       // Below value
   LINE_STATE_CROSS_UP,    // Crossing value upwards
   LINE_STATE_CROSS_DOWN,  // Crossing value downwards
   LINE_STATE_TOUCH_BELOW, // Touching value from below
   LINE_STATE_TOUCH_ABOVE, // Touch value from above
   LINE_STATE_EQUALS,      // Equal to value
  };
//--- input parameters
input uint                 InpPeriod=  14;            /* Period         */
input int                  InpShift =  0;             /* StdDev Shift   */
input ENUM_APPLIED_PRICE   InpPrice =  PRICE_CLOSE;   /* Applied Price  */
//--- global variables
int      handle=INVALID_HANDLE;  // Indicator handle
int      period=0;               // Triple Exponential Moving Average calculation period
int      ind_digits=0;           // Number of decimal places in the indicator values
string   ind_title;              // Indicator description
//--- variables for the panel
int      mouse_bar_index;        // Index of the bar the data is taken from
CDashboard *panel=NULL;          // Pointer to the panel object
Initialization
Setting the values of global variables for the indicator and creating its handle:
//+------------------------------------------------------------------+
//| Expert initialization function                                   |
//+------------------------------------------------------------------+
int OnInit()
  {
//--- create timer
   EventSetTimer(60);

//--- Indicator
//--- Set and adjust the calculation period and levels if necessary
   period=int(InpPeriod<1 ? 14 : InpPeriod);
//--- Set the indicator name and the number of decimal places
   ind_title=StringFormat("TEMA(%lu)",period);
   ind_digits=Digits()+1;
//--- Create indicator handle
   ResetLastError();
   handle=iTEMA(Symbol(),PERIOD_CURRENT,period,InpShift,InpPrice);
   if(handle==INVALID_HANDLE)
     {
      PrintFormat("%s: Failed to create indicator handle %s. Error %ld",__FUNCTION__,ind_title,GetLastError());
      return INIT_FAILED;
     }

//--- Successful initialization
   return(INIT_SUCCEEDED);
  }
If the EA involves using the dashboard, we should create it:
//+------------------------------------------------------------------+
//| Expert initialization function                                   |
//+------------------------------------------------------------------+
int OnInit()
  {
//--- create timer
   EventSetTimer(60);

//--- Indicator
//--- Set and adjust the calculation period and levels if necessary
   period=int(InpPeriod<1 ? 14 : InpPeriod);
//--- Set the indicator name and the number of decimal places
   ind_title=StringFormat("TEMA(%lu)",period);
   ind_digits=Digits()+1;
//--- Create indicator handle
   ResetLastError();
   handle=iTEMA(Symbol(),PERIOD_CURRENT,period,InpShift,InpPrice);
   if(handle==INVALID_HANDLE)
     {
      PrintFormat("%s: Failed to create indicator handle %s. Error %ld",__FUNCTION__,ind_title,GetLastError());
      return INIT_FAILED;
     }

//--- Dashboard
//--- Create the panel
   panel=new CDashboard(1,20,20,197,225);
   if(panel==NULL)
     {
      Print("Error. Failed to create panel object");
      return INIT_FAILED;
     }
//--- Set font parameters
   panel.SetFontParams("Calibri",9);
//--- Display the panel with the "Symbol, Timeframe description" header text
   panel.View(Symbol()+", "+StringSubstr(EnumToString(Period()),7));
//--- Create a table with ID 0 to display bar data in it
   panel.CreateNewTable(0);
//--- Draw a table with ID 0 on the panel background
   panel.DrawGrid(0,2,20,6,2,18,96);

//--- Create a table with ID 1 to display indicator data in it
   panel.CreateNewTable(1);
//--- Get the Y2 table coordinate with ID 0 and
//--- set the Y1 coordinate for the table with ID 1
   int y1=panel.TableY2(0)+22;
//--- Draw a table with ID 1 on the panel background
   panel.DrawGrid(1,2,y1,3,2,18,96);

//--- Display tabular data in the journal
   panel.GridPrint(0,2);
   panel.GridPrint(1,2);
//--- Initialize the variable with the index of the mouse cursor bar
   mouse_bar_index=0;
//--- Display the data of the current bar on the panel
   DrawData(mouse_bar_index,TimeCurrent());

//--- Successful initialization
   return(INIT_SUCCEEDED);
  }
Deinitialization
Release the indicator handle in the EA OnDeinit() handle:
//+------------------------------------------------------------------+
//| Expert deinitialization function                                 |
//+------------------------------------------------------------------+
void OnDeinit(const int reason)
  {
//--- destroy timer
   EventKillTimer();

//--- Release handle of the indicator
   ResetLastError();
   if(!IndicatorRelease(handle))
      PrintFormat("%s: IndicatorRelease failed. Error %ld",__FUNCTION__,GetLastError());
//--- Clear all comments on the chart
   Comment("");
  }
The created dashboard object is removed when using the dashboard:
//+------------------------------------------------------------------+
//| Expert deinitialization function                                 |
//+------------------------------------------------------------------+
void OnDeinit(const int reason)
  {
//--- destroy timer
   EventKillTimer();

//--- Release handle of the indicator
   ResetLastError();
   if(!IndicatorRelease(handle))
      PrintFormat("%s: IndicatorRelease failed. Error %ld",__FUNCTION__,GetLastError());
//--- Clear all comments on the chart
   Comment("");

//--- If the panel object exists, delete it
   if(panel!=NULL)
      delete panel;
  }
Data retrieval
General functions for obtaining data by the indicator handle:
//+------------------------------------------------------------------+
//| Return the indicator data on the specified bar                   |
//+------------------------------------------------------------------+
double IndicatorValue(const int ind_handle,const int index,const int buffer_num)
  {
   double array[1]={0};
   ResetLastError();
   if(CopyBuffer(ind_handle,buffer_num,index,1,array)!=1)
     {
      PrintFormat("%s: CopyBuffer failed. Error %ld",__FUNCTION__,GetLastError());
      return EMPTY_VALUE;
     }
   return array[0];
  }
//+------------------------------------------------------------------+
//| Return the state of the indicator line                           |
//+------------------------------------------------------------------+
ENUM_LINE_STATE LineState(const int ind_handle,const int index,const int buffer_num)
  {
//--- Get the values of the indicator line with the shift (0,1,2) relative to the passed index
   const double value0=IndicatorValue(ind_handle,index,  buffer_num);
   const double value1=IndicatorValue(ind_handle,index+1,buffer_num);
   const double value2=IndicatorValue(ind_handle,index+2,buffer_num);
//--- If at least one of the values could not be obtained, return an undefined value
   if(value0==EMPTY_VALUE || value1==EMPTY_VALUE || value2==EMPTY_VALUE)
      return LINE_STATE_NONE;
//--- Line upward reversal (value2>value1 && value0>value1)
   if(NormalizeDouble(value2-value1,ind_digits)>0 && NormalizeDouble(value0-value1,ind_digits)>0)
      return LINE_STATE_TURN_UP;
//--- Line upward direction (value2<=value1 && value0>value1)
   else if(NormalizeDouble(value2-value1,ind_digits)<=0 && NormalizeDouble(value0-value1,ind_digits)>0)
      return LINE_STATE_UP;
//--- Line upward stop (value2<=value1 && value0==value1)
   else if(NormalizeDouble(value2-value1,ind_digits)<=0 && NormalizeDouble(value0-value1,ind_digits)==0)
      return LINE_STATE_STOP_UP;
//--- Line downward reversal (value2<value1 && value0<value1)
   if(NormalizeDouble(value2-value1,ind_digits)<0 && NormalizeDouble(value0-value1,ind_digits)<0)
      return LINE_STATE_TURN_DOWN;
//--- Line downward direction (value2>=value1 && value0<value1)
   else if(NormalizeDouble(value2-value1,ind_digits)>=0 && NormalizeDouble(value0-value1,ind_digits)<0)
      return LINE_STATE_DOWN;
//--- Line downward stop (value2>=value1 && value0==value1)
   else if(NormalizeDouble(value2-value1,ind_digits)>=0 && NormalizeDouble(value0-value1,ind_digits)==0)
      return LINE_STATE_STOP_DOWN;
//--- Undefined state
   return LINE_STATE_NONE;
  }
//+------------------------------------------------------------------+
//| Return the state of the line relative to the specified level     |
//+------------------------------------------------------------------+
ENUM_LINE_STATE LineStateRelative(const int ind_handle,const int index,const int buffer_num,const double level0,const double level1=EMPTY_VALUE)
  {
//--- Get the values of the indicator line with the shift (0,1) relative to the passed index
   const double value0=IndicatorValue(ind_handle,index,  buffer_num);
   const double value1=IndicatorValue(ind_handle,index+1,buffer_num);
//--- If at least one of the values could not be obtained, return an undefined value
   if(value0==EMPTY_VALUE || value1==EMPTY_VALUE)
      return LINE_STATE_NONE;
//--- Define the second level to compare
   double level=(level1==EMPTY_VALUE ? level0 : level1);
//--- The line is below the level (value1<level && value0<level0)
   if(NormalizeDouble(value1-level,ind_digits)<0 && NormalizeDouble(value0-level0,ind_digits)<0)
      return LINE_STATE_UNDER;
//--- The line is above the level (value1>level && value0>level0)
   if(NormalizeDouble(value1-level,ind_digits)>0 && NormalizeDouble(value0-level0,ind_digits)>0)
      return LINE_STATE_ABOVE;
//--- The line crossed the level upwards (value1<=level && value0>level0)
   if(NormalizeDouble(value1-level,ind_digits)<=0 && NormalizeDouble(value0-level0,ind_digits)>0)
      return LINE_STATE_CROSS_UP;
//--- The line crossed the level downwards (value1>=level && value0<level0)
   if(NormalizeDouble(value1-level,ind_digits)>=0 && NormalizeDouble(value0-level0,ind_digits)<0)
      return LINE_STATE_CROSS_DOWN;
//--- The line touched the level from below (value1<level0 && value0==level0)
   if(NormalizeDouble(value1-level,ind_digits)<0 && NormalizeDouble(value0-level0,ind_digits)==0)
      return LINE_STATE_TOUCH_BELOW;
//--- The line touched the level from above (value1>level0 && value0==level0)
   if(NormalizeDouble(value1-level,ind_digits)>0 && NormalizeDouble(value0-level0,ind_digits)==0)
      return LINE_STATE_TOUCH_BELOW;
//--- Line is equal to the level value (value1==level0 && value0==level0)
   if(NormalizeDouble(value1-level,ind_digits)==0 && NormalizeDouble(value0-level0,ind_digits)==0)
      return LINE_STATE_EQUALS;
//--- Undefined state
   return LINE_STATE_NONE;
  }
//+------------------------------------------------------------------+
//| Return the indicator line state description                      |
//+------------------------------------------------------------------+
string LineStateDescription(const ENUM_LINE_STATE state)
  {
   switch(state)
     {
      case LINE_STATE_UP         :  return "Up";
      case LINE_STATE_STOP_UP    :  return "Stop Up";
      case LINE_STATE_TURN_UP    :  return "Turn Up";
      case LINE_STATE_DOWN       :  return "Down";
      case LINE_STATE_STOP_DOWN  :  return "Stop Down";
      case LINE_STATE_TURN_DOWN  :  return "Turn Down";
      case LINE_STATE_ABOVE      :  return "Above level";
      case LINE_STATE_UNDER      :  return "Under level";
      case LINE_STATE_CROSS_UP   :  return "Crossing Up";
      case LINE_STATE_CROSS_DOWN :  return "Crossing Down";
      case LINE_STATE_TOUCH_BELOW:  return "Touch from Below";
      case LINE_STATE_TOUCH_ABOVE:  return "Touch from Above";
      case LINE_STATE_EQUALS     :  return "Equals";
      default                    :  return "Unknown";
     }
  }
When using the dashboard, data is displayed on the panel using the function:
//+------------------------------------------------------------------+
//| Display data from the specified timeseries index to the panel    |
//+------------------------------------------------------------------+
void DrawData(const int index,const datetime time)
  {
//--- Declare the variables to receive data in them
   MqlTick  tick={0};
   MqlRates rates[1];

//--- Exit if unable to get the current prices
   if(!SymbolInfoTick(Symbol(),tick))
      return;
//--- Exit if unable to get the bar data by the specified index
   if(CopyRates(Symbol(),PERIOD_CURRENT,index,1,rates)!=1)
      return;

//--- Set font parameters for bar and indicator data headers
   int  size=0;
   uint flags=0;
   uint angle=0;
   string name=panel.FontParams(size,flags,angle);
   panel.SetFontParams(name,9,FW_BOLD);
   panel.DrawText("Bar data ["+(string)index+"]",3,panel.TableY1(0)-16,clrMaroon,panel.Width()-6);
   panel.DrawText("Indicator data ["+(string)index+"]",3,panel.TableY1(1)-16,clrGreen,panel.Width()-6);
//--- Set font parameters for bar and indicator data
   panel.SetFontParams(name,9);

//--- Display the data of the specified bar in table 0 on the panel
   panel.DrawText("Date",  panel.CellX(0,0,0)+2, panel.CellY(0,0,0)+2); panel.DrawText(TimeToString(  rates[0].time,TIME_DATE),     panel.CellX(0,0,1)+2, panel.CellY(0,0,1)+2,clrNONE,90);
   panel.DrawText("Time",  panel.CellX(0,1,0)+2, panel.CellY(0,1,0)+2); panel.DrawText(TimeToString(  rates[0].time,TIME_MINUTES),  panel.CellX(0,1,1)+2, panel.CellY(0,1,1)+2,clrNONE,90);
   panel.DrawText("Open",  panel.CellX(0,2,0)+2, panel.CellY(0,2,0)+2); panel.DrawText(DoubleToString(rates[0].open,Digits()),      panel.CellX(0,2,1)+2, panel.CellY(0,2,1)+2,clrNONE,90);
   panel.DrawText("High",  panel.CellX(0,3,0)+2, panel.CellY(0,3,0)+2); panel.DrawText(DoubleToString(rates[0].high,Digits()),      panel.CellX(0,3,1)+2, panel.CellY(0,3,1)+2,clrNONE,90);
   panel.DrawText("Low",   panel.CellX(0,4,0)+2, panel.CellY(0,4,0)+2); panel.DrawText(DoubleToString(rates[0].low,Digits()),       panel.CellX(0,4,1)+2, panel.CellY(0,4,1)+2,clrNONE,90);
   panel.DrawText("Close", panel.CellX(0,5,0)+2, panel.CellY(0,5,0)+2); panel.DrawText(DoubleToString(rates[0].close,Digits()),     panel.CellX(0,5,1)+2, panel.CellY(0,5,1)+2,clrNONE,90);

//--- Display the indicator data from the specified bar on the panel in table 1
   panel.DrawText(ind_title, panel.CellX(1,0,0)+2, panel.CellY(1,0,0)+2);
   double value=IndicatorValue(handle,index,0);
   string value_str=(value!=EMPTY_VALUE ? DoubleToString(value,ind_digits) : "");
   panel.DrawText(value_str,panel.CellX(1,0,1)+2,panel.CellY(1,0,1)+2,clrNONE,100);

//--- Display a description of the indicator line state
   panel.DrawText("Line state", panel.CellX(1,1,0)+2, panel.CellY(1,1,0)+2);
   ENUM_LINE_STATE state=LineState(handle,index,0);
   panel.DrawText(LineStateDescription(state),panel.CellX(1,1,1)+2,panel.CellY(1,1,1)+2,clrNONE,90);

//--- Redraw the chart to immediately display all changes on the panel
   ChartRedraw(ChartID());
  }
The panel displays the indicator line values and its status.
Besides, when using the dashboard, the panel events handler is called in the OnChartEvent() EA event handler, as well as the events for receiving the bar index under the cursor are handled:
//+------------------------------------------------------------------+
//| ChartEvent function                                              |
//+------------------------------------------------------------------+
void OnChartEvent(const int id,
                  const long &lparam,
                  const double &dparam,
                  const string &sparam)
  {
//--- Handling the panel
//--- Call the panel event handler
   panel.OnChartEvent(id,lparam,dparam,sparam);

//--- If the cursor moves or a click is made on the chart
   if(id==CHARTEVENT_MOUSE_MOVE || id==CHARTEVENT_CLICK)
     {
      //--- Declare the variables to record time and price coordinates in them
      datetime time=0;
      double price=0;
      int wnd=0;
      //--- If the cursor coordinates are converted to date and time
      if(ChartXYToTimePrice(ChartID(),(int)lparam,(int)dparam,wnd,time,price))
        {
         //--- write the bar index where the cursor is located to a global variable
         mouse_bar_index=iBarShift(Symbol(),PERIOD_CURRENT,time);
         //--- Display the bar data under the cursor on the panel
         DrawData(mouse_bar_index,time);
        }
     }

//--- If we received a custom event, display the appropriate message in the journal
   if(id>CHARTEVENT_CUSTOM)
     {
      //--- Here we can implement handling a click on the close button on the panel
      PrintFormat("%s: Event id=%ld, object id (lparam): %lu, event message (sparam): %s",__FUNCTION__,id,lparam,sparam);
     }
  }
After compiling the EA and launching it on the chart, we can monitor the state of the indicator value and line on the panel:
You can view the TestTrendTEMA.mq5 test EA in the files attached to the article.
Variable Index Dynamic Average
Variable Index Dynamic Average (VIDYA) was developed by Tushar Chande. It is an original method of calculating the Exponential Moving Average (EMA) with the dynamically changing averaging period. Period of averaging depends on the market volatility; as the measure of volatility Chande Momentum Oscillator (CMO) was chosen. This oscillator measures the ratio between the sum of positive increments and sum of negative increments for a certain period (CMO period). CMO value is used as the ratio to the smoothing factor EMA. Thus, the VIDYA indicator has two settings: the CMO oscillator period and the exponential moving average smoothing period (EMA period).
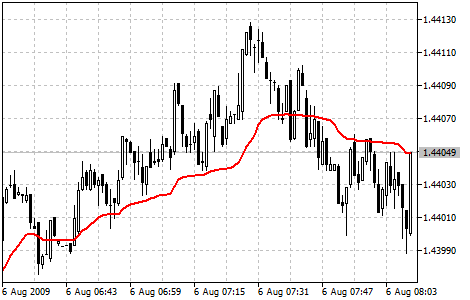
Parameters
iVIDyA() function is used to create the indicator handle:
Returns the handle of the Variable Index Dynamic Average indicator. Only one buffer.
int  iVIDyA(
   string              symbol,            // symbol name
   ENUM_TIMEFRAMES     period,            // period
   int                 cmo_period,        // Chande Momentum period
   int                 ema_period,        // smoothing factor period
   int                 ma_shift,          // horizontal shift of the indicator
   ENUM_APPLIED_PRICE  applied_price      // price type or handle
   );
symbol
[in] The symbol name of the financial instrument whose data is to be used to calculate the indicator. NULL means the current symbol.
period
[in] The period value can be one of the ENUM_TIMEFRAMES enumeration values, 0 means the current timeframe.
cmo_period
[in] Period (number of bars) for calculating Chande Momentum Oscillator.
ema_period
[in] EMA Period (number of bars) for calculating the smoothing factor.
ma_shift
[in] Shift of the indicator in relation to the price chart.
applied_price
[in] Applied price. Any of the ENUM_APPLIED_PRICE price constants or another indicator handle.
Return the handle of the specified technical indicator. If failed, return INVALID_HANDLE. To free up computer memory from an unused indicator, use IndicatorRelease() the indicator handle is passed to.
Declare input and global variables in the EA to create the indicator:
//+------------------------------------------------------------------+
//|                                               TestTrendVIDYA.mq5 |
//|                                  Copyright 2023, MetaQuotes Ltd. |
//|                                             https://www.mql5.com |
//+------------------------------------------------------------------+
#property copyright "Copyright 2023, MetaQuotes Ltd."
#property link      "https://www.mql5.com"
#property version   "1.00"
//--- enums
enum ENUM_LINE_STATE
  {
   LINE_STATE_NONE,        // Undefined state
   LINE_STATE_UP,          // Upward
   LINE_STATE_DOWN,        // Downward
   LINE_STATE_TURN_UP,     // Upward reversal
   LINE_STATE_TURN_DOWN,   // Downward reversal
   LINE_STATE_STOP_UP,     // Upward stop
   LINE_STATE_STOP_DOWN,   // Downward stop
   LINE_STATE_ABOVE,       // Above value
   LINE_STATE_UNDER,       // Below value
   LINE_STATE_CROSS_UP,    // Crossing value upwards
   LINE_STATE_CROSS_DOWN,  // Crossing value downwards
   LINE_STATE_TOUCH_BELOW, // Touching value from below
   LINE_STATE_TOUCH_ABOVE, // Touch value from above
   LINE_STATE_EQUALS,      // Equal to value
  };
//--- input parameters
input uint                 InpPeriodCMO=  9;             /* CMO Period     */
input int                  InpShift    =  0;             /* VIDYA Shift    */
input uint                 InpPeriodEMA=  12;            /* EMA Period     */
input ENUM_APPLIED_PRICE   InpPrice    =  PRICE_CLOSE;   /* Applied Price  */
//--- global variables
int      handle=INVALID_HANDLE;  // Indicator handle
int      period_cmo=0;           // CMO calculation period
int      period_ema=0;           // EMA calculation period
int      ind_digits=0;           // Number of decimal places in the indicator values
string   ind_title;              // Indicator description
When using the dashboard in the EA, declare global variables and include the panel class file:
//+------------------------------------------------------------------+
//|                                               TestTrendVIDYA.mq5 |
//|                                  Copyright 2023, MetaQuotes Ltd. |
//|                                             https://www.mql5.com |
//+------------------------------------------------------------------+
#property copyright "Copyright 2023, MetaQuotes Ltd."
#property link      "https://www.mql5.com"
#property version   "1.00"
//--- includes
#include <Dashboard\Dashboard.mqh>
//--- enums
enum ENUM_LINE_STATE
  {
   LINE_STATE_NONE,        // Undefined state
   LINE_STATE_UP,          // Upward
   LINE_STATE_DOWN,        // Downward
   LINE_STATE_TURN_UP,     // Upward reversal
   LINE_STATE_TURN_DOWN,   // Downward reversal
   LINE_STATE_STOP_UP,     // Upward stop
   LINE_STATE_STOP_DOWN,   // Downward stop
   LINE_STATE_ABOVE,       // Above value
   LINE_STATE_UNDER,       // Below value
   LINE_STATE_CROSS_UP,    // Crossing value upwards
   LINE_STATE_CROSS_DOWN,  // Crossing value downwards
   LINE_STATE_TOUCH_BELOW, // Touching value from below
   LINE_STATE_TOUCH_ABOVE, // Touch value from above
   LINE_STATE_EQUALS,      // Equal to value
  };
//--- input parameters
input uint                 InpPeriodCMO=  9;             /* CMO Period     */
input int                  InpShift    =  0;             /* VIDYA Shift    */
input uint                 InpPeriodEMA=  12;            /* EMA Period     */
input ENUM_APPLIED_PRICE   InpPrice    =  PRICE_CLOSE;   /* Applied Price  */
//--- global variables
int      handle=INVALID_HANDLE;  // Indicator handle
int      period_cmo=0;           // CMO calculation period
int      period_ema=0;           // EMA calculation period
int      ind_digits=0;           // Number of decimal places in the indicator values
string   ind_title;              // Indicator description
//--- variables for the panel
int      mouse_bar_index;        // Index of the bar the data is taken from
CDashboard *panel=NULL;          // Pointer to the panel object
Initialization
Setting the values of global variables for the indicator and creating its handle:
//+------------------------------------------------------------------+
//| Expert initialization function                                   |
//+------------------------------------------------------------------+
int OnInit()
  {
//--- create timer
   EventSetTimer(60);

//--- Indicator
//--- Set and adjust the calculation period and levels if necessary
   period_cmo=int(InpPeriodCMO<1 ? 9 : InpPeriodCMO);
   period_ema=int(InpPeriodEMA<1 ? 12 : InpPeriodEMA);
//--- Set the indicator name and the number of decimal places
   ind_title=StringFormat("VIDYA(%lu,%lu)",period_cmo,period_ema);
   ind_digits=Digits()+1;
//--- Create indicator handle
   ResetLastError();
   handle=iVIDyA(Symbol(),PERIOD_CURRENT,period_cmo,period_ema,InpShift,InpPrice);
   if(handle==INVALID_HANDLE)
     {
      PrintFormat("%s: Failed to create indicator handle %s. Error %ld",__FUNCTION__,ind_title,GetLastError());
      return INIT_FAILED;
     }

//--- Successful initialization
   return(INIT_SUCCEEDED);
  }
If the EA involves using the dashboard, we should create it:
//+------------------------------------------------------------------+
//| Expert initialization function                                   |
//+------------------------------------------------------------------+
int OnInit()
  {
//--- create timer
   EventSetTimer(60);

//--- Indicator
//--- Set and adjust the calculation period and levels if necessary
   period_cmo=int(InpPeriodCMO<1 ? 9 : InpPeriodCMO);
   period_ema=int(InpPeriodEMA<1 ? 12 : InpPeriodEMA);
//--- Set the indicator name and the number of decimal places
   ind_title=StringFormat("VIDYA(%lu,%lu)",period_cmo,period_ema);
   ind_digits=Digits()+1;
//--- Create indicator handle
   ResetLastError();
   handle=iVIDyA(Symbol(),PERIOD_CURRENT,period_cmo,period_ema,InpShift,InpPrice);
   if(handle==INVALID_HANDLE)
     {
      PrintFormat("%s: Failed to create indicator handle %s. Error %ld",__FUNCTION__,ind_title,GetLastError());
      return INIT_FAILED;
     }

//--- Dashboard
//--- Create the panel
   panel=new CDashboard(1,20,20,197,225);
   if(panel==NULL)
     {
      Print("Error. Failed to create panel object");
      return INIT_FAILED;
     }
//--- Set font parameters
   panel.SetFontParams("Calibri",9);
//--- Display the panel with the "Symbol, Timeframe description" header text
   panel.View(Symbol()+", "+StringSubstr(EnumToString(Period()),7));
//--- Create a table with ID 0 to display bar data in it
   panel.CreateNewTable(0);
//--- Draw a table with ID 0 on the panel background
   panel.DrawGrid(0,2,20,6,2,18,96);

//--- Create a table with ID 1 to display indicator data in it
   panel.CreateNewTable(1);
//--- Get the Y2 table coordinate with ID 0 and
//--- set the Y1 coordinate for the table with ID 1
   int y1=panel.TableY2(0)+22;
//--- Draw a table with ID 1 on the panel background
   panel.DrawGrid(1,2,y1,3,2,18,96);

//--- Display tabular data in the journal
   panel.GridPrint(0,2);
   panel.GridPrint(1,2);
//--- Initialize the variable with the index of the mouse cursor bar
   mouse_bar_index=0;
//--- Display the data of the current bar on the panel
   DrawData(mouse_bar_index,TimeCurrent());

//--- Successful initialization
   return(INIT_SUCCEEDED);
  }
Deinitialization
Release the indicator handle in the EA OnDeinit() handle:
//+------------------------------------------------------------------+
//| Expert deinitialization function                                 |
//+------------------------------------------------------------------+
void OnDeinit(const int reason)
  {
//--- destroy timer
   EventKillTimer();

//--- Release handle of the indicator
   ResetLastError();
   if(!IndicatorRelease(handle))
      PrintFormat("%s: IndicatorRelease failed. Error %ld",__FUNCTION__,GetLastError());
//--- Clear all comments on the chart
   Comment("");
  }
The created dashboard object is removed when using the dashboard:
//+------------------------------------------------------------------+
//| Expert deinitialization function                                 |
//+------------------------------------------------------------------+
void OnDeinit(const int reason)
  {
//--- destroy timer
   EventKillTimer();

//--- Release handle of the indicator
   ResetLastError();
   if(!IndicatorRelease(handle))
      PrintFormat("%s: IndicatorRelease failed. Error %ld",__FUNCTION__,GetLastError());
//--- Clear all comments on the chart
   Comment("");

//--- If the panel object exists, delete it
   if(panel!=NULL)
      delete panel;
  }
Data retrieval
General functions for obtaining data by the indicator handle:
//+------------------------------------------------------------------+
//| Return the indicator data on the specified bar                   |
//+------------------------------------------------------------------+
double IndicatorValue(const int ind_handle,const int index,const int buffer_num)
  {
   double array[1]={0};
   ResetLastError();
   if(CopyBuffer(ind_handle,buffer_num,index,1,array)!=1)
     {
      PrintFormat("%s: CopyBuffer failed. Error %ld",__FUNCTION__,GetLastError());
      return EMPTY_VALUE;
     }
   return array[0];
  }
//+------------------------------------------------------------------+
//| Return the state of the indicator line                           |
//+------------------------------------------------------------------+
ENUM_LINE_STATE LineState(const int ind_handle,const int index,const int buffer_num)
  {
//--- Get the values of the indicator line with the shift (0,1,2) relative to the passed index
   const double value0=IndicatorValue(ind_handle,index,  buffer_num);
   const double value1=IndicatorValue(ind_handle,index+1,buffer_num);
   const double value2=IndicatorValue(ind_handle,index+2,buffer_num);
//--- If at least one of the values could not be obtained, return an undefined value
   if(value0==EMPTY_VALUE || value1==EMPTY_VALUE || value2==EMPTY_VALUE)
      return LINE_STATE_NONE;
//--- Line upward reversal (value2>value1 && value0>value1)
   if(NormalizeDouble(value2-value1,ind_digits)>0 && NormalizeDouble(value0-value1,ind_digits)>0)
      return LINE_STATE_TURN_UP;
//--- Line upward direction (value2<=value1 && value0>value1)
   else if(NormalizeDouble(value2-value1,ind_digits)<=0 && NormalizeDouble(value0-value1,ind_digits)>0)
      return LINE_STATE_UP;
//--- Line upward stop (value2<=value1 && value0==value1)
   else if(NormalizeDouble(value2-value1,ind_digits)<=0 && NormalizeDouble(value0-value1,ind_digits)==0)
      return LINE_STATE_STOP_UP;
//--- Line downward reversal (value2<value1 && value0<value1)
   if(NormalizeDouble(value2-value1,ind_digits)<0 && NormalizeDouble(value0-value1,ind_digits)<0)
      return LINE_STATE_TURN_DOWN;
//--- Line downward direction (value2>=value1 && value0<value1)
   else if(NormalizeDouble(value2-value1,ind_digits)>=0 && NormalizeDouble(value0-value1,ind_digits)<0)
      return LINE_STATE_DOWN;
//--- Line downward stop (value2>=value1 && value0==value1)
   else if(NormalizeDouble(value2-value1,ind_digits)>=0 && NormalizeDouble(value0-value1,ind_digits)==0)
      return LINE_STATE_STOP_DOWN;
//--- Undefined state
   return LINE_STATE_NONE;
  }
//+------------------------------------------------------------------+
//| Return the state of the line relative to the specified level     |
//+------------------------------------------------------------------+
ENUM_LINE_STATE LineStateRelative(const int ind_handle,const int index,const int buffer_num,const double level0,const double level1=EMPTY_VALUE)
  {
//--- Get the values of the indicator line with the shift (0,1) relative to the passed index
   const double value0=IndicatorValue(ind_handle,index,  buffer_num);
   const double value1=IndicatorValue(ind_handle,index+1,buffer_num);
//--- If at least one of the values could not be obtained, return an undefined value
   if(value0==EMPTY_VALUE || value1==EMPTY_VALUE)
      return LINE_STATE_NONE;
//--- Define the second level to compare
   double level=(level1==EMPTY_VALUE ? level0 : level1);
//--- The line is below the level (value1<level && value0<level0)
   if(NormalizeDouble(value1-level,ind_digits)<0 && NormalizeDouble(value0-level0,ind_digits)<0)
      return LINE_STATE_UNDER;
//--- The line is above the level (value1>level && value0>level0)
   if(NormalizeDouble(value1-level,ind_digits)>0 && NormalizeDouble(value0-level0,ind_digits)>0)
      return LINE_STATE_ABOVE;
//--- The line crossed the level upwards (value1<=level && value0>level0)
   if(NormalizeDouble(value1-level,ind_digits)<=0 && NormalizeDouble(value0-level0,ind_digits)>0)
      return LINE_STATE_CROSS_UP;
//--- The line crossed the level downwards (value1>=level && value0<level0)
   if(NormalizeDouble(value1-level,ind_digits)>=0 && NormalizeDouble(value0-level0,ind_digits)<0)
      return LINE_STATE_CROSS_DOWN;
//--- The line touched the level from below (value1<level0 && value0==level0)
   if(NormalizeDouble(value1-level,ind_digits)<0 && NormalizeDouble(value0-level0,ind_digits)==0)
      return LINE_STATE_TOUCH_BELOW;
//--- The line touched the level from above (value1>level0 && value0==level0)
   if(NormalizeDouble(value1-level,ind_digits)>0 && NormalizeDouble(value0-level0,ind_digits)==0)
      return LINE_STATE_TOUCH_BELOW;
//--- Line is equal to the level value (value1==level0 && value0==level0)
   if(NormalizeDouble(value1-level,ind_digits)==0 && NormalizeDouble(value0-level0,ind_digits)==0)
      return LINE_STATE_EQUALS;
//--- Undefined state
   return LINE_STATE_NONE;
  }
//+------------------------------------------------------------------+
//| Return the indicator line state description                      |
//+------------------------------------------------------------------+
string LineStateDescription(const ENUM_LINE_STATE state)
  {
   switch(state)
     {
      case LINE_STATE_UP         :  return "Up";
      case LINE_STATE_STOP_UP    :  return "Stop Up";
      case LINE_STATE_TURN_UP    :  return "Turn Up";
      case LINE_STATE_DOWN       :  return "Down";
      case LINE_STATE_STOP_DOWN  :  return "Stop Down";
      case LINE_STATE_TURN_DOWN  :  return "Turn Down";
      case LINE_STATE_ABOVE      :  return "Above level";
      case LINE_STATE_UNDER      :  return "Under level";
      case LINE_STATE_CROSS_UP   :  return "Crossing Up";
      case LINE_STATE_CROSS_DOWN :  return "Crossing Down";
      case LINE_STATE_TOUCH_BELOW:  return "Touch from Below";
      case LINE_STATE_TOUCH_ABOVE:  return "Touch from Above";
      case LINE_STATE_EQUALS     :  return "Equals";
      default                    :  return "Unknown";
     }
  }
When using the dashboard, data is displayed on the panel using the function:
//+------------------------------------------------------------------+
//| Display data from the specified timeseries index to the panel    |
//+------------------------------------------------------------------+
void DrawData(const int index,const datetime time)
  {
//--- Declare the variables to receive data in them
   MqlTick  tick={0};
   MqlRates rates[1];

//--- Exit if unable to get the current prices
   if(!SymbolInfoTick(Symbol(),tick))
      return;
//--- Exit if unable to get the bar data by the specified index
   if(CopyRates(Symbol(),PERIOD_CURRENT,index,1,rates)!=1)
      return;

//--- Set font parameters for bar and indicator data headers
   int  size=0;
   uint flags=0;
   uint angle=0;
   string name=panel.FontParams(size,flags,angle);
   panel.SetFontParams(name,9,FW_BOLD);
   panel.DrawText("Bar data ["+(string)index+"]",3,panel.TableY1(0)-16,clrMaroon,panel.Width()-6);
   panel.DrawText("Indicator data ["+(string)index+"]",3,panel.TableY1(1)-16,clrGreen,panel.Width()-6);
//--- Set font parameters for bar and indicator data
   panel.SetFontParams(name,9);

//--- Display the data of the specified bar in table 0 on the panel
   panel.DrawText("Date",  panel.CellX(0,0,0)+2, panel.CellY(0,0,0)+2); panel.DrawText(TimeToString(  rates[0].time,TIME_DATE),     panel.CellX(0,0,1)+2, panel.CellY(0,0,1)+2,clrNONE,90);
   panel.DrawText("Time",  panel.CellX(0,1,0)+2, panel.CellY(0,1,0)+2); panel.DrawText(TimeToString(  rates[0].time,TIME_MINUTES),  panel.CellX(0,1,1)+2, panel.CellY(0,1,1)+2,clrNONE,90);
   panel.DrawText("Open",  panel.CellX(0,2,0)+2, panel.CellY(0,2,0)+2); panel.DrawText(DoubleToString(rates[0].open,Digits()),      panel.CellX(0,2,1)+2, panel.CellY(0,2,1)+2,clrNONE,90);
   panel.DrawText("High",  panel.CellX(0,3,0)+2, panel.CellY(0,3,0)+2); panel.DrawText(DoubleToString(rates[0].high,Digits()),      panel.CellX(0,3,1)+2, panel.CellY(0,3,1)+2,clrNONE,90);
   panel.DrawText("Low",   panel.CellX(0,4,0)+2, panel.CellY(0,4,0)+2); panel.DrawText(DoubleToString(rates[0].low,Digits()),       panel.CellX(0,4,1)+2, panel.CellY(0,4,1)+2,clrNONE,90);
   panel.DrawText("Close", panel.CellX(0,5,0)+2, panel.CellY(0,5,0)+2); panel.DrawText(DoubleToString(rates[0].close,Digits()),     panel.CellX(0,5,1)+2, panel.CellY(0,5,1)+2,clrNONE,90);

//--- Display the indicator data from the specified bar on the panel in table 1
   panel.DrawText(ind_title, panel.CellX(1,0,0)+2, panel.CellY(1,0,0)+2);
   double value=IndicatorValue(handle,index,0);
   string value_str=(value!=EMPTY_VALUE ? DoubleToString(value,ind_digits) : "");
   panel.DrawText(value_str,panel.CellX(1,0,1)+2,panel.CellY(1,0,1)+2,clrNONE,100);

//--- Display a description of the indicator line state
   panel.DrawText("Line state", panel.CellX(1,1,0)+2, panel.CellY(1,1,0)+2);
   ENUM_LINE_STATE state=LineState(handle,index,0);
   panel.DrawText(LineStateDescription(state),panel.CellX(1,1,1)+2,panel.CellY(1,1,1)+2,clrNONE,90);

//--- Redraw the chart to immediately display all changes on the panel
   ChartRedraw(ChartID());
  }
The panel displays the indicator line values and its status.
Besides, when using the dashboard, the panel events handler is called in the OnChartEvent() EA event handler, as well as the events for receiving the bar index under the cursor are handled:
//+------------------------------------------------------------------+
//| ChartEvent function                                              |
//+------------------------------------------------------------------+
void OnChartEvent(const int id,
                  const long &lparam,
                  const double &dparam,
                  const string &sparam)
  {
//--- Handling the panel
//--- Call the panel event handler
   panel.OnChartEvent(id,lparam,dparam,sparam);

//--- If the cursor moves or a click is made on the chart
   if(id==CHARTEVENT_MOUSE_MOVE || id==CHARTEVENT_CLICK)
     {
      //--- Declare the variables to record time and price coordinates in them
      datetime time=0;
      double price=0;
      int wnd=0;
      //--- If the cursor coordinates are converted to date and time
      if(ChartXYToTimePrice(ChartID(),(int)lparam,(int)dparam,wnd,time,price))
        {
         //--- write the bar index where the cursor is located to a global variable
         mouse_bar_index=iBarShift(Symbol(),PERIOD_CURRENT,time);
         //--- Display the bar data under the cursor on the panel
         DrawData(mouse_bar_index,time);
        }
     }

//--- If we received a custom event, display the appropriate message in the journal
   if(id>CHARTEVENT_CUSTOM)
     {
      //--- Here we can implement handling a click on the close button on the panel
      PrintFormat("%s: Event id=%ld, object id (lparam): %lu, event message (sparam): %s",__FUNCTION__,id,lparam,sparam);
     }
  }
After compiling the EA and launching it on the chart, we can monitor the state of the indicator value and line on the panel:
You can view the TestTrendVIDYA.mq5 test EA in the files attached to the article.
Conclusion
We looked at all types of technical indicators available in the MetaTrader 5 terminal, as well as considered their connection to indicators and EAs, and data retrieval. The question of using multi-symbol, multi-period indicators in EAs and indicators remains open. The next article will be devoted to creating tools for connecting multi-symbol, multi-period indicators to EAs and indicators, as well as receiving data and signals from them.
You can copy all codes above 'as is' and use them in your developments. All considered test EAs are attached below.
Translated from Russian by MetaQuotes Ltd.
Original article: https://www.mql5.com/ru/articles/13406
Warning: All rights to these materials are reserved by MetaQuotes Ltd. Copying or reprinting of these materials in whole or in part is prohibited.
This article was written by a user of the site and reflects their personal views. MetaQuotes Ltd is not responsible for the accuracy of the information presented, nor for any consequences resulting from the use of the solutions, strategies or recommendations described.

- Free trading apps
- Over 8,000 signals for copying
- Economic news for exploring financial markets
You agree to website policy and terms of use
New Article Ready-made templates for indicators for EA trading (part 3): trend indicators have been released:
By Artyom Trishkin