MQL5 Programming Articles
Study the MQL5 language for programming trading strategies in numerous published articles mostly written by you - the community members. The articles are grouped into categories to help you quicker find answers to any questions related to programming: Integration, Tester, Trading Strategies, etc.
Follow our new publications and discuss them on the Forum!
Add a new article

You are missing trading opportunities:
- Free trading apps
- Over 8,000 signals for copying
- Economic news for exploring financial markets
Registration
Log in
You agree to website policy and terms of use
If you do not have an account, please register

Machine Learning Blueprint (Part 4): The Hidden Flaw in Your Financial ML Pipeline — Label Concurrency
Discover how to fix a critical flaw in financial machine learning that causes overfit models and poor live performance—label concurrency. When using the triple-barrier method, your training labels overlap in time, violating the core IID assumption of most ML algorithms. This article provides a hands-on solution through sample weighting. You will learn how to quantify temporal overlap between trading signals, calculate sample weights that reflect each observation's unique information, and implement these weights in scikit-learn to build more robust classifiers. Learning these essential techniques will make your trading models more robust, reliable and profitable.

Developing a trading Expert Advisor from scratch (Part 8): A conceptual leap
What is the easiest way to implement new functionality? In this article, we will take one step back and then two steps forward.

Graphics in DoEasy library (Part 97): Independent handling of form object movement
In this article, I will consider the implementation of the independent dragging of any form objects using a mouse. Besides, I will complement the library by error messages and new deal properties previously implemented into the terminal and MQL5.

Neural networks made easy (Part 24): Improving the tool for Transfer Learning
In the previous article, we created a tool for creating and editing the architecture of neural networks. Today we will continue working on this tool. We will try to make it more user friendly. This may see, top be a step away form our topic. But don't you think that a well organized workspace plays an important role in achieving the result.

Creating Custom Indicators in MQL5 (Part 6): Evolving RSI Calculations with Smoothing, Hue Shifts, and Multi-Timeframe Support
In this article, we build a versatile RSI indicator in MQL5 supporting multiple variants, data sources, and smoothing methods for improved analysis. We add hue shifts for color visuals, dynamic boundaries for overbought/oversold zones, and notifications for trend alerts. It includes multi-timeframe support with interpolation, offering us a customizable RSI tool for diverse strategies.

Improve Your Trading Charts With Interactive GUI's in MQL5 (Part I): Movable GUI (I)
Unleash the power of dynamic data representation in your trading strategies or utilities with our comprehensive guide on creating movable GUI in MQL5. Dive into the core concept of chart events and learn how to design and implement simple and multiple movable GUI on the same chart. This article also explores the process of adding elements to your GUI, enhancing their functionality and aesthetic appeal.

Neural networks made easy (Part 19): Association rules using MQL5
We continue considering association rules. In the previous article, we have discussed theoretical aspect of this type of problem. In this article, I will show the implementation of the FP Growth method using MQL5. We will also test the implemented solution using real data.

Trend strength and direction indicator on 3D bars
We will consider a new approach to market trend analysis based on three-dimensional visualization and tensor analysis of the market microstructure.

Understanding Programming Paradigms (Part 2): An Object-Oriented Approach to Developing a Price Action Expert Advisor
Learn about the object-oriented programming paradigm and its application in MQL5 code. This second article goes deeper into the specifics of object-oriented programming, offering hands-on experience through a practical example. You'll learn how to convert our earlier developed procedural price action expert advisor using the EMA indicator and candlestick price data to object-oriented code.

Reimagining Classic Strategies (Part 15): Daily Breakout Trading Strategy
Human traders had long participated in financial markets before the rise of computers, developing rules of thumb that guided their decisions. In this article, we revisit a well-known breakout strategy to test whether such market logic, learned through experience, can hold its own against systematic methods. Our findings show that while the original strategy produced high accuracy, it suffered from instability and poor risk control. By refining the approach, we demonstrate how discretionary insights can be adapted into more robust, algorithmic trading strategies.

Price Action Analysis Toolkit Development (Part 73): Building a Weekend Gap Trading Signal System in MQL5
We extend the weekend gap toolkit with an indicator that turns gap structure into tradeable signals. When price confirms back into the gap, the indicator issues buy/sell arrows, sets TP at the opposite edge, and places SL using current-week extremes. It maintains non-repainting behavior, reconstructs historical signals, updates live, and provides EA-ready buffers for entry markers and TP/SL to support automation.
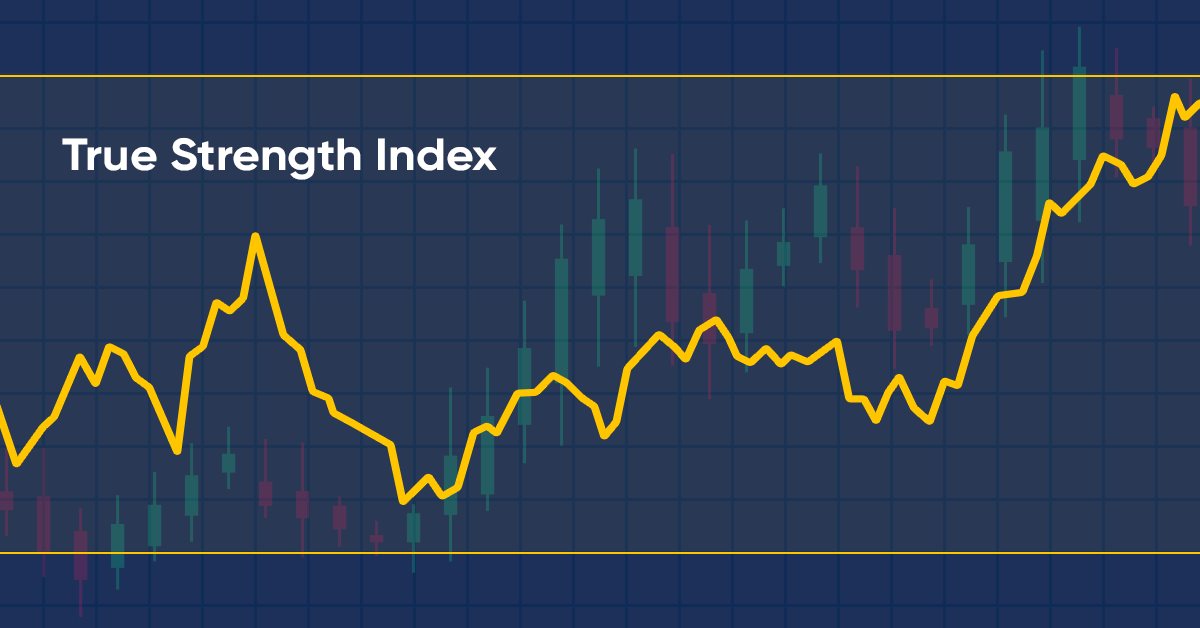
How to create a custom True Strength Index indicator using MQL5
Here is a new article about how to create a custom indicator. This time we will work with the True Strength Index (TSI) and will create an Expert Advisor based on it.

Parafrac Oscillator: Combination of Parabolic and Fractal Indicator
We will explore how the Parabolic SAR and the Fractal indicator can be combined to create a new oscillator-based indicator. By integrating the unique strengths of both tools, traders can aim at developing a more refined and effective trading strategy.

Price Movement: Mathematical Models and Technical Analysis
Forecasting the movements of currency pairs is an important factor in trading success. This article explores various price movement models, analyzes their advantages and disadvantages, and explores their practical application in trading strategies. We will consider approaches that allow us to identify hidden patterns and improve the accuracy of forecasts.

Prices in DoEasy library (part 59): Object to store data of one tick
From this article on, start creating library functionality to work with price data. Today, create an object class which will store all price data which arrived with yet another tick.

Creating an EA that works automatically (Part 05): Manual triggers (II)
Today we'll see how to create an Expert Advisor that simply and safely works in automatic mode. At the end of the previous article, I suggested that it would be appropriate to allow manual use of the EA, at least for a while.

Build Self Optimizing Expert Advisors in MQL5 (Part 5): Self Adapting Trading Rules
The best practices, defining how to safely us an indicator, are not always easy to follow. Quiet market conditions may surprisingly produce readings on the indicator that do not qualify as a trading signal, leading to missed opportunities for algorithmic traders. This article will suggest a potential solution to this problem, as we discuss how to build trading applications capable of adapting their trading rules to the available market data.
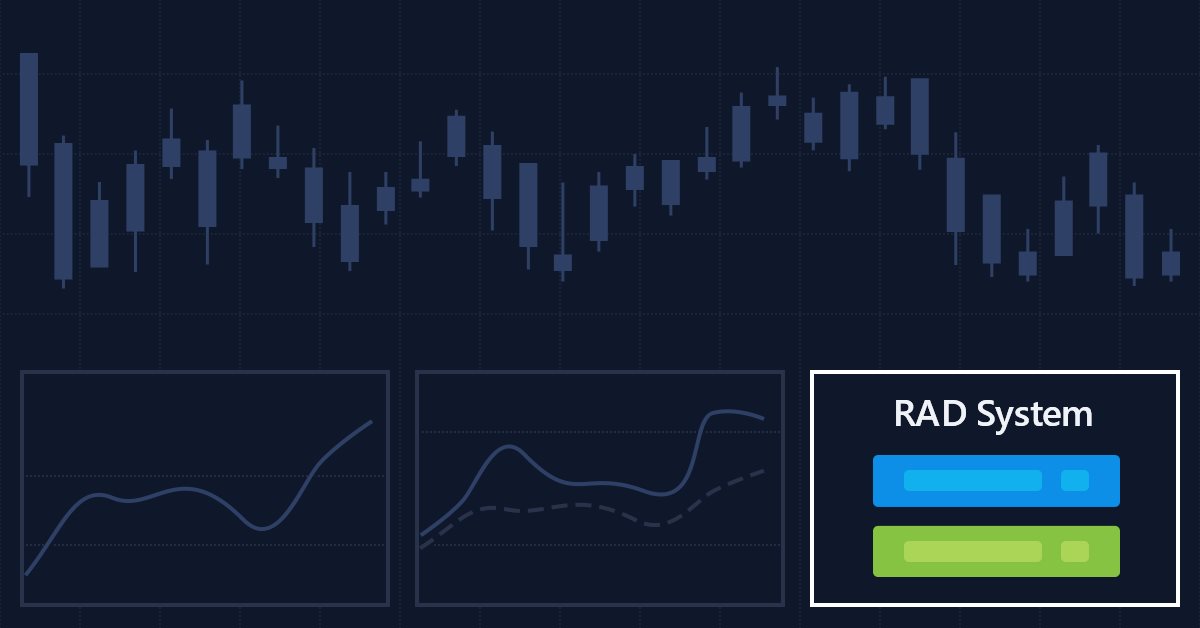
Multiple indicators on one chart (Part 05): Turning MetaTrader 5 into a RAD system (I)
There are a lot of people who do not know how to program but they are quite creative and have great ideas. However, the lack of programming knowledge prevents them from implementing these ideas. Let's see together how to create a Chart Trade using the MetaTrader 5 platform itself, as if it were an IDE.

Better Programmer (Part 03): Give Up doing these 5 things to become a successful MQL5 Programmer
This is the must-read article for anyone wanting to improve their programming career. This article series is aimed at making you the best programmer you can possibly be, no matter how experienced you are. The discussed ideas work for MQL5 programming newbies as well as professionals.

Self-Learning Expert Advisor with a Neural Network Based on a Markov State-Transition Matrix
Self-training EA with a neural network based on a state matrix. We combine Markov chains with a multilayer neural network MLP developed using the ALGLIB MQL5 library. How can Markov chains and neural networks be combined for Forex forecasting?

Building a Smart Trade Manager in MQL5: Automate Break-Even, Trailing Stop, and Partial Close
Learn how to build a Smart Trade Manager Expert Advisor in MQL5 that automates trade management with break-even, trailing stop, and partial close features. A practical, step-by-step guide for traders who want to save time and improve consistency through automation.

Introduction to MQL5 (Part 16): Building Expert Advisors Using Technical Chart Patterns
This article introduces beginners to building an MQL5 Expert Advisor that identifies and trades a classic technical chart pattern — the Head and Shoulders. It covers how to detect the pattern using price action, draw it on the chart, set entry, stop loss, and take profit levels, and automate trade execution based on the pattern.
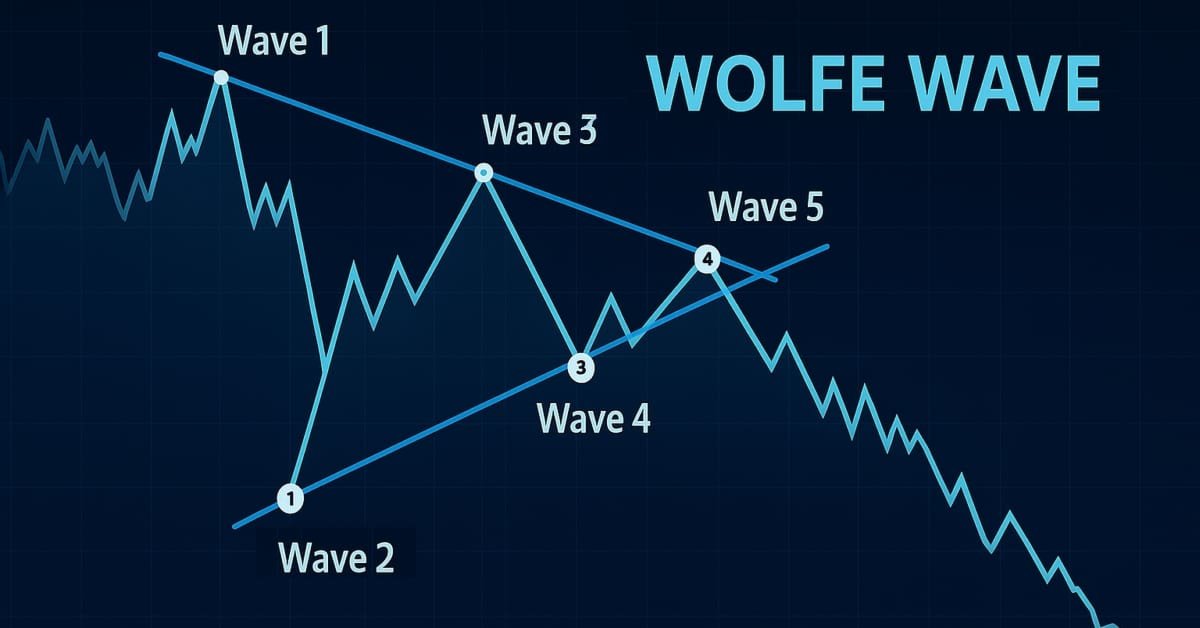
Introduction to MQL5 (Part 19): Automating Wolfe Wave Detection
This article shows how to programmatically identify bullish and bearish Wolfe Wave patterns and trade them using MQL5. We’ll explore how to identify Wolfe Wave structures programmatically and execute trades based on them using MQL5. This includes detecting key swing points, validating pattern rules, and preparing the EA to act on the signals it finds.

Dream Optimization Algorithm (DOA)
A population-based optimization algorithm inspired by a controversial and little-studied phenomenon - the mechanism of human dreams. Agent groups with different "memory", cosine-wave modulation of motion, and an unusual 99/1 phase distribution — learn how these features affect the optimization efficiency of your trading strategies.
Graphics in DoEasy library (Part 90): Standard graphical object events. Basic functionality
In this article, I will implement the basic functionality for tracking standard graphical object events. I will start from a double click event on a graphical object.

Population optimization algorithms: Bacterial Foraging Optimization (BFO)
E. coli bacterium foraging strategy inspired scientists to create the BFO optimization algorithm. The algorithm contains original ideas and promising approaches to optimization and is worthy of further study.

Larry Williams Market Secrets (Part 11): Detecting Smash Day Reversals with a Custom Indicator
We convert Larry Williams’ Smash Day reversal rules into a practical MQL5 indicator that flags confirmed setups with arrows. Step by step, the text shows buffer binding, plot properties, historical mapping, and real‑time updates inside OnCalculate. Adjustable lookback parameters and clean chart rendering help you detect valid reversals quickly while keeping final trade decisions discretionary and context‑driven.

Larry Williams Market Secrets (Part 14): Detecting Hidden Smash Day Reversals with a Custom Indicator
This article develops a practical MQL5 indicator that identifies Hidden Smash Day bars by strict numeric criteria and optional confirmation on the following session. We cover detection routines, buffer registration, and plot configuration to place arrows at valid bars. The approach delivers stable, non-repainting signals for historical testing and real-time monitoring.

Category Theory in MQL5 (Part 1)
Category Theory is a diverse and expanding branch of Mathematics which as of yet is relatively uncovered in the MQL community. These series of articles look to introduce and examine some of its concepts with the overall goal of establishing an open library that attracts comments and discussion while hopefully furthering the use of this remarkable field in Traders' strategy development.

Interview with Leonid Velichkovsky: "The Biggest Myth about Neural Networks is Super-Profitability" (ATC 2010)
The hero of our interview Leonid Velichkovski (LeoV) has already participated in Automated Trading Championships. In 2008, his multicurrency neural network was like a bright flash in the sky, earning $110,000 in a certain moment, but eventually fell victim to its own aggressive money management. Two years ago, in his interview Leonid share his own trading experience and told us about the features of his Expert Advisor. On the eve of the ATC 2010, Leonid talks about the most common myths and misconceptions associated with neural networks.

USD and EUR index charts — example of a MetaTrader 5 service
We will consider the creation and updating of USD index (USDX) and EUR index (EURX) charts using a MetaTrader 5 service as an example. When launching the service, we will check for the presence of the required synthetic instrument, create it if necessary, and place it in the Market Watch window. The minute and tick history of the synthetic instrument is to be created afterwards followed by the chart of the created instrument.

Building a Research-Grounded Grid EA in MQL5: Why Most Grid EAs Fail and What Taranto Proved
This article implements a regime-adaptive grid trading EA based on the PhD research of Aldo Taranto. It presents a regime‑adaptive grid trading EA that constrains risk through restartable cycles and equity‑based safeguards. We explain why naive grids fail (variance growth and almost‑sure ruin), derive the loss formula for real‑time exposure, and implement regime‑aware gating, ATR‑dynamic spacing, and a live kill switch. Readers get the mathematical tools and production patterns needed to build, test, and operate a constrained grid safely.

Developing a trading Expert Advisor from scratch (Part 22): New order system (V)
Today we will continue to develop the new order system. It is not that easy to implement a new system as we often encounter problems which greatly complicate the process. When these problems appear, we have to stop and re-analyze the direction in which we are moving.

Parallel Particle Swarm Optimization
The article describes a method of fast optimization using the particle swarm algorithm. It also presents the method implementation in MQL, which is ready for use both in single-threaded mode inside an Expert Advisor and in a parallel multi-threaded mode as an add-on that runs on local tester agents.

Technical Analysis: How Do We Analyze?
This article briefly describes the author's opinion on redrawing indicators, multi-timeframe indicators and displaying of quotes with Japanese candlesticks. The article contain no programming specifics and is of a general character.

Creating a Dynamic Multi-Symbol, Multi-Period Relative Strength Indicator (RSI) Indicator Dashboard in MQL5
In this article, we develop a dynamic multi-symbol, multi-period RSI indicator dashboard in MQL5, providing traders real-time RSI values across various symbols and timeframes. The dashboard features interactive buttons, real-time updates, and color-coded indicators to help traders make informed decisions.

CCI indicator. Three transformation steps
In this article, I will make additional changes to the CCI affecting the very logic of this indicator. Moreover, we will be able to see it in the main chart window.

Selection and navigation utility in MQL5 and MQL4: Adding "homework" tabs and saving graphical objects
In this article, we are going to expand the capabilities of the previously created utility by adding tabs for selecting the symbols we need. We will also learn how to save graphical objects we have created on the specific symbol chart, so that we do not have to constantly create them again. Besides, we will find out how to work only with symbols that have been preliminarily selected using a specific website.

Experiments with neural networks (Part 5): Normalizing inputs for passing to a neural network
Neural networks are an ultimate tool in traders' toolkit. Let's check if this assumption is true. MetaTrader 5 is approached as a self-sufficient medium for using neural networks in trading. A simple explanation is provided.

Ready-made templates for including indicators to Expert Advisors (Part 2): Volume and Bill Williams indicators
In this article, we will look at standard indicators of the Volume and Bill Williams' indicators category. We will create ready-to-use templates for indicator use in EAs - declaring and setting parameters, indicator initialization and deinitialization, as well as receiving data and signals from indicator buffers in EAs.