MQL5 Programming Articles

Study the MQL5 language for programming trading strategies in numerous published articles mostly written by you - the community members. The articles are grouped into categories to help you quicker find answers to any questions related to programming: Integration, Tester, Trading Strategies, etc.
Follow our new publications and discuss them on the Forum!
Add a new article

You are missing trading opportunities:
- Free trading apps
- Over 8,000 signals for copying
- Economic news for exploring financial markets
Registration
Log in
You agree to website policy and terms of use
If you do not have an account, please register


Jeremy Scott - Successful MQL5 Market Seller
Jeremy Scott who is better known under Johnnypasado nickname at MQL5.community became famous offering products in our MQL5 Market service. Jeremy has already made several thousands of dollars in the Market and that is not the limit. We decided to take a closer look at the future millionaire and receive some pieces of advice for MQL5 Market sellers.


Ready-made templates for including indicators to Expert Advisors (Part 1): Oscillators
The article considers standard indicators from the oscillator category. We will create ready-to-use templates for their use in EAs - declaring and setting parameters, indicator initialization and deinitialization, as well as receiving data and signals from indicator buffers in EAs.


Backpropagation Neural Networks using MQL5 Matrices
The article describes the theory and practice of applying the backpropagation algorithm in MQL5 using matrices. It provides ready-made classes along with script, indicator and Expert Advisor examples.

Other classes in DoEasy library (Part 67): Chart object class
In this article, I will create the chart object class (of a single trading instrument chart) and improve the collection class of MQL5 signal objects so that each signal object stored in the collection updates all its parameters when updating the list.


Canvas based indicators: Filling channels with transparency
In this article I'll introduce a method for creating custom indicators whose drawings are made using the class CCanvas from standard library and see charts properties for coordinates conversion. I'll approach specially indicators which need to fill the area between two lines using transparency.

How to create and test custom MOEX symbols in MetaTrader 5
The article describes the creation of a custom exchange symbol using the MQL5 language. In particular, it considers the use of exchange quotes from the popular Finam website. Another option considered in this article is the possibility to work with an arbitrary format of text files used in the creation of the custom symbol. This allows working with any financial symbols and data sources. After creating a custom symbol, we can use all the capabilities of the MetaTrader 5 Strategy Tester to test trading algorithms for exchange instruments.

The Most Active MQL5.community Members Have Been Awarded iPhones!
After we decided to reward the most outstanding MQL5.com participants, we have selected the key criteria to determine each participant's contribution to the Community development. As a result, we have the following champions who published the greatest amount of articles on the website - investeo (11 articles) and victorg (10 articles), and who submitted their programs to Code Base – GODZILLA (340 programs), Integer (61 programs) and abolk (21 programs).

Graphical interfaces X: New features for the Rendered table (build 9)
Until today, the CTable was the most advanced type of tables among all presented in the library. This table is assembled from edit boxes of the OBJ_EDIT type, and its further development becomes problematic. Therefore, in terms of maximum capabilities, it is better to develop rendered tables of the CCanvasTable type even at the current development stage of the library. Its current version is completely lifeless, but starting from this article, we will try to fix the situation.


Building a Smart Trade Manager in MQL5: Automate Break-Even, Trailing Stop, and Partial Close
Learn how to build a Smart Trade Manager Expert Advisor in MQL5 that automates trade management with break-even, trailing stop, and partial close features. A practical, step-by-step guide for traders who want to save time and improve consistency through automation.


Tables in the MVC Paradigm in MQL5: Customizable and sortable table columns
In the article, we will make the table column widths adjustable using the mouse cursor, sort the table by column data, and add a new class to simplify the creation of tables based on any data sets.


Master MQL5 from beginner to pro (Part II): Basic data types and use of variable
This is a continuation of the series for beginners. In this article, we'll look at how to create constants and variables, write dates, colors, and other useful data. We will learn how to create enumerations like days of the week or line styles (solid, dotted, etc.). Variables and expressions are the basis of programming. They are definitely present in 99% of programs, so understanding them is critical. Therefore, if you are new to programming, this article can be very useful for you. Required programming knowledge level: very basic, within the limits of my previous article (see the link at the beginning).


Build Self Optimizing Expert Advisors in MQL5 (Part 3): Dynamic Trend Following and Mean Reversion Strategies
Financial markets are typically classified as either in a range mode or a trending mode. This static view of the market may make it easier for us to trade in the short run. However, it is disconnected from the reality of the market. In this article, we look to better understand how exactly financial markets move between these 2 possible modes and how we can use our new understanding of market behavior to gain confidence in our algorithmic trading strategies.


Introduction to MQL5 (Part 15): A Beginner's Guide to Building Custom Indicators (IV)
In this article, you'll learn how to build a price action indicator in MQL5, focusing on key points like low (L), high (H), higher low (HL), higher high (HH), lower low (LL), and lower high (LH) for analyzing trends. You'll also explore how to identify the premium and discount zones, mark the 50% retracement level, and use the risk-reward ratio to calculate profit targets. The article also covers determining entry points, stop loss (SL), and take profit (TP) levels based on the trend structure.


Adaptive Smart Money Architecture (ASMA): Merging SMC Logic With Market Sentiment for Dynamic Strategy Switching
This topic explores how to build an Adaptive Smart Money Architecture (ASMA)—an intelligent Expert Advisor that merges Smart Money Concepts (Order Blocks, Break of Structure, Fair Value Gaps) with real-time market sentiment to automatically choose the best trading strategy depending on current market conditions.

Creating an MQL5-Telegram Integrated Expert Advisor (Part 5): Sending Commands from Telegram to MQL5 and Receiving Real-Time Responses
In this article, we create several classes to facilitate real-time communication between MQL5 and Telegram. We focus on retrieving commands from Telegram, decoding and interpreting them, and sending appropriate responses back. By the end, we ensure that these interactions are effectively tested and operational within the trading environment

A Library for Constructing a Chart via Google Chart API
The construction of various types of diagrams is an essential part of the analyses of the market situation and the testing of a trading system. Frequently, in order to construct a nice looking diagram, it is necessary to organize the data output into a file, after which it is used in applications such as MS Excel. This is not very convenient and deprives us of the ability to dynamically update the data. Google Charts API provided the means for creating charts in online modes, by sending a special request to the server. In this article we attempt to automate the process of creating such a request and obtaining a chart from the Google server.


Reimagining Classic Strategies (Part 18): Searching For Candlestick Patterns
This article helps new community members search for and discover their own candlestick patterns. Describing these patterns can be daunting, as it requires manually searching and creatively identifying improvements. Here, we introduce the engulfing candlestick pattern and show how it can be enhanced for more profitable trading applications.

Timeseries in DoEasy library (part 56): Custom indicator object, get data from indicator objects in the collection
The article considers creation of the custom indicator object for the use in EAs. Let’s slightly improve library classes and add methods to get data from indicator objects in EAs.


Gain An Edge Over Any Market
Learn how you can get ahead of any market you wish to trade, regardless of your current level of skill.


Price Action Analysis Toolkit Development (Part 55): Designing a CPI Mini-Candle Overlay for Intra-bar Pressure
This article presents the design and MetaTrader 5 implementation of the Candle Pressure Index (CPI)—a CLV-based overlay that visualizes intra-Bar buying and selling pressure directly on price charts. The discussion focuses on candle structure, pressure classification, visualization mechanics, and a non-repainting, transition-based alert system designed for consistent behavior across timeframes and instruments.


Pair Trading: Algorithmic Trading with Auto Optimization Based on Z-Score Differences
In this article, we will explore what pair trading is and how correlation trading works. We will also create an EA for automating pair trading and add the ability to automatically optimize this trading algorithm based on historical data. In addition, as part of the project, we will learn how to calculate the differences between two pairs using the z-score.


Manual Backtesting Made Easy: Building a Custom Toolkit for Strategy Tester in MQL5
In this article, we design a custom MQL5 toolkit for easy manual backtesting in the Strategy Tester. We explain its design and implementation, focusing on interactive trade controls. We then show how to use it to test strategies effectively


Neural networks made easy (Part 36): Relational Reinforcement Learning
In the reinforcement learning models we discussed in previous article, we used various variants of convolutional networks that are able to identify various objects in the original data. The main advantage of convolutional networks is the ability to identify objects regardless of their location. At the same time, convolutional networks do not always perform well when there are various deformations of objects and noise. These are the issues which the relational model can solve.


ALGLIB numerical analysis library in MQL5
The article takes a quick look at the ALGLIB 3.19 numerical analysis library, its applications and new algorithms that can improve the efficiency of financial data analysis.


Data Science and Machine Learning (Part 23): Why LightGBM and XGBoost outperform a lot of AI models?
These advanced gradient-boosted decision tree techniques offer superior performance and flexibility, making them ideal for financial modeling and algorithmic trading. Learn how to leverage these tools to optimize your trading strategies, improve predictive accuracy, and gain a competitive edge in the financial markets.


Rebuy algorithm: Math model for increasing efficiency
In this article, we will use the rebuy algorithm for a deeper understanding of the efficiency of trading systems and start working on the general principles of improving trading efficiency using mathematics and logic, as well as apply the most non-standard methods of increasing efficiency in terms of using absolutely any trading system.


MetaTrader 5 Machine Learning Blueprint (Part 1): Data Leakage and Timestamp Fixes
Before we can even begin to make use of ML in our trading on MetaTrader 5, it’s crucial to address one of the most overlooked pitfalls—data leakage. This article unpacks how data leakage, particularly the MetaTrader 5 timestamp trap, can distort our model's performance and lead to unreliable trading signals. By diving into the mechanics of this issue and presenting strategies to prevent it, we pave the way for building robust machine learning models that deliver trustworthy predictions in live trading environments.

Graphics in DoEasy library (Part 87): Graphical object collection - managing object property modification on all open charts
In this article, I will continue my work on tracking standard graphical object events and create the functionality allowing users to control changes in the properties of graphical objects placed on any charts opened in the terminal.


Creating an EA that works automatically (Part 15): Automation (VII)
To complete this series of articles on automation, we will continue discussing the topic of the previous article. We will see how everything will fit together, making the EA run like clockwork.

Calculation of Integral Characteristics of Indicator Emissions
Indicator emissions are a little-studied area of market research. Primarily, this is due to the difficulty of analysis that is caused by the processing of very large arrays of time-varying data. Existing graphical analysis is too resource intensive and has therefore triggered the development of a parsimonious algorithm that uses time series of emissions. This article demonstrates how visual (intuitive image) analysis can be replaced with the study of integral characteristics of emissions. It can be of interest to both traders and developers of automated trading systems.

Using cryptography with external applications
In this article, we consider encryption/decryption of objects in MetaTrader and in external applications. Our purpose is to determine the conditions under which the same results will be obtained with the same initial data.


DoEasy. Controls (Part 2): Working on the CPanel class
In the current article, I will get rid of some errors related to handling graphical elements and continue the development of the CPanel control. In particular, I will implement the methods for setting the parameters of the font used by default for all panel text objects.


Price Action Analysis Toolkit Development (Part 13): RSI Sentinel Tool
Price action can be effectively analyzed by identifying divergences, with technical indicators such as the RSI providing crucial confirmation signals. In the article below, we explain how automated RSI divergence analysis can identify trend continuations and reversals, thereby offering valuable insights into market sentiment.


Creating Custom Indicators in MQL5 (Part 9): Order Flow Footprint Chart with Price Level Volume Tracking
This article builds an order-flow footprint indicator in MQL5 that aggregates tick-by-tick volume into quantized price levels and supports Bid vs Ask and Delta display modes. A canvas overlay renders color-scaled volume text aligned with the candles and updates on every tick. You will learn sorting of price levels, max-value normalization for color mapping, and responsive redraws on zoom, scroll, and resize to read volume distribution and aggressor dominance inside each bar.


Studying PrintFormat() and applying ready-made examples
The article will be useful for both beginners and experienced developers. We will look at the PrintFormat() function, analyze examples of string formatting and write templates for displaying various information in the terminal log.


DirectX Tutorial (Part I): Drawing the first triangle
It is an introductory article on DirectX, which describes specifics of operation with the API. It should help to understand the order in which its components are initialized. The article contains an example of how to write an MQL5 script which renders a triangle using DirectX.

Graphics in DoEasy library (Part 79): "Animation frame" object class and its descendant objects
In this article, I will develop the class of a single animation frame and its descendants. The class is to allow drawing shapes while maintaining and then restoring the background under them.


Developing a trading Expert Advisor from scratch (Part 10): Accessing custom indicators
How to access custom indicators directly in an Expert Advisor? A trading EA can be truly useful only if it can use custom indicators; otherwise, it is just a set of codes and instructions.


Population optimization algorithms: Ant Colony Optimization (ACO)
This time I will analyze the Ant Colony optimization algorithm. The algorithm is very interesting and complex. In the article, I make an attempt to create a new type of ACO.

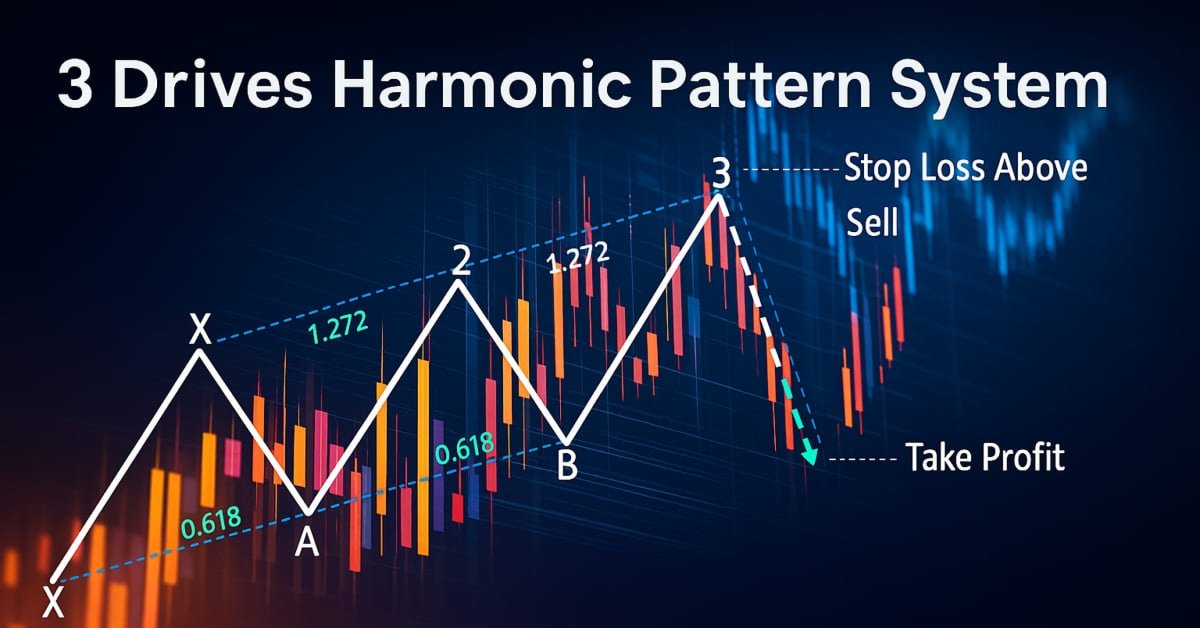
Automating Trading Strategies in MQL5 (Part 31): Creating a Price Action 3 Drives Harmonic Pattern System
In this article, we develop a 3 Drives Pattern system in MQL5 that identifies bullish and bearish 3 Drives harmonic patterns using pivot points and Fibonacci ratios, executing trades with customizable entry, stop loss, and take-profit levels based on user-selected options. We enhance trader insight with visual feedback through chart objects.