MQL5 Programming Articles

Study the MQL5 language for programming trading strategies in numerous published articles mostly written by you - the community members. The articles are grouped into categories to help you quicker find answers to any questions related to programming: Integration, Tester, Trading Strategies, etc.
Follow our new publications and discuss them on the Forum!
Add a new article

You are missing trading opportunities:
- Free trading apps
- Over 8,000 signals for copying
- Economic news for exploring financial markets
Registration
Log in
You agree to website policy and terms of use
If you do not have an account, please register


Larry Williams Market Secrets (Part 14): Detecting Hidden Smash Day Reversals with a Custom Indicator
This article develops a practical MQL5 indicator that identifies Hidden Smash Day bars by strict numeric criteria and optional confirmation on the following session. We cover detection routines, buffer registration, and plot configuration to place arrows at valid bars. The approach delivers stable, non-repainting signals for historical testing and real-time monitoring.


Modified Grid-Hedge EA in MQL5 (Part IV): Optimizing Simple Grid Strategy (I)
In this fourth part, we revisit the Simple Hedge and Simple Grid Expert Advisors (EAs) developed earlier. Our focus shifts to refining the Simple Grid EA through mathematical analysis and a brute force approach, aiming for optimal strategy usage. This article delves deep into the mathematical optimization of the strategy, setting the stage for future exploration of coding-based optimization in later installments.


Introduction to MQL5 (Part 8): Beginner's Guide to Building Expert Advisors (II)
This article addresses common beginner questions from MQL5 forums and demonstrates practical solutions. Learn to perform essential tasks like buying and selling, obtaining candlestick prices, and managing automated trading aspects such as trade limits, trading periods, and profit/loss thresholds. Get step-by-step guidance to enhance your understanding and implementation of these concepts in MQL5.

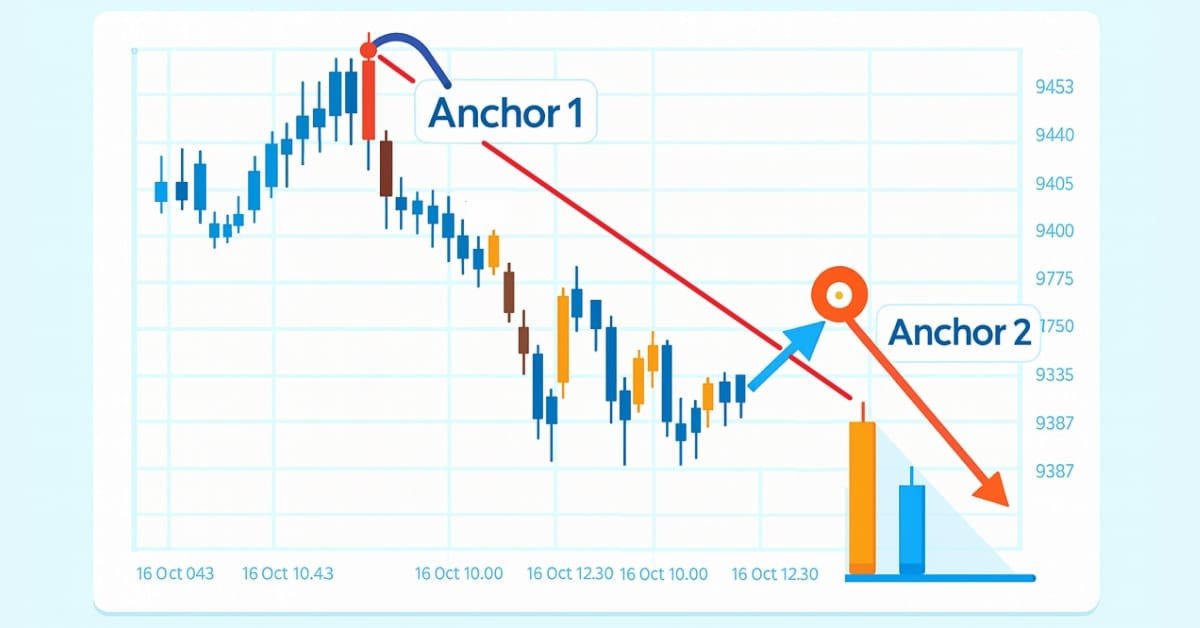
Introduction to MQL5 (Part 25): Building an EA that Trades with Chart Objects (II)
This article explains how to build an Expert Advisor (EA) that interacts with chart objects, particularly trend lines, to identify and trade breakout and reversal opportunities. You will learn how the EA confirms valid signals, manages trade frequency, and maintains consistency with user-selected strategies.


MQL5 Trading Tools (Part 19): Building an Interactive Tools Palette for Chart Drawing
In this article, we build an interactive tools palette in MQL5 for chart drawing, with draggable, resizable panels and theme switching. We add buttons for tools like crosshair, trendlines, lines, rectangles, Fibonacci, text, and arrows, handling mouse events for activation and instructions. This system improves trading analysis through a customizable UI, supporting real-time interactions on charts


Neural networks made easy (Part 19): Association rules using MQL5
We continue considering association rules. In the previous article, we have discussed theoretical aspect of this type of problem. In this article, I will show the implementation of the FP Growth method using MQL5. We will also test the implemented solution using real data.


Ready-made templates for including indicators to Expert Advisors (Part 2): Volume and Bill Williams indicators
In this article, we will look at standard indicators of the Volume and Bill Williams' indicators category. We will create ready-to-use templates for indicator use in EAs - declaring and setting parameters, indicator initialization and deinitialization, as well as receiving data and signals from indicator buffers in EAs.


Neural networks made easy (Part 24): Improving the tool for Transfer Learning
In the previous article, we created a tool for creating and editing the architecture of neural networks. Today we will continue working on this tool. We will try to make it more user friendly. This may see, top be a step away form our topic. But don't you think that a well organized workspace plays an important role in achieving the result.


Price Action Analysis Toolkit Development (Part 66): Developing a Structured Head and Shoulders Scanner in MQL5
Head and Shoulders patterns are difficult to identify consistently in live market data due to noise and structural ambiguity. This article presents a structured, triangle-based MQL5 indicator that isolates pattern components, constructs the neckline, and validates formations using ATR, symmetry, and slope constraints. The system detects and draws standard and inverse patterns, assigns a quality score, and confirms breakouts with optional alerts, enabling consistent and rule-based chart analysis.


Price Action Analysis Toolkit Development (Part 10): External Flow (II) VWAP
Master the power of VWAP with our comprehensive guide! Learn how to integrate VWAP analysis into your trading strategy using MQL5 and Python. Maximize your market insights and improve your trading decisions today.


Dynamic Swing Architecture: Market Structure Recognition from Swings to Automated Execution
This article introduces a fully automated MQL5 system designed to identify and trade market swings with precision. Unlike traditional fixed-bar swing indicators, this system adapts dynamically to evolving price structure—detecting swing highs and swing lows in real time to capture directional opportunities as they form.


USD and EUR index charts — example of a MetaTrader 5 service
We will consider the creation and updating of USD index (USDX) and EUR index (EURX) charts using a MetaTrader 5 service as an example. When launching the service, we will check for the presence of the required synthetic instrument, create it if necessary, and place it in the Market Watch window. The minute and tick history of the synthetic instrument is to be created afterwards followed by the chart of the created instrument.


Prices in DoEasy library (part 59): Object to store data of one tick
From this article on, start creating library functionality to work with price data. Today, create an object class which will store all price data which arrived with yet another tick.

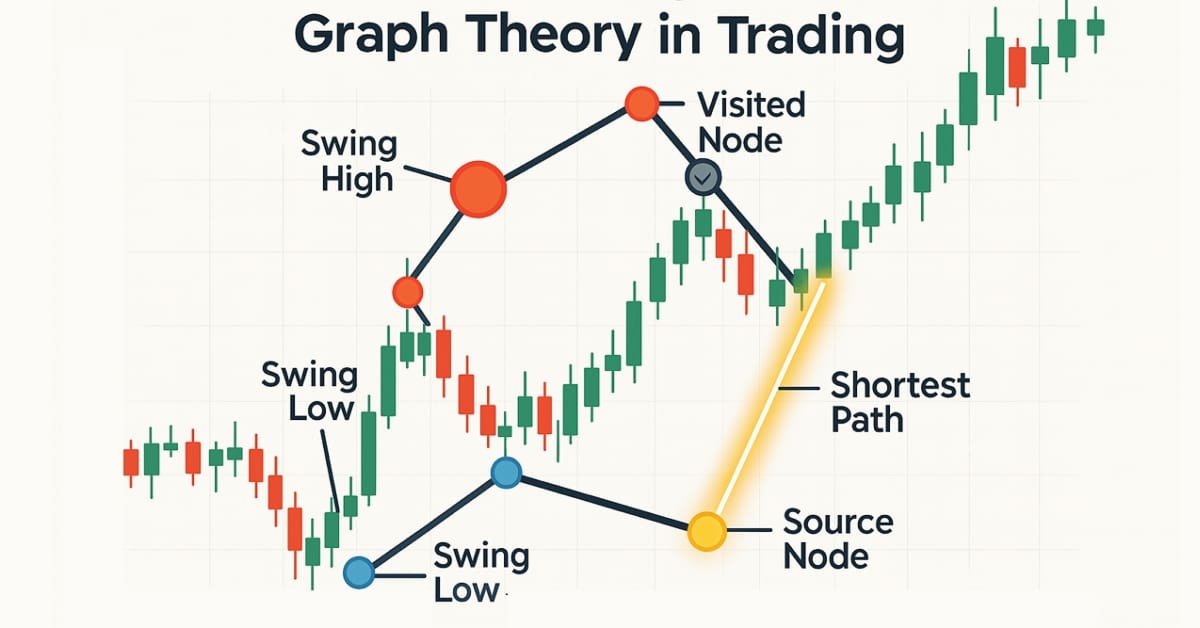
Graph Theory: Dijkstra's Algorithm Applied in Trading
Dijkstra's algorithm, a classic shortest-path solution in graph theory, can optimize trading strategies by modeling market networks. Traders can use it to find the most efficient routes in the candlestick chart data.


MetaTrader 5 and the MQL5 Economic Calendar: How to Turn News into a Reproducible Trading System
The article presents a systematic approach to news trading in MetaTrader 5 using the built-in economic calendar: data structure, API functions, time synchronization rules, and event filtering. Methods of caching and incremental updating without overloading the server are described. The article also provides a working mechanism for exporting history to an .EX5 resource for deterministic testing using the same algorithm.

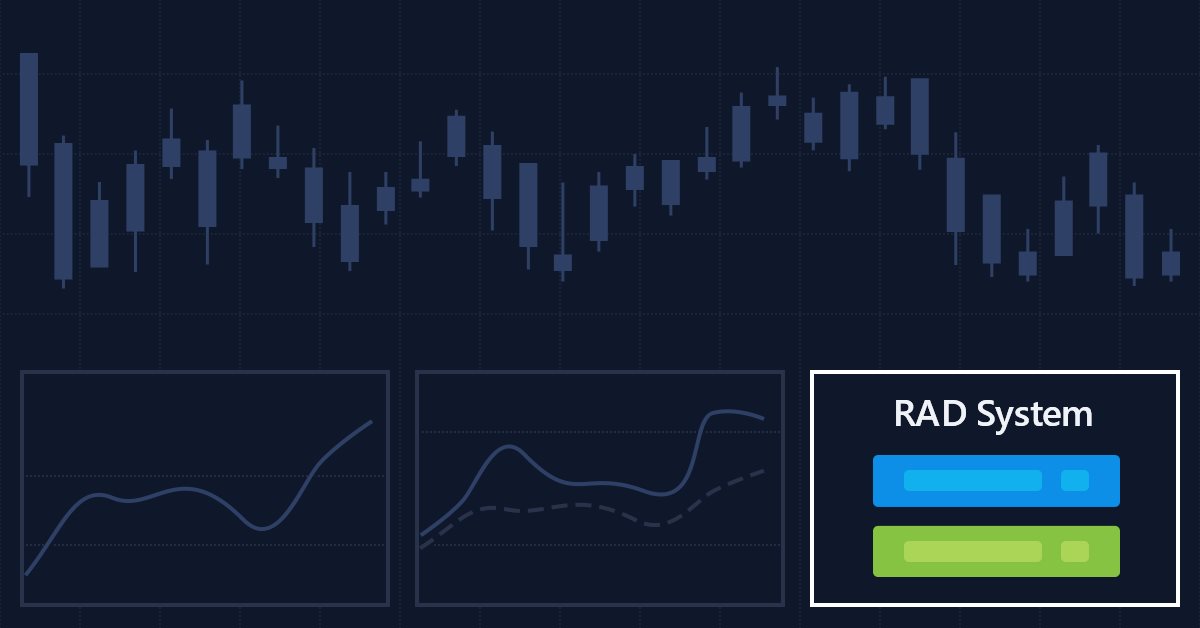
Multiple indicators on one chart (Part 05): Turning MetaTrader 5 into a RAD system (I)
There are a lot of people who do not know how to program but they are quite creative and have great ideas. However, the lack of programming knowledge prevents them from implementing these ideas. Let's see together how to create a Chart Trade using the MetaTrader 5 platform itself, as if it were an IDE.


How to build and optimize a volume-based trading system (Chaikin Money Flow - CMF)
In this article, we will provide a volume-based indicator, Chaikin Money Flow (CMF) after identifying how it can be constructed, calculated, and used. We will understand how to build a custom indicator. We will share some simple strategies that can be used and then test them to understand which one is better.


Building a Trading System (Part 3): Determining Minimum Risk Levels for Realistic Profit Targets
Every trader's ultimate goal is profitability, which is why many set specific profit targets to achieve within a defined trading period. In this article, we will use Monte Carlo simulations to determine the optimal risk percentage per trade needed to meet trading objectives. The results will help traders assess whether their profit targets are realistic or overly ambitious. Finally, we will discuss which parameters can be adjusted to establish a practical risk percentage per trade that aligns with trading goals.


Creating an EA that works automatically (Part 05): Manual triggers (II)
Today we'll see how to create an Expert Advisor that simply and safely works in automatic mode. At the end of the previous article, I suggested that it would be appropriate to allow manual use of the EA, at least for a while.


Neural Networks in Trading: A Multi-Agent System with Conceptual Reinforcement (FinCon)
We invite you to explore the FinCon framework, which is a a Large Language Model (LLM)-based multi-agent system. The framework uses conceptual verbal reinforcement to improve decision making and risk management, enabling effective performance on a variety of financial tasks.


Larry Williams Market Secrets (Part 6): Measuring Volatility Breakouts Using Market Swings
This article demonstrates how to design and implement a Larry Williams volatility breakout Expert Advisor in MQL5, covering swing-range measurement, entry-level projection, risk-based position sizing, and backtesting on real market data.


DRAKON visual programming language — communication tool for MQL developers and customers
DRAKON is a visual programming language designed to simplify interaction between specialists from different fields (biologists, physicists, engineers...) with programmers in Russian space projects (for example, in the Buran reusable spacecraft project). In this article, I will talk about how DRAKON makes the creation of algorithms accessible and intuitive, even if you have never encountered code, and also how it is easier for customers to explain their thoughts when ordering trading robots, and for programmers to make fewer mistakes in complex functions.

Better Programmer (Part 03): Give Up doing these 5 things to become a successful MQL5 Programmer
This is the must-read article for anyone wanting to improve their programming career. This article series is aimed at making you the best programmer you can possibly be, no matter how experienced you are. The discussed ideas work for MQL5 programming newbies as well as professionals.


Population optimization algorithms: Bacterial Foraging Optimization (BFO)
E. coli bacterium foraging strategy inspired scientists to create the BFO optimization algorithm. The algorithm contains original ideas and promising approaches to optimization and is worthy of further study.


Population optimization algorithms: Grey Wolf Optimizer (GWO)
Let's consider one of the newest modern optimization algorithms - Grey Wolf Optimization. The original behavior on test functions makes this algorithm one of the most interesting among the ones considered earlier. This is one of the top algorithms for use in training neural networks, smooth functions with many variables.

Graphics in DoEasy library (Part 90): Standard graphical object events. Basic functionality
In this article, I will implement the basic functionality for tracking standard graphical object events. I will start from a double click event on a graphical object.

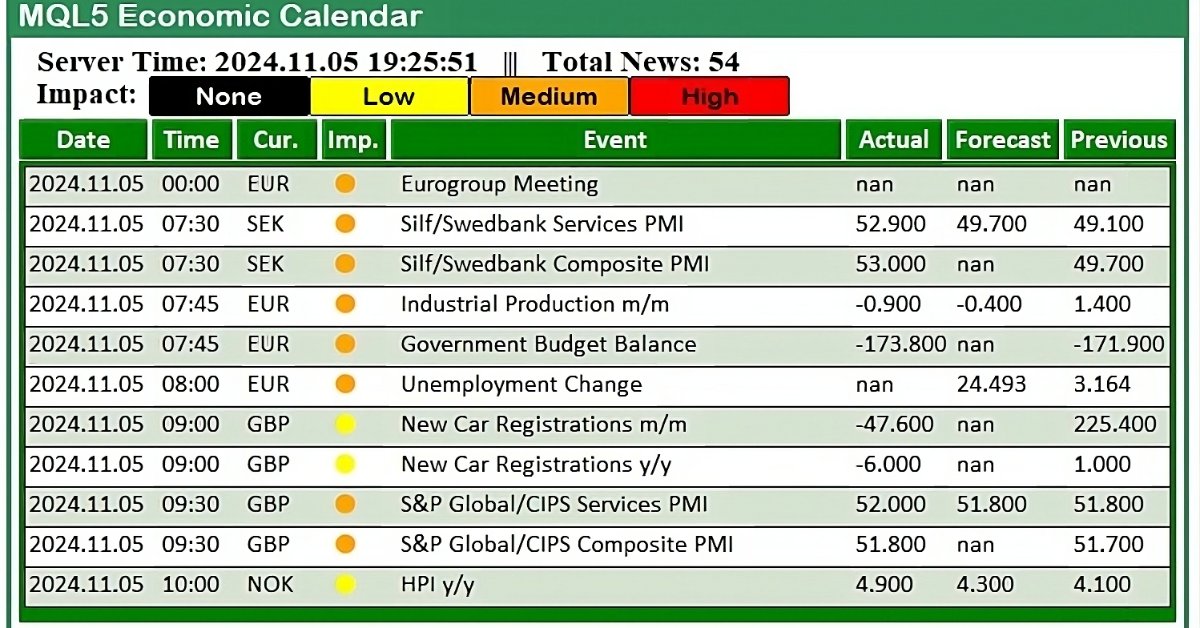
Trading with the MQL5 Economic Calendar (Part 2): Creating a News Dashboard Panel
In this article, we create a practical news dashboard panel using the MQL5 Economic Calendar to enhance our trading strategy. We begin by designing the layout, focusing on key elements like event names, importance, and timing, before moving into the setup within MQL5. Finally, we implement a filtering system to display only the most relevant news, giving traders quick access to impactful economic events.


Neural Networks in Trading: An Agent with Layered Memory
Layered memory approaches that mimic human cognitive processes enable the processing of complex financial data and adaptation to new signals, thereby improving the effectiveness of investment decisions in dynamic markets.


Developing a trading Expert Advisor from scratch (Part 22): New order system (V)
Today we will continue to develop the new order system. It is not that easy to implement a new system as we often encounter problems which greatly complicate the process. When these problems appear, we have to stop and re-analyze the direction in which we are moving.

Interview with Leonid Velichkovsky: "The Biggest Myth about Neural Networks is Super-Profitability" (ATC 2010)
The hero of our interview Leonid Velichkovski (LeoV) has already participated in Automated Trading Championships. In 2008, his multicurrency neural network was like a bright flash in the sky, earning $110,000 in a certain moment, but eventually fell victim to its own aggressive money management. Two years ago, in his interview Leonid share his own trading experience and told us about the features of his Expert Advisor. On the eve of the ATC 2010, Leonid talks about the most common myths and misconceptions associated with neural networks.


Custom Indicator Workshop (Part 3): Building the UT Bot Alerts Indicator in MQL5
This article demonstrates how to build the UT Bot Alerts indicator in MQL5 using a clear, step-by-step approach. The tutorial explains how to implement an ATR-based trailing stop system, compute a custom EMA for signal detection, and generate buy and sell signals without repainting. The final indicator provides well-structured buffers that enable easy integration with Expert Advisors, automated trading systems, and other algorithmic tools within the MetaTrader 5 platform.


Category Theory in MQL5 (Part 1)
Category Theory is a diverse and expanding branch of Mathematics which as of yet is relatively uncovered in the MQL community. These series of articles look to introduce and examine some of its concepts with the overall goal of establishing an open library that attracts comments and discussion while hopefully furthering the use of this remarkable field in Traders' strategy development.


Timeseries in DoEasy library (part 54): Descendant classes of abstract base indicator
The article considers creation of classes of descendant objects of base abstract indicator. Such objects will provide access to features of creating indicator EAs, collecting and getting data value statistics of various indicators and prices. Also, create indicator object collection from which getting access to properties and data of each indicator created in the program will be possible.


Integrating Discord with MetaTrader 5: Building a Trading Bot with Real-Time Notifications
In this article, we will see how to integrate MetaTrader 5 and a discord server in order to receive trading notifications in real time from any location. We will see how to configure the platform and Discord to enable the delivery of alerts to Discord. We will also cover security issues which arise in connection with the use of WebRequests and webhooks for such alerting solutions.

Selection and navigation utility in MQL5 and MQL4: Adding "homework" tabs and saving graphical objects
In this article, we are going to expand the capabilities of the previously created utility by adding tabs for selecting the symbols we need. We will also learn how to save graphical objects we have created on the specific symbol chart, so that we do not have to constantly create them again. Besides, we will find out how to work only with symbols that have been preliminarily selected using a specific website.

Technical Analysis: How Do We Analyze?
This article briefly describes the author's opinion on redrawing indicators, multi-timeframe indicators and displaying of quotes with Japanese candlesticks. The article contain no programming specifics and is of a general character.


Experiments with neural networks (Part 5): Normalizing inputs for passing to a neural network
Neural networks are an ultimate tool in traders' toolkit. Let's check if this assumption is true. MetaTrader 5 is approached as a self-sufficient medium for using neural networks in trading. A simple explanation is provided.

CCI indicator. Three transformation steps
In this article, I will make additional changes to the CCI affecting the very logic of this indicator. Moreover, we will be able to see it in the main chart window.


Data Science and Machine Learning (Part 06): Gradient Descent
The gradient descent plays a significant role in training neural networks and many machine learning algorithms. It is a quick and intelligent algorithm despite its impressive work it is still misunderstood by a lot of data scientists let's see what it is all about.


From Novice to Expert: Enhancing Liquidity Strategies with Multi-Timeframe Structural Confirmation in MQL5
The alignment of higher-timeframe liquidity structures with lower-timeframe reversal patterns can greatly influence both the likelihood and direction of the next price movement. By integrating structural liquidity zones from higher timeframes with precise reversal confirmations on lower timeframes, traders can improve entry timing and overall trade quality. This article demonstrates how to reinforce liquidity-based trading strategies through higher-timeframe structural confirmation—and how to implement this approach effectively using MQL5.