Technische Indikatoren für den MetaTrader 5 - 19

AlgoMatrix EMA Ribbon Trend Pro (MT5)
Professioneller EMA Ribbon Trend Indikator für MetaTrader 5
Übersicht - Gebaut für Trader, die Trends respektieren
AlgoMatrix EMA Ribbon Trend Pro ist ein professioneller EMA Ribbon Trend-Indikator für MetaTrader 5, der für Trader entwickelt wurde, die eine saubere Trendbestätigung, disziplinierte Eingänge und nicht nachmalende Signale bevorzugen.
Dieser Indikator konzentriert sich auf ein einfaches Ziel: Ihnen dabei zu helfen, nur dann zu hand

Einführung
Der PF Maximizer ist ein bahnbrechendes technisches Werkzeug, das ohne Nachbesserungen auskommt und Händlern hilft, echte Trendsignale von erratischen Marktschwankungen zu unterscheiden. Durch den Einsatz hochentwickelter Algorithmen und modernster Datenanalyse filtert dieser Indikator unerwünschtes Rauschen effizient heraus und ermöglicht es Händlern, die genauen Anfangs- und Endpunkte bedeutender Marktbewegungen zu identifizieren.
Signal
Ein potenzielles Kaufsignal wird generier
FREE

SIE KÖNNEN JETZT KOSTENLOSE VERSIONEN UNSERER KOSTENPFLICHTIGEN INDIKATOREN HERUNTERLADEN. ES IST UNSERE ART DER RÜCKGABE AN DIE GEMEINSCHAFT! >>> HIER GEHT'S ZUM DOWNLOAD
Die Volatilitätsratio wurde von Jack D. Schwager entwickelt, um Handelsbereiche zu identifizieren und potenzielle Ausbrüche zu signalisieren. Das Volatilitätsverhältnis ist definiert als die wahre Spanne des aktuellen Tages geteilt durch die wahre Spanne über eine bestimmte Anzahl von Tagen N (d.h. N Perioden). Die folgende
FREE
Einführung des "Draw On Chart Indicator": Entfesseln Sie Ihre Kreativität auf den Charts!
Sind Sie es leid, sich beim Annotieren Ihrer Handelsdiagramme abzumühen, um Ihre Analysen zu verstehen oder Ihre Ideen effektiv zu kommunizieren? Suchen Sie nicht weiter! Wir präsentieren stolz den Draw On Chart Indicator, ein bahnbrechendes Werkzeug, das es Ihnen ermöglicht, mühelos mit nur wenigen Klicks oder Strichen Ihres Stiftes direkt auf Ihren Charts zu zeichnen und zu annotieren.
Unser innovative
FREE

Der AO Hybrid MA Master ist ein fortschrittliches Momentum-Analysesystem für MQL5, das den Awesome Oscillator (AO) von Bill Williams mit einem auf zwei gleitenden Durchschnitten basierenden Bestätigungsmodell integriert. 1. der Kernindikator (Core) Verwendet den Standard-AO-Algorithmus zur Messung der Marktstärke anhand der Differenz zwischen einem 5-Perioden-SMA und einem 34-Perioden-SMA des Durchschnittspreises ($High+Low/2$ ). Das Histogramm ist chromatisch kodiert, um die Beschleunigung oder
FREE

ICT Unicorn Hunter - Multi-Timeframe Smart Setup Detector WICHTIG: Dies ist ein Multi-Timeframe Scanner, der nach "Unicorn" Setups sucht. Ein Unicorn in dieser Definition ist ein Liquiditäts-Sweep, eine Marktstrukturverschiebung und die Schaffung einer Fair Value Gap, die sich mit der letzten opposite-close Kerze vor dem Liquiditäts-Sweep (breaker) überschneidet. Dieser Scanner bietet KEINE Visualisierung des Einhorns auf dem Chart.
Verwenden Sie zur Visualisierung den Unicorn Tracker-Indikator
FREE

Beschreibung des Indikators 4 Hull MA Color + Envelopes ist ein leistungsstarker Trendfolge-Indikator für MetaTrader 5, der vier Hull Moving Averages (HMA) mit Moving Average Envelopes kombiniert, um Marktrichtung, Trendstärke und potenzielle Umkehr- oder Pullback-Zonen klar zu identifizieren. Dieser Indikator wurde entwickelt, um Rauschen zu reduzieren, schnell auf Preisbewegungen zu reagieren und eine klare visuelle Struktur für den professionellen Handel zu bieten. Hauptmerkmale 4 gleitende R
FREE

Dieser Indikator wurde auf der Grundlage von Beiträgen aus der Forex-Factory mit dem Titel There is no Magic Moving Average - You need only one - von @andose2 alias Andrei Florin erstellt. Wenn Sie wissen möchten, wie Sie diese Handelsstrategie anwenden, lesen Sie bitte https://www.forexfactory.com/thread/691864-there-is-no-magic-moving-average-you.
Anmerkung: Unten sind Auszüge aus einigen der Beiträge .
Schätzen Sie einen Trend auf der Grundlage der Marktzyklen ein, gehen Sie in der Aufwärts
FREE

Sehen Sie sich meinen TRADE PLANNER MT5 an - dringend empfohlen, um Kontoszenarien zu antizipieren, bevor Sie Geld riskieren. Dies ist der Moving Average Convergence Divergence (MACD) Indikator, der auf Heikin Ashi Berechnungen basiert. Hier finden Sie ein mehrfarbiges Histogramm, das dem Bullen- (grün) / Bärentrend (rot) entspricht. Dunkle und helle Farben beschreiben die Schwäche/Stärke des Preistrends in der Zeit. Sie können die Berechnungen auch zwischen normalem und Heikin Ashi Preistyp um
FREE
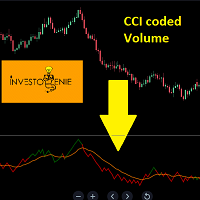
Der Indikator basiert auf dem Commodity Channel Index (CCI), der mit dem Volumen kodiert ist. Das Konzept besteht darin, die Bewegung von Volumen und Preis in einer bestimmten Richtung zu analysieren.
Das Konzept :
Wenn sich der Preis des Indikators unter den Schwellenwert bewegt, wird er ROT und zeigt damit an, dass die Richtung nach unten stark wird.
Wenn sich der Preis des Indikators über den Schwellenwert bewegt, wird er GRÜN und zeigt damit an, dass die Richtung nach oben stark wird.
Der
FREE

Behalte die volle Kontrolle über den Marktrhythmus! Der OHLC & Sessions Indikatorist ein präzises Analyse-Werkzeug für MetaTrader 5, das speziell entwickelt wurde, um die wichtigsten Preisniveaus und Handelszeiten auf einen Blick sichtbar zu machen. Anstatt den Chart mit unübersichtlichen Linien zu überladen, liefert dieser Indikator eine cleane, hochprofessionelle Visualisierung der täglichen Preis-Action und der globalen Handelssessions. Warum dieser Indikator? Präzision in Echtzeit: Erkenne s
FREE

Adaptive Moving Average (AMA) ist ein Trendindikator, der einen gleitenden Durchschnitt und einen Marktrauschenfilter verwendet. Der Indikator zeichnet sich durch blaue und rote Punkte aus, die die Stärke des Trends anzeigen. Empfehlungen für den Handel: Hilfsindikator Erkennung des Trends Erkennen der Stärke des Trends Erkennen von potenziellen Umkehrpunkten Hauptindikator Zeigt Einstiegspunkte für Swing Trading Dient als dynamische Unterstützung und Widerstand Empfehlungen für die Verwendung:
FREE
VWAP-Indikator (Volume Weighted Average Price) mit ±1σ- und ±2σ-Bändern, die aus dem realen Handelsvolumen berechnet werden. Die Start- und Endzeiten der Sitzung sind vollständig konfigurierbar, ebenso wie die Standardabweichungswerte und die Anzahl der angezeigten Bänder. Er zeigt den volumengewichteten Durchschnittspreis des Tages an und hilft Händlern, Wertbereiche, Preisextreme und Intraday-Handelsmöglichkeiten präzise zu identifizieren.
FREE

Dies ist eine optimierte Version des Waddah-Attar-Explosions-Indikators (WAE) , die für die Anpassung an verschiedene Anlageklassen konzipiert wurde.
Standard-WAE-Indikatoren verwenden oft eine feste "DeadZone"-Berechnung (in der Regel auf 20 gesetzt). Dieser feste Wert ist möglicherweise nicht für hochvolatile Vermögenswerte wie Bitcoin, Gold oder Indizes (US30) geeignet und kann zu einer falschen Filterung führen. Diese Auto-Adaptive-Version behebt dieses Berechnungsproblem. Der Indikator impl
FREE
Hören Sie auf zu raten, wohin sich der Markt drehen wird. Unser fortschrittlicher High/Low-Indikator für MT5 ist das ultimative Werkzeug zur Beherrschung von Preisaktionen und zur Erkennung wichtiger Marktstrukturen. Er scannt automatisch den Chart, um alle kritischen Hochs und Tiefs in Echtzeit zu identifizieren und klar darzustellen, damit Sie die wahre Geschichte hinter den Kerzen erkennen können. Diese entscheidenden, nicht nachzeichnenden Niveaus bilden das Rückgrat jeder erfolgreichen Hand
FREE
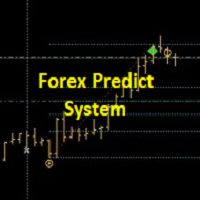
+++++++++++++++++++++++++++++++++++++++++++++++++++++++++++++++++++++++++++++++++++++++++++++++++ +++ Link zu EURUSD Only Free Version --> https://www.mql5.com/en/market/product/156904?source=Unknown +++++++++++++++++++++++++++++++++++++++++++++++++++++++++++++++++++++++++++++++++++++++++++++++++ Hallo Trader, Dies ist eine traditionelle GANN & FIBONACCI Strategie, die auf der Erkennung einer impulsiven Bewegung in die Gegenrichtung basiert. Dies wird als Breakout bezeichnet. Im Moment des Ausbr

Überblick EMA Scalper ist ein technischer Indikator, der für die MetaTrader 5-Plattform entwickelt wurde. Dieses Tool hilft Händlern, potenzielle Handelssignale zu identifizieren, die auf dem Crossover zwischen dem Preis und einem Exponential Moving Average (EMA) basieren, kombiniert mit einem dynamischen Preiskanal. Der Indikator ist für Scalper und Daytrader geeignet und funktioniert in verschiedenen Zeitrahmen und Finanzinstrumenten. Wie er funktioniert Die Logik des Indikators basiert auf zw
FREE

Smart Fibo Zones sind leistungsstarke, automatisch generierte Fibonacci-Retracements, die an wichtigen Marktstrukturverschiebungen verankert sind. Diese Zonen dienen als kritische Angebots- und Nachfrageniveaus , die Ihnen helfen, potenzielle Preisreaktionen zu erkennen und die Marktrichtung zu bestätigen. Fibonacci-Berechnungen , die von professionellen Händlern häufig verwendet werden, können komplex sein, wenn es darum geht, Hochs und Tiefs zu identifizieren. Smart Fibo Zones vereinfacht dies

Pivot-Punkt Super-Trend Er kann verwendet werden, um Preisumkehrpunkte zu erfassen und kann Pfeile für Kauf und Verkauf anzeigen. Die Berechnungen basieren auf Preisspitzen. Sie können die Preisumkehrpunkte kontrollieren, indem Sie die Pivot-Punkt-Periode des Indikators erhöhen. der ATR-Faktor gibt an, wie weit die Bänder auseinander liegen sollen Kursausbrüche werden bereits im Frühstadium erkannt, was den Handel erheblich erleichtert.
FREE

[TH] คำบรรยายสินค้า: Das Pferd Pro Signal (WinWiFi Robot Series) Das Pferd Pro Signal คืออินดิเคเตอร์ระดับมืออาชีพรุ่นล่าสุดจากตระกูล WinWiFi Robot Series ออกแบบมาสำหรับแพลตฟอร์ม MetaTrader 5 (MT5) โดยเฉพาะ เพื่อช่วยเทรดเดอร์ในการวิเคราะห์พฤติกรรมราคา (Kursbewegung) ทั้งในสภาวะตลาดที่มีเทรนด์ชัดเจนและช่วงตลาดไซด์เวย์ (Seitwärtsbewegung) คุณสมบัติเด่น: การวิเคราะห์แท่งเทียนอัจฉริยะ: ระบบอ้างอิงการเคลื่อนที่ของราคาตามเทรนด์และสลับกับการกรองสัญญานในช่วงไซด์เวย์ เพื่อความแม่นยำสูงสุด การแสดงผลที่ชั
FREE
Übersicht
Supply & Demand (MTF) v1.00 ist ein MetaTrader 5-Indikator, der automatisch wichtige Angebots- und Nachfragezonen aus bis zu drei Zeitrahmen auf Ihrem aktuellen Chart identifiziert und einzeichnet. Angebotszonen markieren Bereiche, in denen starker Verkaufsdruck herrschte; Nachfragezonen markieren Bereiche, in denen starker Kaufdruck herrschte. Merkmale Multi-Timeframe-Erkennung
Scannen Sie das aktuelle Diagramm sowie zwei höhere Zeitrahmen nach Zonen. Kerzenstärke-Filter
Erfordert
FREE

Pivot Point Supertrend (entspricht dem Pivot Point Super Trend Indikator aus Trading View) Pivot Point Period: Pivot point defined as highest high and highest low... input 2 = defining highest high and highest low with 2 bars on each side which are lower (for highest high) and are higher (for lowest low calculation) ATR Length : the ATR calculation is based on 10 periods ATR Factor: ATR multiplied by 3
FREE

Moving Average Alerts ist ein einfaches und effizientes Indikator-Tool mit 4 vollständig konfigurierbaren gleitenden Durchschnitten, das es dem Trader ermöglicht, Perioden, Methoden und Einstellungen entsprechend seiner Strategie zu wählen. Jeder gleitende Durchschnitt verfügt über zwei unabhängige Alarme, die separat aktiviert oder deaktiviert werden können: Alarm, wenn der Preis über dem gleitenden Durchschnitt schließt
Alarm, wenn der Preis unter dem gleitenden Durchschnitt schließt Die Alarm
FREE

Der volumengewichtete Durchschnittspreis (VWAP) ist eine von den großen Akteuren häufig verwendete Handelsbenchmark, die den Durchschnittspreis angibt, zu dem ein Symbol während des Tages gehandelt wurde. Er basiert sowohl auf dem Volumen als auch auf dem Preis. Zusätzlich haben wir in diesen Indikator den MVWAP (Moving Volume Weighted Average Price) aufgenommen. Für diejenigen, die den Gebrauch und die Bedeutung dieses Indikators nicht kennen, empfehle ich einen großartigen Artikel über dieses
FREE

Hochgradig konfigurierbarer Trader Dynamic Index (TDI) Indikator.
Merkmale: Hochgradig anpassbare Alarmfunktionen (bei Levels, Kreuzen, Richtungsänderungen per E-Mail, Push, Sound, Popup) Multi-Timeframe-Fähigkeit (auch höhere und niedrigere Timeframes) Farbanpassung (bei Levels, Kreuzen, Richtungsänderungen) Optionen für lineare Interpolation und Histogramm-Modus Funktioniert im Strategie-Tester im Multi-Timeframe-Modus (auch am Wochenende ohne Ticks) Einstellbare Levels Parameter:
TDI Timefr
FREE
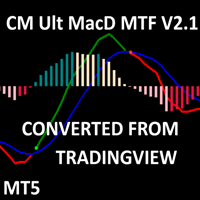
CM MACD Custom Indicator - Mehrere Zeitrahmen (V2.1) Dieser fortschrittliche MT5-Indikator, der dem TradingView-Skript von ChrisMoody nachempfunden ist, liefert einen leistungsstarken Multi-Timeframe-MACD mit anpassbaren Grafiken und Warnungen. Mit MACD-Linien, Signallinien und einem farbkodierten Histogramm hebt er Trendrichtung und Momentum mit unterschiedlichen Farben für wachsende/fallende Histogramme über/unter Null hervor. Kreuzsignale werden mit Pfeilen markiert, und der Benutzer kann fü
FREE

Stoppen Sie Margin Calls. Beginnen Sie den Handel mit einer klaren SOP. Erhalten Sie immer wieder Margin Calls?
Haben Sie immer noch keinen Indikator oder keine Technik gefunden, die eine konstante tägliche Performance liefert?
Sind Sie es leid, Geld einzuzahlen und zu hoffen, dass Sie es endlich abheben können? Machen Sie sich keine Sorgen - ich bin ein echter Vollzeit-Trader . Dies ist derselbe Entry-Box-Indikator , den ich persönlich verwende, zusammen mit einer Schritt-für-Schritt-SOP , dam
Reverse RSI Signals Indicator
Der Reverse RSI Signals Indikator ist ein vielseitiges technisches Analysetool für den MetaTrader 5 (MT5). Er wandelt traditionelle RSI-Berechnungen in dynamische preisbasierte Bänder um, integriert Supertrend zur Trendidentifikation und beinhaltet Divergenzerkennung für potenzielle Umkehrsignale. Dieser Overlay-Indikator bietet visuelle und auf Warnungen basierende Einblicke, um Händlern dabei zu helfen, überkaufte/überverkaufte Bedingungen, Trendverschiebungen u
FREE

Magic Candles ist ein neues Produkt, das die Identifizierung der aktuellen Marktphase (Aufwärtstrend, Abwärtstrend oder Flat) ermöglicht.
Dieser Indikator malt Balken je nach aktueller Marktlage in verschiedenen Farben und informiert den Benutzer mit Warnungen über Trendänderungen.
Magic Candles eignet sich perfekt für den Handel mit Währungen (einschließlich Kryptowährungen) und binären Optionen.
Vorteile Geeignet für Scalping und Intraday-Handel. Der Indikator wird nicht neu gezeichnet (ne

h ttps:// www.mql5.com/en/users/gedeegi/seller
QuantumFlux Trend kombiniert Konzepte aus der statistischen Physik (Temperatur T & Energieschritt Alpha ) mit einer exponentiellen Gewichtung im Boltzmann-Stil, um eine Trendlinie zu erzeugen, die im Vergleich zu herkömmlichen gleitenden Durchschnitten "kontextadaptiver" ist. Das Ergebnis wird dann mit einem EMA geglättet, um klarere Signale zu liefern, die über alle Zeitrahmen hinweg leicht zu lesen sind. Der Indikator färbt Kerzen und Trendlinien
FREE

KT Candlestick Patterns erkennt und markiert in Echtzeit die 24 zuverlässigsten japanischen Kerzenmuster. Bereits im 18. Jahrhundert nutzten japanische Händler diese Muster zur Vorhersage der Kursrichtung. Natürlich ist nicht jedes Kerzenmuster gleich zuverlässig. In Kombination mit anderen technischen Methoden wie Unterstützung und Widerstand liefern sie jedoch ein klares Bild der Marktlage.
Dieser Indikator enthält viele Muster, die ausführlich im Buch „Japanese Candlestick Charting Techniqu

Lot Size Calculator - Intelligentes Risikomanagement-Tool
Der Lot Size Calculator ist ein einfacher, aber leistungsstarker MetaTrader-Indikator, der Händlern hilft, ihr Risiko präzise zu steuern. Anstatt Ihre Positionsgröße zu schätzen, berechnet dieses Tool sofort die exakte Losgröße, die Sie benötigen, basierend auf Ihrem Kontokapital, dem gewählten Risikoprozentsatz und dem Belohnungsverhältnis (1:1, 1:2, etc.).
Funktionen:
Eingabe Ihres Kontokapitals und des Risikoprozentsatzes pro Ha
FREE

Das Verhalten verschiedener Währungspaare ist miteinander verbunden. Mit dem Visual Correlation -Indikator können Sie verschiedene Instrumente auf einem Diagramm anzeigen und dabei den Maßstab beibehalten. Sie können eine positive, negative oder keine Korrelation definieren.
Manche Instrumente beginnen sich früher zu bewegen als andere. Solche Momente können durch Überlagerung von Diagrammen bestimmt werden.
Um ein Instrument in einem Diagramm anzuzeigen, müssen Sie seinen Namen in das Fe
FREE
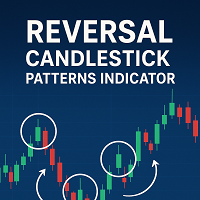
Reversal Candlestick Patterns Indikator - Kostenlose Version Dieser MT5-Indikator identifiziert gängige bullische und bearische Candlestick-Umkehrmuster und zeigt sie direkt auf dem Chart an.
Er kann für jeden Markt und jeden Zeitrahmen verwendet werden und bietet Händlern klare visuelle Hinweise auf potenzielle Umkehrpunkte. Wichtigste Merkmale Automatische Erkennung von bekannten Candlestick-Umkehrmustern Funktioniert auf allen verfügbaren MT5-Zeitfenstern Kann auf Charts von Devisen, Aktien,
FREE

Der Market Momentum-Indikator basiert auf dem Volume Zone Oscillator (VZO), der von Waleed Aly Khalil in der Ausgabe 2009 der Zeitschrift der International Federation of Technical Analysts vorgestellt wurde, und bietet eine neue Sichtweise auf diese wertvollen Marktdaten, die oft missverstanden und vernachlässigt werden: VOLUME. Mit diesem neuen Ansatz des "Sehens" von Volumendaten können Händler besser auf das Marktverhalten schließen und ihre Chancen auf einen erfolgreichen Handel erhöhen.
"T
FREE

Produktname: Auto Trend Pattern Pro [Subho - Indien] Kurze Beschreibung:
Ein fortschrittliches Price Action Tool, das automatisch Trendkanäle, Keile und Dreiecke mit einem Live Dashboard erkennt und zeichnet. Vollständige Beschreibung: Auto Trend Pattern Pro ist ein hochentwickelter technischer Indikator, der für MetaTrader 5 entwickelt wurde. Er automatisiert die komplexe Aufgabe des Zeichnens von Trendlinien und Kanälen. Durch die Analyse historischer Kursverläufe identifiziert der Indikator
FREE

Dieser Indikator berechnet die Gann-Unterstützung und Widerstandspreise mit Hilfe der Gann-Pyramidenformel und zeichnet sie auf das Diagramm. Und wenn Sie möchten, kann der Indikator Sie warnen, wenn der aktuelle Preis diese Pivot-Levels erreicht. Alarm-Optionen: Mobilnachricht, E-Mail senden, Nachricht anzeigen und akustische Warnung Niveaus: S1, S2, S3, S4, S5, R1, R2, R3, R4, R5 Eingänge : GannInputPreis: Eingabepreis für die Gann-Pyramidenformulierung. GannInputDigit: Wie viele Stellen wolle
FREE

Multiwährungs- und Multi-Timeframe-Indikator MACD. Das Dashboard kann sowohl den traditionellen (echten) MACD als auch den in MetaTrader eingebauten MACD anzeigen. Auf dem Panel können Sie den aktuellen Status des Indikators sehen - die Bewegungsrichtung der MACD-Linien, ihren Schnittpunkt und ein Pop-up-Fenster mit dem Indikator-Chart. In den Parametern können Sie beliebige Paar-Symbole und Zeitrahmen angeben. Der Scanner kann auch Benachrichtigungen über sich kreuzende Linien und über Linien,

Indikator Einführung: Der Indikator kommt aus dem Netz, er ist stabiler als der RSI oder CCI. Sie können den Indikator so einstellen, dass er E-Mails/Benachrichtigungen/Alarme sendet, wenn der vorherige Balken einen Auf- oder Abwärtspfeil aufweist. Sie können den Text der E-Mails durch Eingabe einer Zeichenfolge in das Parameterfeld "UpMessages/DownMessages" festlegen. Er kann verwendet werden, um den Markttrend zu analysieren und einen neuen Experten zu entwickeln, der auf dem Trend basiert. We
FREE

Darstellung
Ein weiterer Indikator, der das Scalping auf Tick-Charts erleichtert. Er zeigt ein Heiken Ashi-Diagramm in Ticks an.
Er ermöglicht es, Einstiegspunkte und Trendumkehrungen zu erkennen. Empfohlene Anzahl von Ticks in einer Kerze: 5, 13 oder 21.
Parameter Ticks in der Kerze: Anzahl der Ticks in einer Kerze (Standardwert 5), Trendpfeile anzeigen: Zeigt einen Trendpfeil an, der auf der Kreuzung von EMA8 und EMA20 basiert, Zeigt MM50 an, Zeigt MM100 an, Max Candle (CPU): Anzahl der maxi
FREE

Dieser Hilfsindikator zeigt die verbleibende Zeit bis zur Schließung auf dem aktuellen Zeitrahmen mit kontinuierlicher Aktualisierung an. Er zeigt auch den letzten Handelspreis und die Abweichung vom Vortagesschluss in Prozent und Punkten an. Dieser Indikator ist sehr praktisch für Daytrader und Scalper, die das Schließen und Öffnen von Kerzen genau überwachen wollen.
Parameter des Indikators Show in shifted end - Voreinstellung: Falsch. Zeit und Werte auf dem Bildschirm anzeigen. Wenn True, wi
FREE
Wenn du auf den Finanzmärkten handelst, weißt du sicher, wie wichtig der Spread ist – dieser Unterschied zwischen Geldkurs (Ask) und Briefkurs (Bid) kann deinen Gewinn erheblich beeinflussen. Spread Size ist ein einfacher, aber äußerst nützlicher Indikator, der den aktuellen Spread direkt im Chart anzeigt. Du musst nicht mehr ständig manuell Daten überwachen – alles ist direkt vor deinen Augen! Wozu ist das gut?
Der Spread ist nicht nur eine Zahl. Es ist dein echtes Geld. Ein niedriger Spread be
FREE

Wenn Sie mit mehreren Vermögenswerten arbeiten und mehrere offene Positionen in verschiedenen Vermögenswerten haben, ist es ein wenig kompliziert zu visualisieren, wie viel Gewinn oder Verlust in jedem Vermögenswert ist, so dass mit diesem Problem im Hinterkopf habe ich diesen Indikator entwickelt, wo es die Visualisierung der offenen Operationen in jedem Vermögenswert erleichtert, wo Sie in der Lage sein, mehrere verschiedene Vermögenswerte zu öffnen und Sie werden in der Lage sein, das individ
FREE

Der Indikator Zeitraumtrennzeichen trennt die vom Benutzer angegebenen Zeiträume.
Er unterstützt alle Zeiträume, die größer oder kleiner als der aktuelle Zeitrahmen sind. Im Falle eines nicht korrekten Zeitrahmens ändert der Indikator diesen auf den nächstgelegenen korrekten Wert. Zusätzlicher Bonus - die Trennung von Nicht-Standard-Zeiträumen - MOON, MOON/2, MOON/4 (Mondphasen). Die Trennzeichen werden mit Hilfe der Puffer des Indikators gezeichnet. Der Indikator verwendet ein grafisches Objekt
FREE
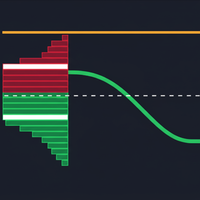
Der Indikator "Volume Range Profile with Fair Value" (VRPFV) ist ein leistungsstarkes Instrument zur Volumenanalyse, das Händlern hilft, die Marktstruktur besser zu verstehen und wichtige Preisbereiche zu identifizieren, in denen bedeutende institutionelle Aktivitäten stattfinden. Anstatt nur das Volumen einzelner Candlesticks zu betrachten, analysiert VRPFV die Verteilung des Volumens nach Preisniveau innerhalb einer bestimmten Zeitspanne und bietet so tiefe Einblicke in den "Fußabdruck" des Sm
FREE

Heiken Ashi Jemeni Heiken Ashi Yemeni ist ein professioneller Indikator für MetaTrader 5 , der modifizierte Heiken Ashi-Kerzen mit zwei intelligenten Trendlinien (Yemen 1 & Yemen 2 ) kombiniert, die auf fortschrittlichen und komplexen internen Berechnungen beruhen und so einen klareren Blick auf den Trend ermöglichen und das Marktrauschen reduzieren. Der Indikator wurde entwickelt, um Händlern einen reibungslosen und leicht ablesbaren Marktüberblick zu verschaffen, wodurch er sich für den manuel
FREE
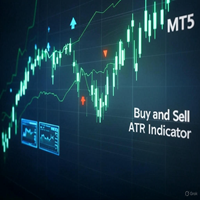
ATR-Indikator zum Kaufen und Verkaufen Der ATR-Indikator für Kauf und Verkauf ist ein leistungsstarkes Trendfolge-Tool für MT5, das die ATR-basierte Trenderkennung mit der RSI-Bestätigung kombiniert. Er zeichnet eine dynamische Trendlinie und generiert klare Kauf- (blaue Pfeile) und Verkaufssignale (rote Pfeile), wenn der Kursverlauf einen Trend über eine benutzerdefinierte Anzahl von Kerzen bestätigt. Ein einzigartiger Flat-Market-Filter, der auf der durchschnittlichen ATR basiert, verhindert
FREE
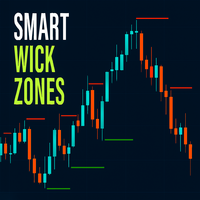
Der Smart Wick Zones-Indikator ist ein leistungsfähiges Instrument, mit dem Sie verborgene Bereiche der Preiszurückweisung und Liquidität auf Ihrem Chart hervorheben können. Durch die Analyse von Kerzendochten (auch Schatten oder Schwänze genannt) zeichnet der Indikator automatisch horizontale Zonen ein, in denen zuvor starker Kauf- oder Verkaufsdruck aufgetreten ist. Diese Dochtzonen markieren oft Wendepunkte im Markt oder Bereiche, in denen der Preis stark reagiert, was sie zu hervorragenden R
FREE
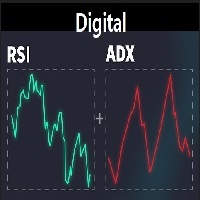
Ein leichtgewichtiger digitaler Indikator, der die wichtigsten Momentum-Tools direkt auf dem Chart kombiniert. Er zeigt die Echtzeitwerte von RSI, ADX, +DI, -DI und DI Spread in einem klaren und kompakten Format an, ohne irgendwelche Linien oder grafischen Objekte auf dem Chart zu zeichnen. Entwickelt, um einen schnellen Einblick in die Trendstärke und das Gleichgewicht zwischen Käufern und Verkäufern zu geben, ohne dass Sie zusätzliche Indikatorfenster öffnen müssen. Vollständig anpassbar - Sch
FREE

Der Indikator zeigt die Zeit bis zur Schließung der Kerze sowie die Serverzeit im aktuellen Chart an.
Sehr einfach zu bedienen, mit nur vier Einstellungen..:
Lable Location - die Position des Timers auf dem Diagramm;
Serverzeit anzeigen - zeigt die Serverzeit an oder nicht;
Tonsignal bei geschlossener Kerze - zur Verwendung eines Tonsignals beim Schließen der Kerze oder nicht;
Farbe - die Farbe der Ziffern des Timers.
Weitere nützliche kostenlose und kostenpflichtige Produkte können hier
FREE

Der "YK-LOT-SIZE" ist ein benutzerdefinierter Indikator für MetaTrader 5 (MT5), der die gesamten Lotgrößen und Gewinne für Kauf- und Verkaufspositionen im aktuellen Chart anzeigt. Hauptmerkmale des Indikators: Er berechnet die Gesamt-Lotgrößen für alle offenen Kauf- und Verkaufspositionen des aktuellen Symbols. Er berechnet die Gesamtgewinne (einschließlich Provisionen und Swaps) für alle offenen Kauf- und Verkaufspositionen. Der Indikator zeigt die Informationen auf dem Chart in zwei Textzeilen
FREE

FVG Smart Zones – Kostenlose Edition
Fair Value Gap Erkennungsindikator für MetaTrader 5 (MT5) Suchen Sie ein echtes Trading-Werkzeug – nicht nur einen weiteren zufälligen Indikator?
FVG Smart Zones – Kostenlose Edition gibt Ihnen professionelle Markteinblicke, indem automatisch Fair Value Gaps (FVGs) erkannt und hochwahrscheinliche Trading-Zonen direkt auf Ihrem Chart hervorgehoben werden. Erstellt für Trader, die folgen:
Smart Money Concepts (SMC)
ICT Trading Konzepte
Pric
FREE

Automatische Trendlinienanpassung. Dieser Indikator zeichnet automatisch die gerade Linie und den parabolischen (gekrümmten) Trend für jedes Symbol und jeden Zeitrahmen ein. Die gezeichnete gerade Linie ist ein guter Hinweis auf den aktuellen Trend und die gekrümmte Linie ist ein Hinweis auf eine Änderung der Dynamik oder eine Änderung des aktuellen Trends. Wird die gerade Linie über etwa 2/3 der Kerzenanzahl wie die gekrümmte Linie gezeichnet, ist dies in der Regel ein guter Weg, um Einstiegs-
FREE
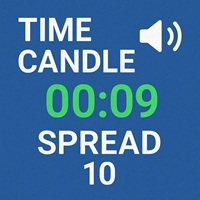
Zeitkerze mit akustischer Warnung
Dieser Indikator wird die verbleibende Zeit Kerze angezeigt werden Merkmale: 1. Multi Time Frames, Multi Paare 2. Linke Zeit 2. Positionsdynamik mit Geldkurs oder Rand des Chartbildschirms 3. Schriftgröße und -farbe 4. Anzeige von aktuellem Spread, maximalem Spread und minimalem Spread
Anmerkung: Maximum und Minimum Spread werden zurückgesetzt, wenn Sie die TF ändern . Getestet auf MT5 Version 5 Build 5200
Wenn Sie den Quellcode benötigen, senden Sie mir ein
FREE

Gold Storm Signals - Professioneller XAU/USD Handelsindikator
Gold Storm Signals ist ein erstklassiger Multi-Bestätigungsindikator für den Goldhandel (XAU/USD) auf dem MetaTrader 5. Erhalten Sie präzise Kauf-/Verkaufssignale mit automatischen Stop-Loss- und Take-Profit-Levels, die direkt auf Ihrem Chart angezeigt werden.
SCHLÜSSEL-FEATURES:
- Klare Kauf- und Verkaufssignalpfeile - Automatische ATR-basierte Stop-Loss-Berechnung - Zwei TP-Levels (TP1 & TP2) - Vollständiges Alarmsystem (Push, E
FREE

Dieser Indikator ist speziell für den binären Handel. Zeitrahmen ist 1 Minuten und exp Zeit 5 oder 3 Minuten nur. Sie müssen martingale 3 Schritt verwenden. So müssen Sie setzen Lose Größe ist 10 % höchstens. Sie sollten Mt2 Handelsplattform verwenden, um mit meinem Indikator zu verbinden, um mehr Signal ohne menschliche Arbeit zu erhalten. Dieser Indikator Gewinnrate ist über 80 %, aber Sie können 100 % des Gewinns durch die Verwendung von martingale 3 Schritt zu bekommen. Sie sollten MT2 Hande
FREE

Phoenix Trend Strength Meter (MT5)
Marktregime- und Trendstärke-Analysator für MetaTrader 5. Kombiniert ADX, RSI und Directional Movement in einem einzigen Panel, um Marktbedingungen in Echtzeit zu klassifizieren.
Zweck
Die meisten Trader scheitern nicht aufgrund schlechter Einstiegspunkte, sondern weil sie die falsche Strategie auf das falsche Marktregime anwenden. Der Phoenix Trend Strength Meter hilft Tradern, sofort zu erkennen, ob sich der Markt in einer Seitwärtsbewegung befindet, einen
FREE

SUPERTREND INDIKATOR MT5 Entwickler: gedeegi Allgemeine Beschreibung GEN SmartTrend Signal ist ein umfassender technischer Indikator für MetaTrader 5 (MT5), der sich auf die Trendidentifikation und das automatisierte Risikomanagement konzentriert. Er nutzt einen verfeinerten SuperTrend-basierten Algorithmus, der auf dem Average True Range (ATR) basiert, um die primäre Trendrichtung zu bestimmen. Was diesen Indikator von anderen abhebt, sind seine integrierten Handelsmanagementfunktionen, die di
FREE
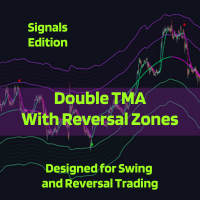
Das technische Analysetool Double TMA with Bands - Signals Edition v4.0 wurde für MetaTrader 5 entwickelt und kombiniert zwei dreieckige gleitende Durchschnitte (TMA) mit ATR-basierten Umkehrzonen, um die Trendrichtung und potenzielle Wendepunkte zu identifizieren. Es beinhaltet eine optionale Indikatorvisualisierung, mehrere Signaltypen und eine flexible Alarmierung, um sicherzustellen, dass Sie den Handel nicht verpassen!
Hinweise des Entwicklers:
Fehlerkorrekturen und die Implementierung vo

Das Pferd DCA Signal 1.26 - สุดยอดนวัตกรรมอินดิเคเตอร์สำหรับการเทรดทองคำและทุกสินทรัพย์ Das Pferd DCA Signal คืออินดิเคเตอร์รุ่นล่าสุดจากตระกูล WinWiFi Robot Series ที่ได้รับการออกแบบมาเพื่อยกระดับการเทรดบนแพลตฟอร์ม MT5 โดยเฉพาะ โดยเป็นการผสมผสานอัจฉริยะระหว่างกลยุทธ์ Trendfolge และ Scalping เข้าด้วยกันอย่างลงตัว คุณสมบัติเด่น: ระบบลูกศรแยกประเภทชัดเจน: ลูกศรสีทอง: บ่งบอกสภาวะตลาดช่วง Sideway เหมาะสำหรับการเทรดแบบ Swing Trade หรือ Scalping เก็บกำไรระยะสั้น (2) ลูกศรสีน้ำเงินและสีแดง: บ่งบอกสัญญ
FREE

Session Killzone-Indikator
Indikator, der Ihnen hilft, die Killzone-Zeiten der Londoner und New Yorker Sitzungen zu identifizieren, die in der Regel die Zeiten hoher Volatilität und des Liquiditätsentzugs auf dem Markt sind. Die Killzone-Zeiten sind über die Indikatorparameter konfigurierbar. Der Indikator passt den Bereich der Killzones auf der Grundlage der täglichen Handelsspanne an.
FREE
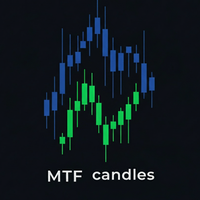
Der MTF-Indikator (Multi-Timeframe) Candles ist ein leistungsstarkes Tool, mit dem Sie Kerzen eines höheren Zeitrahmens (z.B. H1, H4, D1) direkt auf einem Chart mit niedrigerem Zeitrahmen (z.B. M5, M15, M30) anzeigen können. Das Problem, das gelöst wird: Anstatt ständig zwischen den Charts hin- und herzuwechseln, um den Haupttrend und die detaillierte Preisaktion zu analysieren, vereint dieser Indikator beide Perspektiven in einer. Sie können sofort das "große Ganze" sehen, während Sie sich auf
FREE

CandleForce Pro: Das ultimative Dashboard zur Entscheidungsunterstützung für moderne Trader Einführung: Das Chaos der modernen Märkte überwinden
Auf den hypervernetzten Finanzmärkten von heute steht der moderne Trader vor dem Paradoxon der Auswahl. Wir werden mit einem endlosen Strom von Daten, Indikatoren, Nachrichten und Strategien überschwemmt, die alle versprechen, die Geheimnisse des profitablen Handels zu entschlüsseln. Diese ständige Flut führt oft zu einer "Analyseparalyse" - einem Zus
FREE

Zeichnen und Synchronisieren von Objekten Mehrere Diagramme 1. Zeichnen Sie Objekte per Tastendruck. (Sie müssen: 1. drücken Sie die Funktionstaste => 2. klicken Sie auf die Stelle, die Sie zeichnen möchten => 3. zeichnen Sie es => 4. drücken Sie ESC um abzuschließen). (Wenn Sie nach dem Drücken der Funktionstaste nicht zeichnen wollen, müssen Sie zum Abbrechen ESC drücken). 2. Entwickeln : Ausgewählte Objekte mit mehreren Diagrammen über die Schaltfläche synchronisieren. 3. Entwickeln: Ausblend
FREE

Maus Sie können Fibonaccis zeichnen, indem Sie die Maus über den Zickzack-Indikator bewegen. Anheften Wenn Sie mit dieser Option auf eine Fibonacci klicken, wird sie nicht mehr gelöscht, bis Sie sie erneut anklicken :) Genauigkeit Der abgestimmte Fibonacci-Indikator zeigt den genauen Punkt in den unteren Zeitrahmen an. Genießen Sie es Sie können mich fragen, für weitere Funktionen hinzufügen, so wenden Sie sich bitte kommentieren und lassen Sie Ihre Schimpfen für mich glücklich zu sein, danke :)
FREE

Smart Money Concepts Indikator - Professionelles ICT/SMC Handelssystem Transformieren Sie Ihr Trading mit der institutionellen Smart-Money-Analyse Nutzen Sie die Leistungsfähigkeit der Methoden von Smart Money Concepts (SMC) und Inner Circle Trader (ICT) mit diesem fortschrittlichen Indikator, der hochwahrscheinliche Einstiegszonen identifiziert und intelligente Take-Profit-Ziele am nächsten Point of Interest (POI) setzt. Hören Sie auf zu raten, wo Sie Ihre Trades beenden sollten - lassen Sie si
FREE

Der Spots-Indikator kann für den Ein- und Ausstieg in Ihre Trades verwendet werden, basierend auf den üblichen Kerzenmustern wie: Engulfing, Hanging Man, Doji usw. Er ist so konzipiert, dass er jedes Mal, wenn ein Signal ausgelöst wird, eine Benachrichtigung auf dem Desktop und auf dem Handy veröffentlicht. Es ist jedoch erwähnenswert, dass dieser Indikator mit anderen Indikatoren für die Bestätigung der Einträge verwendet werden sollte. Es ist am besten, ihn zusammen mit dem Indikator Investme
FREE

Sind Sie es leid, bei jeder Analyse von Charts Trendlinien zu zeichnen? Oder wünschen Sie sich mehr Konsistenz in Ihrer technischen Analyse? Dann ist dies genau das Richtige für Sie. Dieser Indikator zeichnet automatisch Trendlinien, wenn er auf einem Chart abgelegt wird. Wie er funktioniert Funktioniert ähnlich wie der Standardabweichungskanal auf mt4 und mt5. Er hat 2 Parameter: 1. Start-Bar 2. Anzahl der Balken für die Berechnung Der Startbalken ist der Balken, mit dem das Zeichnen der Trendl
FREE

Der Market Imbalance Detector ist ein Indikator für die technische Analyse, der auf Preisungleichgewichte hinweist, die allgemein als Fair Value Gaps (FVGs) bekannt sind. Der Indikator erkennt Ungleichgewichtszonen anhand einer präzisen Drei-Kerzen-Struktur und zeigt sie direkt auf dem Chart als visuelle Zonen an. Diese Bereiche stellen Preisineffizienzen dar, die als potenzielle Reaktions- oder Interessenzonen für zukünftige Preisbewegungen dienen können. Merkmale Erkennt bullische und beari
FREE
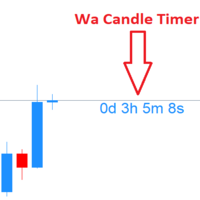
Wa Candle Timer MT5 ist ein leistungsstarker und benutzerfreundlicher Indikator, der die verbleibende Zeit bis zur nächsten Kerze auf deinem MT5-Chart anzeigt. Dieses Tool unterstützt Trader dabei, Kerzenschlusszeiten im Blick zu behalten und fundierte Entscheidungen zu treffen. Hauptfunktionen :
Zeigt den Countdown der aktuellen Kerze an.
Farbwechsel, wenn die verbleibende Zeit unter einen vom Nutzer definierten Prozentsatz fällt.
Anpassbarer Alarm bei Erreichen eines bestimmten Proze
FREE
Der MetaTrader Market ist die beste Plattform für den Verkauf von Handelsroboter und technischen Indikatoren.
Sie brauchen nur ein gefragtes Programm für die MetaTrader Plattform schreiben und schön gestalten sowie eine Beschreibung hinzufügen. Wir helfen Ihnen, das Produkt im Market Service zu veröffentlichen, wo Millionen von MetaTrader Benutzern es kaufen können. Konzentrieren Sie sich auf dem Wesentlichen - schreiben Sie Programme für Autotrading.
Sie verpassen Handelsmöglichkeiten:
- Freie Handelsapplikationen
- Über 8.000 Signale zum Kopieren
- Wirtschaftsnachrichten für die Lage an den Finanzmärkte
Registrierung
Einloggen
Wenn Sie kein Benutzerkonto haben, registrieren Sie sich
Erlauben Sie die Verwendung von Cookies, um sich auf der Website MQL5.com anzumelden.
Bitte aktivieren Sie die notwendige Einstellung in Ihrem Browser, da Sie sich sonst nicht einloggen können.