VWAP and MVWAP
- Indikatoren
-
Flavio Javier Jarabeck
 We are a closed brotherhood of traders whose ultimate goal is to profit through well-studied, structured, and automated trades. As a result, we publish dozens of MT5 indicators (FREE and paid) to the global MQL5 community. 80% of our published products are high-quality free indicators so beginner
 - Version: 1.1
- Aktualisiert: 6 Juni 2020
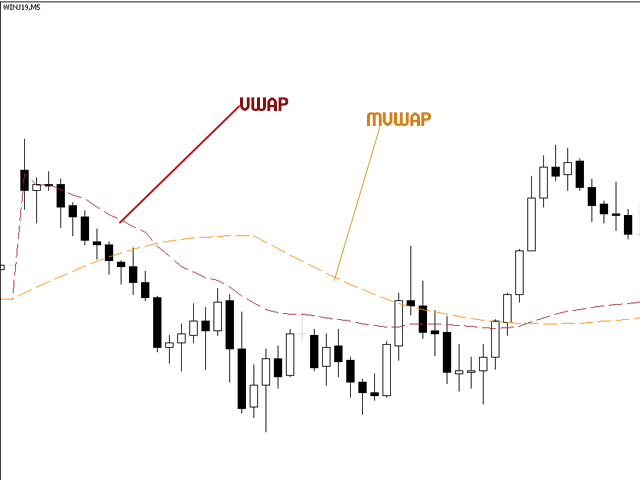
Der volumengewichtete Durchschnittspreis (VWAP) ist eine von den großen Akteuren häufig verwendete Handelsbenchmark, die den Durchschnittspreis angibt, zu dem ein Symbol während des Tages gehandelt wurde. Er basiert sowohl auf dem Volumen als auch auf dem Preis. Zusätzlich haben wir in diesen Indikator den MVWAP (Moving Volume Weighted Average Price) aufgenommen.
Für diejenigen, die den Gebrauch und die Bedeutung dieses Indikators nicht kennen, empfehle ich einen großartigen Artikel über dieses Thema bei Investopedia(https://www.investopedia.com/articles/trading/11/trading-with-vwap-mvwap.asp). Wir empfehlen nicht, ausschließlich mit diesem Indikator zu handeln. Verwenden Sie ihn als ein weiteres Werkzeug in Ihrem Werkzeugkasten, um das Preis- und Marktverhalten zu bestätigen.
Der VWAP-Indikator wurde für Day Trades entwickelt, da sein Berechnungszeitraum TÄGLICH ist (1-Tages-Periode).
Der MVWAP kann in höheren Timeframes (z.B. täglich) verwendet werden...
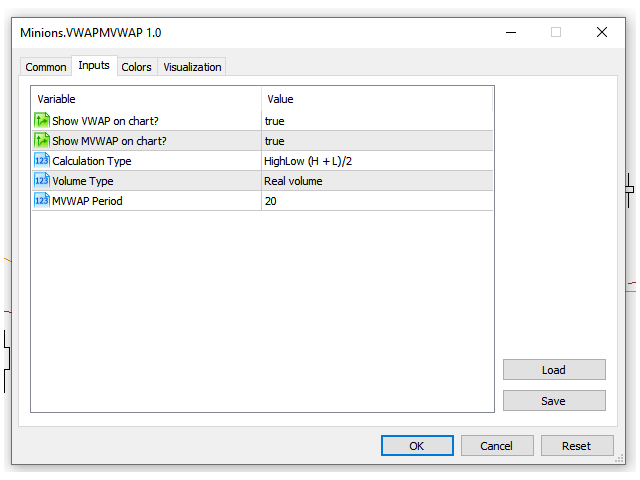
EINSTELLUNGEN
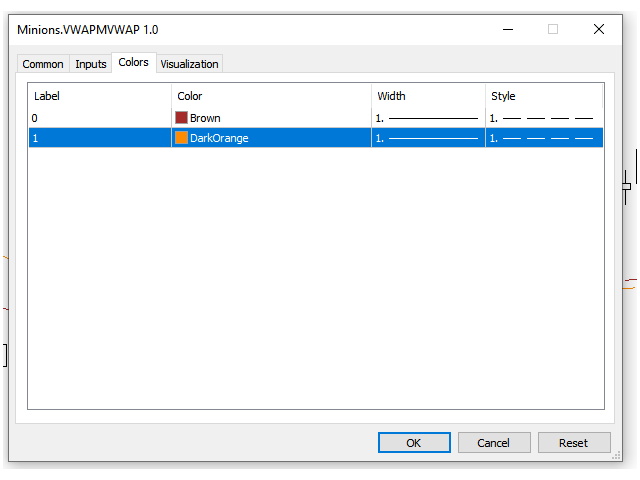
- Möglichkeit, die VWAP-Linie im Diagramm anzuzeigen/auszublenden.
- Möglichkeit, die MVWAP-Linie im Diagramm ein- und auszublenden.
- Wählen Sie die Art der Berechnung der VWAP-Linie.
- Verwendeter Volumentyp (Ticks oder Real)
- Zeitraum der MVWAP-Linie.
Looking for more FREE VWAP-related indicators, here you go:
Wenn Ihnen dieser Indikator gefällt, bitte ich Sie nur um ein kleines Review (kein Kommentar, sondern ein REVIEW!)...
Das wird mir sehr viel bedeuten... Und auf diese Weise kann ich weiterhin coole Sachen kostenlos verschenken...
Ohne Bedingungen! Niemals!
Lebe lang und in Frieden!
;)


Great one ! Thank you