Regardez les tutoriels vidéo de Market sur YouTube
Comment acheter un robot de trading ou un indicateur
Exécutez votre EA sur
hébergement virtuel
hébergement virtuel
Test un indicateur/robot de trading avant d'acheter
Vous voulez gagner de l'argent sur Market ?
Comment présenter un produit pour qu'il se vende bien
Indicateurs techniques pour MetaTrader 5 - 19

Profil de marché HiperCube ! Code de réduction de 20% sur Darwinex Zero : DWZ2328770MGM_20 Un profil de marché est une représentation graphique qui combine les informations de prix et de temps sous la forme d'une distribution. Il affiche les informations de prix sur l'échelle verticale (axe des Y) et les informations de volume sur l'échelle horizontale (axe des X). Ce type de graphique fournit des informations sur l'activité du marché, permettant aux traders de visualiser et d'évaluer la juste
FREE

Dark Sprint is an Indicator for intraday trading. This Indicator is based on Trend Following strategy, also adopting the use of the atr to determine the right volatility. We can enter in good price with this Indicator, in order to follow the strong impulse on the current instrument.
Key benefits
Easily visible sprint lines Intuitive directional arrows Automated adjustment for each timeframe and instrument Easy to use even for beginners Never repaints, never backpaints, Not Lag 100% compatibl

No Demand No Supply This indicator identifies No Demand –No Supply candles to your chart and plots volume bars colored according to the signal. It can be applied to all timeframes or to a specific one only. It can also be used as regular volume indicator with exceptional future of WEIGHTED VOLUME. Furthermore is has an alert notification, sound and email when a signals occurs. The indicator does not repaint but the alert will come on two candles back due to the definition of No Demand No Su

Big Figure Levels – Key Psychological Price Zones for MT5 Big Figure Levels is a professional trading tool designed for MetaTrader 5 that automatically identifies and draws major psychological price levels, including quarter and half levels. These levels are known to act as powerful support and resistance zones due to their influence on both institutional and retail trader behavior. This indicator is perfect for any trading style—whether you're a scalper, day trader, or swing trader—and is compa
FREE
Bandes de Machine Learning VWAP : L'Avantage Prédictif pour les Traders Débloquez le niveau supérieur de l'analyse de marché avec les Bandes de Machine Learning VWAP – un indicateur MQL5 innovant conçu pour fournir des informations inégalées sur les tendances du marché, les zones dynamiques de support/résistance et les signaux de trading à haute probabilité. Exploitant un algorithme propriétaire d'apprentissage automatique adaptatif intégré à la puissance du prix moyen pondéré par le volume (VWA
Fractal Model Indicator for Metatrader , meticulously crafted around the renowned Fractal Model by TTrades. This powerful tool empowers traders to navigate price action with precision, leveraging multi-timeframe analysis to anticipate momentum shifts, swing formations, and trend continuations. Designed for MetaTrader , the Fractal Model Indicator combines advanced algorithmic insights with customizable features, making it an essential addition for traders seeking to capitalize on expansive mar

Highly configurable Trader Dynamic Index (TDI) indicator.
Features: Highly customizable alert functions (at levels, crosses, direction changes via email, push, sound, popup) Multi timeframe ability (higher and lower timeframes also) Color customization (at levels, crosses, direction changes) Linear interpolation and histogram mode options Works on strategy tester in multi timeframe mode (at weekend without ticks also) Adjustable Levels Parameters:
TDI Timeframe: You can set the lower/higher ti
FREE

Hunt markets with Hunttern ZigZag . Easy to use with one parameter
You can use it for the following: -Classic patterns -Heads and shoulders -Harmonic patterns -Elliott Wave -Support and resistance -Supply and Demand
Single parameter: -Period (1-120)
Features: -Candle time -Single parameter -Light mode template
This is version 1 of Hunttern ZigZag. We are very happy to receive feedback from you.
FREE

Precision Arrows – Signaux d’entrée précis avec TP et SL intégrés Precision Arrows est un indicateur de trading puissant conçu pour les traders qui exigent précision, clarté et fiabilité .
Il identifie des signaux d’achat et de vente à haute probabilité et génère automatiquement les niveaux de Take Profit (TP) et Stop Loss (SL) , permettant de trader avec discipline et régularité sur les marchés Forex, indices, crypto-monnaies et indices synthétiques . L’indicateur combine une détection de signa

ICT Unicorn Hunter – Multi-Timeframe Smart Setup Detector IMPORTANT: This is a Multi-Timeframe Scanner, looking for 'Unicorn' setups. A Unicorn in this definition is a liquidity sweep, market structure shift and creation of a Fair Value Gap overlapping with the last opposite-close candle before the liquidity sweep (breaker). This scanner does NOT provide visualisation of the Unicorn on the chart.
For visualisation, use the Unicorn Tracker indicator, which is designed to work with the Unicorn
FREE
Free Until 1st Jan 2026
VWAR 2.2 (Volume Weighted Average Roadmap) is an advanced institutional-grade MT5 indicator that brings you the most powerful multi-timeframe VWAP (Volume Weighted Average Price) analysis—plus filtered trade signals using robust trend and momentum confirmations. Key Features: Multi-Timeframe VWAP Lines:
Plots Daily, Weekly, and Monthly VWAP levels for instant market structure insight. Dynamic Buy/Sell Signals: Big, bold colored arrows indicate confirmed buy or sell opp
FREE

This indicator displays buy or sell signals according to Bill Williams' definition of the Trading Zone. [ Installation Guide | Update Guide | Troubleshooting | FAQ | All Products ] Easy to use and understand Avoid trading flat markets Deterministic indicator with clear rules The indicator is non-repainting It implements alerts of all kinds It has straightforward trading implications. A blue arrow is a buy signal A red arrow is a sell signal According to Bill Williams trading in the zone helps t
FREE

Overview
Support & Resistance (MTF) is a MetaTrader 5 indicator that automatically identifies swing highs (resistance) and swing lows (support) across up to three timeframes. It merges nearby levels to reduce clutter, adapts zone width to market volatility using ATR, and offers optional alerts when price breaks or retests those levels. Features Multi-timeframe pivot detection
Identify pivots on the current chart plus two higher timeframes using a configurable pivot length. Merge-distance grou
FREE
FiboPivot TrendLines - Comprehensive Market Analysis Indicator
This powerful indicator combines Fibonacci pivot point analysis with automatic trend line detection, providing traders with a complete technical analysis toolkit in a single tool.
Key Features : - Fibonacci Pivot Points: Automatically calculates and displays R1-R3, Pivot, and S1-S3 levels using previous day's data - Fractal-Based Trend Lines: Automatically draws channel trend lines based on fractal patterns - Interactive
FREE

This indicator is a simple tool to spot a possible trend.
When the ribbon below the price bars, It will turn to Green color and the trend is seen to be bullish When the ribbon above the price bars, it will turn to Red color and the trend is seen to be bearish. It can be used a either Entry Signal Exit Signal or trailing stop, so it is very versatile. By default color : Green is UP trend and Red is Down trend and this work perfect with Bar4Colors.ex5
FREE

This indicator is the mql version of the Smoothed Heiken Ashi Candles. Find out more here: https://www.mql5.com/en/users/rashedsamir/seller Heikin-Ashi charts resemble candlestick charts , but have a smoother appearance as they track a range of price movements, rather than tracking every price movement as with candlesticks.
Because the Heikin Ashi candlesticks are calculated based on averages, the candlesticks will have smaller shadows than a regular Japanese candlestick. Just like with
FREE
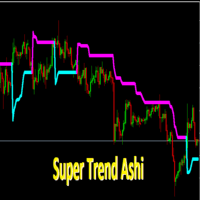
SuperTrendAshi Description SuperTrendAshi is an advanced and optimized version of the SuperTrend indicator that incorporates Heikin Ashi calculation to provide smoother and more reliable signals. This unique combination results in an indicator that reduces false signals and identifies trends with greater precision. Key Features Combines the strength of SuperTrend with Heikin Ashi smoothing More stable signals with less noise Intuitive color system (Aqua for uptrend, Magenta for downtrend) Custo
FREE

Le Nadaraya-Watson Envelope est un indicateur basé sur une régression non paramétrique qui aide les traders à identifier les tendances, les niveaux de support et de résistance à l’aide de bandes lissées et adaptatives. Contrairement aux moyennes mobiles traditionnelles ou aux enveloppes basées sur l’écart-type, cet indicateur utilise la régression à noyau de Nadaraya-Watson , qui s’adapte dynamiquement aux mouvements des prix, réduisant le décalage tout en restant réactif.
Caractéristiqu
FREE
Developed by smart2trader.com
The Didi Index Nuvem Indicator is an indicator based on the original Didi Aguiar (Didi Index) indicator, featuring two visualization methods for the moving averages: as a cloud or as lines (original). This customization offers a new way to visualize the moving average crossovers in the Didi Index indicator. About the Didi Index Indicator The Didi Index Indicator , created by Brazilian trader Didi Aguiar, is a technical analysis tool based on the crossover of three
FREE
The Moving Average Ribbon is a technical indicator that overlays a series of moving averages (MAs) on a price chart to visualize trend direction, strength, and potential reversals or reentries. It supports both Exponential Moving Averages (EMA) and Simple Moving Averages (SMA), configurable via user input.
Key Features:
Ribbon Composition: Displays 18 moving averages with periods ranging from 5 to 90 in increments of 5 (e.g., MA5, MA10, ..., MA90), plus an internal MA100 for reference. The MA5
FREE
Weis Waves est un indicateur technique développé par David Weis, inspiré des principes de Richard Wyckoff.
Contrairement au volume traditionnel, affiché barre par barre, Weis Waves cumule le volume en “vagues” haussières ou baissières, redémarrant le comptage dès que la direction du prix change. Cette approche permet aux traders de visualiser clairement la véritable force des mouvements du marché , car chaque vague reflète l’intensité du volume derrière une série de bougies. Caractéristiques
FREE

Volume Weighted Average Price (VWAP) is a trading benchmark commonly used by Big Players that gives the average price a Symbol has traded throughout the day. It is based on both Volume and price. Additionally we put in this indicator the MVWAP (Moving Volume Weighted Average Price). For those who do not know the usage and the importance od this indicator I recommend a great article about this subject at Investopedia ( https://www.investopedia.com/articles/trading/11/trading-with-vwap-mvwap.asp )
FREE

Description Générale L’Indicateur Fair Gap Value identifie et met en évidence les « fair value gaps » sur le graphique de MetaTrader 5. Un fair gap se forme lorsqu’un vide de prix apparaît entre le plus bas d’une bougie et le plus haut d’une bougie située deux périodes plus tôt. L’indicateur dessine des rectangles colorés (haussiers et baissiers) pour souligner ces zones et offrir un support visuel aux stratégies basées sur les mouvements de prix. Fonctionnalités Clés Détection de gap haussier :
FREE

Overview Magic 7 Indicator is a comprehensive MetaTrader 5 (MQL5) indicator that identifies seven different trading scenarios based on candlestick patterns and technical analysis. The indicator combines traditional price action patterns with modern concepts like Fair Value Gaps (FVG) to provide trading signals with precise entry points and stop loss levels. Features 7 Trading Scenarios : Each scenario identifies specific market conditions and trading opportunities Visual Signals : Clear buy/sell
FREE
Simple Spread Indicator (SSI) is a simple and lightweight indicator that displays the current spread value directly on the main chart window.
It helps traders instantly recognize market liquidity conditions and trading costs without opening additional panels or tools. Features Real-time spread display on the main chart Customizable position and font size Minimal system load and no data buffering Useful for scalping and low-spread strategy monitoring How it works The indicator calculates the diff
FREE
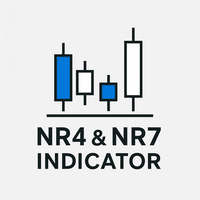
Description : NR4 & NR7 Inside Bar Highlighter est un indicateur qui détecte automatiquement les configurations de compression des prix, basées sur la combinaison des patterns NR4 ou NR7 avec une bougie Inside Bar. Le pattern NR4 (Narrow Range 4) identifie la bougie avec la plus petite amplitude des 4 dernières bougies. De même, le NR7 examine les 7 dernières bougies. Lorsque ces conditions coïncident avec une Inside Bar (bougie entièrement contenue dans la précédente), cela indique une période
FREE
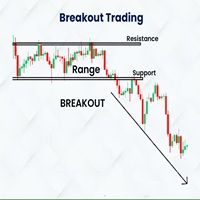
Indicador Basado en la estrategia de ruptura del rango de londres de Amaury Benedetti.
Este indicador dibuja automaticamente el rango, el maximo y minimo y sus correspondientes lineas de stoploss, entrada y takeprofit.
SE RECOMIENDA USAR EN M1 EN EL US30 (DE ACUERDO A LA ESTRATEGIA)
Los valores se pueden modificar de acuerdo a la necesidad del usuario, tambien se tienen mas configuraciones para dibujar cualquier rango en diversos horarios y con diferentes configuraciones de sl, tp, etc
Detal
FREE

Description This technical indicator is designed to automate the analysis of market structure based on price action concepts. It identifies and labels key structural points, including Higher Highs (HH), Lower Lows (LL), Lower Highs (LH), and Higher Lows (HL), to assist traders in visualizing market trends. The indicator uses a configurable "Swing Strength" logic, checking a user-defined number of bars to the left and right of a pivot to confirm its validity. It also identifies Break of Structure
FREE

ATR Smart Levels – Voir clairement où le marché peut réellement aller Beaucoup de traders perdent non pas à cause de leur stratégie, mais à cause de mauvais niveaux d’entrée : trop tôt, au milieu de la zone, sans bon ratio R:R. ATR Smart Levels résout ce problème avec un seul indicateur et trois boutons. L’indicateur trace automatiquement trois zones cibles basées sur l’ATR (TP1, TP2, TP3) au-dessus et au-dessous du prix actuel. Fonctionnalités Calcule l’ATR sur le timeframe choisi Crée des obje
FREE

BBMA by RWBTradeLab is a clean chart-plotting indicator for MetaTrader 5 that combines Bollinger Bands , Linear Weighted Moving Averages (LWMA) on High/Low , and an EMA on Close to help traders read market structure visually. What it plots Bollinger Bands (Upper / Basis / Lower) LWMA on Low : 5 & 10 periods LWMA on High : 5 & 10 periods EMA on Close : default 50 periods Key features Plot-only indicator (no alerts, no trade execution) Non-repainting calculations (standard indicator plotting) Opti
FREE

Shadow Bands Pro – MT5 说明(中英文) English Description (MT5) Shadow Bands Pro – Advanced Reversion System for MT5 This MT5 edition of Shadow Bands Pro takes full advantage of the MT5 platform, offering faster calculations, more timeframes, and better testing capabilities.
It remains a non-repainting (on close) trend-reversal / mean-reversion tool with dynamic channels, entity-break logic, and an integrated statistics panel. Key Features Optimized for MT5’s 64-bit, multi-threaded architecture Non-
FREE

Break Even Line by MMD
The Break Even line is a useful indicator for people using strategies that allow simultaneous trades in both directions, such as the MMD methodology. This indicator is useful when playing statistical models and averaging positions in accumulation and distribution zones. The indicator draws levels by summing positions in three groups: positions included in BUY, positions included in SELL and all positions included.
Functionality description:
Show BUY BELine - shows or
FREE
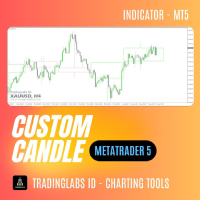
Custom Candle – Multi-Timeframe Visualization Analyzing multiple timeframes is essential for accurate trading decisions, but switching between charts can be inconvenient and inefficient. The Custom Candle indicator solves this problem by overlaying higher-timeframe (HTF) candles directly onto your lower-timeframe (LTF) chart. This allows you to see the bigger picture at a glance, align with the higher trend, and improve trade accuracy—without leaving your current chart. Key Features Multi-Timefr
FREE
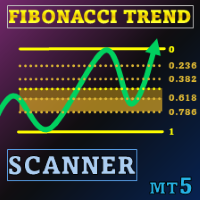
Offre spéciale : ALL TOOLS , seulement 35 $ chacun ! New tools will be $30 for the first week or the first 3 purchases ! Trading Tools Channel on MQL5 : Join my MQL5 channel to update the latest news from me Dans un environnement de trading volatile, un outil d’analyse puissant et intuitif peut vous aider à saisir rapidement les opportunités. Fibonacci Trend Scanner intègre non seulement les fonctionnalités traditionnelles de l’indicateur Fibonacci et SuperTrend, mais étend égaleme

Pivot Point Super trend it can be used to catch price turning points and can show arrows for buying and selling. calculations are based on price peaks . you can control the price turning points by increasing the Pivot point period input on the indicator the ATR factor is for how far apart do you want the bands to be spread apart price break outs are also spotted in their early stages which will make trading much better
FREE

Alert Indicator for exponential moving average cross blue arrow for buy alert , fast ema 14 crosses above 50 pink arrow for sell alert , fast ema 14 crosses below 50 Default 14 ema fast & 50 ema slow add these indicators to chart Full Alerts , push, email, phone inputs for moving average lengths and alarm on off settings Please contact for help of an indicator alert suggestion
FREE

The ChanLun or Chan theory is one of the most popular trading theories in China. But it seems like that it has little influence in western countries. Actually, the Chan Theory is based on a sophisticated mathematical model. The basic idea ChanLun is to simplify the bar chart by its model. With the help of ChanLun, a trader can analyze and predict the trend of future goods, stocks.
In ChanLun, there are several basic elements called fractals, strokes, line segments and pivots . A trader should pa

Major Swing Fibonacci Indicator - Professional Trading Tool What It Does Automatically detects major swing points not internal noise Generates buy/sell signals at key Fibonacci levels Displays professional GUI panel with real-time analysis Marks major swings with visual indicators Trading Strategy BUY at 38.2%-61.8% Fibonacci support in uptrends SELL Past performance is not indicative of future results. This indicator is for educational and informational purposes only and does not constitute in
FREE

This auxiliary indicator displays time left before closing on the current timeframe with continuous update . It also shows the last trade price and variation from a previous day close in percentage and points. This indicator is pretty handy for daytraders and scalpers who want to precisely monitor closing and opening of candles.
Indicator parameters Show in shifted end - Default: False. Display time and values on screen. If True, Displays only time to close aside last candle. Distance from the
FREE
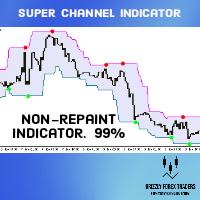
Super Signals Channel Indicator Its channel is a non-repaint indicator that reacts more with recent price movements. For this reason, the Super Signals Channel Indicator is a better match for short-term or day trading strategy. The Super Signals Channel only plots swing trading opportunities. So most of its trade signals appear during consolidation or sidelined periods of the market. Super Signals Channel Indicator for MT5 Explanation The green band below the price shows the dynamic support lev

VORTEX OSCILLATEUR : La Puissance du Flux de Volume VORTEX OSCILLATEUR est un outil de trading avancé qui transforme l'indicateur Vortex classique en un oscillateur de précision ultra-réactif. Conçu pour les traders qui exigent une clarté absolue, il fusionne l'action des prix et le volume pour révéler la véritable force derrière chaque mouvement. Ce qui rend le VORTEX OSCILLATEUR unique La plupart des indicateurs se contentent de suivre le prix, arrivant souvent trop tard. VORTEX OSCILLAT

Les lignes de résistance de vitesse sont un outil puissant pour déterminer la tendance et les lignes de résistance. L'indicateur construit des lignes en utilisant des extrema graphiques et des formules Mathématiques spéciales. L'indicateur peut être utilisé pour déterminer la direction de la tendance et les points d'inversion.
<---------------------------->
Paramètres de l'indicateur:
"Depth of search" - profondeur (en barres) de la recherche extrema graphique "Back step of search" - distanc
FREE

Nous présentons le puissant indicateur NRTR (Nick Rypock Trailing Reverse) - un outil technique indispensable pour les traders cherchant à identifier les retournements de tendance et à établir des niveaux de stop trailing efficaces. Développé par Nick Rypock, cet indicateur dispose d'un algorithme unique qui s'adapte aux conditions de marché en constante évolution, en faisant une addition inestimable à l'arsenal de tout trader.
Voici les deux façons populaires dont les traders utilisent cet in
FREE

The indicator has been designed for use on FORTS, but it can also work on other markets, at brokers broadcasting the required data. A peculiarity of these data is that they cannot be requested from the broker's server as a section of history, but can only be obtained for the current moment. The indicator periodically requests the broker, collects to a file and displays the following history from the stored file: The weighted average price. The volume of buy pending orders. The volume of sell pen
FREE
Cet assistant de nouvelles est conçu pour obtenir les événements économiques dont les traders ont besoin à partir des principales sources de publication, qui publient des nouvelles en temps réel sur la base du Market Watch du terminal avec des filtres variés et simples.
Les traders du Forex utilisent des indicateurs macroéconomiques pour prendre des décisions éclairées concernant l’achat et la vente de devises. Par exemple, si un trader estime que l’économie américaine va croître plus rapideme
FREE
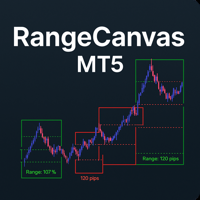
Daily Range Boxes : The indicator draws rectangular boxes around each day's high and low prices, creating a clear visual boundary for the daily trading range. Color-Coded Logic : Green boxes when the current price (or close) is above the daily open Red boxes when the current price is below the daily open Percentage Level Lines : Inside each box, it draws three horizontal lines at: 25% of the daily range 50% of the daily range (midpoint) 75% of the daily range Range Information : Each box displa
FREE
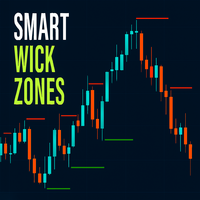
Smart Wick Zones indicator is a powerful tool designed to highlight hidden areas of price rejection and liquidity on your chart. By analyzing candle wicks (also called shadows or tails), the indicator automatically draws horizontal zones where strong buying or selling pressure has previously appeared. These wick zones often mark turning points in the market or areas where price reacts strongly, making them excellent references for support and resistance.
Instead of manually scanning candles for
FREE
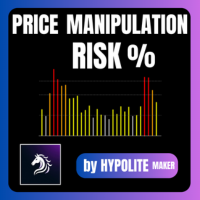
Price Manipulation Risk Indicator Outil Avancé d’Évaluation du Risque & de Détection de Manipulation Price Manipulation Risk Indicator est un indicateur professionnel conçu pour mesurer le niveau de risque présent sur le marché .
Il analyse le comportement du prix, l’activité du marché et la dynamique des bougies afin d’identifier les phases instables ou potentiellement manipulées. Cet outil aide le trader à éviter les pièges , filtrer les faux signaux , et améliorer son timing d’entrée et
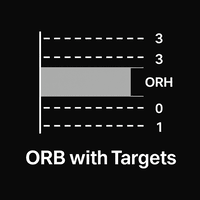
Product Name: Opening Range Breakout Pro MT5 Opening Range Breakout Pro is a technical indicator for MetaTrader 5 that identifies and plots the opening range based on user-defined session times. It is designed to assist traders who utilize session-based breakout strategies by automating the calculation of range boundaries and expansion levels. The indicator identifies the high and low of the opening period and projects multiple target levels above and below this range. These levels remain stati
KDJ Indicator for MT5 The KDJ Indicator for MT5 is a professional-grade momentum and trend analysis tool designed to help traders identify trend reversals , overbought/oversold conditions , and entry or exit opportunities with high accuracy. Originally developed as an enhancement of the Stochastic Oscillator , the KDJ adds a powerful J-line that reacts faster to price movement, giving traders earlier warnings of potential reversals. Key Features Three-Line System (K, D, J):
The K and D lines r
FREE
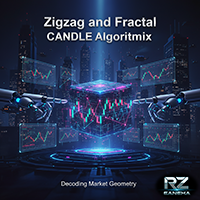
ZIGZAG and FRACTAL CANDLE PRO ( Only candles, No RSI strength panel) " Suitable for QQE RITZ " > Check My Product is an advanced market structure visualization system built for precision trend detection, powered by dynamic fractal logic and adaptive swing validation.
It seamlessly identifies Higher Highs (HH), Lower Lows (LL), and key structural shifts — allowing traders to read the true rhythm of market transitions with institutional clarity. This system combines ZigZag precision , fractal
FREE

BEHOLD!!!
One of the best Breakout Indicator of all time is here. Multi Breakout Pattern looks at the preceding candles and timeframes to help you recognize the breakouts in real time.
The In-built function of supply and demand can help you evaluate your take profits and Stop losses
SEE THE SCREENSHOTS TO WITNESS SOME OF THE BEST BREAKOUTS
INPUTS
MaxBarsback: The max bars to look back
Slow length 1: Period lookback
Slow length 2: Period lookback
Slow length 3: Period lookback
Slow leng
FREE
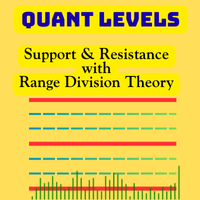
Quant Levels Indicator is a premium component of the Quantitative Trading Analysis Toolkit , designed to transform subjective trading into data-driven decision making. This advanced tool provides institutional-grade support and resistance analysis directly on your MT5 charts. " Please support our work by leaving a review ". As a thank-you gift , we’ll share a special template that helps you display signal trade history directly on your chart. Free indicator to visualize any MT5/MT4 signals i
FREE
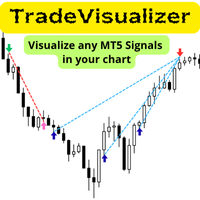
L’indicateur Trade Visualizer donne vie à vos données de trading en affichant l’historique complet de vos transactions directement sur vos graphiques MT5. Que vous analysiez vos propres performances ou les signaux de traders du marché MQL5, cet outil transforme vos données brutes en visuels clairs et intuitifs. Chaque trade est illustré par des flèches d’entrée et de sortie, des lignes de liaison et des info-bulles détaillées (prix, profit, volume, pips). Remarque : Si vous avez téléchargé cet i
FREE
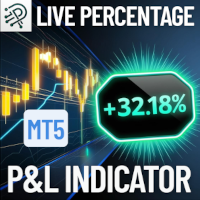
Surveillez rapidement votre profit ou perte flottant(e) en pourcentage de votre solde de compte : en direct et toujours visible sur votre graphique ! Principales caractéristiques : Calcul en temps réel : Calcule instantanément le profit ou la perte flottant(e) combiné(e) de toutes les positions ouvertes en pourcentage de votre solde de compte actuel. Affichage clair sur le graphique : Le résultat est affiché sous forme d’étiquette en bas à droite de votre graphique — aucune distraction, toujour
FREE
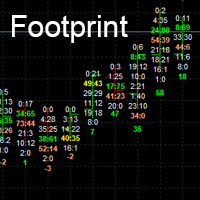
Footprint charts can add a level of depth to your visuals that standard charts cannot achieve.
Footprint charts are a powerful way to visualize the ups and downs of the market, helping you potentially to make better trading decisions. Orderflow Footprint in MT5. show # of market orders at each tick.
Inputs
Point Scale *1 to *10000
Number of candle to show. Font Size Max Bid Color (Top Seller) Max Ask Color (Top Buyer) Max Bid and Ask Color
Normal color
Overview
Supply & Demand (MTF) v1.00 is a MetaTrader 5 indicator that automatically identifies and draws key supply and demand zones from up to three timeframes on your current chart. Supply zones mark areas where selling pressure was strong; demand zones mark areas where buying pressure was strong. Features Multi-timeframe detection
Scan the current chart plus two higher timeframes for zones. Candle-strength filter
Require a configurable number of strong candles to confirm each zone. Adjust
FREE
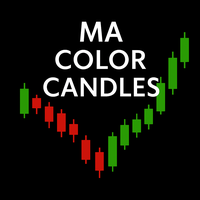
MA Color Candles Indicator MA Color Candles is an indicator for visually displaying market trends by coloring chart candles. It does not add objects or distort price data, instead coloring real candles based on the state of two moving averages. This enables quick trend assessment and use as a filter in trading strategies. How It Works Bullish trend: Fast MA above slow MA, slow MA rising (green candles). Bearish trend: Fast MA below slow MA, slow MA falling (red candles). Neutral state: Candles
FREE

L'indicateur affiche les niveaux techniques importants sur le graphique. Ces niveaux agissent comme support ou résistance pour le mouvement des prix.
Les niveaux les plus importants sont les multiples de 100 et 50 points. Vous pouvez également afficher les niveaux par multiples de 25 points.
Lorsque le prix atteint le niveau, une alerte ou une notification push s'affiche.
Version pour MT4 https://www.mql5.com/fr/market/product/69486 Paramètres Show Levels 100 pips - afficher les niveaux en m
FREE

YOU CAN NOW DOWNLOAD FREE VERSIONS OF OUR PAID INDICATORS . IT'S OUR WAY OF GIVING BACK TO THE COMMUNITY ! >>> GO HERE TO DOWNLOAD
The Volatility Ratio was developed by Jack D. Schwager to identify trading range and signal potential breakouts. The volatility ratio is defined as the current day's true range divided by the true range over a certain number of days N (i.e. N periods). The following formula is used to calculate the volatility ratio: Volatility Ratio (VR) = Today's True Range
FREE

En sécurité informatique, une attaque par force brute consiste en une méthode systématique d'essais et d'erreurs pour découvrir des mots de passe, des identifiants de connexion ou des clés cryptographiques. Inspirés par cette approche, nous avons développé Brute Force Trend, un outil d'analyse de marché utilisant des algorithmes pour identifier les tendances et les points de retournement.
Principales fonctionnalités :
Plusieurs méthodes de calcul : Neuf méthodes différentes de traitement du p
FREE

Product Name: HTF Candle Insight (EurUsd) - See the Big Picture Description: IMPORTANT: This version works EXCLUSIVELY on the EURUSD symbol. (It supports all broker prefixes/suffixes, e.g., pro.EURUSD, EURUSD.m, but will NOT work on Gold, Bitcoin, or other pairs). Experience the full power of "HTF Candle Insight" completely on EURUSD! Stop switching tabs constantly! This indicator allows you to visualize Higher Timeframe price action directly on your current trading chart. Whether you are a Sca
FREE
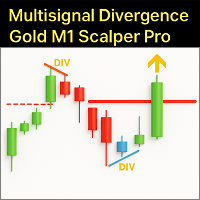
Master the volatile Gold (XAUUSD) market on the M1 timeframe with the Multisignal Divergence Gold M1 Scalper Pro . This indicator is not just another tool, but an advanced trading engine, meticulously designed to provide scalpers with high-precision entry signals, filtering out noise and focusing on robust confluences. The Challenge of Gold M1 Scalping:
Scalping, especially on an asset like Gold on the M1, demands speed, precision, and an exceptional ability to identify momentary reversals and

Simple Vwap with the daily, weekly and monthly
VWAP is the abbreviation for volume-weighted average price , which is a technical analysis tool that shows the ratio of an asset's price to its total trade volume. It provides traders and investors with a measure of the average price at which a stock is traded over a given period of time.
How it's used Identify entry and exit points: Traders can use VWAP to determine when to buy or sell an asset. Understand price trends : Traders can use V
FREE

Original supertrend indicator in Tradingview platform. Indicator type: Price Action indicator Introduction: The Supertrend Indicator - Enhancing Your Trend Analysis. If you haven't yet found a Supertrend indicator with good graphics on the MQL5 platform, this is the indicator for you. Overview: The Supertrend Indicator is a powerful tool designed to provide traders with valuable insights into the current and historical trends of financial markets. It serves as a valuable addition to any t
FREE

Norion Smart Levels is a professional support and resistance indicator developed to help traders identify the most relevant price levels where the market historically reacts. The indicator analyzes price structure and market behavior to automatically plot key support and resistance levels, eliminating subjectivity and reducing chart noise. The result is a clean, objective, and easy-to-read visualization that adapts to different market conditions. Key Features: Automatic detection of support and
FREE

CandleForce Pro: The Ultimate Decision-Support Dashboard for Modern Traders Introduction: Overcoming the Chaos of Modern Markets
In today's hyper-connected financial markets, the modern trader faces a paradox of choice. We are inundated with an endless stream of data, indicators, news, and strategies, all promising to unlock the secrets of profitable trading. This constant influx often leads to "analysis paralysis"—a state of cognitive overload where conflicting signals create confusion, hesit
FREE

MomoPoints est un indicateur qui montre les points d'entrée/ajout longs et courts sur le graphique.
Sur la base de l'élan et de la force de la tendance, les MomoPoints affichent des entrées/ajouts avec un bon rapport risque/récompense.
Paramètres
----------------------------------
Conception : Les couleurs, la taille et les ailes (symbole graphique) du signal peuvent être ajustées.
Paramètres du signal : la période de moyenne mobile, la force de la tendance, la distance entre la moyenne mobi
FREE

The Market Momentum indicator is based on the Volume Zone Oscillator (VZO), presented by Waleed Aly Khalil in the 2009 edition of the International Federation of Technical Analysts journal, and presents a fresh view of this market valuable data that is oftenly misunderstood and neglected: VOLUME. With this new approach of "seeing" Volume data, traders can infer more properly market behavior and increase their odds in a winning trade.
"The VZO is a leading volume oscillator; its basic usefulness
FREE
Si tu trades sur les marchés financiers, tu sais sûrement à quel point le spread est important – cette différence entre le prix d'achat (ask) et de vente (bid) peut sérieusement affecter ton profit. Spread Size est un indicateur simple mais très utile qui affiche le spread actuel directement sur le graphique. Plus besoin de surveiller constamment les données manuellement – tout est juste sous tes yeux ! À quoi ça sert ?
Le spread n'est pas qu'un chiffre. C'est ton argent réel. Un spread bas
FREE
MetaTrader Market - les robots de trading et les indicateurs techniques pour les traders sont disponibles directement dans votre terminal de trading.
Le système de paiement MQL5.community est disponible pour tous les utilisateurs enregistrés du site MQL5.com pour les transactions sur les Services MetaTrader. Vous pouvez déposer et retirer de l'argent en utilisant WebMoney, PayPal ou une carte bancaire.
Vous manquez des opportunités de trading :
- Applications de trading gratuites
- Plus de 8 000 signaux à copier
- Actualités économiques pour explorer les marchés financiers
Inscription
Se connecter
Si vous n'avez pas de compte, veuillez vous inscrire
Autorisez l'utilisation de cookies pour vous connecter au site Web MQL5.com.
Veuillez activer les paramètres nécessaires dans votre navigateur, sinon vous ne pourrez pas vous connecter.