MetaTrader 5용 기술 지표 - 19
The MTF (Multi-Timeframe) Candles indicator is a powerful tool that allows you to display candles from a higher timeframe (e.g., H1, H4, D1) directly on a lower timeframe chart (e.g., M5, M15, M30). The Problem It Solves: Instead of constantly switching back and forth between charts to analyze the main trend and detailed price action, this indicator merges both perspectives into one. You can instantly see the "big picture" while staying focused on trading signals on your current timeframe. Core
FREE

Capital Vault System is a professional technical analysis suite for MetaTrader 5 engineered to identify market structure and adaptively filter market volatility. Unlike static indicators, this system integrates three mathematical models— Maximum Entropy Spectral Analysis (MESA) , Fractal Dimension , and Harmonic Geometry —to distinguish between directional trends and non-linear consolidation ranges. It includes an embedded Risk Management Dashboard designed to assist traders in real-time positio

Pivot Point Supertrend (corresponds to Pivot Point Super Trend indicator from Trading View) Pivot Point Period: Pivot point defined as highest high and highest low... input 2 = defining highest high and highest low with 2 bars on each side which are lower (for highest high) and are higher (for lowest low calculation) ATR Length : the ATR calculation is based on 10 periods ATR Factor: ATR multiplied by 3
FREE

ADX 지표는 추세와 강도를 결정하는 데 사용됩니다. 가격의 방향은 +DI와 -DI 값으로 표시되며, ADX 값은 추세의 강도를 나타냅니다. +DI가 -DI보다 높으면 시장은 상승 추세에 있고, 반대로이면 하락 추세에 있습니다. ADX가 20 미만이면 명확한 방향이 없습니다. 지표가 이 수준을 돌파하자마자 중간 강도의 추세가 시작됩니다. 40보다 큰 값은 강한 추세(하락 추세 또는 상승 추세)를 나타냅니다.
평균 방향 이동 지수(ADX) 지표의 다중 통화 및 다중 시간대 수정. 매개변수에서 원하는 통화와 기간을 지정할 수 있습니다. 또한 지표는 추세 강도 수준이 교차할 때, 그리고 +DI 및 -DI 선이 교차할 때 알림을 보낼 수 있습니다. 마침표가 있는 셀을 클릭하면 해당 기호와 마침표가 열립니다. MTF 스캐너입니다.
통화 강도 측정기(CSM)와 마찬가지로 대시보드는 지정된 통화가 포함된 쌍 또는 해당 통화가 기본 통화로 포함된 쌍을 자동으로 선택할 수 있습니다. 표시기는

TRUE TIMER - Candle Countdown Real-time countdown timer (MM:SS) showing seconds until candle close on any timeframe. Features hint messages that alert you on new candles. Key Features: Precise server-time countdown. Auto color detection (light/dark backgrounds). Smart "New Candle" & timing alerts on huge movements. Works on all timeframes M1 → Monthly. Perfect for: Scalpers & precise entry timing. Please share your experience via Reviews :)
FREE

Time Range Separator is a useful tool to display a separator period on your platform.
You could go in the properties of the indicator, select the desired range and that's ALL. We believe it is a useful and necessary that we wish to share with you for free all our followers. Input Values: TimeFrame = Period Separator Separator_Color = Vertical Color Line Separator_Style = Vertical Color Style Separator_Width = Vertical Line Width Good trading to all and see you soon. Same indicator for MT4 here
FREE

The Volume Weighted Moving Average (VWMA) is calculated based on Prices and their related Volumes giving importance to those candles with more Volume. During periods of almost equal volume distributed along the observed period (commonly, in low volume periods) the VWMA will be graphically similar to a Simple Moving Average. Used along other moving averages a VWMA could be used as an alert, filter or whatever your imagination could think of...
HOW TO "READ" THIS INDICATOR As any Moving Average.
FREE

SUPERTREND INDICATOR MT5 Developer: gedeegi General Description GEN SmartTrend Signal is a comprehensive technical indicator for MetaTrader 5 (MT5), focused on trend identification and automated risk management. It utilizes a refined SuperTrend -based algorithm powered by the Average True Range (ATR) to determine the primary trend direction. What sets this indicator apart is its integrated trade management features displayed directly on the chart, including visual placement of Stop Loss (SL)
FREE
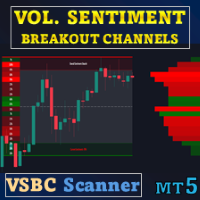
스페셜 오퍼 : ALL TOOLS , 개당 $35 입니다. 새로운 도구 는 첫 일주일 또는 처음 3회 구매 까지 $30 에 제공됩니다! Trading Tools Channel on MQL5 : MQL5 채널에 가입하고 제 최신 소식을 받아 보세요 Volume Sentiment Breakout Channels 는 동적 가격 채널 안에서 거래량 심리에 기반한 돌파 구역을 시각화해 주는 지표입니다. 단순히 가격 돌파를 기술적 이벤트로만 보는 것이 아니라, 매수/매도 거래량이 조정(콘솔리데이션) 구간에서 어떻게 분포하는지에 초점을 맞추어, 가격이 채널을 벗어날 때마다 매수자와 매도자 간의 통제권 이동을 표현합니다. 각 압축 구간 내부에서 이 지표는 영향력이 큰 영역을 식별하고, 매수측과 매도측의 우위 정도를 측정하며, 주문 흐름의 강도를 차트 상에서 실시간으로 지속적으로 업데이트합니다. 거래량 심리로 “가중치”가 부여된 채널을 가격이 상향 또는 하향 돌파할 때,

GEN Sessions Volume Profile Developer: Gede Egi GEN Sessions Volume Profile is an MT5 indicator designed to display the volume distribution for each trading session (daily) in the form of a Volume Profile . With this tool, traders can easily see at which price levels the highest trading activity has occurred during a session, making it easier to identify key market areas. The indicator automatically plots Session Boxes, Point of Control (POC), Value Area High (VAH), Value Area Low (VAL), and Va
FREE

BEHOLD!!!
One of the best Breakout Indicator of all time is here. Multi Breakout Pattern looks at the preceding candles and timeframes to help you recognize the breakouts in real time.
The In-built function of supply and demand can help you evaluate your take profits and Stop losses
SEE THE SCREENSHOTS TO WITNESS SOME OF THE BEST BREAKOUTS
INPUTS
MaxBarsback: The max bars to look back
Slow length 1: Period lookback
Slow length 2: Period lookback
Slow length 3: Period lookback
Slow
FREE
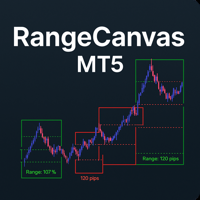
Daily Range Boxes : The indicator draws rectangular boxes around each day's high and low prices, creating a clear visual boundary for the daily trading range. Color-Coded Logic : Green boxes when the current price (or close) is above the daily open Red boxes when the current price is below the daily open Percentage Level Lines : Inside each box, it draws three horizontal lines at: 25% of the daily range 50% of the daily range (midpoint) 75% of the daily range Range Information : Each box displa
FREE
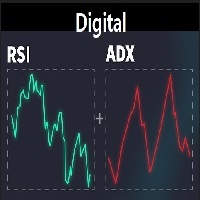
A lightweight digital indicator that combines the most important momentum tools directly on the chart. It displays real-time values of RSI, ADX, +DI, −DI, and DI Spread in a clean and compact format, without drawing any lines or graphical objects on the chart. Designed to provide fast insight into trend strength and the balance between buyers and sellers, without the need to open additional indicator windows. Fully customizable—font, size, and screen position can be adjusted easily.
FREE

Infinity Predictor MA
Infinity Predictor MA is a next‑generation forecasting indicator that transforms the traditional Moving Average into a powerful predictive tool. Unlike standard MAs that only smooth past data, this indicator projects the moving average line up to 40 bars into the future, giving traders a unique perspective on potential market direction.
The engine behind Infinity Predictor MA combines multiple advanced regression models to capture both smooth trends and sudden market shi
FREE

Structure Blocks: a structured way to analyze market structure
This indicator is for you if you are a price action or smart money concept trader. It identifies market trends' ultimate highs and lows and intermediaries' swing lows and highs. It adjusts based on candles' body where most of the volume is, disregarding wicks. Need help or have questions? I am Lio , don't hesitate to reach out! I am always available to respond, help, and improve. How it works:
Each block consists of a move with
FREE

FVG Smart Zones – 무료 버전 MetaTrader 5 (MT5)용 공정 가치 갭(FVG) 탐지 지표 단순한 지표가 아닌 실제 트레이딩 도구 를 찾고 계신가요?
FVG Smart Zones – 무료 버전 은 **공정 가치 갭(FVG)**을 자동으로 감지하고 차트에 고확률 거래 구역 을 표시하여 전문적인 시장 통찰력을 제공합니다. 다음을 따르는 트레이더를 위해 설계됨:
스마트 머니 컨셉(SMC)
ICT 트레이딩 컨셉
가격 행동(Price Action)
수요와 공급 분석
기관 트레이딩 전략 이 지표는 가격이 반응할 가능성이 높은 구역 에 집중할 수 있도록 도와줍니다. 주요 기능: 스마트 존 감지
상승 및 하락 FVG 자동 감지
깔끔하고 전문적인 시각적 구역
약하거나 관련 없는 갭 제거를 위한 지능형 필터링 고급 확인 기능
상위 시간대(HTF) 컨플루언스 확인
가격이 채워지면 유효하지 않은 구역 자동 제거
활성 구역과 채워
FREE

Candle Time Countdown is a professional MT5 indicator developed to displays in real-time the countdown showing the remaining time until candle close across multiple timeframes simultaneously. The indicator features intelligent color-coded visual feedback where each timeframe's text dynamically changes to bright lime green for bullish candles and red for bearish candles, with each timeframe updating independently based on its own candle direction.
Key Features Multi-Timeframe Support: M1, M5, M1
FREE
The Round Level Indicator automatically draws psychologically significant price levels directly on your chart.
These round numbers often act as key support and resistance zones across all markets and timeframes.
Round Levels are used in my automated EA: Opal This indicator works best when combined with other tools and strategies, e.g.: Price Action Strategies
Round levels often align with key support/resistance. Use it with candlestick patterns (like pin bars or engulfing bars) to confirm high
FREE

https://www.mql5.com/en/users/gedeegi/seller GEN (Trend Line) automatically detects swing highs and lows, plots dynamic upper & lower trendlines with adaptive slope (ATR, Standard Deviation, or Linear Regression approximation), and marks breakout points visually when the price crosses the trend boundaries. Perfect for price action, breakout, and trend confirmation strategies across multiple timeframes.
FREE

ICT Unicorn Hunter – Multi-Timeframe Smart Setup Detector IMPORTANT: This is a Multi-Timeframe Scanner, looking for 'Unicorn' setups. A Unicorn in this definition is a liquidity sweep, market structure shift and creation of a Fair Value Gap overlapping with the last opposite-close candle before the liquidity sweep (breaker). This scanner does NOT provide visualisation of the Unicorn on the chart.
For visualisation, use the Unicorn Tracker indicator, which is designed to work with the Unicorn
FREE
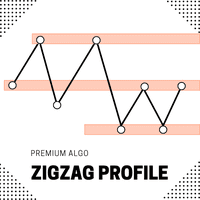
Introducing the ZigZag Profile — a powerful tool designed to identify high-probability pivot zones where price action frequently reverses. This indicator analyzes historical price data to pinpoint key areas where price has pivoted multiple times, providing traders with actionable insights into potential support and resistance levels. The ZigZal Profile indicator continuously scans for zones where price has reversed direction the most, highlighting these critical areas on your chart. By focusing
FREE

Mouse You can draw fibonaccis moving the mouse over the zigzag indicator Pin them You can click on fibonacci with this option and it will no longer be deleted unless you click on it again :) Precision The tuned fibonacci gets the precise point in lower timeframes Enjoy it You can ask me for add more features, so please comment and leave your ranting for me to be happy, thank you :)
FREE
차트에 그리기 기능을 제공하는 "Draw On Chart Indicator"를 소개합니다: 차트에서 창의력을 발휘하세요!
분석을 주석으로 추가하거나 아이디어를 효과적으로 전달하기 위해 트레이딩 차트에 주석을 달기 위해 애를 쓰는 데 지쳤나요? 더 이상 찾아볼 필요가 없습니다! 저희는 자랑스럽게 "Draw On Chart Indicator"를 선보입니다. 이 혁신적인 도구를 사용하면 몇 번의 클릭 또는 펜 스트로크로 차트에 직접 그리고 주석을 추가할 수 있습니다.
저희 혁신적인 "Draw On Chart Indicator"는 차트 분석 경험을 향상시키고 창의력을 발휘할 수 있도록 설계되었습니다. 이 강력한 도구를 사용하면 손쉽게 생각을 표현하고 핵심 레벨을 표시하며 패턴을 강조하고 트레이딩 전략을 시각적으로 표현할 수 있습니다. 숙련된 트레이더, 기술적 분석가 또는 트레이딩의 매혹적인 세계를 탐험하는 초보자라 할지라도, "Draw On Chart Indicator"는 차트와 상호
FREE

AlgoMatrix EMA Ribbon Trend Pro (MT5)
Professional EMA Ribbon Trend Indicator for MetaTrader 5
Overview – Built for Traders Who Respect Trends
AlgoMatrix EMA Ribbon Trend Pro is a professional-grade EMA ribbon trend indicator for MetaTrader 5, designed for traders who prefer clean trend confirmation, disciplined entries, and non-repainting signals.
This indicator focuses on one simple goal: helping you trade only when the market is actually trending, while avoiding sideways and cho

TRD Trend Range Detector MT5 TRD Trend Range Detector MT5 is a technical analysis tool designed to identify market regimes. The indicator distinguishes between trending and consolidating (ranging) markets in real-time using a multi-factor algorithm. Market Regime Identification Many trading strategies are dependent on specific market conditions. TRD Trend Range Detector MT5 serves as a filter to identify when a trend is established or when the market is entering a consolidation phase. Visual Si
FREE

Product Name: Harmonic Confluence Indicator (Basic Edition) !!!—-Leave a 5-star review and receive a free indicator version with trade levels (limited to the first 20 people only)——!!! Headline: Automated Harmonic Pattern Scanner with Supply & Demand Confluence. Description: Unlock the power of geometric market structure with the Harmonic Confluence Indicator (Basic Edition) . This powerful tool is designed to automatically scan your charts for high-probability reversal zones based on validated
FREE
Pip Value Calculator - Instant Risk Assessment on Your Chart This powerful and lightweight utility instantly calculates the precise monetary value for any pip movement, displaying it directly on your chart so you can assess risk and potential profit at a glance. At its core, the indicator's sophisticated calculation engine runs silently with every price tick, ensuring the information you see is always up-to-date. It automatically detects the instrument you are trading—whether it's a Forex pair,
FREE

Using the Stochastic Oscillator with a Moving Average is a simple but very efficient strategy to predict a trend reversal or continuation.
The indicator automatically merges both indicators into one. It also gives you visual and sound alerts.
It is ready to be used with our programmable EA, Sandbox, which you can find below: Our programmable EA: https://www.mql5.com/en/market/product/76714 Enjoy the indicator!
This is a free indicator, but it took hours to develop. If you want to pay me a coff
FREE

Basic Theme Builder: 차트 맞춤화를 간편하게 Basic Theme Builder 지표로 거래 경험을 혁신하세요. 이 다용도 도구는 MetaTrader 5 에서 차트의 외관을 간편하게 사용자 맞춤화할 수 있도록 설계된 직관적인 패널을 제공합니다. 다양한 테마와 색상 스킴을 간단히 전환하여 거래 환경의 시각적 매력과 기능성을 향상시킬 수 있습니다. Free MT4 version Basic Theme Builder 지표는 MetaTrader 5 차트를 손쉽게 개인화하려는 거래자에게 최적의 도구입니다. 간단한 패널 인터페이스와 다양한 테마 프리셋을 통해 거래 스타일이나 기분에 맞게 차트의 외관을 빠르게 조정할 수 있습니다. 클래식한 룩부터 현대적인 미학까지, Basic Theme Builder는 시각적 경험을 향상시키고 집중력을 높이는 데 도움이 되는 다양한 옵션을 제공합니다. 오늘 이 실용적이고 사용하기 쉬운 지표로 거래 환경을 최적화하세요. 주요 기능: 간편한 테마 관
FREE

RSI Advanced - Elevate Your Analysis & High-Potential Trade Signals Overview RSI Advanced is a powerful custom indicator for MetaTrader 5, designed to elevate your technical analysis and provide reliable trading signals. This indicator integrates a standard Relative Strength Index (RSI) with a sophisticated system of Moving Averages (MA) and Bollinger Bands (BB) applied directly to the RSI's data. Furthermore, it incorporates advanced divergence detection capabilities, empowering traders to iden
FREE
+++++++++++++++++++++++++++++++++++++++++++++++++++++++++++++++++++++++++++++++++++++++++++++++++ +++ Link to EURUSD Only Free Version --> https://www.mql5.com/en/market/product/156904?source=Unknown +++++++++++++++++++++++++++++++++++++++++++++++++++++++++++++++++++++++++++++++++++++++++++++++++ Hallo Trader, This is a traditional GANN & FIBONACCI strategy based on detection of an impulsive move in the opposite direction. This is called a Breakout. At the moment of Breakout, the indicator draw

The MACD 2 Line Indicator is a powerful, upgraded version of the classic Moving Average Convergence Divergence (MACD) indicator.
This tool is the embodiment of versatility and functionality, capable of delivering comprehensive market insights to both beginner and advanced traders. The MACD 2 Line Indicator for MQL4 offers a dynamic perspective of market momentum and direction, through clear, visually compelling charts and real-time analysis.
Metatrader4 Version | All Products | Contact
FREE

Smart Fibo Zones are powerful, auto-generated Fibonacci Retracements that are anchored to key market structure shifts . These zones serve as critical Supply and Demand levels, guiding you to identify potential price reactions and confirm market direction. Fibonacci calculations, widely used by professional traders, can be complex when it comes to identifying highs and lows. However, Smart Fibo Zones simplify this process by automatically highlighting order blocks and key zones, compl

모모포인트는 차트에 롱, 숏 진입/추가 포인트를 표시하는 지표입니다.
모멘텀과 추세 강도를 바탕으로 모모포인트는 위험 대비 보상 비율이 좋은 항목/추가를 보여줍니다.
설정
----------------------------------
디자인: 신호의 색상, 크기 및 날개(그래픽 기호)를 조정할 수 있습니다.
신호 설정: 이동 평균 기간, 추세 강도, 이동 평균에서 가격까지의 거리 및 RSI 기간을 설정할 수 있습니다.
자산에 대한 올바른 값을 설정하기 위해 신호 값을 설명으로 표시할 수 있습니다. 또한 지표는 모든 거래 쌍이나 자산에 적합할 수 있습니다.
좋은 항목을 표시하려면 모든 자산에 고유한 설정이 필요합니다. 특정 쌍에 대한 설정이 필요하고 스스로 찾을 수 없는 경우, 제가 도와드릴 수 있습니다.
알람: 푸시 알림 및 사운드 음성 알림을 활성화할 수 있습니다.
신호는 다시 칠할 필요 없이 실시간으로 발생합니다.
추가 정보나 기능에 대한 질문이나 요청이 있으
FREE

Are you tired of plotting Fibonacci retracements or extensions manually? This indicator displays Fibo retracements or extensions automatically, calculated from two different price points, without human intervention or manual object anchoring. [ Installation Guide | Update Guide | Troubleshooting | FAQ | All Products ] Easy to use Manual anchoring is not needed Perfect for price confluence studies The indicator evaluates if retracements or extensions are needed Once drawn, you can manually edit t
FREE

DESCRIPTION:
-----------
KS Dynamic Trendlines is an advanced indicator that automatically detects swing points
and draws intelligent trendlines that adapt to market conditions in real-time.
KEY FEATURES:
------------
Automatic swing high/low detection
Dynamic trendline generation connecting swing points
Real-time break detection - broken trendlines disappear automatically
Next strongest trendline appears when current one breaks
Multi-timeframe support - detect on H4, display on M15
Parallel t
FREE
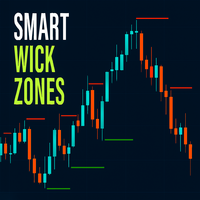
Smart Wick Zones indicator is a powerful tool designed to highlight hidden areas of price rejection and liquidity on your chart. By analyzing candle wicks (also called shadows or tails), the indicator automatically draws horizontal zones where strong buying or selling pressure has previously appeared. These wick zones often mark turning points in the market or areas where price reacts strongly, making them excellent references for support and resistance.
Instead of manually scanning candles for
FREE
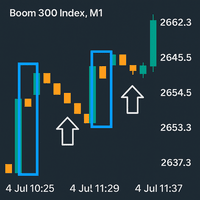
boom Spike Mitigation Zone Pro
A professional spike pattern indicator built for synthetic traders who scalp and swing Boom 500/300/1000/600/900with precision.
This indicator: Detects powerful 3-candle spike formations (Spike → Pullback → Spike) Automatically draws a clean box around the pattern Marks the entry price from the middle candle Extends a horizontal mitigation line to guide perfect sniper entries Automatically deletes & redraws the line once price touches it (mitiga
FREE

This indicator is especially for the binary trading. Time frame is 1 minutes and exp time 5 or 3 minutes only. You must be use martingale 3 step. So you must put lots size is 10 % at most. You should use Mt2 trading platform to connect with my indicator to get more signal without human working. This indicator wining rate is over 80% but you may get 100% of profit by using martingale 3 step. You should use MT2 Trading Platform to connect meta trader platform and binary platform . You can get mt2
FREE

[TH] คำบรรยายสินค้า: The Horse Pro Signal (WinWiFi Robot Series) The Horse Pro Signal คืออินดิเคเตอร์ระดับมืออาชีพรุ่นล่าสุดจากตระกูล WinWiFi Robot Series ออกแบบมาสำหรับแพลตฟอร์ม MetaTrader 5 (MT5) โดยเฉพาะ เพื่อช่วยเทรดเดอร์ในการวิเคราะห์พฤติกรรมราคา (Price Action) ทั้งในสภาวะตลาดที่มีเทรนด์ชัดเจนและช่วงตลาดไซด์เวย์ (Sideways) คุณสมบัติเด่น: การวิเคราะห์แท่งเทียนอัจฉริยะ: ระบบอ้างอิงการเคลื่อนที่ของราคาตามเทรนด์และสลับกับการกรองสัญญานในช่วงไซด์เวย์ เพื่อความแม่นยำสูงสุด การแสดงผลที่ชัดเจน: มาพ
FREE

If you trade on financial markets, you’ve probably realized how important the spread is—the difference between the buy (ask) and sell (bid) price can seriously impact your profit. Spread Size is a simple yet highly useful indicator that displays the current spread right on the chart. No more constantly monitoring data manually—everything is right in front of your eyes! Why is it needed?
The spread isn’t just a number. It’s your real money. A low spread means entering and exiting a trade will
FREE

Stop Margin Calls. Start Trading With a Clear SOP. Always getting margin calls again and again?
Still haven’t found an indicator or technique that delivers consistent daily performance ?
Tired of depositing funds and hoping you can finally withdraw? Don’t worry — I’m a real full-time trader . This is the same entry-box indicator I personally use, together with a step-by-step SOP so you can trade with rules, not emotions. ========================================== Introducing: EASY 30–100 PIPS D

MACD 2 Line MTF (Multi-Timeframe) Indicator for MetaTrader 5 This custom MetaTrader 5 indicator implements a classic MACD with two lines (MACD Line and Signal Line) and a color-coded histogram , enhanced with multi-timeframe capability . It allows traders to monitor MACD trends from higher or lower timeframes directly on the current chart. Key Features: MACD Line (Fast EMA minus Slow EMA) Signal Line (SMA of MACD Line) Histogram Up/Down : Displays positive values in green and negative values in
FREE

Magic Candles 는 현재 시장 단계(상승 추세, 하락 추세 또는 보합)를 식별할 수 있는 신제품입니다.
이 표시기는 시장의 현재 상태에 따라 다양한 색상으로 막대를 표시하고 경고를 통해 사용자에게 추세 변화에 대한 신호를 보냅니다.
Magic Candles 는 통화(암호화폐 포함) 및 바이너리 옵션 거래에 적합합니다.
장점 스캘핑 및 일중 거래에 적합합니다. 표시기는 다시 그리지(재계산) 않으며 신호는 "막대 닫기"에서만 생성됩니다. 독립형 도구로 사용하거나 다른 지표와 함께 사용할 수 있습니다. 새로운 지표 신호에 대해 이메일 및 모바일 장치로 알림 시스템. 간단한 표시기 설정, 최소 매개변수. 모든 금융 상품 및 시장에서 작동합니다.
제품 사용 방법 마지막 양초의 색상이 회색에서 빨간색으로 바뀌면 매도 주문을 개시합니다.
캔들 색상이 회색에서 녹색으로 바뀌면 매수 주문을 개시합니다.
회색 막대가 나타나면 플랫이 예상되는 대로 미결 주문을 마감합니다.
매개

KT Candlestick Patterns는 실시간으로 24가지 가장 신뢰할 수 있는 일본 캔들 패턴을 찾아 차트에 표시합니다. 일본 트레이더들은 18세기부터 이러한 패턴을 사용해 가격 방향을 예측해왔습니다. 모든 캔들 패턴이 동일한 신뢰도를 가지는 것은 아니지만, 지지/저항 같은 다른 기술적 분석과 결합하면 시장 상황을 명확하게 보여줍니다.
이 지표는 Steve Nison의 책 "Japanese Candlestick Charting Techniques"에 소개된 많은 패턴을 포함하고 있습니다. 책에서 다루지 않는 복잡한 패턴들도 감지할 수 있어 더욱 강력한 기능을 제공합니다.
기능
각 신호에서 고정된 핍 수익을 목표로 설정하면, 지표가 해당 목표에 대한 성공률을 실시간으로 계산합니다. 일본의 유명한 24가지 캔들 패턴을 높은 정확도로 식별합니다. 각 패턴의 성능을 분석하고 정확도를 실시간으로 보여주는 모듈이 내장되어 있습니다. 패턴 간 최소 바 수를 설정할 수 있어 차트를 깔

The Market Momentum indicator is based on the Volume Zone Oscillator (VZO), presented by Waleed Aly Khalil in the 2009 edition of the International Federation of Technical Analysts journal, and presents a fresh view of this market valuable data that is oftenly misunderstood and neglected: VOLUME. With this new approach of "seeing" Volume data, traders can infer more properly market behavior and increase their odds in a winning trade.
"The VZO is a leading volume oscillator; its basic usefulness
FREE

Moving Average Alerts는 4개의 완전히 사용자 설정이 가능한 이동평균선을 포함한 간단하고 효율적인 지표로, 트레이더가 자신의 전략에 맞게 기간, 방식 및 설정을 선택할 수 있습니다. 각 이동평균선에는 두 개의 독립적인 알림이 있으며, 각각 개별적으로 활성화 또는 비활성화할 수 있습니다: 가격이 이동평균선 위에서 마감될 때 알림
가격이 이동평균선 아래에서 마감될 때 알림 알림은 캔들이 마감될 때만 발생하여 가격 형성 중의 반복되거나 잘못된 신호를 방지합니다. 또한 푸시 알림 기능을 제공하여 MetaTrader 5 Mobile로 직접 알림을 받을 수 있으므로, 컴퓨터에서 떨어져 있어도 기회를 놓치지 않습니다. 이동평균선을 추세, 지지와 저항, 또는 진입 확인의 기준으로 사용하는 트레이더에게 이상적입니다.
FREE

Session Killzone Indicator
Indicator that helps you to identify the killzone times of both London and NewYork sessions which usually is the most times for high volatility and taking liquidity from the market. Killzone times are configurable through indicator parameters. The indicator adjusts the range of the killzones based on the daily trading range.
FREE

Lot Size Calculator - Smart Risk Management Tool
The Lot Size Calculator is a simple but powerful MetaTrader indicator that helps traders manage risk with precision. Instead of guessing your position size, this tool instantly calculates the exact lot size you need based on your account equity, chosen risk percentage, and reward ratio (1:1, 1:2, etc.).
Features:
Input your account equity and risk % per trade Supports both long (buy) and short (sell) trades Automatically adjusts for diffe
FREE

This is an optimized version of the Waddah Attar Explosion (WAE) indicator, designed to adapt to different asset classes.
Standard WAE indicators often use a fixed "DeadZone" calculation (usually set to 20). This fixed value may not be suitable for high-volatility assets like Bitcoin, Gold, or Indices (US30), potentially leading to incorrect filtering. This Auto-Adaptive version addresses that calculation issue. The indicator implements a dynamic formula based on ATR and SMMA to automatically ca
FREE

Multi-currency and multi-timeframe indicator MACD. The dashboard can display both the Traditional (true) MACD and the MACD which is built into MetaTrader. On the panel you can see the current state of the indicator — the direction of movement of the MACD lines, their intersection and a pop-up window with the indicator chart. In the parameters you can specify any desired pairs-symbols and timeframes. The scanner can also send notifications about lines crossing each other and about lines crossing

Market Imbalance Detector is a technical analysis indicator designed to highlight price imbalances, commonly known as Fair Value Gaps (FVGs). The indicator detects imbalance zones using a precise three-candle structure and displays them directly on the chart as visual zones. These areas represent price inefficiencies that may act as potential reaction or interest zones in future price movement. Features Detects bullish and bearish market imbalances Uses a true three-candle structure Works on
FREE

Solarwind No Repaint는 정규화된 가격 데이터에 피셔 변환을 적용하는 기술적 오실레이터로, 잠재적인 시장 전환점을 식별하는 히스토그램 기반 지표를 생성합니다. 이 지표는 가격 움직임을 가우시안 정규 분포로 변환하여 주기적 패턴과 모멘텀 변화를 트레이더에게 더 명확하게 보여줍니다. 작동 원리 이 지표는 여러 계산 단계를 통해 가격 데이터를 처리합니다: 고가-저가 분석 : 지정된 기간 동안의 최고가와 최저가를 계산 가격 정규화 : 각 봉의 고가-저가 범위의 중점을 구하고 기간 범위에 대해 정규화하여 -1과 +1 사이의 값으로 스케일링 피셔 변환 적용 : 수학적 피셔 변환 공식 0.5 * ln((1+x)/(1-x)) 를 스무딩과 함께 적용 추세 신호 처리 : 값 변화와 모멘텀 임계값을 기반으로 방향성 신호 생성 주요 특징 히스토그램 표시 : 별도의 지표 창에서 컬러 바로 렌더링 추세 기반 색상 : 강세 모멘텀은 녹색 바, 약세 모멘텀은 빨간색 바 노 리페인트 설계 : 현재
FREE

Swiss VWAPsimple Motivation Did not find free VWAP that works, the one that I found craseh. So I created a VWAP which calculates values only for the actual day. So computer resouces are not over stressed.
What is VWAP, how is it used? VWAP stands for Volume Weighed Average Price, it calculates the running sum of tick volume and the runnung sum of price times tickvolume. The division of these sums result in a weighed price (Sum P*V/Sum V). The calculation starts normally at midnight. The values
FREE

Pivot Point Super trend it can be used to catch price turning points and can show arrows for buying and selling. calculations are based on price peaks . you can control the price turning points by increasing the Pivot point period input on the indicator the ATR factor is for how far apart do you want the bands to be spread apart price break outs are also spotted in their early stages which will make trading much better
FREE

Harmonic Pattern Suite Pro Introduction Harmonic Pattern Suite Pro is an indicator designed to identify and display harmonic structures on the chart based on X-A-B-C-D sequences. Its purpose is to present pattern formations that meet geometric and proportional criteria, providing a clear visual representation directly on the chart. The indicator automates the detection process, removing the need for manual measurement of ratios and allowing the user to review the structural configuration withou
FREE
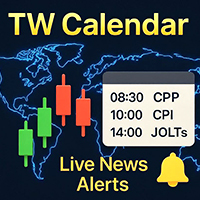
이 뉴스 도우미는 다양하고 쉬운 필터를 사용하여 터미널의 Market Watch를 기반으로 실시간 뉴스를 게시하는 주요 게시 소스에서 거래자가 필요로 하는 경제 이벤트를 가져오도록 설계되었습니다.
외환 거래자는 거시경제 지표를 사용하여 통화 구매 및 판매에 대한 정보에 근거한 결정을 내립니다. 예를 들어, 거래자가 미국 경제가 일본 경제보다 빠르게 성장할 것이라고 믿는다면 미국 달러를 매수하고 일본 엔화를 매도할 수 있습니다.
이 제품의 특징: 브로커의 시장 관찰을 기반으로 항목 표시 가치는 공개되자마자 이벤트 게시자의 주요 소스로부터 정보 수신 이벤트 값 공개 시 경고 간편한 필터링 가능성 가장 가까운 이벤트 표시 이벤트 값이 공개되기 X분 전에 알림 이벤트에 대한 유용한 설명 이벤트의 현재 가치와 예측 및 중요성을 보여줍니다. 쉽게 작업할 수 있는 그래픽 사용자 인터페이스 빛과 어둠 테마 패널 최소화 및 이동 기능 쉬운 설치 이 기본 도구를 전문 신호 지표와 함께 사용하여
FREE

Overview
Supply & Demand (MTF) v1.00 is a MetaTrader 5 indicator that automatically identifies and draws key supply and demand zones from up to three timeframes on your current chart. Supply zones mark areas where selling pressure was strong; demand zones mark areas where buying pressure was strong. Features Multi-timeframe detection
Scan the current chart plus two higher timeframes for zones. Candle-strength filter
Require a configurable number of strong candles to confirm each zone. Adjust
FREE

BEHOLD!!!
One of the best Breakout Indicator of all time is here. Multi Breakout Pattern looks at the preceding candles and timeframes to help you recognize the breakouts in real time.
The In-built function of supply and demand can help you evaluate your take profits and Stop losses
SEE THE SCREENSHOTS TO WITNESS SOME OF THE BEST BREAKOUTS
INPUTS
MaxBarsback: The max bars to look back
Slow length 1: Period lookback
Slow length 2: Period lookback
Slow length 3: Period lookback
Slow leng
FREE

Gold Storm Signals - Professional XAU/USD Trading Indicator
Gold Storm Signals is a premium multi-confirmation indicator for Gold (XAU/USD) trading on MetaTrader 5. Get precise buy/sell signals with automatic stop loss and take profit levels displayed directly on your chart.
KEY FEATURES:
- Clear Buy & Sell Signal Arrows - Automatic ATR-Based Stop Loss Calculation - Dual TP Levels (TP1 & TP2) - Complete Alert System (Push, Email, Sound) - Works on All Timeframes (M1 to D1) - No Repainting -
FREE

Overview EMA Scalper is a technical indicator designed for the MetaTrader 5 platform. This tool helps traders identify potential trading signals based on the crossover between price and an Exponential Moving Average (EMA), combined with a dynamic price channel. The indicator is suitable for scalpers or day traders and works across various timeframes and financial instruments. How It Works The indicator's logic is based on two main components: EMA Crossover: The core signal is generated when the
FREE

Big Figure Levels – Key Psychological Price Zones for MT5 Big Figure Levels is a professional trading tool designed for MetaTrader 5 that automatically identifies and draws major psychological price levels, including quarter and half levels. These levels are known to act as powerful support and resistance zones due to their influence on both institutional and retail trader behavior. This indicator is perfect for any trading style—whether you're a scalper, day trader, or swing trader—and is compa
FREE

El **Heiken Ashi Smoothed** es una versión suavizada del indicador técnico Heiken Ashi, que se utiliza en el análisis de gráficos de velas para identificar tendencias del mercado y pronosticar movimientos de precios. Este indicador se basa en el promedio de datos de precios para formar un gráfico de velas que ayuda a los traders a filtrar el ruido del mercado.
**¿Para qué sirve?** Este indicador se utiliza para identificar cuándo los traders deben permanecer en una operación y cuándo está por
FREE
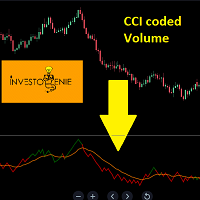
The Indicator is based on Commodity Channel Index (CCI) coded on Volume. The concept is to try and analyze the movement of Volume and Price in a certain direction
Concept:
If the Price of the indicator moves below the threshold price, it turns RED indicating the direction downwards is getting strong.
If the Price of the indicator moves above the threshold price, it turns GREEN indicating the direction upwards is getting strong.
The moving average acts as a great filter to decide entry/exit poi
FREE
This indicator provides a clear, at-a-glance dashboard for monitoring both the Relative Strength Index (RSI) and Stochastic Oscillator on any instrument or timeframe.
Whenever both RSI and Stochastic %K simultaneously exceed their respective overbought or oversold levels, the indicator displays an arrow signal in the indicator window.
These signals highlight strong momentum and can help traders quickly identify high-probability reversal zones. As with all my free tools, the arrow symbol can be e
FREE
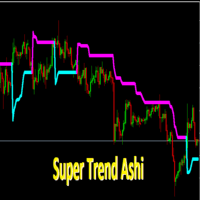
SuperTrendAshi Description SuperTrendAshi is an advanced and optimized version of the SuperTrend indicator that incorporates Heikin Ashi calculation to provide smoother and more reliable signals. This unique combination results in an indicator that reduces false signals and identifies trends with greater precision. Key Features Combines the strength of SuperTrend with Heikin Ashi smoothing More stable signals with less noise Intuitive color system (Aqua for uptrend, Magenta for downtrend) Custo
FREE

When working with several assets and having several open positions in different assets, it is a little complicated to visualize how much profit or loss is in each asset, so with this problem in mind I developed this indicator where it facilitates the visualization of open operations in each asset , where you will be able to open several different assets and you will be able to visualize the individual result of each asset and speed up your decision making in your trades.
FREE

Stochastic RSI makes a stochastic calculation on the RSI indicator. The Relative Strength Index (RSI) is a well known momentum oscillator that measures the speed and change of price movements, developed by J. Welles Wilder.
Features Find overbought and oversold situations. Sound alert when overbought/oversold level is reached. Get email and/or push notification alerts when a signal is detected. The indicator is non-repainting. Returns buffer values for %K and %D to be used as part of an EA. (se
FREE

Adaptive Moving Average (AMA) is a trend indicator using moving average and market noise filter. Indicator feature are blue and red points, showing the power of trend. Recommendations for trading: Auxiliary Indicator Detecting trend Detecting power of trend Detecting potential reversal points Main indicator Shows entry points for swing trading Serves as dynamic support and resistance Recommendations for use: Any instrument Any timeframe Input parameters: Period - AMA period Fast Period - fast MA
FREE

The TMA Centered Bands Indicator for MT5 draws bands on the chart and shows the overall price trend. It displays three bands - the lower and upper boundaries of the channel and the median. The bands are made up of moving averages, and each of them has an MA period. The name TMA comes from triangular moving averages, as the indicator draws triangular bands. The price will fluctuate between these ranges whenever the trend changes direction, thus creating entry and exit points. How to trade
FREE
MetaTrader 마켓 - 거래자를 위한 로봇 및 기술 지표는 거래 터미널에서 바로 사용할 수 있습니다.
The MQL5.community 결제 시스템은 MQL5.com 사이트의 모든 등록된 사용자가 MetaTrader 서비스에서 트랜잭션을 수행할 수 있습니다. 여러분께서는 WebMoney, 페이팔, 또는 은행 카드를 통해 자금을 예치하거나 인출하실 수 있습니다.
트레이딩 기회를 놓치고 있어요:
- 무료 트레이딩 앱
- 복사용 8,000 이상의 시그널
- 금융 시장 개척을 위한 경제 뉴스
등록
로그인
계정이 없으시면, 가입하십시오
MQL5.com 웹사이트에 로그인을 하기 위해 쿠키를 허용하십시오.
브라우저에서 필요한 설정을 활성화하시지 않으면, 로그인할 수 없습니다.