Technische Indikatoren für den MetaTrader 5 - 23

Dies ist ein Käufer und Verkäufer Aggression Indikator, der die Form jeder Kerze und Projekt diese Daten in einem Histogramm Form analysiert. Es gibt 4 Histogramme in einem. Auf der Vorderseite haben wir zwei: Obere - Käufer Kraft. Untere - Verkäufer Kraft. Im Hintergrund haben wir auch zwei Histogramme, beide mit derselben Farbe. Sie messen die kombinierte Stärke von Käufern und Verkäufern. Diese Histogramme können in den Eingabeparametern ausgeschaltet werden. Es ist auch möglich, das reale od
FREE

FusionAlert StochRSI Master ist ein Indikator, der für MT4/MT5-Plattformen verfügbar ist. Er ist eine Kombination aus RSI- und Stochastik-Indikator, die "Alarme" liefern, wenn sich der Markt in "überkauften und überverkauften" Regionen befindet, was in Kombination beider Indikatoren zu präziseren und genaueren Signalen führt, die als wunderbares Werkzeug in Form von "Kauf- oder Verkaufssignalen" verwendet werden können. Dieser Indikator verfügt über viele Anpassungsoptionen, die im Abschnitt "Pa
FREE

Market Sessionsync** ist ein hochmoderner Indikator für Handelssitzungen, der Ihre Handelserfahrung durch eine visuelle Aufschlüsselung des Tagesrhythmus des Marktes verbessert. In einem kompakten Fenster, das sich über Ihren Chart legt, bietet dieser Indikator ein sekundenschnelles Verständnis der aktuellen Handelssitzung: Grundlegende Einstellung: Stellen Sie die Differenz zwischen Ihrer Ortszeit und der Zeit Ihres Brokers ein, aktivieren oder deaktivieren Sie die Sommerzeit (DST), stellen S
FREE

SuperTrend TV-Style ist eine Nachbildung des klassischen SuperTrend-Indikators von TradingView, der jetzt auch für MetaTrader verfügbar ist. Er verwendet ATR-basierte Volatilität, um die Trendrichtung zu erkennen und dynamische Kauf-/Verkaufszonen auf dem Chart darzustellen. Grüne Linie: Aufwärtstrend Rote Linie: Abwärtstrend Pfeile: Kauf-/Verkaufssignale bei Trendwechseln Anpassbarer Quellpreis (HL2, HLC3, etc.) und ATR-Methode Einfach, schnell und vertraut - ideal für Händler, die von TradingV
FREE

Schaff Trend Cycle (STC) "MIT ALERTS".
Der Schaff-Trend-Zyklus-Indikator (STC) ist ein technisches Instrument, das im Handel und bei Investitionen eingesetzt wird, um Trends zu erkennen und Kauf- oder Verkaufssignale zu generieren. Was ist der Schaff-Trend-Zyklus? Der STC wurde von Doug Schaff entwickelt, um gleitende Durchschnitte durch die Einbeziehung der Zyklusanalyse zu verbessern. Er zielt darauf ab, Trends und Trendänderungen zu erkennen, indem er die Stärke und Geschwindigkeit von Prei
FREE

BBMA von RWBTradeLab ist ein sauberer Chart-Indikator für MetaTrader 5, der Bollinger Bänder , linear gewichtete gleitende Durchschnitte (LWMA ) auf Hoch/Tief und einen EMA auf Schluss kombiniert, um Händlern zu helfen, die Marktstruktur visuell zu lesen. Was es aufzeichnet Bollinger Bänder (Obere / Basis / Untere) LWMA auf Tief : 5 & 10 Perioden LWMA auf Hoch : 5 und 10 Perioden EMA auf Close : Standard 50 Perioden Hauptmerkmale Reiner Plot-Indikator (keine Alarme, keine Handelsausführung) Nich
FREE

Utazima Universal AI - Institutionelles Smart Money Dashboard (GRATIS) Produktübersicht Utazima Universal AI ist ein professioneller manueller Handelsindikator , der Händlern helfen soll, das institutionelle Preisverhalten mit Klarheit und Präzision zu erkennen. Der Indikator kombiniert Smart Money Concepts (SMC) , KI-basierte Marktfilterung und zeitbasierte Sitzungslogik (Silver Bullet) in einem einzigen, übersichtlichen , nicht übermalenden Dashboard für MetaTrader 5. Dieses Tool ist für
FREE

Hull Suite von Riz | MT5 Indikator Überblick: Hull Suite ist ein erstklassiger Trendfolge-Indikator, der drei leistungsstarke Hull Moving Average-Varianten (HMA, EHMA, THMA) in einem vielseitigen Tool kombiniert. Dieser Indikator wurde für Händler entwickelt, die Klarheit und Präzision verlangen. Er hilft dabei, die Trendrichtung mit minimaler Verzögerung zu erkennen und filtert gleichzeitig das Marktrauschen heraus. Hauptmerkmale: Drei Hüllkurven-Varianten - Wechseln Sie zwischen HMA (klassisch
FREE
Basierend auf dem Extreme Trend Indicator von Trading View, konvertiert für MT5. Die Nutzung des Indikators ist kostenlos, aber wenn Sie den Quellcode möchten, können Sie diesen erwerben, indem Sie mir eine Nachricht schicken.
Extreme Trend ist ein Indikator, der erkennt, wenn sich ein neuer Trend bildet und ein Handelssignal erzeugt. Dieser Indikator kann für viele Märkte verwendet werden, Forex, Gold usw. Wenn Sie Fragen haben oder einen EA mit diesem Indikator erstellen möchten, können Sie mi
FREE

Angebot und Nachfrage im Handel beschreiben, wie Käufer (Nachfrage) und Verkäufer (Angebot) die Preise von Vermögenswerten festlegen, wobei eine hohe Nachfrage/ein geringes Angebot die Preise erhöhen (Premium) und eine geringe Nachfrage/ein hohes Angebot sie senken (Discount); Händler identifizieren diese Ungleichgewichte als "Zonen" auf Charts (z. B. Rally-Base-Rally für die Nachfrage, Drop-Base-Drop für das Angebot), um potenzielle Einstiegs-/Ausstiegspunkte zu finden, mit dem Ziel, in Disc
FREE

Der „HiperCube USD INDEX (DXY /USDX) “ ist ein Finanzbenchmark, der die Performance einer bestimmten Gruppe von Vermögenswerten wie Aktien, Anleihen oder Rohstoffen mit in US-Dollar denominierten Werten darstellt. Diese Indizes helfen Anlegern, die Performance bestimmter Sektoren oder Märkte im Laufe der Zeit zu verfolgen und zu vergleichen. Da der Index in USD ausgedrückt wird, bietet er ein konsistentes Maß für die Bewertung von Investitionen, unabhängig von der Landeswährung oder dem geograf
FREE
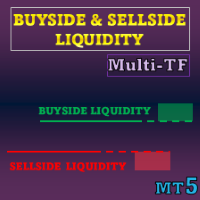
Sonderangebot : ALLE TOOLS , nur $35 pro Stück! Neue Tools kosten $30 in der ersten Woche oder für die ersten 3 Käufe ! Trading-Tools-Kanal auf MQL5 : Tritt meinem MQL5-Kanal bei, um die neuesten Neuigkeiten zu erhalten Dieser Indikator visualisiert Liquiditätsniveaus und Liquiditätszonen auf der Grundlage von ICT-Konzepten sowie Liquidity Voids, um einseitige Preisverschiebungen hervorzuheben. Der Fokus liegt auf Stellen, an denen Stop- oder Pending-Orders dazu neigen,

If you love this indicator, please leave a positive rating and comment, it will be a source of motivation to help me create more products <3 Was ist der Schaff-Trend-Zyklus-Indikator? Der Schaff Trend Cycle (STC) ist ein Indikator für die technische Analyse, der beim Handel und bei Investitionen eingesetzt wird, um Trends zu erkennen und Handelssignale zu generieren. Der STC wurde entwickelt, um Trends und Trendumkehrungen zu erkennen, indem er die Stärke des Trends und die Geschwindigkeit der
FREE

Fibomathe-Indikator: Unterstützungs- und Widerstandswerkzeug für MT5 Der Fibomathe-Indikator ist ein technisches Analysewerkzeug für MetaTrader 5 (MT5), das Händlern hilft, Unterstützungs- und Widerstandsniveaus, Take-Profit-Zonen und zusätzliche Preisprojektionsbereiche zu identifizieren. Er eignet sich für Händler, die strukturierte Ansätze zur Analyse von Kursbewegungen und zum Management von Trades verwenden. Hauptmerkmale Unterstützungs- und Widerstandsniveaus:
Ermöglicht es dem Benutzer,
FREE

Erschließen Sie das volle Potenzial Ihres Pro Thunder V9 Indikators mit unserem revolutionären neuen Plugin - Auto Trend Lines! Sind Sie auf der Suche nach einem Wettbewerbsvorteil auf dem heutigen dynamischen Markt? Suchen Sie nicht weiter. Mit Auto Trend Lines können Sie die Kraft der präzisen Markttrendanalyse nutzen, um fundierte Handelsentscheidungen zu treffen. Dieses innovative Plugin lässt sich nahtlos in Ihren Pro Thunder V9-Indikator integrieren und liefert Ihnen Trenddaten in Echtzeit
FREE
Volumized OrderBlocks MTF - Multi-Timeframe Volumetric Order Block Indicator
ÜBERBLICK
Volumized OrderBlocks MTF ist ein fortschrittlicher Multi-Timeframe-Orderblock-Indikator, der automatisch Orderblöcke aus bis zu 3 verschiedenen Zeitrahmen in einem einzigen Chart erkennt, anzeigt und zusammenführt. Dieser Indikator basiert auf der in
FREE
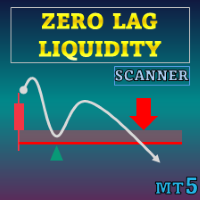
Sonderangebot : ALL TOOLS , nur $35 pro Stück! Neue Tools kosten $30 in der ersten Woche oder für die ersten 3 Käufe ! Trading-Tools-Kanal auf MQL5 : Tritt meinem MQL5-Kanal bei, um meine neuesten Updates zu erhalten Zero Lag Liquidity zeichnet Liquiditätszonen anhand von Docht-Profilen niedrigerer Zeitrahmen und hochvolumigen Dochten. Für jede anomale Kerze erstellt der Indikator ein Volumenhistogramm innerhalb des Dochts, findet einen lokalen Point of Control (POC) und stellt die

Koala Trend Line auf Version 1.2 aktualisiert
Letzte Upgrade-Verbesserung: Neuer Parameter hinzugefügt, mit dem Benutzer die Trendlinie mit dem 2. oder 3. oder X. höchsten oder niedrigsten Punkt verbinden können.
Meine Anfrage :
** Sehr geehrte Kunden, bitte veröffentlichen Sie Ihre Bewertung auf Koala Trend Line und lassen Sie mich durch Ihre Rückmeldungen verbessern.
WARUM IST KOALA TREND LINE KOSTENLOSE ANZEIGE?
Ich glaube, dass der freie Indikator ein qualifiziertes Werkzeug sein muss.
FREE
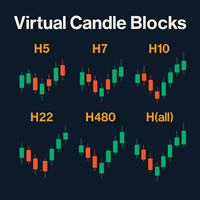
Virtual Candle Blocks – Visualisiere den Markt ohne Grenzen Virtual Candle Blocks ist ein fortschrittlicher Indikator für MetaTrader 5, mit dem Sie Kerzen jeder benutzerdefinierten Zeitspanne erstellen und visualisieren können, auch jene, die nicht nativ in der Plattform existieren. Haupteigenschaften: Benutzerdefinierte Zeitspannen: Gruppieren Sie die Basiskerzen in Blöcken der gewünschten Dauer (z. B. 5h, 14h, 28h, 72h usw.), um eine neue virtuelle Kerze zu erstellen. Dies ermöglicht Ihnen den
FREE

Die große Zahl ist ein entscheidender Aspekt des Devisenhandels und dient als Bezugspunkt für die Handelsausführung, das Risikomanagement und die technische Analyse. Wenn Forex-Händler die Bedeutung der Big Figure verstehen und sie in ihre Handelsstrategien einbeziehen, können sie ihren Entscheidungsprozess verbessern und die Wahrscheinlichkeit erfolgreicher Geschäfte erhöhen. Warum ist die Big Figure wichtig? Die große Zahl ist aus mehreren Gründen wichtig: Vereinfachung: Händler beziehen sich
FREE
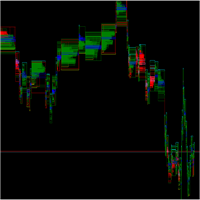
SpreadFlow ist ein Indikator für MetaTrader, der ein Diagramm erstellt, das vollständig auf dem Verhalten des Handelsflusses basiert und nicht nur auf Zeit- oder Volumenkerzen.
Er organisiert die Informationen von jedem Tick in vier Hauptdimensionen: Spread - überwacht die Differenz zwischen BID und ASK im Zeitverlauf und zeigt Momente der Verengung und Ausweitung des Spreads an, die mit größerer oder geringerer Liquidität einhergehen. Trades at the same price - identifiziert, wenn aufeinanderfo
FREE
Kostenlos bis 1. Januar 2026
VWAR 2.2 (Volume Weighted Average Roadmap) ist ein fortschrittlicher MT5-Indikator für institutionelle Anleger, der Ihnen die leistungsfähigste Multi-Zeitrahmen-VWAP-Analyse (Volume Weighted Average Price) sowie gefilterte Handelssignale mit robusten Trend- und Momentum-Bestätigungen bietet. Hauptmerkmale: Multi-Timeframe VWAP-Linien:
Tägliche, wöchentliche und monatliche VWAP-Linien für einen sofortigen Einblick in die Marktstruktur. Dynamische Kauf-/Verkaufssign
FREE

Sind Sie es leid, von Spikes und Peitschen gejagt zu werden?
Werden Sie nicht zum Opfer der erratischen Bewegungen des Marktes. Tun Sie etwas dagegen!
Treffen Sie sofort klügere Entscheidungen mit der präzisen Balance aus Filtern und genauen Statistiken von Impulse Pro.
Timing ist alles im Handel
Um mehr zu erfahren, besuchen Sie bitte www.mql5.com/en/blogs/post/718212 Antizipieren Sie die nächste große Bewegung, bevor sie sich entfaltet, in 3 einfachen Schritten!
Vorteile, die Sie erhalte

Zenith Session Flux ist ein professioneller technischer Indikator für MetaTrader 5, der die als ICT Killzones bekannten institutionellen Handelsfenster identifiziert und visualisiert. Der Indikator automatisiert den Prozess der Zeitanpassung, indem er die Serverzeit Ihres Brokers mit der New Yorker Ortszeit synchronisiert. So wird sichergestellt, dass Session Boxes und Preis-Pivots unabhängig von der Zeitzone Ihres Brokers genau zu den institutionellen Zeitpunkten erscheinen. Merkmale des Indika
FREE

Der Candle Countdown Timer für MetaTrader 4 (auch für MT5 verfügbar) ist ein wichtiger Indikator, der Ihnen hilft, Ihre Handelszeit effektiv zu verwalten. Er hält Sie über die Eröffnungs- und Schlusszeiten des Marktes auf dem Laufenden, indem er die verbleibende Zeit anzeigt, bevor die aktuelle Kerze geschlossen wird und eine neue entsteht. Dieses leistungsstarke Tool ermöglicht es Ihnen, fundierte Handelsentscheidungen zu treffen. Hauptmerkmale: Asien Bereich: Mit einer Option zur Erweiterung
FREE

Dies ist ein einfacher Orderblock-Alarm-Indikator. Er alarmiert Sie, sobald er einen bullischen oder bearischen OB entdeckt. Was Sie mit dem Alarm machen, bleibt Ihnen überlassen. Testen Sie den Indikator vor der Verwendung auf einer Demo. (Ich werde an einer Kombination arbeiten, d.h. dieser und ein EA arbeiten nebeneinander, voraussichtlich) Bullish OB hat eine hellblaue Farbe und bearish hat eine hellrote Farbe (Rechteck-Box auf dem Chart gezeichnet). Bitte handeln Sie weise und vergessen Sie
FREE

Hervorragende Tracking-Leistung und minimales Rauschen! Dieser Trenderkennungsindikator vermeidet "Whipsaws" und unsichere Marktgeräusche und ist außerdem agil genug, um auf Trendänderungen zu reagieren.
Er wurde auch entwickelt, um sich an dynamische Märkte anzupassen.
Funktioniert hauptsächlich als Filter, um Ihnen zu helfen, in Richtung des Trends zu handeln .
Merkmale.
Einfach und leicht zu bedienen. Geringe Belastung und leicht auszuprobieren Hervorragende Tracking-Performance und glatte L
FREE
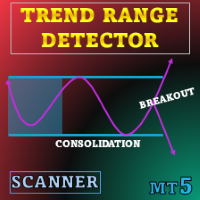
Sonderangebot : ALL TOOLS , nur $35 pro Stück! Dieses Tool ist 3 Tage KOSTENLOS ; verpassen Sie es nicht! Neue Tools kosten $30 während der ersten Woche oder für die ersten 3 Käufe ! Trading Tools Channel on MQL5 : Treten Sie meinem MQL5-Kanal bei, um die neuesten Nachrichten zu erhalten Trend Range Detector wurde für Anwender entwickelt, die eine strukturierte, datenbasierte Sicht auf Preis-Konsolidierungen bevorzugen. Anstatt auf subjektives Chart-Lesen zu setzen, wendet er klar

Dieser Indikator identifiziert und hebt Marktineffizienzen, sogenannte Fair Value Gaps (FVG), auf Kurscharts hervor. Mithilfe eines benutzerdefinierten Algorithmus erkennt der Indikator diese Bereiche des Ungleichgewichts, in denen sich der Preis stark bewegt, was potenzielle Handelsmöglichkeiten schafft. Parameter des Indikators: Bullish FVG Farbe (clrBlue) : Farbe, mit der bullische Ineffizienzen hervorgehoben werden. Der Standardwert ist blau. Bearish FVG Farbe (clrRed) : Farbe zur Hervorhebu
FREE

Erklärungen zum Candle Time Indicator Der Candle Time Indicator für MetaTrader 5, zeigt Benutzern die Restzeit bis der neue Bar gezeichnet wird. Candle Time Indicator settings. TextColor: die Farbe des Textes; FontSize: die Größe des Textes; Installationsanweisungen Kopiere CandleTime.ex5 indicator in den Ordner MQL5 der Metatrader 5 Plattform. You can gain access to this folder by clicking the top menu options, that goes as follows: Datei> Dateiordner öffnen > MQL5 > Indicators(hier einfügen).
FREE
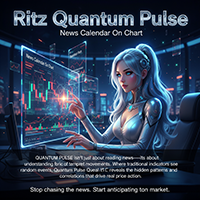
RITZ QUANTENPULS Wirtschaftsintelligenzsystem der nächsten Generation Ritz Quantum Pulse - das Wirtschaftsintelligenzsystem der nächsten Generation.
Erleben Sie Präzision auf Quantenebene im Nachrichtenhandel: Echtzeit-Ereigniserkennung, KI-gestützte Filterung und zeitliche Synchronisation.
Antizipieren Sie Volatilität, bevor sie eintritt - nicht danach.
Wo Marktintelligenz auf zeitliche Physik trifft. Ritz Quantum Pulse repräsentiert die Konvergenz von Quantenlogik , KI-gesteuerter Analyse und
FREE
Cumulative Delta Volume Indikator für MT5 (CDV Indikator für MT5) Volumenbasierter Marktstimmungs- und Trendstärke-Indikator Der Cumulative Delta Volume (CDV) -Indikator analysiert das Gleichgewicht zwischen Kauf- und Verkaufsvolumen, um die zugrunde liegende Marktstimmung zu ermitteln.
Indem er die Differenz zwischen Aufwärts- und Abwärtsvolumen kumuliert, zeigt er an, ob Käufer oder Verkäufer die Kontrolle haben und hilft Händlern, die Stärke oder Schwäche eines Trends zu bestätigen. Dieses To
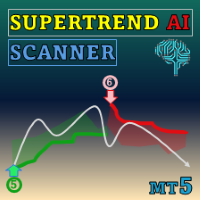
Special offer : ALL TOOLS , just $35 each! New tools will be $30 for the first week or the first 3 purchases ! Trading Tools Channel on MQL5 : Join my MQL5 channel to update the latest news from me Entdecken Sie die Kraft der KI mit dem SuperTrend AI Clustering MT5 mit Scanner , einem revolutionären Handelstool für MetaTrader 5 (MT5). Dieser Indikator definiert die Marktanalyse neu, indem er K-Means-Clusterbildung mit dem weit verbreiteten SuperTrend-Indikator kombiniert und Händle

Wir müssen oft die plötzliche Trendänderung kennen, die in der Grafik auftritt, und dies kann durch Indikatoren bestätigt werden.
Dieser Indikator zeigt die Momente der Trendumkehr und wie sich der Preis in welchem Trend verschiebt.
Benutzerdefinierter Hintergrund, keine Notwendigkeit, die Farben im Diagramm zu konfigurieren, ziehen Sie einfach den Indikator!
Anzeige mit Pfeilen.
- Blauer Pfeil: Aufwärtstrend.
- Rosa Pfeil: Abwärtstrend.
HINWEIS: Kostenlose Anzeige, es kann eine Weile d
FREE

Multi-Zeitrahmen-Kerzen
Multi-Time-Frame-Kerzen, auch bekannt als MTF-Kerzen, sind ein technischer Indikator, der es Ihnen ermöglicht, japanische Kerzen in einem anderen Zeitrahmen als dem Hauptzeitrahmen, in dem Sie handeln, zu betrachten. Dieser Ansatz bietet eine breitere Perspektive des Preisverhaltens, was besonders für Händler nützlich ist, die Preisaktionsstrategien anwenden. Nachfolgend werden die wichtigsten Konzepte im Zusammenhang mit diesem Indikator erläutert:
1. die Definition v
FREE

Beschreibung des Produkts Clean, Smart Sessions ist ein professioneller Indikator für Handelssitzungen, der Händlern eine klare, genaue und übersichtliche Darstellung der aktiven Marktsitzungen direkt auf dem Chart bietet. Der Indikator erkennt und zeigt die aktive Handelssitzung (Asien, London und New York) dynamisch und in Echtzeit an, indem er eine saubere Sitzungsbox zeichnet, die kontinuierlich aktualisiert wird, um die wahren Höchst- und Tiefstwerte der Sitzung wiederzugeben. Wenn sich Si
FREE

Modifikation des stochastischen Oszillators für mehrere Währungen und mehrere Zeitrahmen. Sie können in den Parametern beliebige Währungen und Zeitrahmen angeben. Das Panel zeigt die aktuellen Werte und Schnittpunkte der Linien – Signal und Main (Stochastik-Crossover) – an. Außerdem kann der Indikator Benachrichtigungen senden, wenn überkaufte und überverkaufte Niveaus überschritten werden. Durch Klicken auf eine Zelle mit einem Punkt werden dieses Symbol und dieser Punkt geöffnet. Dies ist der

Das 123-Muster ist eines der beliebtesten, leistungsstärksten und flexibelsten Diagrammmuster. Das Muster besteht aus drei Preispunkten: einem Boden, einem Gipfel oder Tal und einem Fibonacci-Retracement zwischen 38,2% und 71,8%. Ein Muster gilt als gültig, wenn der Preis jenseits des letzten Gipfels oder Tals abbricht, in dem der Indikator einen Pfeil zeichnet, einen Alarm auslöst und der Handel platziert werden kann. [ Installationsanleitung | Update-Anleitung | Fehlerbehebung | FAQ | Alle Pr

Hochgradig konfigurierbarer Macd-Indikator.
Merkmale: Hochgradig anpassbare Alarmfunktionen (bei Levels, Kreuzen, Richtungsänderungen per E-Mail, Push, Sound, Popup) Multi-Timeframe-Fähigkeit Farbanpassung (bei Pegeln, Kreuzen, Richtungsänderungen) Optionen für lineare Interpolation und Histogramm-Modus Funktioniert im Strategie-Tester im Multi-Timeframe-Modus (auch am Wochenende ohne Ticks) Einstellbare Levels Parameter:
Macd Timeframe: Sie können die unteren/höheren Zeitrahmen für Macd einst
FREE

Der Tageshöchst- und -tiefstkursindikator ist ein vielseitiges Instrument, das Unterstützungs- und Widerstandsniveaus mit der Marktdynamik in Echtzeit kombiniert. Durch die Einbeziehung früherer Tageshochs und -tiefs bietet er wertvolle Einblicke in die Marktpsychologie und identifiziert potenzielle Bereiche für Kursumkehrungen oder Ausbrüche. Dank seiner Anpassungsfähigkeit an sich verändernde Marktbedingungen und anpassbarer Optionen können Händler Trends voraus sein und fundierte Entscheidung
FREE

Fair Value Gap Sweep ist ein einzigartiger und leistungsfähiger Indikator, der Fair-Value-Lücken auf Ihrem Diagramm einzeichnet und Sie warnt, wenn eine Lücke vom Kurs übersprungen wurde. Eine Fair-Value-Lücke ist eine Kurslücke, die auftritt, wenn der Markt auf einem anderen Niveau eröffnet als der vorherige Schlusskurs, wodurch ein Ungleichgewicht zwischen Käufern und Verkäufern entsteht. Ein Gap Sweep liegt vor, wenn sich der Kurs zurückbewegt, um die Lücke zu schließen, was auf eine Änderun
FREE

Lesen Sie dies: Bitte geben Sie Kommentare und Bewertungen für zukünftige Verbesserungen ab. WaveTrendPro_Indi v1.05
WaveTrend Indikator mit verbesserter Histogrammdarstellung: WaveTrendPro_Indi v1.05
Indikator WaveTrend dengan tampilan histogram yang lebih jelas: Histogramm otomatis lebih tinggi ( bisa diatur dengan parameter HistScale ). Warna histogram berbeda untuk positif & negatif → tren naik lebih mudah dibaca. Tetap ringan & responsif di berbagai pair/timeframe. Cocok untuk scalper, s
FREE

Der TRIXs-Indikator ist eine Kombination des TRIX-Indikators (Triple Exponential Moving Average) mit einem zusätzlichen SMA-Signal (Simple Moving Average). Er liefert Anzeichen für Trendkontinuität und den Beginn eines neuen Trends.
Die Ein- und Ausstiegspunkte der Operationen erfolgen, wenn sich die Kurven des Indikators kreuzen.
Die Leistung des Indikators ist besser, wenn er mit anderen Indikatoren kombiniert wird.
FREE

WaveTrendPro Arrow - Adaptives Quersignal mit intelligenten Warnungen Beschreibung WaveTrendPro Arrow ist ein übersichtlicher und leistungsfähiger visueller Indikator zur Erkennung von Trendumkehrpunkten unter Verwendung des klassischen WaveTrend-Oszillators (WT1/WT2-Kreuz) , erweitert um intelligente Pfeile auf dem Chart , Echtzeit-Warnungen und mobile Push-Benachrichtigungen . Im Gegensatz zu traditionellen WaveTrend-Indikatoren, die Signale in einem Unterfenster anzeigen, zeigt diese Ve
FREE

Harmonic Sniper Pro - Der ultimative Harmonic Pattern Scanner Erschließen Sie sich die Macht des präzisen geometrischen Handels mit Harmonic Sniper Pro. Dieser professionelle Indikator erkennt automatisch hochwahrscheinliche harmonische Muster (Gartley, Bat, Butterfly, Crab, Shark, Cipher und ABCD) mit KI-gestützter Filterung und fortschrittlichen Handelsmanagementfunktionen. Harmonic Sniper Pro wurde sowohl für Scalper als auch für Swing-Trader entwickelt und macht Schluss mit dem Rätselraten,
FREE
https://www.mql5.com/en/users/gedeegi/seller
Das Logo "RSI+ with 123 Fractals" wurde entwickelt, um eine klare und professionelle visuelle Darstellung eines komplexen technischen Indikators zu bieten, der sich auf präzise Marktanalysen und zuverlässige Muster konzentriert. Jedes Element des Designs ist so gestaltet, dass es die Philosophie und die Stärken des Indikators in der Handelswelt widerspiegelt. Gestaltungselemente: "RSI+"-Text in Fettdruck und Weiß:
Der Haupttext "RSI+" steht im Mitte
FREE

Alle Händler sollten den Trend kennen, bevor sie ihre Kauf- oder Verkaufsaufträge erteilen. Der erste Schritt beginnt immer mit Angebot und Nachfrage , steigenden und fallenden Kanälen , Trendlinien, engulfing candles usw. All diese Faktoren tragen zu dem bei, was man "Price Action" nennt, und das ist der beste und zuverlässigste Weg, um zu handeln, den Trend zu erkennen und Gewinne zu erzielen, ohne Stress. Der Trendlinien-Indikator von Investment Castle zeichnet automatisch die Trendlinien au
FREE
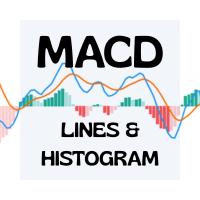
Erweiterter MACD-Indikator mit 6 Farben und einstellbarer Linienstärke Verbessern Sie Ihre Trading-Charts mit diesem vollständig anpassbaren MACD-Indikator für MetaTrader 4/5. Mit sechs unabhängigen Farbslots und der Möglichkeit, die Linienstärke pro Linie einzustellen, können Sie jedes Element genau an Ihre Wünsche anpassen. Hauptmerkmale Sechs separate Farbslots
Passen Sie jede Komponente mit ihrer eigenen Farbe an: MACD-Linie Signal-Linie Histogramm Balken (Bullish) Histogramm-Balken (bärisc
FREE
Wie bereits angedeutet, können Sie mit diesem Indikator von einem Symbol oder Zeitrahmen zu einem anderen in einem einzigen Chart wechseln. Vergessen Sie also das Öffnen einer Vielzahl von Charts auf Ihrem Bildschirm! Der Indikator ist nicht für ICT- oder SMC-Händler gedacht, aber wenn Sie zu dieser Art von Händlern gehören, können Sie ihn trotzdem verwenden. Stellen Sie sich vor, Sie haben eine Strategie mit verschiedenen Indikatoren und Einstellungen. In einem einzigen Chart können Sie die Ein
FREE

Swing BOS Structure ist ein Marktstrukturindikator für MetaTrader 5.
Der Indikator erkennt automatisch: - Swing Hoch (SH) - Tiefstkurs (SL) - Bruch der Struktur (BOS) - Wechsel des Charakters (CHoCH)
Umschwünge werden erst nach einer bestimmten Anzahl von Kerzen bestätigt, wodurch sichergestellt wird, dass sie sich nicht wiederholen. BOS-Signale zeigen eine Trendfortsetzung an. CHoCH-Signale weisen auf eine potenzielle Veränderung der Marktstruktur hin und können je nach Marktbedingungen und
FREE

Steigern Sie Ihre Fähigkeiten zur Trendbestimmung mit dem Consecutive Candle Indicator MT5, einem dynamischen Tool, das darauf ausgelegt ist, Serien von bullischen oder bärischen Kerzen zu identifizieren und zeitnahe Warnungen für Trendbestätigungen und potenzielle Umkehrungen in Forex-, Aktien-, Krypto- und Rohstoffmärkten zu liefern. In Handelsgemeinschaften wie Forex Factory und Reddit’s r/Forex gefeiert und in Diskussionen auf Investopedia und TradingView für seine Fähigkeit zur Vereinfachun
FREE
Scalping Timer – Echtzeitpräzision für anspruchsvolle Scalper Der Scalping Timer ist ein kompaktes visuelles Tool, das speziell für Scalper und Daytrader entwickelt wurde, die auf perfektes Timing und minimale Transaktionskosten angewiesen sind. Dieses Echtzeit-Panel zeigt zwei wesentliche Metriken für das Scalping an: Exakter Countdown der verbleibenden Zeit bis zum Schluss der im Chart eingestellten Kerze. Sofortige Visualisierung des aktuellen Spreads des Symbols. Mit diesen entscheidenden In
FREE

If you love this indicator, please leave a positive rating and comment, it will be a source of motivation to help me create more products <3 Wie verwendet man QQE? Bestimmen Sie den Trend, wenn der RSI MA über 50 auf einen Aufwärtsmarkt hinweist, während der RSI MA unter 50 auf einen Abwärtsmarkt hinweist und als Trendfilter dienen kann . Identifizieren Sie das kurzfristige Aufwärts-/Abwärtsmomentum: Wenn der RSI MA nach oben kreuzt, signalisiert der geglätteteMomentum, und wenn der RSI MA nach
FREE

Wave123 BOS-Indikator (XAUUSD M15 Optimiert) Der Wave123 BOS-Indikator ist ein modernes, chartbasiertes Visualisierungstool für Strukturbrüche (BOS) und Ausbrüche (BO) , das für Händler entwickelt wurde, die klare Marktstruktursignale direkt auf dem Chart sehen möchten - mit einem starken Fokus auf XAUUSD (Gold) auf dem M15-Zeitrahmen . Gold bewegt sich schnell und durchbricht die Struktur oft mit scharfen Impulsen und schnellen Rückschritten. Dieser Indikator wurde entwickelt, um diese Momente
FREE

Der Trend ist Ihr Freund!
Achten Sie auf die Farbe des Indikators und handeln Sie in diese Richtung. Er wird nicht neu gemalt. Nachdem jede Kerze geschlossen ist, ist das die Farbe des Trends. Sie können sich auf kürzere, schnellere Trends oder auf größere Trends konzentrieren. Testen Sie einfach, was für das Symbol und den Zeitrahmen, in dem Sie handeln, am besten geeignet ist. Ändern Sie einfach den Parameter "Länge" und der Indikator wird sich automatisch anpassen. Sie können auch die Farbe

Der stochastische RSI (StochRSI) ist ein technischer Indikator, der die Eigenschaften des Relative Strength Index (RSI) mit dem stochastischen Oszillator kombiniert, was zu einem empfindlicheren Instrument führt, das eine höhere Anzahl von Handelssignalen erzeugt. Der von Tushar Chande und Stanley Kroll entwickelte Indikator wurde entwickelt, um eine wahrgenommene Einschränkung des traditionellen RSI zu überwinden: die geringe Häufigkeit der Aktivierung von überkauften und überverkauften Niveau
FREE

Verbessern Sie Ihre Analyse mit dem Weis Wave Box ! Wenn Sie Präzision und Klarheit beim Trading suchen, ist das Weis Wave Box das ideale Tool. Dieser fortschrittliche Volumenwellen-Indikator bietet eine klare Visualisierung der Dynamik zwischen Aufwand und Ergebnis auf dem Markt – unverzichtbar für Trader, die Orderflow und Volumen lesen. Hauptfunktionen: Anpassbare Volumenwellen – in Ticks einstellbar, um Ihre Strategie zu unterstützen.
Anpassbarer Verlauf – analysieren Sie spezifis

Name des Indikators: CM EMA Trend-Balken Überblick: Der CM EMA Trend Bars Indikator ist ein einfaches, aber effektives Werkzeug, das die Farbe der Kursbalken auf der Grundlage ihrer Beziehung zum Exponential Moving Average (EMA) ändert. Dieser visuelle Hinweis hilft Händlern, die Trendrichtung und potenzielle Handelsmöglichkeiten schnell zu erkennen. Hauptmerkmale: Dynamische Balkenfärbung: Der Indikator ändert die Farbe der Balken, je nachdem, ob sie sich über oder unter dem EMA befinden, und b
FREE

AllTF Trend Bias Indicator ist ein professionelles Tool zur Visualisierung von Marktverzerrungen, das hauptsächlich für 1-Minuten-Charts entwickelt wurde. Die Farben sind keine Handelssignale an sich, sondern ein visueller Kompass, der Ihnen bei der Entscheidungsfindung hilft: HiddenEdge Veröffentlichungsmodell
Alle HiddenEdge Tools folgen dem gleichen strukturierten Veröffentlichungsplan.
Jeder Indikator wird zunächst kostenlos veröffentlicht, um Feedback zu sammeln.
Nachdem er eine stabile N
FREE

Dieser Indikator zeichnet automatisch die Unterstützungs- und Widerstandsniveaus (Key Levels) für Sie ein, sobald Sie ihn auf einem Chart abgelegt haben. So müssen Sie diese Niveaus nicht jedes Mal neu zeichnen, wenn Sie die Preise in einem Chart analysieren. Alles, was Sie tun müssen, ist, den Indikator auf ein Diagramm zu legen, die Einstellungen nach Ihren Wünschen anzupassen und ihn den Rest machen zu lassen.
Aber es kommt noch besser: Der Indikator ist absolut kostenlos! Für weitere Informa
FREE

Entdecken Sie die MSG-Methode: Meistern Sie das Major Session Gap für beständige Forex-Profite Machen Sie sich die Macht der MSG-Methode zunutze - unserer proprietären Major Session Gap-Strategie , die entwickelt wurde, um hochwahrscheinliche Trades während der wichtigsten Marktsitzungsübergänge zu erfassen. Dieser innovative Ansatz wurde vom T1 FX Team entwickelt und nutzt algorithmische Präzision, um Kurslücken zwischen den wichtigsten Handelssitzungen (London, New York und Tokio) zu identifiz

Im Sorry Ai Signal v1.26 - Präzises Gold Scalping für MT5 Verbessern Sie Ihren Handel mit Im Sorry Ai Signal , dem neuesten technischen Indikator aus der WinWiFi Robot Series . Speziell für Gold (XAUUSD) Scalper auf der MetaTrader 5 Plattform entwickelt, vereinfacht dieses Tool komplexe Marktbewegungen in klare, umsetzbare visuelle Signale. Dieser Indikator wurde mit dem Schwerpunkt auf Price Action innerhalb des M5 (5-Minuten)-Zeitrahmens entwickelt und hilft Händlern, wahrscheinliche Einstieg
FREE

Crypto_Forex-Indikator HTF RVI-Oszillator für MT5, kein Neuanstrich.
- Verbessern Sie Ihre Handelsmethoden mit dem professionellen HTF RVI Oszillator für MT5. HTF steht für „Higher Time Frame“. - RVI ist einer der besten Oszillatoren zur Erkennung von Trendänderungen und zum Einstieg aus überverkauften/überkauften Bereichen. - Dieser Indikator eignet sich hervorragend für Multi-Time-Frame-Handelssysteme mit Price-Action-Einträgen aus überverkauften/gekauften Bereichen. - Der HTF RVI-Indikator

Mahdad Candle Timer ist ein leichtgewichtiger und präziser Indikator für MetaTrader 5, der die verbleibende Zeit bis zum Schließen der aktuellen Kerze direkt neben der letzten Bar anzeigt. Er wurde für Trader entwickelt, die auf exaktes Timing angewiesen sind – sei es beim Scalping, Daytrading oder beim Warten auf die Bestätigung einer Kerze in Swing‑Setups. Hauptfunktionen Exakter Countdown – Restzeit im Format HH:MM:SS (optional Millisekunden) Dynamische Platzierung – Immer an der letzten
FREE
Volumisierte Breaker-Blöcke MTF Supreme Volumized Breaker Blocks MTF Supreme ist ein leistungsstarker und benutzerfreundlicher Multi-Timeframe (MTF) Indikator, der automatisch Order Blocks (OB) und Breaker Blocks (BB) in Ihrem Chart erkennt und visualisiert. Dieses fortschrittliche Tool wurde sowohl für Anfänger als auch für professionelle Händler entwickelt, die einen sauberen, schnellen und aufschlussreichen Weg suchen, um wichtige Marktniveaus mit Volumen-Kontext zu identifizieren. Hauptmerk
FREE
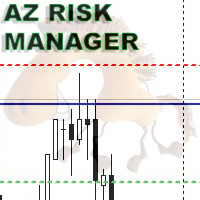
Ein einfacher Indikator zur Berechnung des Risikos und zur automatischen Berechnung der Take-Profit-Linie. In den Einstellungen geben Sie das gewünschte Verhältnis zwischen Risiko und Gewinn ein. Der Indikator berechnet automatisch das Volumen für den Einstieg und zeigt an, wo die Take-Profit-Linie gesetzt werden muss, um das Verhältnis beizubehalten. Das Risiko wird auf der Grundlage Ihrer Bilanzdaten berechnet. Das Informationsfeld kann auf dem Bildschirm verschoben werden. Die Stop-Loss-Linie
FREE
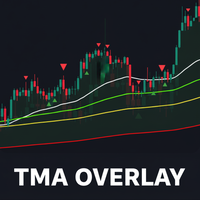
TMA-Overlay-Indikator für MT5 - Benutzerhandbuch 1. Einführung TMA Overlay ist ein vielseitiger Indikator für die technische Analyse auf der MetaTrader 5 Plattform. Das Ziel des Indikators ist es, Händlern einen umfassenden Überblick über den Trend, potenzielle Einstiegssignale und wichtige Handelssitzungen zu geben, die alle in einem einzigen Chart integriert sind. Es handelt sich nicht um ein Handelssystem, sondern um ein umfassendes Analysetool, das Ihnen helfen soll, fundiertere Entscheidung
FREE

Kontaktieren Sie mich , damit ich Ihnen eine Anleitung schicken und Sie in die Gruppe aufnehmen kann.
QM (Quasimodo) Pattern basiert auf Read The Market (RTM) Konzepte. Der Zweck dieses Modells ist es, die großen Spieler des Marktes (Finanzinstitute und Banken) zu konfrontieren, wie Sie wissen, in den Finanzmärkten, große Händler versuchen, kleine Händler zu täuschen, aber RTM verhindern, dass Händler in die Falle. Dieser Stil wird in Form von Preiskerzen gebildet und entsprechend den Angebots

TransitTrendlines ist ein automatischer Trendlinienzeichner, der sowohl horizontale als auch diagonale Trendlinien zeichnet. Die horizontalen Trendlinien sind die Pivotpunkte des Tageszeitrahmens und die diagonalen Trendlinien basieren auf den aktuellen Zeitrahmen. Sie können die diagonalen Trendlinien anpassen, indem Sie die Anzahl der Balken erhöhen, um die diagonale Trendlinie zu zeichnen, und Sie können auch die Steilheit anpassen. Beachten Sie, dass die horizontalen Trendlinien auf den Tage
FREE

Indikator, der ATR und Standardabweichung verwendet, um den aktuellen Trend zu berechnen. Er hat eine obere und eine untere Linie. Die obere Linie wird angezeigt, wenn sie hoch ist, und die untere Linie, wenn sie niedrig ist. Der Indikator zeichnet keine Trendlinie und zeigt auch nicht den Trend für den Tag oder einen bestimmten Zeitraum an. Er hat die Funktion, den aktuellen Trend anzuzeigen und kann auf eine Trendumkehr hinweisen.
Verwenden Sie ihn mit Vorsicht und auf eigenes Risiko.
FREE
MetaTrader Market - Handelsroboter und technische Indikatoren stehen Ihnen direkt im Kundenterminal zur Verfügung.
Das MQL5.community Zahlungssystem wurde für die Services der MetaTrader Plattform entwickelt und steht allen registrierten Nutzern der MQL5.com Webseite zur Verfügung. Man kann Geldmittel durch WebMoney, PayPal und Bankkarten einzahlen und sich auszahlen lassen.
Sie verpassen Handelsmöglichkeiten:
- Freie Handelsapplikationen
- Über 8.000 Signale zum Kopieren
- Wirtschaftsnachrichten für die Lage an den Finanzmärkte
Registrierung
Einloggen
Wenn Sie kein Benutzerkonto haben, registrieren Sie sich
Erlauben Sie die Verwendung von Cookies, um sich auf der Website MQL5.com anzumelden.
Bitte aktivieren Sie die notwendige Einstellung in Ihrem Browser, da Sie sich sonst nicht einloggen können.