Indicadores técnicos para MetaTrader 5 - 19
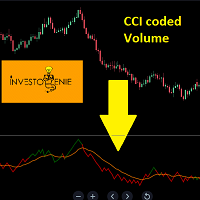
El Indicador se basa en el Índice del Canal de Materias Primas (CCI) codificado en el Volumen. El concepto es tratar de analizar el movimiento de Volumen y Precio en una dirección determinada.
Concepto :
Si el Precio del indicador se mueve por debajo del precio umbral, se vuelve ROJO indicando que la dirección a la baja es cada vez más fuerte.
Si el precio del indicador se mueve por encima del precio umbral, se vuelve de color VERDE, lo que indica que la dirección hacia arriba es cada vez más
FREE
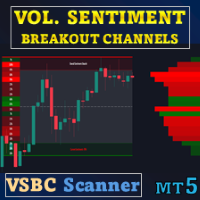
Oferta especial : ALL TOOLS , solo $35 cada uno. Las nuevas herramientas tendrán un precio de $30 durante la primera semana o para las primeras 3 compras ! Trading Tools Channel on MQL5 : Únete a mi canal de MQL5 para recibir mis últimas noticias Volume Sentiment Breakout Channels es un indicador que visualiza las zonas de ruptura basadas en el sentimiento del volumen dentro de canales de precio dinámicos. En lugar de considerar la ruptura únicamente como un evento técnico de pre
All-in-One Chart Patterns Nivel Profesional: El sistema definitivo de 36 patrones All-in-One Chart Patterns Professional Level es un completo indicador de 36 patrones bien conocido por los operadores minoristas, pero mejorado significativamente con una precisión superior mediante el análisis integrado del impacto de las noticias y el posicionamiento adecuado del perfil de mercado. Esta herramienta de trading de nivel profesional transforma el reconocimiento tradicional de patrones combinando la
FREE

¡Tome el control total del ritmo del mercado! El indicador OHLC & Sessions es una herramienta de análisis de precisión para MetaTrader 5, diseñada específicamente para visualizar los niveles de precios y horarios comerciales más importantes de un vistazo. En lugar de sobrecargar el gráfico con líneas confusas, este indicador ofrece una visualización limpia y profesional de la acción del precio diaria y las sesiones globales. ¿Por qué este indicador? Precisión en tiempo real: Identifique al insta
FREE

FVG Smart Zones – Edición Gratuita Indicador de Detección de Brechas de Valor Justo para MetaTrader 5 (MT5) ¿Buscas una herramienta de trading real, no solo otro indicador cualquiera?
FVG Smart Zones – Edición Gratuita te ofrece una visión profesional del mercado detectando automáticamente las Brechas de Valor Justo (FVG) y destacando zonas de trading de alta probabilidad directamente en tu gráfico. Diseñado para traders que siguen:
Conceptos de Dinero Inteligente (SMC)
Conceptos de T
FREE

¡Bienvenido a RSI Colored Candles, un innovador indicador diseñado para mejorar tu experiencia de trading integrando el Índice de Fuerza Relativa (RSI) directamente en tu gráfico de precios! A diferencia de los indicadores RSI tradicionales, RSI Colored Candles utiliza un esquema de cuatro colores para representar los niveles de RSI directamente en tus velas, ¡proporcionándote valiosos insights de un vistazo! Características y Beneficios: Diseño que Ahorra Espacio: ¡Adiós a las ventanas de indic
FREE

Time Range Separator es una herramienta útil para mostrar un periodo separador en su plataforma.
Puedes ir a las propiedades del indicador, seleccionar el rango deseado y listo. Creemos que es una herramienta útil y necesaria que queremos compartir gratuitamente con todos nuestros seguidores. Valores de Entrada: TimeFrame = Separador de Periodos Separator_Color = Línea de Color Vertical Separator_Style = Estilo Color Vertical Separator_Width = Ancho de Línea Vertical Buen trading a todos y hast
FREE
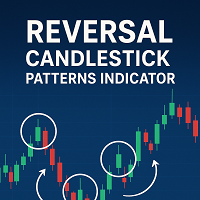
Indicador de Patrones de Velas Inversas - Versión Gratuita Este indicador MT5 identifica patrones de inversión de velas alcistas y bajistas comunes y los muestra directamente en el gráfico.
Se puede utilizar en cualquier mercado y marco temporal, proporcionando a los operadores referencias visuales claras para los posibles puntos de inversión. Características principales Detección automática de patrones de inversión de velas bien conocidos Funciona en todos los marcos temporales disponibles en
FREE

Piense en el Indicador Super Fractal como el Indicador Bill WIlliams con esteroides. Habilidades del Indicador: 1. 1. Ajustar la Vela alrededor del Máximo o Mínimo Fractal. 2. 2. Ajustar el período de retrospectiva y sólo trazar para un número específico de velas de la historia evitando el desorden de su mesa de operaciones. 3. 3. El indicador utiliza buffers para que pueda llamarlo y utilizarlo desde cualquier EA.
Nota : Cuanto más altas sean las velas alrededor del Fractal, más fuerte será el
FREE

Detector de soporte y resistencia Phoenix (MT5)
Herramienta profesional de detección de soporte y resistencia para MetaTrader 5. Detecta automáticamente los niveles de soporte y resistencia más fuertes a partir de un marco temporal superior y muestra un análisis exhaustivo de la fuerza a través de un panel visual.
Descripción general
El detector de soporte y resistencia Phoenix identifica los tres niveles de soporte y resistencia más fuertes utilizando un análisis de pivotes de un marco tempo
FREE

Heiken Ashi Dynamic es un indicador para MetaTrader 5 que muestra velas Heiken Ashi directamente en tu gráfico. Puedes elegir entre el modo clásico o un modo suavizado, que hace que los cambios de color sean más claros y fáciles de seguir. Los colores son simples: verde para movimientos al alza y rojo para movimientos a la baja. El modo Clásico reacciona rápido y ayuda a detectar giros con más antelación. El modo Suavizado hace que las tendencias largas se vean más limpias y continuas, ajustand
FREE

En seguridad de la información, un ataque de fuerza bruta consiste en un método sistemático de prueba y error para descubrir contraseñas, credenciales de inicio de sesión o claves criptográficas. Inspirados por este enfoque, desarrollamos Brute Force Trend, una herramienta de análisis de mercado que utiliza algoritmos para identificar patrones y puntos de reversión.
Características principales:
Múltiples métodos de cálculo: Nueve maneras diferentes de procesar el precio, lo que permite la ada
FREE

Visión general — Diseñado para traders que siguen la tendencia
AlgoMatrix EMA Ribbon Trend Pro es un indicador profesional de tendencia basado en EMA Ribbon para MetaTrader 5, creado para traders que buscan confirmación clara de tendencia, entradas disciplinadas y señales que no se repintan.
Este indicador ayuda a operar solo cuando el mercado realmente está en tendencia, evitando fases laterales y movimientos erráticos.
Genera una sola señal por tendencia confirmada, manteniendo el gráfi

Nombre del producto: Auto Trend Pattern Pro [Subho - India] Descripción corta:
Una herramienta avanzada de Acción de Precios que automáticamente detecta y dibuja Canales de Tendencia, Cuñas y Triángulos con un Tablero en vivo. Descripción completa: Auto Trend Pattern Pro es un sofisticado indicador técnico diseñado para MetaTrader 5. Automatiza la compleja tarea de dibujar Canales de Tendencia, Cuñas y Triángulos. Automatiza la compleja tarea de dibujar Líneas y Canales de Tendencia. Analizando
FREE

Con este indicador fácil de configurar puede mostrar y establecer alertas para las siguientes formaciones de velas: Breakout alcista, Breakout bajista, Martillo, Pin, Envolvente alcista, Envolvente bajista. Parámetros de entrada: ShortArrowColor: El color de las flechas, mostrando una formación de vela bajista. LongArrowColor: El color de las flechas que muestran una formación de vela alcista. BullishEngulfing: Disabled/Enabled/EnabledwithAlert BajaEngulfing: Disabled/Enabled/EnabledwithAlert Pi
FREE

La Media Móvil Ponderada por Volumen (VWMA) se calcula en base a los Precios y sus Volúmenes relacionados dando importancia a aquellas velas con más Volumen. Durante periodos de casi igual volumen distribuido a lo largo del periodo observado (comúnmente, en periodos de bajo volumen) la VWMA será gráficamente similar a una Media Móvil Simple. Utilizada junto con otras medias móviles una VWMA podría ser utilizada como alerta, filtro o lo que tu imaginación te permita...
CÓMO "LEER" ESTE INDICADOR
FREE

El indicador Blahtech Moving Average es una versión multitiempo del indicador estándar Moving Average. También está mejorado con alertas personalizables, saltos de periodo y otras opciones de configuración. Las medias móviles de 50 y 200 días son ampliamente seguidas por inversores y operadores, y las rupturas por encima y por debajo de las líneas MA se consideran señales de interés. Enlaces [ Instalar | Actualizar | Formación | Todos los productos ]
Características destacadas Hasta tres marcos
FREE

¿Cansado de señales falsas? ¡Opere con flechas de compra y venta fiables! ¡ Descargar ahora y ver cómo funciona !
Trend Reverting PRO: Señales de alto rendimiento Adecuado para el seguimiento de tendencias o el comercio de tendencia Nunca repinta, recalcula, o backpaints señales
Esto es GRATIS / DEMO / versión y funciona en EURUSD M15, M30" (versión demo; no hay corredores de sufijo / prefijo). Pruébelo GRATIS ahora - ¡vea los resultados reales!
TREND REVERTING PRO versión completa
FREE
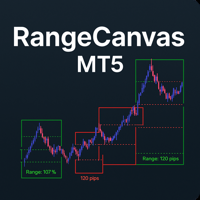
Cuadros de rango diario : El indicador dibuja recuadros rectangulares alrededor de los precios máximos y mínimos de cada día, creando un límite visual claro para el rango de negociación diario. Lógica codificada por colores : Cuadros verdes cuando el precio actual (o cierre) está por encima de la apertura diaria. Cuadros rojos cuando el precio actual está por debajo de la apertura diaria. Líneas de nivel porcentual : Dentro de cada caja, dibuja tres líneas horizontales a: 25% del rango diario 5
FREE

Este indicador de divergencia SMT (Smart Money Technique) identifica las discrepancias en el movimiento de los precios entre dos símbolos de negociación diferentes, ayudando a los operadores a detectar posibles retrocesos del mercado. Esta herramienta compara la acción de los precios de dos activos correlacionados, como dos pares de divisas o índices, para detectar divergencias cuando el precio de un activo se mueve en dirección opuesta al del otro. Por ejemplo, mientras que un símbolo puede est
FREE

MACD 2 Line MTF (Multi-Timeframe) Indicador para MetaTrader 5 Este indicador personalizado para MetaTrader 5 implementa un MACD clásico con dos líneas (Línea MACD y Línea de Señal) y un histograma codificado por colores , mejorado con capacidad multi-marco de tiempo . Permite a los operadores monitorizar las tendencias MACD desde marcos temporales superiores o inferiores directamente en el gráfico actual. Características principales: Línea MACD (EMA rápida menos EMA lenta) Línea de señal (SMA de
FREE

Hi-Lo es un indicador cuyo propósito es ayudar con mayor precisión a las tendencias de un activo determinado, lo que indica el mejor momento posible para comprar o vender.
¿Qué es Hi-lo?
Hi-Lo es un término derivado del inglés, donde Hi está vinculado a la palabra High y Lo a la palabra Low. Es un indicador de tendencia que se utiliza para evaluar la negociación de activos en el mercado financiero.
Por lo tanto, su uso se da para identificar si un activo en particular está mostrando una tend
FREE

Next Bar Countdown es un indicador de tiempo de alta precisión y rendimiento para MetaTrader 5, diseñado específicamente para mostrar a los operadores el tiempo restante hasta el cierre de la vela actual. Una sincronización precisa es crucial para muchas estrategias de trading, especialmente cuando las decisiones deben tomarse inmediatamente después de la apertura de una nueva vela. Funciones principales: El indicador ofrece una variedad de funciones que van más allá de los temporizadores estánd
FREE

El precio medio ponderado por volumen (VWAP) es utilizado por las instituciones financieras para colocar grandes operaciones a lo que se considera el valor justo de la sesión. Los canales de desviación estándar en torno al VWAP proporcionan posibles puntos de entrada para estrategias de reversión a la media o de ruptura, y el propio VWAP puede actuar como un nivel de salida de alta calidad. Si ha oído que el análisis basado en el volumen no funciona para el mercado de divisas y los CFD, pruebe a
FREE

Lleve la popular funcionalidad "Crosshair with Magnet Mode" de las modernas plataformas de gráficos directamente a su terminal MetaTrader 5. Crosshair for MT5 es una herramienta de precisión diseñada para los operadores que exigen exactitud. A diferencia de la retícula estándar de MT5, esta herramienta inteligente detecta automáticamente los precios de Apertura, Máximo, Mínimo y Cierre de sus velas. Cuando el ratón pasa cerca de una vela, la retícula "se ajusta" a la mecha más cercana o al preci
FREE

Descripción:
Oscilador de velas tipo Heikin-Ashi. Se puede utilizar de la misma forma que el RSI o el Estocástico.
Por ejemplo: Cruce cero. Por encima de la línea cero es alcista, por debajo de la línea cero es bajista.
Sobrecompra o sobreventa. La línea 100 es el nivel extremo comprado, la línea -100 es el nivel extremo vendido.
Divergencias.
Marco temporal: Cualquier marco temporal.
Instrumento: Cualquier instrumento.
FREE
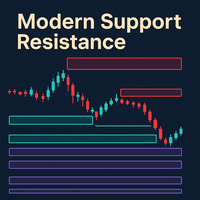
Indicador S/R dinámico que crea zonas a partir de fractales rápidos/lentos, los fusiona si se solapan, los clasifica (Posible, No probado, Verificado, Turncoat, Débil), destaca el más cercano al precio actual y envía alertas cuando el precio entra en la zona. Admite modo de prueba, temas visuales, extensión/fusión de zonas, variables globales para integración con EA, visualización opcional de zonas rotas y un filtro fuzz adaptativo basado en ATR (con retroceso automático).
Mis indicadores grati
FREE

Nota del Desarrollador:
Esta es la versión lite del Indicador Doble TMA con Bandas.
Usted puede encontrar la versión de pago que viene con alertas y flechas de señal en pantalla incorporadas aquí .
También voy a vender un EA basado en este sistema de comercio pronto una vez que todos backtesting y optimización se han completado.
¡Libere su potencial de trading con el Indicador de Doble TMA con Detección de Reversión!
Diseñado para swing y reversal trading, esta versátil herramienta integra
FREE
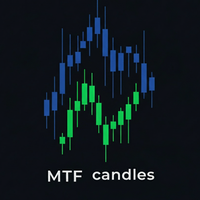
El indicador MTF (Multi-Timeframe) Candles es una potente herramienta que le permite mostrar velas de un marco temporal superior (por ejemplo, H1, H4, D1) directamente en un gráfico de un marco temporal inferior (por ejemplo, M5, M15, M30). El problema que resuelve: En lugar de cambiar constantemente de un gráfico a otro para analizar la tendencia principal y la acción detallada del precio, este indicador fusiona ambas perspectivas en una sola. Usted puede ver instantáneamente el "panorama gener
FREE

Se trata de una versión optimizada del indicador Waddah Attar Explosion (WAE ), diseñada para adaptarse a distintas clases de activos.
Los indicadores WAE estándar suelen utilizar un cálculo de "Zona Muerta" fijo (normalmente fijado en 20). Este valor fijo puede no ser adecuado para activos de alta volatilidad como Bitcoin, Oro o Índices (US30), pudiendo llevar a un filtrado incorrecto. Esta versión Auto-Adaptativa aborda ese problema de cálculo. El indicador implementa una fórmula dinámica basa
FREE
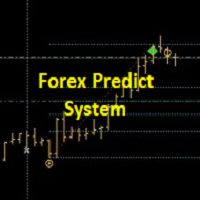
+++++++++++++++++++++++++++++++++++++++++++++++++++++++++++++++++++++++++++++++++++++++++++++++++ +++ Enlace a la versión gratuita de EURUSD --> https://www.mql5.com/en/market/product/156904?source=Unknown +++++++++++++++++++++++++++++++++++++++++++++++++++++++++++++++++++++++++++++++++++++++++++++++++ Hola Trader, Esta es una estrategia tradicional de GANN & FIBONACCI basada en la detección de un movimiento impulsivo en la dirección opuesta. Esto se llama Breakout. En el momento de la ruptura,

Herramienta avanzada de análisis de mercado : Sumérgete en la profundidad del mercado con el Indicador de Perfil de Volumen MT5. Integración perfecta con MT5 : Perfectamente compatible con la plataforma MT5. Mejora Pro Thunder v9 : Se integra sin problemas con Pro Thunder v9 para una visión más profunda del mercado. A nálisis detallado del volumen : Explora la dinámica del mercado a través de datos de volumen en profundidad. ️ Instalación sencilla : Pasos de configuración fáciles d
FREE

Las Smart Fibo Zones son potentes retrocesos de Fibonacci autogenerados que están anclados a cambios clave en la estructura del mercado . Estas zonas sirven como niveles críticos de Oferta y Demanda , guiándole para identificar posibles reacciones de los precios y confirmar la dirección del mercado. Los cálculos de Fibonacci , ampliamente utilizados por los operadores profesionales, pueden ser complejos a la hora de identificar máximos y mínimos. Sin embargo, Smart Fibo Zones simplifica este pro

Introducción Este indicador detecta patrones de dispersión de volumen para oportunidades de compra y venta. Los patrones incluyen patrones de demanda y de oferta. Puede utilizar cada patrón para operar. Sin embargo, estos patrones se utilizan mejor para detectar la zona de demanda (=zona de acumulación) y la zona de oferta (=zona de distribución). La pauta de demanda indica, por lo general, una posible oportunidad de compra. El patrón de oferta indica, por lo general, una posible oportunidad de
FREE

Nombre del producto: Indicador de Confluencia Armónica (Edición Básica) !!!--Deja un comentario de 5 estrellas y recibe una versión gratuita del indicador con niveles comerciales (limitado sólo a las primeras 20 personas)--!!! Titular: Explorador Automatizado de Patrones Armónicos con Confluencia de Oferta y Demanda. Descripción: Desbloquee el poder de la estructura geométrica del mercado con el Indicador de Confluencia Armónica (Edición Básica) . Esta potente herramienta está diseñada para esca
FREE

Unicorn Hunter – Detector Multitemporal de Setups Inteligentes Identifica zonas de reversión de alta probabilidad con precisión.
Unicorn Hunter analiza múltiples marcos temporales (1m / 2m / 3m / 5m) para detectar confluencias completas del tipo “Unicornio” — basadas en lógica estructural real del mercado, no en patrones aleatorios. Lógica Principal (Algoritmo v26) El indicador detecta configuraciones donde: Fractales confirman los puntos de giro. Se produce un barrido de liquidez (se tom
FREE

El indicador muestra niveles técnicos importantes en el gráfico. Estos niveles actúan como soporte o resistencia para el movimiento de precios.
Los niveles más importantes son múltiplos de 100 y 50 puntos. También puede mostrar los niveles en múltiplos de 25 puntos.
Cuando el precio alcanza el nivel, se muestra una alerta o notificación automática.
Versión para MT4 https://www.mql5.com/es/market/product/69486 Ajustes Show Levels 100 pips - mostrar niveles en múltiplos de 100 pips Show Levels
FREE

Mejore su estrategia de acción de precios: rupturas de barras interiores al alcance de su mano
Este indicador detecta el interior de las barras de varios rangos, lo que hace que sea muy fácil para los operadores de acción de precios detectar y actuar sobre las rupturas de barras interiores. [ Guía de instalación Guía de actualización Solución de problemas Preguntas frecuentes Todos los productos] Fácil de usar y entender Selección de colores personalizable El indicador implementa alertas visuale
FREE
El Indicador de Niveles Redondos dibuja automáticamente niveles de precios psicológicamente significativos directamente en su gráfico.
Estos números redondos a menudo actúan como zonas clave de soporte y resistencia en todos los mercados y plazos.
Round Levels se utiliza en mi EA automatizado: Opal Este indicador funciona mejor cuando se combina con otras herramientas y estrategias, por ejemplo: Estrategias de acción del precio
Los niveles redondos a menudo se alinean con soportes/resistencias
FREE

Indicador Session Killzone
Indicador que le ayuda a identificar las horas killzone de las sesiones de Londres y NuevaYork que suelen ser las horas de mayor volatilidad y toma de liquidez del mercado. Las horas killzone son configurables a través de los parámetros del indicador. El indicador ajusta el rango de las killzones en función del rango de negociación diario.
FREE

Detector de picos de águila v1.50 - Sistema de señales de trading profesional Trading de máxima precisión con la tecnología avanzada de filtrado SuperTrend unirse a mi canal de Telegram para el comercio conmigo: https: //t.me/+9HHY4pBOlBBlMzc8
El Detector de Picos Eagle es un sofisticado indicador de trading de nivel profesional diseñado para traders serios que exigen precisión, fiabilidad y excelencia visual. Combinando un análisis avanzado de múltiples marcos temporales con el filtrado Su
FREE

Stop Margin Calls. Empiece a operar con un POE claro. ¿Siempre recibiendo llamadas de margen una y otra vez?
¿Aún no ha encontrado un indicador o técnica que le proporcione un rendimiento diario constante ?
¿Cansado de depositar fondos y esperar que finalmente pueda retirarlos? No se preocupe - soy un verdadero trader a tiempo completo . Este es el mismo indicador de caja de entrada que utilizo personalmente, junto con un POE paso a paso para que pueda operar con reglas, no con emociones. =====
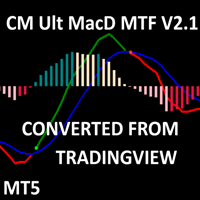
CM MACD Indicador Personalizado - Multiple Time Frame (V2.1) Este avanzado indicador MT5, adaptado del script TradingView de ChrisMoody, ofrece un potente MACD Multi-Timeframe con visuales y alertas personalizables. Trazando líneas MACD, línea de señal, y un histograma codificado por colores, destaca la dirección de la tendencia y el impulso con colores distintos para histogramas crecientes/ decrecientes por encima/debajo de cero. Las señales cruzadas se marcan con flechas, y los usuarios puede
FREE

Este indicador está diseñado para detectar patrones de inversión de alta probabilidad: Dobles Tops/Bottoms con rupturas falsas . Esta es la versión GRATUITA del indicador: https://www.mql5.com/en/market/product/29957 La versión gratuita sólo funciona con EURUSD y GBPUSD. Los patrones de doble techo y fondo son patrones gráficos que se producen cuando el instrumento de negociación se mueve en un patrón similar a la letra "W" (doble fondo) o "M" (doble techo). Estos patrones suelen producirse al f
FREE

Echa un vistazo a mi TRADE PLANNER MT5 - muy recomendable para anticipar escenarios de cuenta antes de arriesgar dinero. Este es el indicador de divergencia de convergencia de medias móviles (MACD) basado en cálculos Heikin Ashi. Aquí encontrará un histograma multicolor que corresponde a la tendencia alcista (verde) / bajista (rojo). Los colores oscuros y claros describen la debilidad / fuerza de la tendencia del precio en el tiempo. También puede cambiar los cálculos entre el tipo de precio no
FREE

Magic Candles es un nuevo producto que permite identificar la fase actual del mercado (tendencia alcista, bajista o plana).
Este indicador pinta barras de diferentes colores según el estado actual del mercado y avisa al usuario sobre los cambios de tendencia con alertas.
Magic Candles es perfecto para operar con divisas (incluidas las criptomonedas) y opciones binarias.
Ventajas Adecuado para especulación y comercio intradiario. El indicador no se vuelve a dibujar (recalcula), las señales se

KT Candlestick Patterns detecta y marca en tiempo real los 24 patrones de velas japonesas más confiables. Desde el siglo XVIII, los traders japoneses han utilizado estos patrones para predecir la dirección del precio. Es cierto que no todos los patrones de velas tienen la misma fiabilidad para predecir el mercado. Sin embargo, cuando se combinan con otros métodos de análisis técnico como Soporte y Resistencia, proporcionan una visión clara del comportamiento del mercado.
Este indicador incluye
Si te gusta este producto, por favor dale una calificación de 5 estrellas como muestra de agradecimiento.
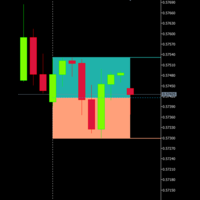
Este indicador dibuja las zonas de prima y descuento de una sola vela de cualquier marco temporal en su gráfico.
Usted elige qué vela (actual o anterior) usando CandleOffset, y el indicador recupera automáticamente el máximo, mínimo y punto medio de esa vela.
A continuación, muestra visualmente:
Zona Premium (50% superior)
Un rectángulo sombreado desde el punto medio de la vela hasta el má
FREE

OJO!!!
Uno de los mejores indicadores de Breakout de todos los tiempos está aquí. Multi Breakout Pattern mira a las velas precedentes y los marcos de tiempo para ayudarle a reconocer las rupturas en tiempo real.
La función incorporada de la oferta y la demanda puede ayudarle a evaluar su toma de beneficios y Stop losses
VER LAS PANTALLAS PARA PRESENCIAR ALGUNOS DE LOS MEJORES BREAKOUTS
ENTRADAS
MaxBarsback: Las barras máximas para mirar hacia atrás
Longitud lenta 1: Retroceso de periodo
L
FREE

Heiken Ashi Yemení Heiken Ashi Yemeni es un indicador profesional para MetaTrader 5 que combina velas Heiken Ashi modificadas con dos líneas de tendencia inteligentes (Yemen 1 & Yemen 2 ) basadas en cálculos internos avanzados y complejos, proporcionando una visión más clara de la tendencia y reduciendo el ruido del mercado. El indicador está diseñado para ofrecer a los operadores una visión general del mercado suave y fácil de leer , por lo que es adecuado para el trading manual y las estrategi
FREE
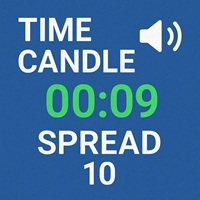
Vela de Tiempo con Alerta Sonora
Este indicador se mostrará el tiempo restante vela Características : 1. Multi marcos de tiempo, multi pares 2. Tiempo Izquierdo 2. 2. Dinámica de posición con el precio de compra o el borde de la pantalla del gráfico 3. Tamaño y color de fuente 4. 4. Visualización del Spread Actual, Spread Máximo y Spread Mínimo
Nota: El Spread Máximo y Mínimo se reiniciarán cuando cambie el TF Probado en MT5 Versión 5 Build 5200
Si desea que el código fuente, sólo me PM
FREE

Presentamos el poderoso indicador NRTR (Nick Rypock Trailing Reverse) - una herramienta técnica imprescindible para los traders que buscan identificar las inversiones de tendencia y establecer niveles efectivos de stop trailing. Desarrollado por Nick Rypock, este indicador cuenta con un algoritmo único que se adapta a las cambiantes condiciones del mercado, convirtiéndose en una adición invaluable para el arsenal de cualquier trader.
Aquí están las dos formas populares en las que los traders u
FREE
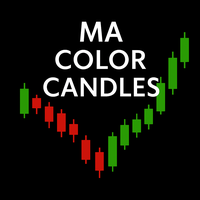
Indicador MA Color Candles MA Color Candles es un indicador para mostrar visualmente las tendencias del mercado coloreando las velas de los gráficos. No añade objetos ni distorsiona los datos de precios, sino que colorea las velas reales basándose en el estado de dos medias móviles. Esto permite una rápida evaluación de la tendencia y su uso como filtro en las estrategias de negociación. Cómo funciona Tendencia alcista: MA rápida por encima de MA lenta, MA lenta al alza (velas verdes). Tendenci
FREE

Bienvenido a HiperCube Renko Candles Código del -25% de descuento en Darwinex Zero: DWZ2328770MGM Este indicador le proporciona información real del mercado y lo transforma al estilo de vela Renko. Definición
Los gráficos Renko son un tipo de gráfico financiero que mide y traza los cambios de precios, utilizando ladrillos (o barras) para representar los movimientos de precios. A diferencia de los gráficos de velas tradicionales, los gráficos Renko no muestran información basada en el tiempo, cen
FREE

Este indicador es un port de MQL5 inspirado en el concepto "Cyclic Smoothed RSI" desarrollado originalmente por Dr_Roboto y popularizado por LazyBear y LuxAlgo en TradingView. El RSI Cíclico Suavizado (cRSI) es un oscilador diseñado para abordar las dos principales limitaciones del RSI estándar: retraso y niveles fijos de sobrecompra/sobreventa. Al utilizar el procesamiento digital de señales (DSP) basado en los ciclos del mercado, el cRSI reduce el ruido sin sacrificar la capacidad de respuest
FREE

Thermo MAP es un indicador multidivisa y multihorario que muestra un mapa de calor inteligente basado en cálculos propios. Observe cómo se ha movido y se está moviendo actualmente el mercado Forex con un único panel de control y tenga una idea coherente y precisa de lo que está sucediendo.
Puede ser adecuado tanto para scalping o medio / largo plazo, sólo tienes que seleccionar las opciones que mejor se adapten a su estilo de negociación La lista de símbolos se ordena automáticamente en función
FREE
Este indicador proporciona un panel de control claro y de un vistazo para supervisar tanto el Índice de Fuerza Relativa (RSI) como el Oscilador Estocástico en cualquier instrumento o marco temporal.
Cada vez que tanto el RSI como el Estocástico %K superan simultáneamente sus respectivos niveles de sobrecompra o sobreventa, el indicador muestra una señal de flecha en la ventana del indicador.
Estas señales destacan un fuerte impulso y pueden ayudar a los operadores a identificar rápidamente zonas
FREE

Indicador MACD multidivisa y multiplazo. El panel puede mostrar tanto el MACD tradicional (verdadero) como el MACD integrado en MetaTrader.
En el panel puede ver el estado actual del indicador: la dirección del movimiento de las líneas MACD, su intersección y una ventana emergente con el gráfico del indicador. En los parámetros puede especificar los pares-símbolos y plazos que desee. El escáner también puede enviar notificaciones sobre líneas que se cruzan entre sí y sobre líneas que cruzan el

Desarrollo de la versión previa del indicador ZigZag WaveSize MT4 ZigZag WaveSize - indicador ZigZag estándar modificado con información añadida sobre la longitud de onda en puntos, niveles, y diferentes lógicas de alertas
Mejoras generales: Adaptación del código para MetaTrader 5 Optimizada la operación con objetos gráficos Novedades: Niveles horizontales en los extremos Selección del tipo de niveles: horizontal/rayos/segmentos Filtro de niveles líquidos (no rotos por el precio) Buffer para r
FREE

Infinity Predictor MA
Infinity Predictor MA es un indicador de previsión de nueva generación que transforma la media móvil tradicional en una potente herramienta de predicción. A diferencia de las medias móviles estándar, que sólo suavizan los datos pasados, este indicador proyecta la línea de la media móvil hasta 40 barras en el futuro, ofreciendo a los operadores una perspectiva única sobre la dirección potencial del mercado.
El motor de Infinity Predictor MA combina múltiples modelos de re
FREE
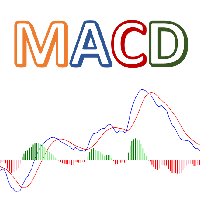
Colorful MACD es la versión MT5 del MACD por defecto de TradingView. Este indicador tiene 4 colores diferentes para el histograma MACD, por lo que es muy fácil detectar las fluctuaciones en el histograma. Características: Histograma de Barras de Colores Mostrar/Ocultar Línea de Señal Mostrar/Ocultar Línea MACD Control de precios flexible Por favor, llámeme si necesita más parámetros de entrada o versión modificada de este indicador.
FREE

Niveles de Grandes Figuras - Zonas de Precios Psicológicos Clave para MT5 Big Figure Levels es una herramienta de trading profesional diseñada para MetaTrader 5 que identifica y dibuja automáticamente los principales niveles psicológicos de precios, incluidos los niveles de cuarto y mitad. Estos niveles son conocidos por actuar como potentes zonas de soporte y resistencia debido a su influencia en el comportamiento de los operadores tanto institucionales como minoristas. Este indicador es perfec
FREE
Indicador VWAP (Volume Weighted Average Price) con bandas ±1σ y ±2σ calculadas a partir del volumen real negociado. Las horas de inicio y fin de la sesión son totalmente configurables, así como los niveles de desviación estándar y el número de bandas mostradas. Muestra el precio medio ponderado por volumen del día y ayuda a los operadores a identificar con precisión zonas de valor, precios extremos y oportunidades de negociación intradía.
FREE
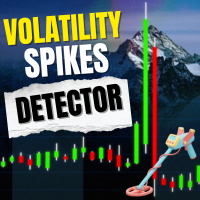
Volatility Monitor – Indicador de Detección de Picos en Tiempo Real Descripción General Volatility Monitor es un indicador MT5 ligero y profesional diseñado para rastrear movimientos bruscos de precios y alertar a los traders en tiempo real. Ya sea que opere Forex, Oro, pares JPY o Cripto, esta herramienta proporciona señales claras de volatilidad mediante detección automática basada en ATR o umbrales de pips manuales. Marcando velas directamente en el gráfico y enviando alertas progresivas, el
FREE
Si operas en los mercados financieros, seguramente sabes lo importante que es el spread: esta diferencia entre el precio de compra (ask) y el de venta (bid) puede afectar seriamente tus ganancias. Spread Size es un indicador simple pero muy útil que muestra el spread actual directamente en el gráfico. ¡Ya no necesitas monitorear los datos manualmente constantemente: todo está justo frente a tus ojos! ¿Para qué sirve?
El spread no es solo un número. Es tu dinero real. Un spread bajo significa
FREE

- Muestra líneas horizontales para el máximo del día anterior (PDH) y el mínimo del día anterior (PDL) en el gráfico. - Colores de línea personalizables mediante parámetros de entrada. - Envía alertas sonoras, notificaciones emergentes y notificaciones push para móviles al producirse el cruce inicial de PDH o PDL. - Las alertas se activan sólo una vez por evento de cruce; se vuelven a activar sólo si el precio se aleja y vuelve a cruzar después de un intervalo mínimo especificado. - Actualiza au
FREE

En muchas estrategias, es bastante común usar un ATR escalado para ayudar a definir un stop-loss, y no es raro usarlo también para objetivos de toma de ganancias. Si bien es posible usar el indicador ATR incorporado y calcular manualmente el valor de compensación, no es particularmente intuitivo o eficiente y tiene el potencial de errores de cálculo.
Características Compensación ATR configurable Banda Superior e Inferior. factor de escala ATR configurable Período de tiempo ATR alternativo (no
FREE
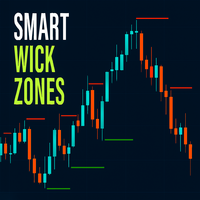
El indicador Smart Wick Zones es una potente herramienta diseñada para resaltar zonas ocultas de rechazo de precios y liquidez en su gráfico. Mediante el análisis de las mechas de las velas (también llamadas sombras o colas), el indicador dibuja automáticamente zonas horizontales donde previamente ha aparecido una fuerte presión compradora o vendedora. Estas zonas de mechas suelen marcar puntos de inflexión en el mercado o áreas en las que el precio reacciona con fuerza, lo que las convierte en
FREE
Calculadora del valor del pip - Evaluación instantánea del riesgo en su gráfico Esta potente y ligera utilidad calcula instantáneamente el valor monetario exacto de cualquier movimiento de pip, mostrándolo directamente en su gráfico para que pueda evaluar el riesgo y el beneficio potencial de un vistazo. En esencia, el sofisticado motor de cálculo del indicador se ejecuta silenciosamente con cada tick de precio, garantizando que la información que vea esté siempre actualizada. Detecta automática
FREE

Presentación
Otro indicador que facilita el scalping en gráficos de tick, muestra un gráfico Heiken Ashi en Ticks.
Permite detectar puntos de entrada e inversiones de tendencia. Número recomendado de ticks en una vela : 5, 13 o 21.
Parámetros Ticks en vela: Número de ticks en una vela (por defecto 5), Muestra flechas de tendencia : muestra una flecha de tendencia basada en el cruce de EMA8 y EMA20, Muestra MM50, Muestra MM100, Max Candle (CPU): número máximo de velas a gestionar, un valor bajo
FREE
MetaTrader Market - robots comerciales e indicadores técnicos para los trádres, disponibles directamente en el terminal.
El sistema de pago MQL5.community ha sido desarrollado para los Servicios de la plataforma MetaTrader y está disponible automáticamente para todos los usuarios registrados en el sitio web MQL5.com. Puede depositar y retirar el dinero a través de WebMoney, PayPal y tarjetas bancarias.
Está perdiendo oportunidades comerciales:
- Aplicaciones de trading gratuitas
- 8 000+ señales para copiar
- Noticias económicas para analizar los mercados financieros
Registro
Entrada
Si no tiene cuenta de usuario, regístrese
Para iniciar sesión y usar el sitio web MQL5.com es necesario permitir el uso de Сookies.
Por favor, active este ajuste en su navegador, de lo contrario, no podrá iniciar sesión.