Technische Indikatoren für den MetaTrader 5 - 22
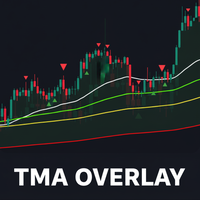
TMA-Overlay-Indikator für MT5 - Benutzerhandbuch 1. Einführung TMA Overlay ist ein vielseitiger Indikator für die technische Analyse auf der MetaTrader 5 Plattform. Das Ziel des Indikators ist es, Händlern einen umfassenden Überblick über den Trend, potenzielle Einstiegssignale und wichtige Handelssitzungen zu geben, die alle in einem einzigen Chart integriert sind. Es handelt sich nicht um ein Handelssystem, sondern um ein umfassendes Analysetool, das Ihnen helfen soll, fundiertere Entscheidung
FREE

Sind Sie es leid, von Spikes und Peitschen gejagt zu werden?
Werden Sie nicht zum Opfer der erratischen Bewegungen des Marktes. Tun Sie etwas dagegen!
Treffen Sie sofort klügere Entscheidungen mit der präzisen Balance aus Filtern und genauen Statistiken von Impulse Pro.
Timing ist alles im Handel
Um mehr zu erfahren, besuchen Sie bitte www.mql5.com/en/blogs/post/718212 Antizipieren Sie die nächste große Bewegung, bevor sie sich entfaltet, in 3 einfachen Schritten!
Vorteile, die Sie erhalte

Der stochastische RSI (StochRSI) ist ein technischer Indikator, der die Eigenschaften des Relative Strength Index (RSI) mit dem stochastischen Oszillator kombiniert, was zu einem empfindlicheren Instrument führt, das eine höhere Anzahl von Handelssignalen erzeugt. Der von Tushar Chande und Stanley Kroll entwickelte Indikator wurde entwickelt, um eine wahrgenommene Einschränkung des traditionellen RSI zu überwinden: die geringe Häufigkeit der Aktivierung von überkauften und überverkauften Niveau
FREE

ATR Plus ist eine verbesserte Version der klassischen ATR, die nicht nur die Volatilität selbst, sondern auch die Richtungsenergie des Marktes anzeigt.
Der Indikator wandelt die ATR in einen normalisierten Oszillator (0-100) um, so dass Sie klar sehen können: wer den Markt dominiert - Käufer oder Verkäufer wann ein Trend beginnt wenn ein Trend an Stärke verliert wenn sich der Markt in eine Spanne bewegt wenn die Volatilität Erschöpfungszonen erreicht ATR Plus eignet sich perfekt für Momentum-, T
FREE

RSI-ALARM (für Metatrader 5)
Diese Anzeige funktioniert wie ein normaler RSI mit all seinen Einstellungen (Periodizität, Farben, Pegel usw.).
Zusätzlich können Alarme auf der oberen und unteren Ebene eingestellt werden (Beispiel 70 und 30), wobei die Möglichkeit besteht, diese Ebenen durch Verschieben der blauen und roten Linien anzupassen, um die oberen und unteren Ebenen festzulegen.
Sie können auch eine zusätzliche Funktion ein- und ausschalten, die einen Pfeil im Diagramm erstellt, wenn

Willkommen bei HiperCube Renko Candles Rabattcode für 25% bei Darwinex Zero: DWZ2328770MGM Dieser Indikator liefert Ihnen echte Marktinformationen und wandelt sie in den Renko Candle Style um.
Definition Renko-Charts sind eine Art Finanzdiagramm, das Preisänderungen misst und darstellt, wobei Ziegel (oder Balken) verwendet werden, um Preisbewegungen darzustellen. Im Gegensatz zu herkömmlichen Candlestick-Charts zeigen Renko-Charts keine zeitbasierten Informationen an, sondern konzentrieren sic
FREE
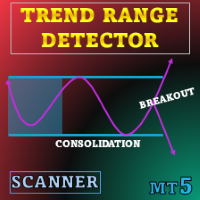
Sonderangebot : ALL TOOLS , nur $35 pro Stück! Dieses Tool ist 3 Tage KOSTENLOS ; verpassen Sie es nicht! Neue Tools kosten $30 während der ersten Woche oder für die ersten 3 Käufe ! Trading Tools Channel on MQL5 : Treten Sie meinem MQL5-Kanal bei, um die neuesten Nachrichten zu erhalten Trend Range Detector wurde für Anwender entwickelt, die eine strukturierte, datenbasierte Sicht auf Preis-Konsolidierungen bevorzugen. Anstatt auf subjektives Chart-Lesen zu setzen, wendet er klar
Kostenlos bis 1. Januar 2026
VWAR 2.2 (Volume Weighted Average Roadmap) ist ein fortschrittlicher MT5-Indikator für institutionelle Anleger, der Ihnen die leistungsfähigste Multi-Zeitrahmen-VWAP-Analyse (Volume Weighted Average Price) sowie gefilterte Handelssignale mit robusten Trend- und Momentum-Bestätigungen bietet. Hauptmerkmale: Multi-Timeframe VWAP-Linien:
Tägliche, wöchentliche und monatliche VWAP-Linien für einen sofortigen Einblick in die Marktstruktur. Dynamische Kauf-/Verkaufssign
FREE
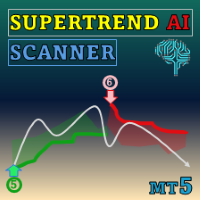
Special offer : ALL TOOLS , just $35 each! New tools will be $30 for the first week or the first 3 purchases ! Trading Tools Channel on MQL5 : Join my MQL5 channel to update the latest news from me Entdecken Sie die Kraft der KI mit dem SuperTrend AI Clustering MT5 mit Scanner , einem revolutionären Handelstool für MetaTrader 5 (MT5). Dieser Indikator definiert die Marktanalyse neu, indem er K-Means-Clusterbildung mit dem weit verbreiteten SuperTrend-Indikator kombiniert und Händle

TRUE TIMER - Candle Countdown - Kostenlos für begrenzte Zeit, nach 20 Downloads wird dies ein kostenpflichtiges Tool sein. Echtzeit-Countdown-Timer (MM:SS), der die Sekunden bis zum Kerzenschluss in einem beliebigen Zeitrahmen anzeigt. Mit Hinweismeldungen, die Sie auf neue Kerzen aufmerksam machen. Hauptmerkmale: Präziser Server-Zeit-Countdown. Automatische Farberkennung (helle/dunkle Hintergründe). Intelligente "Neue Kerze"- und Timing-Warnungen. Funktioniert auf allen Zeitrahmen M1 → Monatlic
FREE
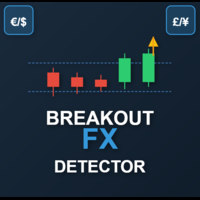
Dies ist ein leistungsstarker, sitzungsbezogener Ausbruchsindikator, der für ernsthafte Händler entwickelt wurde, die von Volatilität und Struktur profitieren. Der Indikator ist auf Präzision ausgelegt und identifiziert hochwahrscheinliche Ausbruchszonen während der Londoner und New Yorker Handelssitzungen, in denen sich der Markt mit Absicht bewegt. Hauptmerkmale: Session Range Detection
Erkennt und markiert automatisch die wichtigsten Kursbereiche der Londoner und New Yorker Sitzungen. Breako
FREE

Modifikation des stochastischen Oszillators für mehrere Währungen und mehrere Zeitrahmen. Sie können in den Parametern beliebige Währungen und Zeitrahmen angeben. Das Panel zeigt die aktuellen Werte und Schnittpunkte der Linien – Signal und Main (Stochastik-Crossover) – an. Außerdem kann der Indikator Benachrichtigungen senden, wenn überkaufte und überverkaufte Niveaus überschritten werden. Durch Klicken auf eine Zelle mit einem Punkt werden dieses Symbol und dieser Punkt geöffnet. Dies ist der

Das 123-Muster ist eines der beliebtesten, leistungsstärksten und flexibelsten Diagrammmuster. Das Muster besteht aus drei Preispunkten: einem Boden, einem Gipfel oder Tal und einem Fibonacci-Retracement zwischen 38,2% und 71,8%. Ein Muster gilt als gültig, wenn der Preis jenseits des letzten Gipfels oder Tals abbricht, in dem der Indikator einen Pfeil zeichnet, einen Alarm auslöst und der Handel platziert werden kann. [ Installationsanleitung | Update-Anleitung | Fehlerbehebung | FAQ | Alle Pr

Bei diesem Indikator handelt es sich um Wimpel , bei denen es sich um Fortsetzungsmuster handelt, die durch konvergierende Trendlinien im Zusammenhang mit einer Preiskonsolidierungsperiode gekennzeichnet sind. Trades werden mit einer Breakout-Periode neben dem Formations-Breakout signalisiert. [ Installationsanleitung | Update-Anleitung | Fehlerbehebung | FAQ | Alle Produkte ] Einfach zu verwenden Anpassbare Farben und Größen Es implementiert Breakout-Signale Es implementiert Warnungen aller Ar

Der Indikator identifiziert Divergenzen, indem er die Steigungen der Linien analysiert, die Preis- und MACD-Histogramm-Höchst- oder Tiefstpunkte verbinden. Bullische Divergenz (Konvergenz): Tritt auf, wenn die Linien, die die Tiefpunkte des MACD und die entsprechenden Tiefpunkte des Preisdiagramms verbinden, entgegengesetzte Steigungen haben und konvergieren. Bärische Divergenz: Tritt auf, wenn die Linien, die die Höchstpunkte des MACD und die entsprechenden Höchstpunkte des Preisdiagramms v
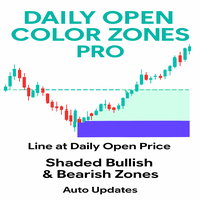
Bei diesem Indikator handelt es sich um ein professionelles Tool, das die tägliche Eröffnungslinie aufzeichnet und sofort die bullishen und bearishen Preiszonen um sie herum schattiert. Anstatt die Händler im Ungewissen zu lassen, liefert er eine klare visuelle Karte der Marktstimmung gleich zu Beginn des Tages. Ziel des Indikators ist es, sofort zu erkennen, ob der Markt oberhalb oder unterhalb der Tageseröffnung notiert - ein wichtiger Bezugspunkt für Intraday-Strategien.
Der Indikator zieht
FREE

Dies ist eine Kombination von Indikatoren zur Analyse von Trends, Unterstützungswiderständen, Kauf- und Verkaufspunkten. Es verwendet MA, Bollinger Bands, KDJ, CCI, RSI.
Die obere und untere Linie des Hauptdiagramms sind die oberen und unteren Bollinger Bänder, mit 20 Zyklen und 2,3 Standardabweichungen können verwendet werden, um Widerstand zu unterstützen. In der Mitte ist die Trendanalyse des durchschnittlichen, Trend-Analyse ist es, die durchschnittliche Multi-Cycle verwenden: Aufwärtstrend
FREE

SAR Farbiger Indikator mit Alarm - Verbessern Sie Ihre Handelsstrategie Sind Sie es leid, Charts ständig auf Trendumkehrungen zu überwachen? Wir stellen Ihnen den farbigen SAR-Indikator mit Alarm vor - ein leistungsstarkes, benutzerfreundliches Tool, das den klassischen parabolischen SAR (Stop and Reverse) in ein dynamisches, visuell intuitives und alarmgesteuertes System verwandelt. Dieser Indikator ist perfekt für Händler aller Niveaus und ist jetzt im MQL Markt verfügbar und bereit, Ihre Hand
FREE

AstroCycles: Fortgeschrittener Finanzastronomie-Indikator Übersicht AstroCycles ist ein hochentwickeltes technisches Analysetool, das für die MetaTrader 5 (MQL5) Plattform entwickelt wurde. Es schließt die Lücke zwischen der Orbitalmechanik und der Finanzmarktanalyse, indem es präzise astronomische Zyklen berechnet und diese direkt in Ihrem Trading-Chart visualisiert. Im Gegensatz zu Standardindikatoren, die sich auf vergangene Kursdaten stützen, verwendet AstroMaster hochpräzise astronomische A
FREE

Verbessern Sie Ihre Price-Action-Strategie: Inside-Bar-Breakouts auf Tastendruck
Dieser Indikator erkennt die Innenseite von Bars in verschiedenen Bereichen und macht es Preis-Aktions-Händlern sehr einfach, Inside-Bar-Breakouts zu erkennen und darauf zu reagieren. [ Installationsanleitung | Update-Anleitung | Fehlerbehebung | FAQ | Alle Produkte ] Einfach zu bedienen und zu verstehen Anpassbare Farbauswahlen Der Indikator implementiert visuelle/mail/push/sound Warnungen Der Indikator wird nicht
FREE

Ein sehr einfacher Indikator, der jedoch bei der Durchführung Ihrer Operationen nicht fehlen darf.
Schnelle und genaue Spreed-Informationen vor dem Einstieg in einen Handel sowie der Zeitpunkt für den Start einer weiteren Kerze.
Als Spread bezeichnet man die Differenz zwischen dem Kauf- und dem Verkaufspreis einer Aktie, einer Anleihe oder einer Währung.
Sehen Sie sich auch unsere mql5 Signale an. https://www.mql5.com/pt/signals/899841?source=Site+Signale+Vom+Autor
FREE
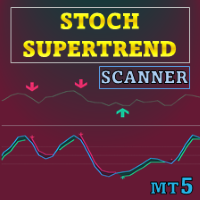
Sonderangebot : ALL TOOLS , nur $35 pro Stück! Neue Tools kosten $30 während der ersten Woche oder für die ersten 3 Käufe ! Trading Tools Channel on MQL5 : Treten Sie meinem MQL5-Kanal bei, um meine neuesten Updates zu erhalten Dieses Tool kombiniert Stochastic RSI mit der SuperTrend-Logik, um richtungsweisende Signale auf Basis von Momentum-Verschiebungen zu erzeugen. Es legt einen SuperTrend-ähnlichen Envelope auf den Stochastic RSI und hebt Wendepunkte hervor, wenn das Momentum
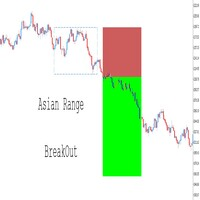
Vollständig anpassbar – Passen Sie den Indikator an Ihren persönlichen Handelsstil an, indem Sie Parameter wie Zeitrahmen, Farben, Linienstile und Risiko-Rendite-Einstellungen ändern. Visualisierung der Handelsniveaus – Zeichnet automatisch den Einstiegspreis, den Stop-Loss (SL) und das Take-Profit (TP) Level basierend auf Breakout-Bedingungen. Nahtlose Integration mit Expert Advisors (EAs) – Übernehmen Sie die volle Kontrolle über Ihre automatisierten Strategien, indem Sie zusätzliche Bes
FREE
https://www.mql5.com/en/users/gedeegi/seller
Das Logo "RSI+ with 123 Fractals" wurde entwickelt, um eine klare und professionelle visuelle Darstellung eines komplexen technischen Indikators zu bieten, der sich auf präzise Marktanalysen und zuverlässige Muster konzentriert. Jedes Element des Designs ist so gestaltet, dass es die Philosophie und die Stärken des Indikators in der Handelswelt widerspiegelt. Gestaltungselemente: "RSI+"-Text in Fettdruck und Weiß:
Der Haupttext "RSI+" steht im Mitte
FREE
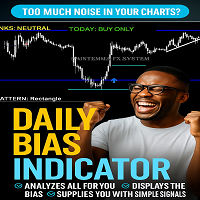
EINFÜHRUNG des leistungsstarken Daily Bias Indicator
Der Daily Bias Indicator
Hören Sie auf zu raten. Handeln Sie mit Zuversicht.
Haben Sie es satt, auf Ihre Charts zu starren und nicht zu wissen, ob heute ein Kauf- oder Verkaufstag ist? Der Daily Bias Indicator nimmt Ihnen die schwere Arbeit ab.
Er scannt den Markt mit Hilfe von 7 leistungsstarken Werkzeugen (EMA-Trend, RSI, MACD, ADX, Volumen, Pivot-Punkte und Preis-Aktion). Es sagt Ihnen in einfacher Sprache:
"TODAY: NUR KAUFEN"
FREE

Dieser Indikator wurde entwickelt, um die Analyse mehrerer Zeitrahmen zu unterstützen. In den Indikatoreinstellungen kann der Benutzer die Farbe, die Breite und den Stil der horizontalen Linien für jeden Zeitrahmen festlegen. Wenn die horizontalen Linien in das Diagramm eingefügt werden, werden sie mit den Einstellungen des Zeitrahmens gezeichnet.
MTF Lines ermöglicht auch die Sichtbarkeitskontrolle von anderen Objekten wie Rechtecken, Trendlinien und Texten.
Dieses Produkt wurde von Renato Fi
FREE

SCHLÜSSEL-FEATURES: Ein-Klick-Chartwechsel (schnelle Navigation) Klicken Sie einfach auf einen beliebigen Symbolnamen im Dashboard, und Ihr Chart wechselt sofort zu diesem Paar. Verpassen Sie nie wieder ein Handels-Setup aufgrund einer langsamen Navigation. Triple Signal Detection Überwacht 3 leistungsstarke Indikatoren gleichzeitig für jedes Symbol: RSI-Monitor: Erkennt überkaufte/überverkaufte Bedingungen sofort. Stochastik: Bestätigt Momentum-Verschiebungen. MA Trend: Identifiziert die Haupt
FREE

Wir stellen den leistungsstarken NRTR (Nick Rypock Trailing Reverse) Indikator vor - ein unverzichtbares technisches Werkzeug für Trader, die Trendumkehrungen erkennen und effektive Trailing-Stop-Levels setzen möchten. Entwickelt von Nick Rypock, verfügt dieser Indikator über einen einzigartigen Algorithmus, der sich an die sich ständig ändernden Marktbedingungen anpasst und somit eine wertvolle Ergänzung für das Repertoire eines jeden Traders darstellt.
Hier sind die beiden beliebtesten Wege,
FREE

Utazima 001 Indikator AI Professionelles Marktstruktur- & Eröffnungsbereichssystem HÖR AUF ZU RATEN. BEGINNEN SIE MIT STRUKTUR ZU HANDELN. Utazima 001 Indicator AI ist ein Marktstruktur- und Eröffnungsspannen-Intelligenzsystem der nächsten Generation, das für Trader entwickelt wurde, die Klarheit, Präzision und Konsistenz wünschen. Es handelt sich nicht um ein Tool zum Nachmalen von Signalen.
Es handelt sich um eine Logik von institutioneller Qualität , vereinfacht und automatisiert für E
FREE

Marktzyklus- und Trading-Sessions-Indikator
Wir stellen Ihnen unseren Market Cycle and Trading Sessions Indicator vor, ein Tool, das Ihnen einen umfassenden Überblick über den Finanzmarkt bietet wie nie zuvor. Beobachten Sie den Puls des Marktes mit unserem exklusiven Indikator. Gewinnen Sie ein tiefes Verständnis der Marktphasen, von der Akkumulation bis zur Ausschüttung, um fundierte, strategische Entscheidungen mit hoher Wahrscheinlichkeit zu treffen.
Was macht unseren Indikator aus?
1. D
FREE
Erschließen Sie den Präzisionshandel: Das ATR Dynamic Pivot System Laden Sie diesen kostenlosen Indikator für ATR-Pivot-Signale herunter und verschaffen Sie sich sofort einen Vorteil gegenüber dem Marktrauschen. Dies ist das ultimative Werkzeug für Händler, die auf der Grundlage echter Marktumschwünge - und nicht auf der Grundlage von Vermutungen - überzeugende Einstiegspunkte suchen. Das ATR Pivot Signals System ist ein innovativer technischer Indikator, der die Average True Range (ATR) nutzt,
FREE

MACD Pro - MACD-Indikator für MetaTrader 5 Beschreibung
MACD Pro ist ein Moving Average Convergence Divergence (MACD) Indikator für MetaTrader 5. Er folgt der Standard-MACD-Berechnungsmethode und zeigt Trendrichtung und Momentum in einem separaten Indikatorfenster an. Elemente des Indikators MACD-Linie, die auf der Differenz zwischen schnellen und langsamen exponentiellen gleitenden Durchschnitten basiert Signallinie, berechnet als exponentiell gleitender Durchschnitt der MACD-Linie Histogramm,
FREE

Schattensystem-Kerzen - Trendvisualisierungssystem
Das Konzept. Nie mehr im Dunkeln schießen. Rüsten Sie den Markt mit Nachtsicht aus."
Shadow System Candles ist das visuelle Kernsystem des FX Trading Projekts Shadow Operation. Es basiert auf KI-Logik (integrierte Entscheidungsfindung von ADX und gleitenden Durchschnitten), eliminiert Rauschen und visualisiert die "wahre Trendrichtung" des Marktes mit Kerzenfarben.
*Dieses Tool erzeugt keine Pfeilsignale. Das Tool kann zum Training verwendet
FREE
<div class="atten"> Other profitable programs <a href=" https://www.mql5.com/en/users/ifyjava/seller " target="_blank"> https://www.mql5.com/en/users/ifyjava/seller< ;/a> </div> Der FNCD-Indikator stellt ein fortschrittliches Werkzeug der technischen Analyse dar, das die Fisher-Transformation mit statistischer Preisnormalisierung kombiniert, um einen ausgeklügelten Oszillator zu schaffen. Die Grundlage beginnt mit der Z-Score-Normalisierung, bei der Preisdaten standardisiert werden,
FREE

Er prognostiziert die wahrscheinlichste kurzfristige Kursbewegung auf der Grundlage fortgeschrittener mathematischer Berechnungen.
Merkmale Schätzung der unmittelbaren Preisbewegung; Berechnung des tatsächlichen Markttrends; Berechnung der wichtigsten Unterstützungs- und Widerstandsniveaus; Optimierte Algorithmen für die Durchführung komplexer mathematischer Berechnungen bei minimaler Beanspruchung der Systemressourcen; Selbstanpassung für eine bessere Leistung, so dass es in der Lage ist, bei
FREE

Sehen Sie sich meinen TRADE PLANNER MT5 an - dringend empfohlen, um Kontoszenarien zu antizipieren, bevor Sie Geld riskieren. Dies ist der Bill Williams Awesome Oscillator-Indikator, der aus Heikin Ashi-Kerzen berechnet wird. Hier finden Sie ein mehrfarbiges Histogramm, das hilfreich ist, wenn Sie Schwäche oder Stärke des Trends auf dem Markt erkennen wollen. Um ihn zu verwenden, legen Sie ihn einfach auf dem Chart ab und Sie müssen keine Parameter ändern, außer einem: zwischen Heikin Ashi und
FREE

(Google-Übersetzung) Die standardmäßige Heikin Ashi -Kerzendarstellung hat einen offenen Wert, der einem Exponential entspricht Gleitender Durchschnitt (EMA) des Gesamtpreises , von dem der Alpha -Wert des EMA festgelegt ist bei 0,5 (entspricht einer EMA -Periode von 3,0). In dieser dynamischen Version kann der Punkt auf einen beliebigen Wert geändert werden, den man verwenden möchte, was einem auch erlaubt ist ungefähre Multi-Time-Frame-Analyse oder verwenden Sie den niedrigen oder hohen Wert a
FREE

Verbessern Sie Ihre Analyse mit dem Weis Wave Box ! Wenn Sie Präzision und Klarheit beim Trading suchen, ist das Weis Wave Box das ideale Tool. Dieser fortschrittliche Volumenwellen-Indikator bietet eine klare Visualisierung der Dynamik zwischen Aufwand und Ergebnis auf dem Markt – unverzichtbar für Trader, die Orderflow und Volumen lesen. Hauptfunktionen: Anpassbare Volumenwellen – in Ticks einstellbar, um Ihre Strategie zu unterstützen.
Anpassbarer Verlauf – analysieren Sie spezifis

Mahdad Candle Timer ist ein leichtgewichtiger und präziser Indikator für MetaTrader 5, der die verbleibende Zeit bis zum Schließen der aktuellen Kerze direkt neben der letzten Bar anzeigt. Er wurde für Trader entwickelt, die auf exaktes Timing angewiesen sind – sei es beim Scalping, Daytrading oder beim Warten auf die Bestätigung einer Kerze in Swing‑Setups. Hauptfunktionen Exakter Countdown – Restzeit im Format HH:MM:SS (optional Millisekunden) Dynamische Platzierung – Immer an der letzten
FREE
True TrendLines MT5 - Intelligente Trenderkennung und Warnungen Überblick True TrendLines MT5 ist ein professionelles technisches Analysetool, das automatisch Trendlinien mit hoher Wahrscheinlichkeit auf Ihren MetaTrader 5-Charts identifiziert und einzeichnet. Mit Hilfe eines ausgeklügelten Algorithmus zur Erkennung von Umkehrpunkten hilft es Händlern, die wichtigsten Marktstrukturen und potenzielle Umkehrpunkte präzise zu visualisieren. Hauptmerkmale Automatische Trendlinien-Erkennung Ident
FREE

In dieser Version funktionieren die Alarme, und in der von Ihnen geposteten Version war die atr-Totzone nur eine Totzone ohne atr, also haben Sie sie auch zu einer atr-Totzone gemacht.
Eingabeparameter des Indikators input int Fast_MA = 20; // Zeitraum des schnellen gleitenden MACD-Durchschnitts input int Slow_MA = 40; // Periode des langsamen gleitenden MACD-Durchschnitts input int BBPeriod=20; // Bollinger-Periode input double BBDeviation=2.0; // Anzahl der Bollinger-Abweichungen input int Se
FREE

CandleForce Pro: Das ultimative Dashboard zur Entscheidungsunterstützung für moderne Trader Einführung: Das Chaos der modernen Märkte überwinden
Auf den hypervernetzten Finanzmärkten von heute steht der moderne Trader vor dem Paradoxon der Auswahl. Wir werden mit einem endlosen Strom von Daten, Indikatoren, Nachrichten und Strategien überschwemmt, die alle versprechen, die Geheimnisse des profitablen Handels zu entschlüsseln. Diese ständige Flut führt oft zu einer "Analyseparalyse" - einem Zus
FREE
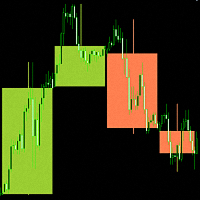
" Candlesticks MTF 5" ist ein Informationsindikator, der "Japanische Candlesticks" anzeigt. Der Indikator analysiert und bestimmt die Eröffnungs- und Schlusszeiten von Kerzen aus höheren Zeitrahmen.
Für den Indikator "Candlesticks MTF 5" wurde ein Algorithmus entwickelt, der die Diskrepanz zwischen den Eröffnungs- und Schlusszeiten von Kerzen aus höheren Zeitrahmen korrigiert. Wenn zum Beispiel der Eröffnungszeitpunkt einer Kerze auf einem wöchentlichen Zeitrahmen der 1. des Monats ist und auf
FREE

Visualisieren Sie das Markt-Momentum mit Präzision MultiMA_ICHIMOKU_STO_Color ist ein umfassendes Werkzeug für die technische Analyse, das entwickelt wurde, um klare Marktsignale zu liefern, indem es drei leistungsstarke Indikatoren in einem intelligenten System kombiniert. Dieser Indikator integriert drei anpassbare gleitende Durchschnitte (Moving Averages), Schlüsselkomponenten der Ichimoku-Wolke und den Stochastik-Oszillator. Sein einzigartiges Merkmal ist das intelligente Kerzen-Farbsystem,
FREE

Bollinger Bands Stop Indicator holds significant importance for traders navigating the complex world of financial markets. Its relevance lies in several key aspects. Firstly, it aids in trend identification. By analyzing price movements relative to the Bollinger Bands, traders can discern whether the market is in an uptrend, downtrend, or ranging phase. Secondly, the indicator provides valuable insights into market volatility. Wider bands indicate higher volatility, while narrower bands suggest
FREE

Indikator für wichtige Kursniveaus Indikator, der die Höchst- und Tiefstwerte der wichtigsten Kursniveaus für vergangene Zeiträume anzeigt, die als Reaktionsniveau in Frage kommen. Der Indikator zeigt die folgenden Kursniveaus an: Höchst- und Tiefststand von gestern Vorgestern Hoch und Tief Hoch und Tief von vor zwei Tagen Höchst- und Tiefststand der letzten Woche Höchst- und Tiefststand des letzten Monats Höchst- und Tiefstwerte der letzten drei Monate (Quartal) Höchst- und Tiefstwerte des letz
FREE
Der Round-Level-Indikator zeichnet automatisch psychologisch bedeutsame Kursniveaus direkt auf Ihrem Chart ein.
Diese runden Zahlen dienen oft als wichtige Unterstützungs- und Widerstandszonen in allen Märkten und Zeitrahmen.
Round Levels werden in meinem automatisierten EA verwendet: Opal Dieser Indikator funktioniert am besten, wenn er mit anderen Tools und Strategien kombiniert wird, z.B.: Preis-Aktions-Strategien
Runde Levels stimmen oft mit wichtigen Unterstützungs-/Widerstandszonen übere
FREE

Diese Handelsstrategie basiert auf Open-Close Crossovers , einer Methode zur Analyse von Kursbewegungen, die auf dem Verhältnis zwischen den Eröffnungs- und Schlusskursen eines Balkens beruht. Das System ist so konzipiert, dass es potenzielle Einstiegs- und Ausstiegspunkte identifiziert, wenn sich diese Werte überkreuzen. Einrichtung und Anpassung Die Leistung der Strategie kann durch Anpassen der Auflösung angepasst werden. Eine höhere Auflösung, in der Regel das 3-4fache des Charts , kann ver
FREE

Dieser Indikator zeichnet automatisch die Unterstützungs- und Widerstandsniveaus (Key Levels) für Sie ein, sobald Sie ihn auf einem Chart abgelegt haben. So müssen Sie diese Niveaus nicht jedes Mal neu zeichnen, wenn Sie die Preise in einem Chart analysieren. Alles, was Sie tun müssen, ist, den Indikator auf ein Diagramm zu legen, die Einstellungen nach Ihren Wünschen anzupassen und ihn den Rest machen zu lassen.
Aber es kommt noch besser: Der Indikator ist absolut kostenlos! Für weitere Informa
FREE
AI Volatilitätskarte Die AI Volatility Map ist ein professioneller Indikator zur Analyse der Marktaktivität durch Messung der Spread- und Tick-Geschwindigkeit. Er bietet Händlern einen klaren Überblick über das Energieniveau des Marktes und hilft dabei, Perioden hoher Volatilität, geringer Aktivität oder plötzlicher Veränderungen des Momentums zu erkennen. Dieser Indikator ist besonders nützlich, um potenzielle Ausbrüche, Trendfortsetzungen oder tote Marktbedingungen zu erkennen. Hauptmerkmale:
FREE

SWIFT SNIPER COMBO - Fortgeschrittener Handelssignal-Indikator (nicht-umstreichend) Kurzer Einwurf: Ein Präzisions-Einstiegssystem, das einen schnellen/langsamen MA-Crossover mit einer robusten Swing-Pivot-Bestätigung verbindet, um Signale mit hoher Wahrscheinlichkeit, klare TP/SL-Levels und Echtzeit-Warnungen zu liefern - entwickelt für Händler, die saubere, nicht übermalende Signale und praktisches Risikomanagement wünschen. Was es tut (Kurzübersicht) SWIFT SNIPER COMBO kombiniert eine geglätt
FREE

Indikator-Übersicht Letzte Aktualisierungen: Update 23.02.2025: Diese Version enthält weitere Optimierungen für eine verbesserte Signalgenauigkeit. Aktualisierung 13.01.2025: Jetzt kompatibel mit der kommenden Web Request App, die den AutoSignal_Connection Bot ersetzen wird. Zweck
Dieser MT5-Indikator wurde für die Analyse von 3-Minuten-Heiken Ashi-Kerzen entwickelt und generiert Kauf- und Verkaufssignale auf der Grundlage von Überkreuzungen des gleitenden Durchschnitts (MA). Er liefert visuel

Touch VWAP ist ein Indikator, der es Ihnen ermöglicht, einen volumengewichteten Durchschnittspreis (VWAP) zu berechnen, indem Sie einfach die Taste "w" auf Ihrer Tastatur drücken und dann auf die Kerze klicken, die Sie berechnen möchten. Wenn Sie unter der Kerze klicken, wird der VWAP auf der Grundlage des Tiefstpreises mit dem Volumen berechnet, Wenn Sie auf den Kerzenkörper klicken, wird der VWAP auf der Grundlage des Durchschnittspreises und des Volumens berechnet, und wenn Sie auf die Kerze
FREE
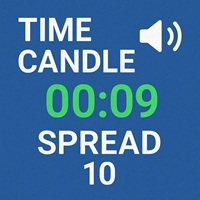
Zeitkerze mit akustischer Warnung
Dieser Indikator wird die verbleibende Zeit Kerze angezeigt werden Merkmale: 1. Multi Time Frames, Multi Paare 2. Linke Zeit 2. Positionsdynamik mit Geldkurs oder Rand des Chartbildschirms 3. Schriftgröße und -farbe 4. Anzeige von aktuellem Spread, maximalem Spread und minimalem Spread
Anmerkung: Maximum und Minimum Spread werden zurückgesetzt, wenn Sie die TF ändern . Getestet auf MT5 Version 5 Build 5200
Wenn Sie den Quellcode benötigen, senden Sie mir ein
FREE

If you love this indicator, please leave a positive rating and comment, it will be a source of motivation to help me create more products <3 So verwenden Sie die Slope Direction Line Aufwärtstrend: Wenn die SDL-Linie ansteigt und von rot auf grün wechselt, zeigt dies, dass der Kurs nach oben tendiert. Dies wird auch als Kaufsignal betrachtet. Abwärtstrend: Wenn sich die SDL-Linie nach unten neigt und von grün nach rot wechselt, zeigt dies an, dass der Kurs nach unten tendiert. Dies wird ebenfal
FREE

If you love this indicator, please leave a positive rating and comment, it will be a source of motivation to help me create more products <3 Was ist der Schaff-Trend-Zyklus-Indikator? Der Schaff Trend Cycle (STC) ist ein Indikator für die technische Analyse, der beim Handel und bei Investitionen eingesetzt wird, um Trends zu erkennen und Handelssignale zu generieren. Der STC wurde entwickelt, um Trends und Trendumkehrungen zu erkennen, indem er die Stärke des Trends und die Geschwindigkeit der
FREE

Want to AUTOMATE this strategy? We have released the fully automated Expert Advisor based on this logic. Check out Range Vector Fibo Logic EA here: https://www.mql5.com/en/market/product/158065
UPGRADE VERFÜGBAR: Haben Sie genug vom manuellen Handel? Ich habe gerade die automatisierte MTF-Version mit mobilen Alarmen und Auto-Targets veröffentlicht. Holen Sie sich die Pro Version hier: https://www.mql5.com/en/market/product/159350
Range Vector Fibo Logic (Indikator) Ein-Kerzen-Strategie
Wach
FREE

Dies ist die erweiterte Multi-Symbol- und Multi-Timeframe-Version des "Candle Pattern Finder"-Indikators ( Suche nach Candlestick-Mustern basierend auf dem Buch von Gregory L. Morris "Candlesticks charting explained. Zeitlose Techniken für den Handel mit Aktien und Futures" ). Der Indikator sucht nach Candlestick-Mustern für ALLE Symbole des "Market Watch"-Fensters und für ALLE Standard-Zeitrahmen von M1 bis MN1. Wenn die Muster auf einem beliebigen Symbol/Zeitrahmen erscheinen, gibt der Indikat

F ür Feedback, kostenlose Verbindung zum Signal, PARTNERPROGRAMM und detaillierte Informationen : Facebook Willkommen zum Indikator "Breakeven Line", Version 1.1, entwickelt von Sergei Ivanov im Jahr 2025. Visualisieren Sie die Breakeven-Preise für Ihre Trades mit Präzision und Leichtigkeit. Beschreibung des Advisors Die "Breakeven Line" ist ein MetaTrader (MQL5) Indikator, der die Breakeven Preisniveaus für offene Kauf- und Verkaufspositionen für das aktuelle Symbol anzeigt, wobei Kommissio
FREE

Dies ist der Stargogs Volatilitätspfeil V1 Yeahhh!!! Dieser Pfeil basiert auf Trend, Unterstützung und Nachfrage und basiert auf EMA's. Sie können die Parameter oder Einstellungen nach Belieben ändern. Senden Sie mir eine Nachricht für das System, das am besten mit diesem Indikator funktioniert (inklusive: Template, und andere Indikatoren). Dieser Indikator funktioniert mit allen Währungspaaren, allen Volatilitätsindizes, allen Indizes, Boom & Crash Indizes, Gold und NASDAQ. Funktioniert auf all
FREE

INDICATOR: Trendlinie GEN INDICATOR: Trendlinie GEN Entwickler: gedeegi Allgemeine Beschreibung Trend Line GEN adalah indikator yang secara otomatis menggambar trendline berdasarkan titik-titik swing penting (highs dan lows) pada chart. Dieser Indikator kann als Unterstützung und Widerstand dienen, um den Handel zu unterstützen. Hauptmerkmale Automatische Swing-Erkennung: Mengidentifikasi pivot high dan pivot low secara otomatis. Flexible Slope-Berechnung: Pilihan metode perhitungan kemiringan
FREE

Clock GMT Live hat alles, was Sie brauchen, um mehr über unseren Broker zu erfahren. Sie werden sich oft gefragt haben, in welcher GMT ich mich befinde oder an welcher GMT mein Broker arbeitet. Nun, mit diesem Tool können Sie sowohl die GMT in Echtzeit kennen Zeitversatz des Brokers und Ihrer Ortszeit kennen Sie auch ständig den Ping des Brokers Indem Sie es einfach zu einer Tageszeit platzieren, können Sie die Informationen erhalten
Der Preis steigt für jede Akquisition, damit werden wir schü
FREE

Das Impulssystem wurde erstmals im Buch "Come into my Trading Room" beschrieben. Es verwendet die Richtung sowohl des MACD-Histogramms als auch eines exponentiellen gleitenden Durchschnitts (EMA) des Preises, um einen Impuls zu definieren. Die Regel ist, niemals gegen den Impuls zu handeln.
Sein Farbcode gibt Ihnen mehrere Signale: Wenn sowohl der EMA als auch das MACD-Histogramm steigen, färbt das Impulssystem die Balkenfarbe grün (kein Shorten erlaubt). Wenn sowohl der EMA als auch das MACD-

Der volumengewichtete Durchschnittspreis (VWAP) ist ein von den großen Akteuren häufig verwendeter Handelsmaßstab, der den Durchschnittspreis angibt, zu dem ein Symbol während des Tages gehandelt wurde. Er basiert sowohl auf dem Volumen als auch auf dem Preis. Zusätzlich haben wir in diesen Indikator den MVWAP (Moving Volume Weighted Average Price) aufgenommen. Für diejenigen, die den Gebrauch und die Bedeutung dieses Indikators nicht kennen, empfehle ich einen großartigen Artikel über dieses T
FREE

Der gleitende T3-Durchschnitt von Tillson wurde der Welt der technischen Analyse in dem Artikel "A Better Moving Average" vorgestellt, der in der amerikanischen Zeitschrift Technical Analysis of Stock Commodities veröffentlicht wurde. Der von Tim Tillson entwickelte gleitende Durchschnitt faszinierte schon bald die Analysten und Händler auf den Futures-Märkten, da er die Preisreihen glättet und gleichzeitig die für Trendfolgesysteme typische Verzögerung (Lag) verringert.
FREE

Der von Charles Le Beau entwickelte und in den Büchern von Alexander Elder vorgestellte Chandelier Exit setzt einen nachlaufenden Stop-Loss auf der Grundlage der Average True Range (ATR). Der Indikator wurde entwickelt, um Händler in einem Trend zu halten und einen vorzeitigen Ausstieg zu verhindern, solange der Trend anhält. Typischerweise liegt der Chandelier Exit während eines Abwärtstrends über den Kursen und während eines Aufwärtstrends unter den Kursen.
Berechnung
Die ursprüngliche Ch
FREE

Ein symmetrisches Dreiecks-Chartmuster stellt eine Phase der Kontraktion und Konsolidierung dar, bevor der Preis gezwungen ist, nach oben auszubrechen oder zusammenzubrechen. Ein Bruch von der unteren Trendlinie markiert den Beginn eines neuen Abwärtstrends, während ein Ausbruch von der oberen Trendlinie den Beginn eines neuen Aufwärtstrends anzeigt.
MT4-Version hier verfügbar: https://www.mql5.com/en/market/product/68709/
Dieser Indikator identifiziert diese Muster und warnt Sie, wenn sich d

ATR-basierter Swing Trader-Indikator Beschreibung Der ATR-basierte Swing-Trader-Indikator ist ein hochentwickeltes technisches Analysetool für MetaTrader 5 (MT5), das Swing-Tradern dabei hilft, potenzielle Kauf- und Verkaufssignale auf der Grundlage der Average True Range (ATR) und der Trendrichtung zu erkennen. Der von Rahulkumar Kanani entwickelte Indikator nutzt die Volatilität und die Preisbewegung, um umsetzbare Handelssignale zu generieren, und eignet sich daher für Händler, die kurz- bis
FREE

The TMA Centered Bands Indicator for MT5 draws bands on the chart and shows the overall price trend. It displays three bands - the lower and upper boundaries of the channel and the median. The bands are made up of moving averages, and each of them has an MA period. The name TMA comes from triangular moving averages, as the indicator draws triangular bands. The price will fluctuate between these ranges whenever the trend changes direction, thus creating entry and exit points. How to trade
FREE
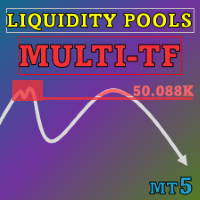
Special offer : ALL TOOLS , just $35 each! New tools will be $30 for the first week or the first 3 purchases ! Trading Tools Channel on MQL5 : Join my MQL5 channel to update the latest news from me Der Liquidity Pools -Indikator ist ein fortschrittliches Werkzeug, das potenzielle Liquiditätszonen im Chart erkennt und markiert, indem er Bereiche mit häufigen Dochtberührungen, die Anzahl der Wiederholungen und das gehandelte Volumen in jeder Zone analysiert. Dieses Tool bietet Trader
MetaTrader Market bietet jedem Entwickler eine einfache und bequeme Plattform für den Verkauf von Programmen.
Wir unterstützen Sie bei der Veröffentlichung des Produkts und beraten Sie gerne, wie man eine Beschreibung für den Market vorbereitet. Alle Produkte, die im Market verkauft werden, sind durch eine zusätzliche Verschlüsselung geschützt und können nur auf dem Rechner des Kunden gestartet werden. Illegales Kopieren ist ausgeschlossen.
Sie verpassen Handelsmöglichkeiten:
- Freie Handelsapplikationen
- Über 8.000 Signale zum Kopieren
- Wirtschaftsnachrichten für die Lage an den Finanzmärkte
Registrierung
Einloggen
Wenn Sie kein Benutzerkonto haben, registrieren Sie sich
Erlauben Sie die Verwendung von Cookies, um sich auf der Website MQL5.com anzumelden.
Bitte aktivieren Sie die notwendige Einstellung in Ihrem Browser, da Sie sich sonst nicht einloggen können.