Technische Indikatoren für den MetaTrader 5 - 15

Der Indikator setzt den Ansatz des Autors bei der Konstruktion des beliebten "Zig-Zag"-Indikators um.
Die Vorteile des "ZIgZag Level"-Indikators liegen darin, dass er das Marktrauschen herausfiltert und Niveaus anzeigt.
"ZIg Zag Level" basiert auf Spitzen und Tälern, zeigt Niveaus an.
Diese Niveaus können deaktiviert und konfiguriert werden.
Der Indikator zeigt den Preis des Niveaus an, das Preisschild kann deaktiviert werden.
Die "Zickzack"-Linie zwischen den Punkten kann ebenfalls deakti
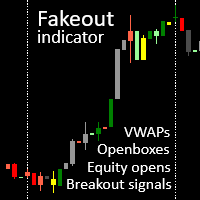
akeout Kerzenindikator mit Session VWAPs, Openboxes und Openbox Breakout Signalen. Sehen Sie sich unsere anderen Produkte für fxer.net an:
https://www.mql5.com/en/market/product/114888
https://www.mql5.com/en/market/product/114890 Wichtigste Merkmale 1. VWAPS für Tokio, London und NY Sitzungen 2. Openboxes für die Sitzungen in Tokio, London und NY 3. Farbige Kerzen für Ausbrüche, Fakeouts und Innenkerzen 4. Offene Linie für Aktien 5. Openbox-Erweiterungen 6. Ungekürzte Aktieneröffnungskurse fü
FREE

Der Indikator bestimmt die Richtung der Preisbewegung, berechnet die Möglichkeit des Einstiegs in den Markt anhand einer internen Formel und zeigt ein Einstiegssignal für den Ausbruch an. Die Signale des Indikators erscheinen sowohl zu Beginn von Trendbewegungen als auch in der Gegenrichtung, was Ihnen ermöglicht, Aufträge unter allen Marktbedingungen so effizient wie möglich zu öffnen und zu schließen. Version für МТ4: https://www.mql5.com/en/market/product/58349
Vorteile: eine einzigartige Fo
FREE

Highlights Handelssitzungen auf dem Chart
Trading Sessions Indikator hebt die Starts und Enden der einzelnen Handelssitzungen. Die kostenpflichtige Version des Produkts Trading_Sessions_Indicator_Pro mit der Möglichkeit, den Start /das Ende von Sitzungen individuell anzupassen >>>
[OPTIONEN:] Timeshift - Verwenden Sie, wenn Sitzungen zeitlich verschoben werden
[Sollwert:] Asian session Open=0; Asian session Close=9; Asian session OpenSummertime=1; Asian session CloseSummertime=10; European s
FREE

Ein visueller Indikator für Währungstrends und -stärken, mit einem Histogramm und einer Tabelle im Hauptdiagramm, einem Währungstrenddiagramm und einem Analyseblock in einem zusätzlichen Diagrammfenster. Er analysiert 28 Währungspaare, die sich aus 8 Hauptwährungen zusammensetzen (EUR, USD, GBP, JPY, AUD, CAD, CHF und NZD). Fähigkeiten des Indikators Bestimmt die Richtung und Stärke des Trends von Währungen und Symbolen und erstellt auf dieser Grundlage mehrfarbige Histogramme, Tabellen, Informa

Für diejenigen, die gerne mit den Heikin Ashi Candlesticks handeln, gibt es hier einen mächtigen Verbündeten: Heikin Ashi Delta . Dieser Indikator wurde von Dan Valcu in seinem Buch über Heikin Ashi Candlesticks mit dem Titel "Heikin Ashi - How To Trade Without Candlestick Patterns " vorgestellt - und übrigens ist dies ein sehr cooles Buch, das wir absolut empfehlen. Selbst diejenigen unter Ihnen, die nicht mit Heikin Ashi Candlesticks handeln, können diesen Leitindikator trotzdem verwenden. Er
FREE

Produkttitel: Break of Structure (BOS) Signal Indikator (Preis-Aktion / SMC) Produkt-Beschreibung: Identifizieren Sie mühelos potenzielle Trendfortsetzungen mit dem Break of Structure (BOS) Signalindikator für MetaTrader 5. Dieser Indikator wurde für Händler entwickelt, die Price Action und Smart Money Concepts (SMC) verwenden, und erkennt und markiert automatisch potenzielle BOS-Ereignisse direkt in Ihrem Chart. Ein Break of Structure ist ein Schlüsselkonzept, bei dem sich der Kurs entscheidend

Beschreibung CAP Channel & Hull Moving Average Crossing Strategy ist ein leistungsstarker und intelligenter Handelsindikator, der entwickelt wurde, um hochwahrscheinliche Marktumkehrungen und trendbasierte Einstiegspunkte zu identifizieren. Dieser Indikator kombiniert die Stärke des CAP-Kanals und des Hull Moving Average (HMA) , um Kursübertreibungen und bestätigte Umkehrungen zu erkennen. Wenn sich der Kurs außerhalb des CAP-Kanals bewegt und dann mit der Bestätigung des Hull-MA wieder in den K
FREE
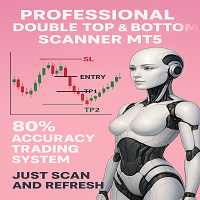
N/B : Alle unsere Produktkauf kommt mit unserem kostenlosen ''DAILY SCALPER EA'' - bit .ly/4qlFLNh Whatsapp Entwickler für Ihre nach erfolgreichem Kauf
PROFESSIONELLER DOPPEL-TOP/BOTTOM-MUSTER-SCANNER
Das ultimative Reversal Trading System für Forex & Crypto Trader
TRANSFORMIEREN SIE IHR TRADING MIT SOFORTIGER MUSTERERKENNUNG
Sind Sie es leid, profitable Umkehr-Setups zu verpassen? Sind Sie es leid, stundenlang auf Charts zu starren und zu versuchen, doppelte Tops und Bottoms zu erkennen? S

John Bollinger schuf diesen Indikator im Jahr 2010 als eine Möglichkeit, den ursprünglichen Indikator (Bollinger Bands) auf eine "technischere" Weise zu lesen, die als Oszillator dargestellt wird. Der typische Bereich der Bollinger Bands %B ist 0 - 0,5 - 1,0, wobei "0" das untere Band, "0,5" das mittlere Band und "1" das obere Band darstellt. Die Linie auf dem Indikator stellt die Schlusskurse dar. So einfach ist das.
EINSTELLUNGEN
Zeitraum der Bollinger-Bänder-Analyse Standardabweichung Multip
FREE

B2U Marktstatussystem Teil des B2U-Marktzustands-Systems Eine professionelle Indikatorensuite zur Analyse von Marktstruktur, Trendstatus und Momentum. B2U Market State System의 구성 요소입니다. 시장 구조, 추세 상태, 모멘텀을 입체적으로 분석하기 위한 전문 인디케이터 시스템입니다. Konzentriert sich auf die Identifizierung von Trendstatus, Stärke und Nachhaltigkeit. B2U Ultimate HARSI ist ein Marktzustands- und Momentum-Indikator, der für diskretionäre Trader entwickelt wurde. Er visualisiert Trendrichtung, -stärke und -übergänge und hilft I

ICT Unicorn Killer - Vollständiger Liquiditätsumkehr-Detektor WICHTIG: Verwenden Sie ihn in Kombination mit dem Multi-Time-Frame 'Unicorn Hunter' (Scanner) für ein vollständiges Detektions- und Tötungssystem. https://www.mql5.com/en/market/product/153999
Unicorn Killer identifiziert hochwahrscheinliche Smart-Money-Reversal-Setups durch die Kombination von fünf wichtigen technischen Zusammenhängen in einem übersichtlichen visuellen Tool: Fractals → Liquidity Sweep → Break of Structure → Breaker
FREE
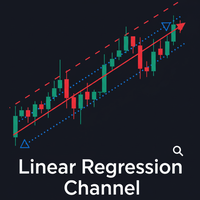
Der lineare Regressionskanal ist ein leistungsstarkes technisches Analyseinstrument, mit dem sich der vorherrschende Trend und potenzielle Preiszonen visuell erkennen lassen. Im Wesentlichen erfüllt der Indikator zwei Hauptfunktionen: Er zeichnet eine Trendlinie durch das Zentrum des Preisgeschehens über einen bestimmten Zeitraum. Diese Linie wird mit Hilfe der linearen Regressionsmethode berechnet, die die bestmögliche "Linie der besten Anpassung" für die Kursdaten ergibt. Von dieser Mittellini
FREE

Candle Color Day – Farbindikator für Candlesticks je nach Wochentag
Was ist das? Ein einfaches visuelles Hilfsmittel, das Candlesticks in einem Chart je nach Wochentag farblich darstellt. Montag hat eine Farbe, Dienstag eine andere usw. Haben Sie sich jemals gefragt, wie häufig sich Kurse an bestimmten Wochentagen auf eine bestimmte Weise verhalten? Dieser Indikator hilft Ihnen, solche Muster zu erkennen.
Für wen ist er geeignet? Für Trader, die:
den Wochentag anhand historischer Daten schne
FREE

Dies ist ein Indikator für Quasimodo oder Over and Under Muster. Er findet automatisch die Swing-Punkte und kann sogar virtuelle Trades mit Stop Loss und Take Profit platzieren. Drücken Sie die Schaltfläche "Optimieren", um automatisch die effektivsten Einstellungen zu finden. Das Muster besteht aus vier Schenkeln A,B,C,D, wie in den Abbildungen gezeigt. Die Eröffnungs- und Schlusskurse der virtuellen Trades sind Geldkurse, aber die Statistiken im Anzeigefeld berücksichtigen den aktuellen Spread
FREE
Was ist der Chart Sync Indicator? Dieses benutzerdefinierte MQL5-Tool ermöglicht die Synchronisierung von Charts mit mehreren Zeitrahmen und behebt damit einen häufigen Schmerzpunkt in der technischen Analyse: die Inkonsistenzen beim Wechsel zwischen Chartfenstern oder Zeitrahmen. Anstatt jeden Chart separat zu verwalten, verbindet dieser Indikator sie so, dass Aktionen wie Schwenken, Zoomen, Zeichnen von Objekten oder Ändern von Symbolen in allen synchronisierten Charts desselben Symbols gespie
FREE

## Tägliches Hoch Indikator - Danilo Monteiro - MT5
## Beschreibung Der Daily High/Low Labels ist ein angepasster Indikator für MetaTrader 5, der automatisch Tageshöchst- und -tiefststände auf dem Chart anzeigt und so die schnelle Identifizierung wichtiger Kursniveaus erleichtert. Der Indikator markiert die Kurse mit Etiketten und horizontalen Linien und ermöglicht so eine klare Visualisierung der kritischen Niveaus des aktuellen Tages und des Vortages.
## Hauptmerkmale
### 1. Automatische Ke
FREE
Sind Sie es leid, dass diese alten, langweiligen TP- und SL-Linien Ihre Charts verunstalten? Jetzt kostenlos, zur Feier der Veröffentlichung des Live Chart Viewer Dienstprogramms https://www.mql5.com/en/market/product/158488
Kämpfen Sie damit, Ihre Trades so zu präsentieren, dass sie tatsächlich Aufmerksamkeit erregen ?
Keine Sorge, wir stellen Ihnen die ultimative Lösung vor, auf die Sie gewartet haben... Der TPSL Bounding Box PRO Indikator! PRO Version (mit Risiko-Ertrags-Verhältnis
FREE

VolumeBasedColorsBars - Kostenlose leistungsstarke Volumenanalyse für alle Trader
Entschlüsseln Sie die verborgene Geschichte hinter jedem Kursbalken! VolumeBasedColorsBars ist ein professioneller, 100% KOSTENLOSER Indikator, der Ihre Chartkerzen auf der Grundlage einer echten, adaptiven Volumenanalyse einfärbt. Erkennen Sie sofort einen Anstieg der Marktaktivität, identifizieren Sie eine Erschöpfung und fangen Sie die Bewegungen ein, auf die es ankommt.
Dieser Indikator bietet Ihnen : - Dyna
FREE

Wir stellen den leistungsstarken NRTR (Nick Rypock Trailing Reverse) Indikator vor - ein unverzichtbares technisches Werkzeug für Trader, die Trendumkehrungen erkennen und effektive Trailing-Stop-Levels setzen möchten. Entwickelt von Nick Rypock, verfügt dieser Indikator über einen einzigartigen Algorithmus, der sich an die sich ständig ändernden Marktbedingungen anpasst und somit eine wertvolle Ergänzung für das Repertoire eines jeden Traders darstellt.
Hier sind die beiden beliebtesten Wege,
FREE

Fimathe-Indikator Der Fimathe-Indikator ist ein Tool für MetaTrader 5, das Händlern hilft, Unterstützung, Widerstand, neutrale Zonen und Preiskanäle zu erkennen. Er verfügt über eine interaktive Schnittstelle zum Zeichnen und Verwalten von Unterstützungs- und Widerstandsniveaus, zum Erzeugen von Take-Profit-Kanälen und neutralen Zonen sowie zum Bereitstellen von visuellen und akustischen Warnungen bei Ausbrüchen. Hauptmerkmale Unterstützungs- und Widerstandslinien: Dynamische und verschiebbare L
FREE

Renko ist ein zeitloses Diagramm, dh es berücksichtigt nicht den Zeitraum, sondern die Preisänderung, wodurch die Preisänderung auf dem Diagramm klarer wird.
Hyper Renko ist der Indikator, der dies liefert.
Zum Konfigurieren haben Sie nur einen Parameter, die Größe der Kerze in dem Häkchen *, das Sie verwenden möchten.
* tick: ist die kleinstmögliche Variation eines Vermögenswerts.
Vielen Dank, dass Sie sich für einen Hyper Trader-Indikator entschieden haben.
Wikipedia: Ein Renko-Diagramm
FREE
Koryu Delta Koryu Delta ist ein MetaTrader 5 Indikator. Er identifiziert Trendwendepunkte mithilfe von Pivot-Punkt-Analyse und Delta-Volumen-Daten. Er erkennt Marktverschiebungsmuster und zeigt Signale basierend auf der Marktdynamik an. Das Tool eignet sich für Trader, die Scalping, Swing-Trading oder langfristiges Investieren betreiben. Es analysiert bis zu 500 historische Balken, um vergangene Muster zu erkennen. Für Signale wird die Closed-Bar-Logik verwendet.
Funktionen von Koryu Delta
Mu
FREE

Multi Currency Strength Dashboard Mini (KOSTENLOS) – Währungsstärke-Meter für MetaTrader 5 Multi Currency Strength Dashboard Mini ist ein kostenloser Indikator für MetaTrader 5 , der die relative Stärke von 8 Hauptwährungen (USD, EUR, GBP, JPY, CHF, CAD, AUD, NZD) in Echtzeit in einem klaren Dashboard anzeigt. Ziel: In wenigen Sekunden erkennen, welche Währungen stark bzw. schwach sind, um die Watchlist effizienter aufzubauen und Paare nach dem Prinzip stark vs. schwach auszuwählen. Hauptfunktio
FREE

Dieser Indikator hebt die asiatischen, Londoner und New Yorker Handelssitzungen auf Ihrem Chart durch farbige Rechtecke hervor. Er berechnet und zeigt automatisch den Höchst- und Tiefstkurs sowie die Preisspanne (in Pips) jeder Sitzung für den letzten Tag an. Die Sitzungsspannen werden für einen konfigurierbaren Rückblickzeitraum gezeichnet, so dass Sie die Kursentwicklung der Sitzung über mehrere Tage hinweg überprüfen können. Die wichtigsten Funktionen sind: Anpassbare Start- und Endzeiten der
FREE
Reversal Pattern AI - ein absoluter Durchbruch in der Welt der Indikatorenentwicklung, der Algorithmen der künstlichen Intelligenz, mehrstufige Marktanalysen und klassische Methoden der technischen Analyse kombiniert. Er erkennt nicht nur Umkehrmuster, sondern wertet auch Marktineffizienzen aus und generiert hochpräzise Handelssignale. Dank eines hybriden Modells, das Preisaktionsanalyse, Volumina, Volatilität, VWAP und Volume AVG % verwendet, passt sich der Indikator problemlos an alle Marktbed

Haben Sie genug von falschen Signalen? Handeln Sie mit zuverlässigen Kauf- und Verkaufspfeilen! Jetzt herunterladen und sehen, wie es funktioniert !
Trend Reverting PRO: Leistungsstarke Signale Geeignet für Trendfolge oder Trendhandel Signale werden nie neu gezeichnet, neu berechnet oder zurückgemalt
Dies ist eine KOSTENLOSE / DEMO / Version und funktioniert auf EURUSD M15, M30" (Demo-Version; keine Suffix/Präfix-Broker). Testen Sie es jetzt KOSTENLOS - sehen Sie echte Ergebnisse!
T
FREE

Der Multicurrency Strength Oscillator (MSO) ist ein Indikator für MT5, der eine wesentliche Weiterentwicklung des weithin bekannten RSI von J. Welles Wilder darstellt. Er weist eine größere statistische Aussagekraft auf und kann zuverlässigere Hinweise (auch mit Alarmen und Benachrichtigungen) über die überkauften/überverkauften Bedingungen sowohl von kleineren als auch von größeren Devisenpaaren liefern. Er wird durch die individuelle Messung und anschließende Kombination der relativen Stärke a

Amiguinho's Bar Counter ist ein Preisaktionsindikator zur Anzeige der Balkenanzahl (Kerzen) mit einigen interessanten Optionen.
Über den Parameter "Analysezeitraum": Wenn der aktuelle Zeitrahmen in Minuten angegeben ist, dann wird der Analysezeitraum in Tagen angegeben; wenn der aktuelle Zeitrahmen in Tagen angegeben ist, dann wird der Analysezeitraum in Monaten angegeben; oder wenn der Analysezeitraum in Jahren angegeben wird.
FREE

50% Rabatt. Ursprünglicher Preis: $60 Unterstützung und Widerstand Zonen Indikator für MT5 ist ein Multi-Timeframe-Panel und Warnung, die Unterstützung und Widerstand Zonen und Pivot-Punkte für alle Timeframes von MetaTrader 5 findet und gibt Alarm, wenn der Preis hat Interaktion mit ihnen. Demo-Version herunterladen (funktioniert mit den Symbolen GBPUSD, EURJPY und NZDUSD) Lesen Sie die vollständige Beschreibung der Scanner-Parameter auf der Blog-Seite . Viele einzigartige Funktionen in einem

CRUDE OIL BUY/SELL (3 Min) Technischer Überblick Der CRUDE OIL BUY/SELL-Indikator wurde für kurzfristige Trader entwickelt, die sich auf die Entwicklung des Rohölpreises konzentrieren.
Er identifiziert hochwahrscheinliche Kauf- und Verkaufschancen auf der Grundlage einer Kombination aus RSI-Niveaus , SMA-Trendpositionierung und Kerzenstrukturanalyse .
Dieses Tool ist besonders effektiv auf dem 3-Minuten-Zeitrahmen und liefert klare visuelle Signale und Warnungen sowohl für die Fortsetzung der Dy
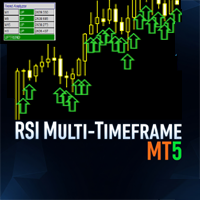
Der MultiFrameRSIIndicator ist ein leistungsstarker MetaTrader 5 (MT5) Indikator, der den Relative Strength Index (RSI) nutzt, um Trends über mehrere Zeitrahmen hinweg zu analysieren. Dieser Indikator synchronisiert RSI-basierte Trendsignale aus bis zu neun Zeitrahmen (M1, M5, M15, M30, H1, H4, D1, W1, MN1) und präsentiert sie mit klarem visuellen Feedback, einschließlich einer farbigen RSI-Linie, Signalpfeilen und einem anpassbaren Dashboard. Ideal für Händler, die eine momentumbasierte Trendbe
FREE
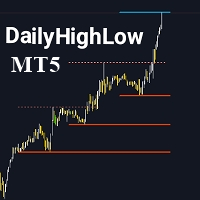
Bitte vergessen Sie nicht, den Indikator zu bewerten, um mir bei der Sichtbarkeit zu helfen. Der DailyHighLow Indikator ist für die MetaTrader 5 (MT5) Plattform entwickelt und hilft Tradern, tägliche Preisbewegungen zu überwachen. Dieser Indikator zeichnet automatisch Trendlinien basierend auf den Höchst- und Tiefstwerten eines bestimmten Zeitraums und bietet so visuelle Einblicke in den Markt. Hauptmerkmale: Anpassbare Trendlinien: Passen Sie die Farbe, den Stil und die Breite der Trendlinien
FREE

Dieser Indikator zeigt das Niveau der Break-Even-Linie für die Gesamtzahl der offenen Positionen des aktuellen Symbols mit P/L-Wert und Gesamtvolumen an. Dieser Indikator ist hilfreich, um das Ausstiegsniveau bei der Verwendung einer Handelsgitterstrategie zu bestimmen. Der Stil der Breakeven-Linie ist anpassbar, um die Farbe, Linienform und Schriftgröße der Positionsbeschreibung zu wählen. Senden Sie eine mobile Benachrichtigung, wenn ein positives P/L-Ziel überschritten wird.
FREE

Indikatorbeschreibung (basierend auf AVPT EA ):
Dieser Indikator visualisiert eine auf dem Volumenprofil basierende Liquiditätsarchitektur auf dem Chart, indem er analysiert, wo sich das Handelsvolumen über die Kursniveaus hinweg über einen bestimmten Rückblickzeitraum konzentriert. Er berechnet die wichtigsten Volumenstrukturen wie:
Point of Control (POC): das Preisniveau mit dem höchsten gehandelten Volumen.
Value Area (VA): der Bereich, der einen konfigurierbaren Prozentsatz des Gesamtvol
FREE

INDIKATOR: GEN TriFactaX Entwickler: gedeegi Allgemeine Beschreibung GEN TriFactaX ist ein technischer Indikator zur automatischen Erkennung und Visualisierung des 1-2-3 Patterns oder Preisumkehrmusters. Dieses Muster ist eine klassische Preisaktionsformation, die häufig von Händlern verwendet wird, um potenzielle Trendumkehrungen zu erkennen. Dieser Indikator zeigt nicht nur das 1-2-3-Muster auf dem Chart an, sondern identifiziert auch automatisch das Ausbruchssignal vom kritischen Niveau (Pun

Entwicklung der vorherigen Version des Indikators ZigZag WaveSize MT4 ZigZag WaveSize - modifizierter Standard-ZigZag-Indikator mit zusätzlichen Informationen über die Wellenlänge in Punkten, Ebenen und verschiedenen Warnungslogiken
Allgemeine Verbesserungen: Code-Anpassung für MetaTrader 5 Optimierte Arbeit mit grafischen Objekten Neuigkeiten: Horizontale Ebenen an Extremwerten Auswahl des Ebenentyps: horizontal/Strahlen/Segmente Filter für liquide Ebenen (nicht vom Preis durchbrochen) Puffer
FREE

Der Indikator analysiert das Diagramm und identifiziert Doji-Kerzenhalter. Zeigt ihr Aussehen und signalisiert das Aussehen einer solchen Kerze (falls in den Parametern erlaubt). Dieser Indikator zeigt auch die Stärke der Umkehrung in Form von Balken unterschiedlicher Farben (je grüner, desto wahrscheinlicher ein Anstieg, desto roter, ein Preisverfall). Die Richtung des Signals hängt von der Richtung der vorherigen Kerzen ab, da der Doji eine Umkehrung oder Korrektur signalisiert. In den Anzeig
FREE

Aroon Indikator - Vollständige Erklärung Aroon Indikator — Was er ist und wie er funktioniert Der Aroon -Indikator ist ein technisches Analysewerkzeug, das entwickelt wurde, um die Stärke eines Trends, dessen Beginn und dessen mögliches Auslaufen zu identifizieren. Er besteht aus zwei Linien: Aroon Up und Aroon Down . Diese Linien berechnen, wie viel Zeit seit dem letzten Hoch oder Tief vergangen ist, um die Trendintensität präzise zu bestimmen. Befindet sich Aroon Up nahe 100 und Aroon Down ble
FREE

AnomalyLogReturn: Statistischer Rand & Mittelwertumkehr AnomalyLogReturn ist ein hochpräzises statistisches Werkzeug, das auf Log Returns basiert. Es identifiziert Volatilitätsanomalien und Erschöpfungspunkte, bevor Kursumkehrungen auftreten. Warum Log Returns? Im Gegensatz zu Standardpreisen zeigen Log Returns "abnormale" Bewegungen, die für das bloße Auge unsichtbar sind und einen echten statistischen Vorteil bieten. Hauptmerkmale: Erkennung von Anomalien: Zeigt automatis
FREE
Fortgeschrittenes Marktanalyse-Tool. Full Documentation: Download Free Professional Education Course: After purchasing, contact me to receive access to the complete CDV Professional Training Video Course. — It will help you master CDV , Aggressive Buyer & Seller dynamics , and Volume Microstructure concepts through a clear, step-by-step learning process. Überblick Das Professional CDV mit Aggressive Score ist ein umfassendes Tool zur Volumenanalyse, das die visuelle Darstellung des kumulat

VWAP Fibo Bands RSJ ist ein Indikator, der die Linien des täglichen VWAP nachzeichnet und daraus Bänder mit Fibonacci-Proportionen erstellt. Dieser spektakuläre Indikator erstellt 10 Bandebenen durch den ausgewählten VWAP-Zeitraum unter Verwendung von Fibonacci-Verhältnissen.
Es ist fantastisch, wie die Preise jedes Niveau der Bänder respektieren, wobei man feststellen kann, dass fast jedes Mal, wenn der Preis über/unter einem Niveau der Bänder schließt, er das nächste anstrebt. Wenn er oberhal
FREE
Smart Volume Flow (Intelligenter Volumenfluss) Smart Volume Flow ist ein professionelles Volumenanalyse-Tool, das die Interpretation des Orderflusses auf ein höheres Niveau hebt. Es wurde entwickelt, um über das bloße Zählen von Balken hinauszugehen, indem es hybrides Volumen , Trendkontext , Multi-Timeframe-Filter und Validierung mit gerichteter Stärke (ADX und +DI/-DI) kombiniert. Sein Ziel ist es, die Marktaktivität zu zerlegen, zu gewichten und zu kontextualisieren , um Rohdaten in taktische

Schwerkraftbänder
Ein leistungsfähiges All-in-One-Marktstruktur-, Momentum- und Trend-Framework für jeden Intraday-Trader. Beachten Sie, dass nur 10 Exemplare zu 49 USD verkauft werden! Nächster Preis 69 USD (nur noch 3 Exemplare!!!) Mit dem Indikator erhalten Sie einen vollständigen mechanischen Handelsplan und einen kostenlosen EA-Code, um Ihren Handel zu automatisieren! Kontaktieren Sie uns , nachdem Sie den Indikator gekauft haben! Der Gravity Bands Indikator wurde für Trader entwickelt, die

Weis Wave nimmt zunächst das Marktvolumen und ordnet es dann zusammen mit dem Preis in Wellencharts an. Es ist die einzige Software, die das wahre Bild des Marktes vor Ihnen darstellt. Wenn jemand von Ihnen schon einmal eine Intraday-Kursbewegung beobachtet hat, dann wissen Sie, dass sie sich in einer Reihe von Verkaufs- und Kaufwellen entfaltet - ein Verfahren, das nach unten und nach oben geht. Die Wellenanalyse ist ein integraler Bestandteil der Handelsmethode. Der Indikator hilft, mit dem he
FREE

Die Non-Repaint-Zonen sind ein Zeitbasisindikator, der nach einer möglichen Umkehrung des Marktes für einen perfekten Einstieg sucht. Es liest die Geschichte und zeichnet die mögliche Zone für unseren Comfort. Der Indikator verfügt über vier verschiedene Zonen, die die Geschichte des Marktes über 10.000 vorherige Balken lesen und den möglichen Einstiegspunkt vorhersagen.
Es scannt bei jeder Markttrendänderung neu, um uns die mögliche Zone zu geben, es wird für den Handel mit allen Arten von Mär
FREE

Zeichnen von Pivot-Punkten Traditionnal, Fibonacci, Woodie, Classic, Demark, Camarilla für jeden Zeitrahmen
Unterstützt alle Arten von Pivots Traditionnal, Fibonacci, Woodie, Classic, Demark, Camarilla Unterstützt jeden Zeitrahmen (M1...H1...D1...MN1...Yearly) Unterstützt Server Sommerzeit Unterstützt den Forex-Tagesabschnitt von Sydney Open bis US Close Unterstützt den Krypto-Handel Fill The gap between pivot and the trend, sehr hilfreich
Pivot-Punkte zeigen die Richtung des Trends an und bi
FREE
[ MT4 Version ] [ Kill Zones ] [ SMT Divergenzen ] Wie man mit Orderblöcken handelt: Klicken Sie hier Leistung der Benutzeroberfläche : Während der Tests im Strategietester kann es zu Verzögerungen in der Benutzeroberfläche kommen. Seien Sie versichert, dass dieses Problem nur in der Testumgebung auftritt und keinen Einfluss auf die Leistung des Indikators im Live-Handel hat. Verbessern Sie Ihre Handelsstrategie mit dem Order Blocks ICT Multi TF-Indikator, einem hochmodernen Tool, das Ihre Hande

Was ist TREND VISION DAILY TREND VISION DAILY ist ein fortschrittlicher Multi-Timeframe-Trendrichtungsfilter , der entwickelt wurde, um eine klare, strukturierte und professionelle Einschätzung der Marktrichtung zu liefern.
Der Indikator fasst das Preisverhalten über mehrere Trend- und Momentum-Komponenten zusammen und gibt dem Trader einen zuverlässigen Überblick über den aktuellen Marktkontext. Es ist kein direkter Einstiegsindikator.
Es ist kein klassischer Oszillator. TREND VISION DAIL
FREE

TRUE TIMER - Kerzen-Countdown Echtzeit-Countdown-Timer (MM:SS), der die Sekunden bis zum Kerzenschluss in einem beliebigen Zeitrahmen anzeigt. Mit Hinweismeldungen, die Sie auf neue Kerzen aufmerksam machen. Hauptmerkmale: Präziser Server-Zeit-Countdown. Automatische Farberkennung (helle/dunkle Hintergründe). Intelligente "Neue Kerze" & Timing-Warnungen bei großen Bewegungen. Funktioniert auf allen Zeitrahmen M1 → Monatlich. Perfekt für: Scalper & präzises Einstiegs-Timing. Bitte teilen Sie Ihre
FREE

Der "BIG FIGURE INDICATOR" erkennt automatisch bestimmte Ebenen auf Preisdiagrammen und zeichnet horizontale Linien, wie z.B. ganze Zahlen oder halbe Zahlen (z.B. 1,0000 oder 1,5000 im Devisenhandel). Diese Ebenen gelten als psychologisch bedeutend, da sie runde Zahlen darstellen, auf die große Trader und Investoren sich konzentrieren können, was zu potenziellen Unterstützungs- oder Widerstandsniveaus führt. Der "big figure indicator" kann Händlern helfen, wichtige Preisniveaus zu identifizieren
FREE

Der Range Filter Buy and Sell Indikator ist ein trendfolgendes technisches Analysewerkzeug, das entwickelt wurde, um optimale Einstiegs- und Ausstiegspunkte im Markt zu identifizieren. Er filtert Marktgeräusche heraus, indem er dynamische Bänder um die Kursbewegungen herum erstellt und klare Kauf- und Verkaufssignale erzeugt, wenn der Kurs diese Bänder durchbricht. Hauptmerkmale Dynamische Bereichsfilterung : Verwendet einen hochentwickelten Algorithmus zur Berechnung adaptiver Bänder, die sich
FREE

Smart Entry Levels - Fraktaler und ATR-basierter Indikator Smart Entry Levels identifiziert wichtige Unterstützungs- und Widerstandszonen mithilfe der klassischen Fraktalerkennung und der ATR-basierten Volatilitätsmessung. Der Indikator ist auf Klarheit, Stabilität und Übereinstimmung mit den MQL5-Marktregeln ausgelegt. Merkmale Obere Zone - Widerstandsbereich basierend auf den jüngsten fraktalen Höchstständen Untere Zone - Unterstützungsbereich auf der Grundlage der jüngsten fraktalen Tiefststä
FREE

Ein Indikator für die Erkennung von FVGS
Ich hoffe, dies hilft Ihnen skalpieren und generieren Geld für sich
HINWEIS BESSER:
Trading ist riskant und Sie können alle Ihre Mittel zu verlieren, verwenden Sie das Geld, das Sie bereit sind zu verlieren
HINWEIS BESSER:
Trading ist riskant und Sie können alle Ihre Mittel zu verlieren, verwenden Sie das Geld, das Sie bereit sind zu verlieren
HINWEIS BESSER:
Trading ist riskant und Sie können alle Ihre Mittel zu verlieren, verwenden Sie das Geld
FREE

Hochgradig konfigurierbarer Macd-Indikator.
Merkmale: Hochgradig anpassbare Alarmfunktionen (bei Levels, Kreuzen, Richtungsänderungen per E-Mail, Push, Sound, Popup) Multi-Timeframe-Fähigkeit Farbanpassung (bei Pegeln, Kreuzen, Richtungsänderungen) Optionen für lineare Interpolation und Histogramm-Modus Funktioniert im Strategie-Tester im Multi-Timeframe-Modus (auch am Wochenende ohne Ticks) Einstellbare Levels Parameter:
Stochastic RSI Timeframe: Sie können den unteren/höheren Zeitrahmen für
FREE

Wenn Ihnen dieser Indikator gefällt, hinterlassen Sie bitte eine positive Bewertung und einen Kommentar, es wird eine Quelle der Motivation sein, mir zu helfen, mehr Produkte zu schaffen <3 Wichtigste Erkenntnisse Liefert sowohl Trend- als auch Momentum-Signale in einer einzigen Ansicht. Ein- und Ausstiegssignale basieren auf dem Crossover von RSI und Signallinie. Market Base Line bietet einen Einblick in die allgemeine Trendrichtung. Volatilitätsbänder helfen, überkaufte und überverkaufte Mark
FREE

N/B : Alle unsere Produktkäufe kommen mit unserem kostenlosen ''DAILY SCALPER EA'' - bit .ly/4qlFLNh Whatsapp Developer für Ihren nach erfolgreichem Kauf
OMEGA ONE SPIKE DETECTOR: Fangen Sie jede explosive Bewegung /Spikes mit chirurgischer Präzision
"Früher sah ich zu, wie Spikes vorbeiflogen - jetzt fange ich sie konsequent mit institutionellen Orderlevels ab"
Sie beobachten den 500-Punkte-Spike und profitieren nicht? ZU SPÄT eingestiegen , nachdem die große Bewegung bereits stattgefunden

Der ICT Concepts-Indikator fasst die wichtigsten Konzepte des Traders und Ausbilders "The Inner Circle Trader" (ICT) in einem All-in-One-Toolkit zusammen. Zu den Funktionen gehören Marktstruktur (MSS & BOS), Orderblöcke, Ungleichgewichte, Liquidität auf der Kauf-/Verkaufsseite, Verschiebungen, ICT-Killzones und neue Wochen-/Tageseröffnungslücken. Das ist eine Art von Smart Money-Konzepten. ANWENDUNG: Bitte lesen Sie dieses Dokument ! DETAILS Struktur des Marktes Marktstruktur-Etiketten wer
Strong Bull V7 B&C Der ultimative M5-Indikator für Boom & Crash-Indizes, der klare, gefilterte Kauf-/Verkaufssignale liefert, um Marktgeräusche zu eliminieren und Ihre Handelspräzision zu verbessern. Vorteilsorientiert Meistern Sie die volatilen Boom & Crash-Märkte mit Strong Bull V7 B&C . Dieser intelligente Indikator bietet klare visuelle Pfeile und Textbeschriftungen für wahrscheinliche Setups auf dem M5-Zeitrahmen. Seine einzigartige Technologie zur Filterung von Symbolen blendet automatisch

Der ATR-Exit-Indikator verwendet den Kerzenschluss + ATR-Wert, um Trailing-Stop-Linien zu ziehen (orange unter Käufen, magenta über Verkäufen), die mit dem Trend vorrücken, bis der Trend seine Richtung ändert. Er verwendet ein Vielfaches der Average True Range (ATR), indem er ihren Wert vom Schlusskurs bei Käufen subtrahiert und ihren Wert zum Schlusskurs bei Verkäufen addiert. Außerdem werden die Trailing-Stop-Linien so generiert, dass sie die Trendrichtung des Auftrags (Long oder Short) unter
FREE

Dieser Indikator findet Three-Drives-Muster. Das Three-Drives-Muster ist ein 6-Punkte-Umkehrmuster, das durch eine Reihe höherer Hochs oder niedrigerer Tiefs gekennzeichnet ist, die an einer 127%- oder 161,8%-Fibonacci-Erweiterung enden. Es signalisiert, dass der Markt erschöpft ist und ein Umschwung stattfinden kann. [ Installationsanleitung | Update-Anleitung | Fehlerbehebung | FAQ | Alle Produkte ] Anpassbare Mustergrößen
Anpassbare Farben und Größen
Anpassbare Ausbruchsperioden Anpassbare 1-
FREE

Dies ist der berühmte Sunflower-Indikator für Metatrader5. Dieser Indikator markiert mögliche Höchst- und Tiefststände auf Kurscharts. Der Indikator identifiziert Höchst- und Tiefststände in der Kursgeschichte des Vermögenswerts. Beachten Sie, dass sich die aktuelle Sonnenblume der letzten Kerze neu färbt, da es nicht möglich ist, einen Höchststand zu identifizieren, bis der Markt sich umkehrt, und es ist auch nicht möglich, einen Tiefststand zu identifizieren, ohne dass der Markt aufhört zu fa
FREE

Bessere Perioden-Trennzeichen für MetaTrader 5 Die eingebaute Perioden-Trennzeichen-Funktion erlaubt es dem Benutzer nicht, den Zeitraum zu spezifizieren. Daher können Sie diesen Indikator verwenden, um besser anpassbare Perioden-Trennzeichen zu erstellen. Auf Intraday-Charts können Sie Periodenseparatoren zu einem bestimmten Zeitpunkt platzieren. Sie können auch zusätzliche Periodenseparatoren zu einem bestimmten Zeitpunkt am Montag platzieren, um den Beginn einer Woche zu markieren. Auf Charts
FREE

Der Supertrend-Indikator ist ein trendfolgendes technisches Analyseinstrument, das Händlern helfen soll, die Richtung von Markttrends und potenzielle Einstiegs- und Ausstiegspunkte zu erkennen. Er arbeitet auf der Grundlage von Kursdaten und Average True Range (ATR), um eine dynamische Signallinie zu erstellen, die je nach aktuellem Trend die Farbe ändert. Grüne Farbe: Zeigt einen Aufwärtstrend an. Rote Farbe: Zeigt einen Abwärtstrend an. Supertrend ist ein nützlicher Indikator sowohl für den ku
FREE
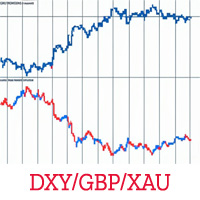
Übersicht Eröffnen Sie sich eine neue Perspektive auf Ihre Charts mit dem KS Invert Chart Pro Indikator - einem leistungsstarken, verzögerungsfreien Tool, das exklusiv für MetaTrader 5 entwickelt wurde. Dieser innovative Indikator invertiert Balken oder Kerzen auf mathematische Weise (durch Multiplikation der Preisdaten mit -1) und enthüllt so verborgene Muster, konträre Gelegenheiten und umgekehrte Korrelationen, die traditionellen Ansichten entgehen könnten. Perfekt für fortgeschrittene Händle
FREE
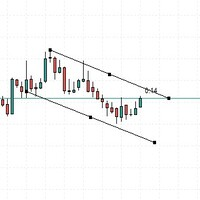
Dieser Indikator dient dazu, akustische Warnungen zu geben, wenn der Kurs die manuell gesetzte Linie passiert. Ein sehr nützliches Werkzeug, mit dem Sie nicht zu viel Zeit vor dem Computer verbringen müssen.
Beachten Sie, dass sich der ausgegebene Alarm immer auf die aktuelle Kerze bezieht, Sie können mehrere Linien im vergangenen Chart zur Analyse verwenden.
Dieser Indikator wird immer besser aktualisiert.
FREE

Ich empfehle Ihnen, den Blog des Produkts (Handbuch) von Anfang bis Ende zu lesen , damit von Anfang an klar ist, was der Indikator bietet. Dieser Dashboard-Indikator für mehrere Zeitrahmen und Symbole sendet eine Warnung, wenn eine oder zwei verschiedene Divergenzen identifiziert wurden. Er kann mit allen Zeitrahmen von M1 bis MN verwendet werden. Maximal 9 Zeitrahmen können gleichzeitig auf dem Dashboard angezeigt werden. Es ist möglich, den Trendfilter mit gleitendem Durchschnitt, RSI oder B

Über den Testmodus: Sie sollten stattdessen die Version für MT4 zum Testen herunterladen. https://www.mql5.com/en/market/product/109093?source=Site+Market+My+Products+Page#description
1. Zusammengesetzte Zeichnungen (1) Liniensegment mit Pfeil (2) Durchgehender Linienabschnitt (gestrichelte Linie) (3) Parallelogramm (4) Vieleck (5) Werkzeuge zur Messung der Gewinn- und Verlustquote
2. die Rückverfolgung mit der Z-Taste während des Zeichnens der Linie Linientypen, die das Backtracking mit der Z

Tool, das die Anzeige von Kerzen in mehreren Zeitrahmen ermöglicht. Auf diese Weise hilft es bei der Analyse in mehreren Zeitfenstern.
Dies ist ein weiteres Produkt, das von Renato Fiche Junior entwickelt wurde und allen MetaTrader 5 Benutzern zur Verfügung steht!
Eingabe-Parameter
- Option 1 - Zeitrahmen: Standard MT5-Zeitrahmen - Option 2 - Benutzerdefinierter TimeFrame (in Minuten): Wenn dieser Wert ungleich Null ist, wird der Zeitrahmen angepasst. Damit können Sie einen anderen Zeitrahmen
FREE

Eine persönliche Umsetzung des berühmten Bollinger-Bänder-Indikators als Trendfolge-Mechanismus, der einen gleitenden Durchschnitt und die Standardabweichung verwendet, um zu definieren, was ein Trend ist und wann er sich ändert. Bollinger Bänder werden normalerweise nur als Überkauft/Überverkauft-Indikator verwendet, aber meiner Meinung nach ist der Handelsansatz vollständiger, wenn man die Trendvariante als Ausstiegsstrategie verwendet. [ Installationsanleitung | Update-Anleitung | Fehlerbehe
FREE
MetaTrader Market - Handelsroboter und technische Indikatoren stehen Ihnen direkt im Kundenterminal zur Verfügung.
Das MQL5.community Zahlungssystem wurde für die Services der MetaTrader Plattform entwickelt und steht allen registrierten Nutzern der MQL5.com Webseite zur Verfügung. Man kann Geldmittel durch WebMoney, PayPal und Bankkarten einzahlen und sich auszahlen lassen.
Sie verpassen Handelsmöglichkeiten:
- Freie Handelsapplikationen
- Über 8.000 Signale zum Kopieren
- Wirtschaftsnachrichten für die Lage an den Finanzmärkte
Registrierung
Einloggen
Wenn Sie kein Benutzerkonto haben, registrieren Sie sich
Erlauben Sie die Verwendung von Cookies, um sich auf der Website MQL5.com anzumelden.
Bitte aktivieren Sie die notwendige Einstellung in Ihrem Browser, da Sie sich sonst nicht einloggen können.