One Moving Average
- Indikatoren
- Version: 1.1

Dieser Indikator wurde auf der Grundlage von Beiträgen aus der Forex-Factory mit dem Titel There is no Magic Moving Average - You need only one - von @andose2 alias Andrei Florin erstellt.
Wenn Sie wissen möchten, wie Sie diese Handelsstrategie anwenden, lesen Sie bitte https://www.forexfactory.com/thread/691864-there-is-no-magic-moving-average-you.
Anmerkung: Unten sind Auszüge aus einigen der Beiträge.
Schätzen Sie einen Trend auf der Grundlage der Marktzyklen ein, gehen Siein der Aufwärtsphase nur long und in der Abwärtsphase nur short undbleiben Sie in der Akkumulations- und Ausschüttungsphase draußen.
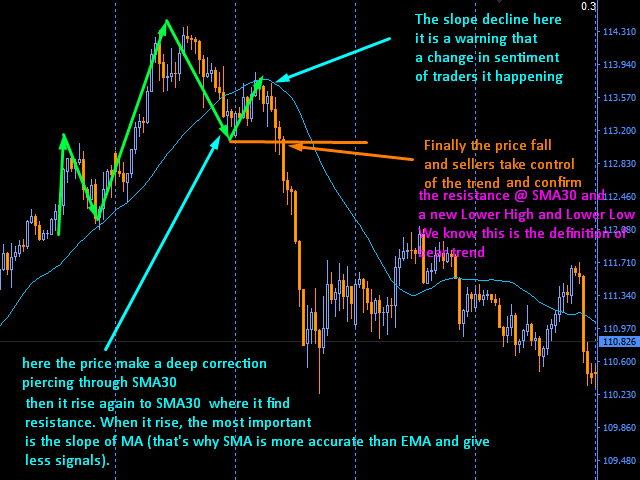
Markup - Marktphase mit höheren Hochs und höheren Tiefs => Bullen kontrollieren den Trend.
Decline - Marktphase mit niedrigeren Hochs und niedrigeren Tiefs => Bären kontrollieren den Trend.
Accumulation - Marktphase, in der Bären und Bullen miteinander kämpfen, wobei die Bullen die potentiellen Gewinner sind.
Distribution - Marktphase, in der Bullen und Bären mit Bären als potenziellen Gewinnern kämpfen.
Verkaufen Sie die Distribution innerhalb des frisch bestätigten Rückgangs, um die Gewinne zu maximieren.
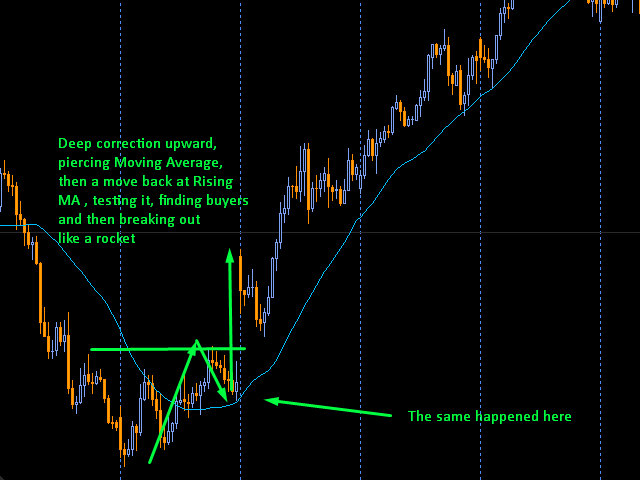
Kaufen Sie die Akkumulation innerhalb des frisch bestätigten Anstiegs, um die Gewinne zu maximieren.
Vermeiden Sie es, Distribution und Rückgang innerhalb der Anstiegsphase zu verkaufen.
Vermeiden Sie es, Akkumulation und Anstieg innerhalb der Distributionsphase zu kaufen.
Antwort : Abhängig vom Zeitrahmen, den Sie verwenden.
Frage : Ist das der Heilige Gral ?
Antwort : Wenn Sie in einem öffentlichen Handelsforum nach dem Heiligen Gral suchen, dann wünsche ich Ihnen süße Träume.
Frage : Warum ?
Antwort : Sie müssen üben und auch Ihre eigene Risikomanagement-Strategie entwickeln
Für Day Trades :
schalten Sie auf15m mit einem Simple Moving Average, der auf CLOSE mit einer Periode von48 ( ca.50) (12h Timeframe)
schalten Sie auf5m mit einem einfachen gleitenden Durchschnitt, der auf CLOSE mit einer Periode von96 ( ca.100) (8h Timeframe)
schalte auf5m mit einem Simple Moving Average auf CLOSE mit Periode von72 ( 6h Timeframe)
schalte auf5m mit einem Simple Moving Average auf CLOSE mit Periode von36 ( 3h Timeframe)
Swing Trades :
Schalten Sie4h mit einem Simple Moving Averageein, der auf CLOSE mit einer Periode von30gesetzt wurde ( 1w Timeframe)
Schalten Sie1h mit einem Simple Moving Average ein, der auf CLOSE mit einer Periode von96gesetzt wurde ( 4D Timeframe)
Schalten Sie 1h mit einem Simple Moving Average auf CLOSE mit Periode von72 ( 3D Timeframe)
einschalten1h mit einem Simple Moving Average auf CLOSE mit Periode von48 ( 2D Timeframe)
Position Trades :
Schalten Sie auf1D mit einem Simple Moving Average, der auf CLOSE mit einer Periode von60gesetzt wurde ( 3Mo Timeframe)
Schalten Sie auf1D mit einem Simple Moving Average, der auf CLOSE mit einer Periode von 120 gesetzt wurde(6 Mo Timeframe)
schalten Sie auf1W mit einem Simple Moving Average auf CLOSE mit Periode von48 ( 1Y Timeframe)
schalten Sie auf1Mo mit einem Simple Moving Average auf CLOSE mit Periode von24 ( 2Y Timeframe )
Für weitere Informationen besuchen Sie bitte das Thema der Faxgeschichte hier


lo estoy provando, se ve prometedor muchas gracias