Technische Indikatoren für den MetaTrader 5 - 24
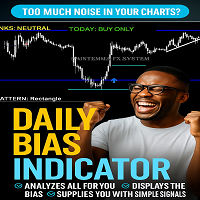
EINFÜHRUNG des leistungsstarken Daily Bias Indicator
Der Daily Bias Indicator
Hören Sie auf zu raten. Handeln Sie mit Zuversicht.
Haben Sie es satt, auf Ihre Charts zu starren und nicht zu wissen, ob heute ein Kauf- oder Verkaufstag ist? Der Daily Bias Indicator nimmt Ihnen die schwere Arbeit ab.
Er scannt den Markt mit Hilfe von 7 leistungsstarken Werkzeugen (EMA-Trend, RSI, MACD, ADX, Volumen, Pivot-Punkte und Preis-Aktion). Es sagt Ihnen in einfacher Sprache:
"TODAY: NUR KAUFEN"
FREE

TK - Rainbow Indikator Beschreibung: Der TK - Rainbow Indikator ist ein robustes Werkzeug für die technische Analyse, das entwickelt wurde, um durch einen mehrzeiligen Ansatz eine klare Sicht auf die Markttrends zu bieten. Mit 30 Linien, die in verschiedenen Zeiträumen berechnet werden, bietet er eine umfassende Analyse der Preisbewegungen. Der Indikator verwendet ein Zwei-Farben-Schema, um Aufwärts- und Abwärtstrends hervorzuheben, wodurch die Interpretation der Marktbedingungen auf einen Blick
FREE
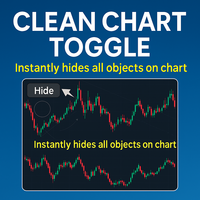
Der Clean Chart Toggle ist ein benutzerfreundlicher Indikator, der das Charting-Erlebnis in MetaTrader 5 (MT5) verbessert, indem er eine einfache Möglichkeit bietet, die Sichtbarkeit von Indikatoren und Objekten auf dem Chart zu verwalten. Mit einem einzigen Button in der oberen linken Ecke des Chartfensters können Nutzer alle Indikatoren und Zeichenobjekte sofort ausblenden oder anzeigen, um Unordnung zu reduzieren und den Fokus auf Preisbewegungen oder spezifische Analysebedürfnisse zu verbess
FREE

Dies ist die erweiterte Multi-Symbol- und Multi-Timeframe-Version des "Candle Pattern Finder"-Indikators ( Suche nach Candlestick-Mustern basierend auf dem Buch von Gregory L. Morris "Candlesticks charting explained. Zeitlose Techniken für den Handel mit Aktien und Futures" ). Der Indikator sucht nach Candlestick-Mustern für ALLE Symbole des "Market Watch"-Fensters und für ALLE Standard-Zeitrahmen von M1 bis MN1. Wenn die Muster auf einem beliebigen Symbol/Zeitrahmen erscheinen, gibt der Indikat

Diese Handelsstrategie basiert auf Open-Close Crossovers , einer Methode zur Analyse von Kursbewegungen, die auf dem Verhältnis zwischen den Eröffnungs- und Schlusskursen eines Balkens beruht. Das System ist so konzipiert, dass es potenzielle Einstiegs- und Ausstiegspunkte identifiziert, wenn sich diese Werte überkreuzen. Einrichtung und Anpassung Die Leistung der Strategie kann durch Anpassen der Auflösung angepasst werden. Eine höhere Auflösung, in der Regel das 3-4fache des Charts , kann ver
FREE

Wie die meisten Dinge, die beim Handel funktionieren, ist es wirklich einfach. Es ist jedoch eines der leistungsfähigsten Instrumente, die ich besitze und die den Einstieg in viele Systeme wesentlich präziser machen.
Im Wesentlichen misst es die jüngste Volatilität im Vergleich zum mittelfristigen Durchschnitt. Wie funktioniert das? Die Märkte neigen zu starken Trendbewegungen, wenn die relative Volatilität niedrig ist, und zu einer Mittelwertumkehr, wenn die relative Volatilität hoch ist.
Es
FREE

Ein "Inside Bar"-Muster ist eine Preisaktionshandelsstrategie mit zwei Balken, bei der der "Inside Bar" kleiner ist und innerhalb der Hoch-Tief-Spanne des vorherigen Balkens liegt, d.h. der Hochpunkt ist niedriger als der Hochpunkt des vorherigen Balkens und der Tiefpunkt ist höher als der Tiefpunkt des vorherigen Balkens. Seine relative Position kann am oberen, mittleren oder unteren Ende des vorherigen Balkens liegen.
Der vorherige Balken, also der Balken vor dem inneren Balken, wird oft als
FREE

Pivot Points Classic - Der unverzichtbare Indikator für jeden technischen Trader Dieser Indikator zeichnet automatisch die von professionellen Tradern am häufigsten verwendeten Pivot-Point-Levels, mit voller Unterstützung für 4 Berechnungsmethoden: Unterstützte Methoden :
- Traditionell
- Fibonacci
- Woodie
- Camarilla Hauptmerkmale :
Berechnung auf höherem Zeitrahmen (Multi-Timeframe)
Klare Anzeige der P-, R1-, R2-, R3-, S1-, S2-, S3-Niveaus
Dynamische Etiketten mit Name und Wert des Niveaus
An
FREE

Norion Candle Range Levels ist ein professioneller Indikator, der die maximale und minimale Preisspanne einer benutzerdefinierten Anzahl von Kerzen anzeigt. Durch die Auswahl einer bestimmten Kerzenanzahl berechnet der Indikator automatisch das höchste Hoch und das niedrigste Tief dieser Spanne und stellt so eine klare visuelle Referenz für die jüngste Marktstruktur, Konsolidierungszonen und potenzielle Ausbruchsbereiche dar. Dieses Tool ist besonders nützlich für Händler, die mit Preis-Aktions-
FREE

EMA Multi Timeframe (MTF) - MT5 Indikator Beschreibung: Der EMA Multi Timeframe (MTF) Indikator für MT5 ermöglicht es Ihnen, einen Exponential Moving Average (EMA) aus einem höheren (oder niedrigeren) Zeitrahmen direkt auf Ihrem aktuellen Chart anzuzeigen. Beispiel: Sie können den EMA 9 des Tages (D1) direkt auf Ihrem H1-Chart oder sogar auf einem M5-Chart sehen, was Ihnen dabei hilft, Ihre Eingaben auf Trends in höheren Zeitrahmen abzustimmen, ohne zwischen den Charts wechseln zu müssen. Hau
FREE

Das Impulssystem wurde erstmals im Buch "Come into my Trading Room" beschrieben. Es verwendet die Richtung sowohl des MACD-Histogramms als auch eines exponentiellen gleitenden Durchschnitts (EMA) des Preises, um einen Impuls zu definieren. Die Regel ist, niemals gegen den Impuls zu handeln.
Sein Farbcode gibt Ihnen mehrere Signale: Wenn sowohl der EMA als auch das MACD-Histogramm steigen, färbt das Impulssystem die Balkenfarbe grün (kein Shorten erlaubt). Wenn sowohl der EMA als auch das MACD-

Der Indikator zeigt den aktuellen Zeitrahmen und den Symbolnamen an. Es ist auch möglich, die Anzeige der Zeit bis zum Ende des aktuellen Balkens einzuschalten. In den Einstellungen können Sie Folgendes festlegen - die Position des Indikators im Verhältnis zum Terminalfenster, oben links, oben rechts, unten links und unten rechts - die Anordnung der Textanzeige in einer Reihe, so dass sich die Beschriftungen nicht gegenseitig überlappen - die Farbe - Schriftart - die Schriftgröße.
FREE

Der Indikator IQuantum zeigt Handelssignale für 10 Symbole im Tageschart an: AUDCAD, AUDUSD, EURUSD, GBPCAD, GBPCHF, GBPUSD, NZDUSD, USDCAD, USDCHF und USDJPY.
Signale des Indikators werden von 2 neuronalen Modellen erzeugt, die unabhängig voneinander trainiert wurden. Die Inputs für die neuronalen Modelle sind normalisierte Preise der Symbole, sowie Preise von Gold, Silber und Markern des aktuellen Tages.
Jedes neuronale Modell wurde auf 2 Arten trainiert. Der ultimative Modus ist ein überang
FREE

Boom und Crash Buy and Sell Trend. Nicht wiederholbar. Kann auf allen Zeitrahmen verwendet werden 1 Minute für Scalper. 5 Minuten bis monatlicher Zeitrahmen für Swing Trading. Funktioniert auf allen Boom und Crash Paaren Crash300, Crash500, Crash1000. Boom300, Boom500, Boom1000. Die Farbe des grünen Histogramms bedeutet, dass der Trend aufwärts gerichtet ist (bullish) Kaufsignal. Dunkelorange Histogrammfarbe bedeutet, dass der Trend nach unten geht (bärisch) Verkaufssignal.

Boom und Crash Gold Miner v2 Handelsindikator basierend auf Marktmomentum funktioniert auf dem Zeitrahmen M1 für Boom und Crash 1000 und M5 für normale Handelspaare Warten Sie auf das Erscheinen des blauen Pfeils und die Änderung der Kerzenfarbe, und die Kerzen müssen über den 2 modifizierten gleitenden Durchschnitten liegen dann können Sie den Markt kaufen. Warten Sie auf das Erscheinen des orangefarbenen Pfeils und den Farbwechsel des Kerzenständers, und die Kerzen müssen unter den 2 modifizie

Hallo Leute, das ist The Rangers Fx Es ist uns gelungen, einen Indikator zum Erkennen von Spitzen beim Boom 1000-Index, Boom 500-Index und Boom 300-Index zu erstellen. Tatsächlich gilt dieser Indikator für alle verfügbaren Booms und die anderen, die noch in der Zukunft kommen. So verwenden Sie diesen Indikator Als Erstes müssen Sie Ihren Zeitrahmen auf den Zeitrahmen M1/M5 umstellen. Dieser Indikator sendet Ihnen eine Benachrichtigung darüber, wann Sie Ihre Kaufgeschäfte tätigen und wann Sie Ihr

Dieser Indikator ist von UT Bot Alerts Indikator von @QuantNomad von Trading View zu MT5 konvertiert. seine Berücksichtigung ATR und die Schaffung neuer Kerzen auf dem Chart und gibt auch gute Einstiegspunkte auf der Grundlage seiner Kerzen. Alle Puffer von neuen Kerzen und auch Einstiegssignale sind als Puffer enthalten, so dass sie leicht auf jedem EA verwendet werden können. Es gibt auch einige verschiedene Strategien im Internet, die verwendet werden können oder kontaktieren Sie mich, um es

Einfacher Vwap mit dem täglichen, wöchentlichen und monatlichen
VWAP ist die Abkürzung für Volume-Weighted Average Price (volumengewichteter Durchschnittspreis ). Es handelt sich dabei um ein technisches Analyseinstrument, das das Verhältnis zwischen dem Preis eines Vermögenswerts und seinem gesamten Handelsvolumen anzeigt. Es bietet Händlern und Anlegern ein Maß für den Durchschnittspreis, zu dem eine Aktie in einem bestimmten Zeitraum gehandelt wird.
Wie es verwendet wird Ermittlung von Ein
FREE

Eine Heatmap ist eine grafische Darstellung von Daten in zwei Dimensionen, bei der verschiedene Faktoren durch Farben dargestellt werden. Heatmaps sind ein hilfreiches visuelles Hilfsmittel für Betrachter, das die schnelle Verbreitung von statistischen oder datenbasierten Informationen ermöglicht. Der MP-Heatmap-Indikator bietet eine grafische Darstellung der relativen Stärke der wichtigsten Währungen im Vergleich zu anderen, indem er Daten von Paaren in farbkodierte Ergebnisse umwandelt und ei
FREE

FlagTrendTF Kostenloser Indikator für MetaTrader 5 FlagTrendTF ist ein kostenloser MetaTrader 5-Indikator , der Händlern helfen soll, Markttrends über mehrere Zeitrahmen hinweg schnell und visuell zu erkennen . Er ist ideal, um zu bestätigen, ob die Marktrichtung von höheren Zeitrahmen bis hinunter zum Handelszeitrahmen übereinstimmt. Wie FlagTrendTF funktioniert Mit dem Indikator können Sie bis zu 4 Zeitrahmen gleichzeitig überwachen, wobei leicht lesbare Pfeile angezeigt werden: Grüner Pfei
FREE
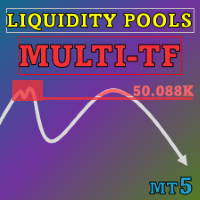
Special offer : ALL TOOLS , just $35 each! New tools will be $30 for the first week or the first 3 purchases ! Trading Tools Channel on MQL5 : Join my MQL5 channel to update the latest news from me Der Liquidity Pools -Indikator ist ein fortschrittliches Werkzeug, das potenzielle Liquiditätszonen im Chart erkennt und markiert, indem er Bereiche mit häufigen Dochtberührungen, die Anzahl der Wiederholungen und das gehandelte Volumen in jeder Zone analysiert. Dieses Tool bietet Trader
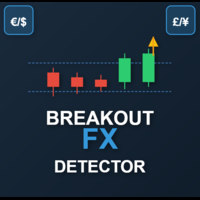
Dies ist ein leistungsstarker, sitzungsbezogener Ausbruchsindikator, der für ernsthafte Händler entwickelt wurde, die von Volatilität und Struktur profitieren. Der Indikator ist auf Präzision ausgelegt und identifiziert hochwahrscheinliche Ausbruchszonen während der Londoner und New Yorker Handelssitzungen, in denen sich der Markt mit Absicht bewegt. Hauptmerkmale: Session Range Detection
Erkennt und markiert automatisch die wichtigsten Kursbereiche der Londoner und New Yorker Sitzungen. Breako
FREE

Ein einfacher Preis-Aktions-Indikator, um innere und äußere Balken (Kerzen) mit Farben hervorzuheben. Es ist möglich zu wählen, welche Art von Bar hervorgehoben werden kann: innen, außen oder beides. Es ist möglich, eine erste spezifische Farbe für den Schatten und den Rand der Balken (Kerzen), eine zweite spezifische Farbe für Hoch-/Bullenbalken (Kerzen) und eine dritte spezifische Farbe für Abwärts-/Bärenbalken (Kerzen) zu wählen.
FREE
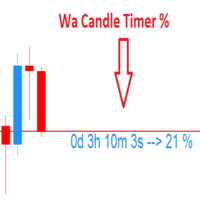
Wa Candle Timer Percentage MT5 ist ein Indikator, der dem Benutzer anzeigt, wie viel Zeit noch verbleibt, bis sich die nächste Kerze bilden wird. Der Prozentsatz der Entwicklung der aktuellen Kerze wird ebenfalls angezeigt. Der Benutzer kann den Prozentsatz einstellen, um den der Candle Timer die Farbe ändert. Dies sind die Einstellungen: 1- Der Prozentsatz, um den der Kerzen-Timer die Farbe ändert. 2- Farbe des Kerzentimers, wenn er UNTER dem vom Benutzer eingestellten Prozentsatz liegt. 3- Fa
FREE

Multicurrency und Multitimeframe Modifikation des Indikators Bollinger Bands. Auf dem Dashboard können Sie Ausbrüche und Berührungen der Bollinger Bänder sehen. In den Parametern können Sie alle gewünschten Währungen und Zeitrahmen angeben. Der Indikator kann auch Benachrichtigungen senden, wenn der Preis die Bollinger Bänder berührt, wenn sich die aktuelle Volatilität ändert (steigt oder fällt) und wenn der Preis alle Bänder berührt. Wenn Sie auf eine Zelle mit einer Periode klicken, werden di
Dieser Indikator ist die mql-Version des Indikators Linear Regression Candles . Es gibt viele lineare Regressionsindikatoren, die meisten von ihnen zeichnen Linien oder Kanäle, aber dieser Indikator zeichnet tatsächlich ein Diagramm Dieses Skript enthält Funktionen wie lineare Regression für Eröffnungs-, Hoch-, Tief- und Schlusskurse, Signalglättung mit einfachen oder exponentiellen gleitenden Durchschnitten. Find out more here: https://www.mql5.com/en/users/rashedsamir/seller Ich begrüße Ihre
FREE

Dieser Indikator zeigt ausschließlich die obere und untere Begrenzung eines Bollinger-ähnlichen Volatilitätskanals an, ohne die zentrale gleitende Durchschnittslinie darzustellen. Sein Hauptziel besteht darin, eine saubere und flexible Volatilitätshülle bereitzustellen, damit sich Trader auf das Preisverhalten in Bezug auf die Kanalgrenzen konzentrieren können, während sie die volle Kontrolle über die Chart-Ästhetik und -Struktur behalten. Im Gegensatz zu traditionellen Bollinger-Bändern, bei de
FREE

Smart Money Struktur- & Präzisionshandelsindikator (MT5) Der Smart Money Structure & Precision Trading Indicator ist ein leistungsstarker Smart Money Concepts (SMC) Indikator für MetaTrader 5, der Händlern hilft, mit institutioneller Logik hochwahrscheinliche Einstiegsmöglichkeiten zu identifizieren . Dieser Indikator erkennt automatisch die Marktstruktur in Echtzeit , hebt die wichtigsten Liquiditätsniveaus hervor und liefert klare, sich nicht wiederholende Signale , damit Sie mit Zuversicht un
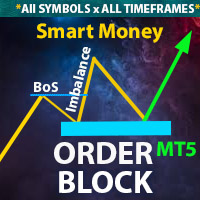
** Alle Symbole x Alle Zeitrahmen scannen nur durch Drücken der Scannertaste ** Rabatt : Nur 4 von 5 Exemplaren ist 35$.
*** Kontaktieren Sie mich , um Ihnen eine Anleitung zu schicken und Sie in die "Order Block Gruppe" aufzunehmen, damit Sie Ihre Erfahrungen mit anderen Nutzern teilen oder sehen können. Einleitung: Die Zentralbanken und Finanzinstitute treiben den Markt hauptsächlich an. Orderblocks werden als ein Marktverhalten betrachtet, das eine Ansammlung von Aufträgen von Banken und Ins
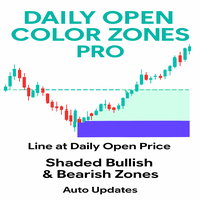
Bei diesem Indikator handelt es sich um ein professionelles Tool, das die tägliche Eröffnungslinie aufzeichnet und sofort die bullishen und bearishen Preiszonen um sie herum schattiert. Anstatt die Händler im Ungewissen zu lassen, liefert er eine klare visuelle Karte der Marktstimmung gleich zu Beginn des Tages. Ziel des Indikators ist es, sofort zu erkennen, ob der Markt oberhalb oder unterhalb der Tageseröffnung notiert - ein wichtiger Bezugspunkt für Intraday-Strategien.
Der Indikator zieht
FREE
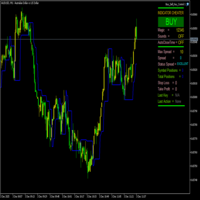
FractalBreakoutLevels Überblick:
Dieser Indikator zeichnet dynamische Preisniveaus auf der Grundlage der Analyse von Preisbewegungen. Er kombiniert historische Preisdaten, um Schlüsselbereiche zu identifizieren, die als Referenz für den Handel dienen können. Funktionsweise:
Der Indikator analysiert die Marktstruktur, indem er die Beziehung zwischen aktuellen und historischen Preisdaten untersucht. Er zeichnet eine durchgehende Linie, die sich sich ändernden Marktbedingungen anpasst und als dyn
FREE

Was ist Pi Cycle Projections? Pi Cycle Projections ist ein umfassendes Handelssystem für MetaTrader 5, das Ihnen einen doppelten Vorteil bietet: Es identifiziert nicht nur hochwahrscheinliche Einstiegssignale (Kreuzung von gleitenden Durchschnitten) im gegenwärtigen Moment, sondern zeichnet auch eine visuelle Karte mit möglichen zukünftigen Marktszenarien . Stellen Sie es sich als ein 2-in-1-System vor: Ein intelligenter Signalgeber , der Ihnen sagt, wann Sie handeln sollten (Kreuzungen der Pi-G
FREE
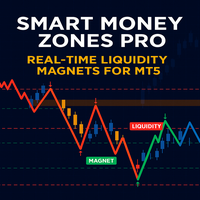
Wenn Sie die Funktionsweise des SM Zones Pro Indikators besser kennenlernen möchten, empfehlen wir Ihnen, zunächst den kostenlosen SM Zones Indikator herunterzuladen und auszuprobieren. Dieser ist für ein einzelnes EURUSD-Instrument in verschiedenen Zeiträumen optimiert. Sie können SM Zones von diesem Markt herunterladen. Im Gegensatz zu SM Zones kann SMZones Pro bis zu zehn verschiedene Instrumente gleichzeitig analysieren.
Der SM Zones Pro Indikator wurde nach den Prinzipien intelligenter Ge

EINFÜHRUNG : Der Ausbruchsstärkemesser ist ein Handelsinstrument, mit dem festgestellt werden kann, welche Währungen am stärksten und welche am schwächsten für einen Ausbruch geeignet sind. Die Einstellungen für den Indikator sind einfach, und wenn Sie die Einstellungen nicht finden können, hinterlassen Sie bitte einen Kommentar Die Nutzung der Tools ist völlig kostenlos. Wenn Ihnen der Indikator gefällt, hinterlassen Sie bitte einen Kommentar und bewerten Sie den Indikator, damit er weiterentwi
FREE
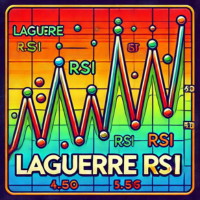
If you love this indicator, please leave a positive rating and comment, it will be a source of motivation to help me create more products <3 Wichtigste Erkenntnisse Der Laguerre-RSI ist eine verbesserte Version des traditionellen Relative-Stärke-Index (RSI), der Laguerre-Filter zur Glättung der Kursdaten enthält. Dies trägt dazu bei, das Rauschen und die Volatilität zu reduzieren, die beim Standard-RSI häufig zu beobachten sind, und bietet einen saubereren und zuverlässigeren Indikator zur Erke
FREE

Sehen Sie sich meinen TRADE PLANNER MT5 an - dringend empfohlen, um Kontoszenarien zu antizipieren, bevor Sie Geld riskieren. Dies ist der Bill Williams Awesome Oscillator-Indikator, der aus Heikin Ashi-Kerzen berechnet wird. Hier finden Sie ein mehrfarbiges Histogramm, das hilfreich ist, wenn Sie Schwäche oder Stärke des Trends auf dem Markt erkennen wollen. Um ihn zu verwenden, legen Sie ihn einfach auf dem Chart ab und Sie müssen keine Parameter ändern, außer einem: zwischen Heikin Ashi und
FREE

Heikin Ashi Candlestick-Indikator für MT5 Dieser benutzerdefinierte Heikin Ashi-Indikator bietet eine glatte visuelle Darstellung von Markttrends, indem er kurzfristiges Rauschen herausfiltert, wodurch es einfacher wird, potenzielle Umkehrungen und Trendfortsetzungen zu erkennen. Im Gegensatz zu regulären Candlesticks werden Heikin Ashi-Kerzen anhand von Durchschnittswerten berechnet, was zu stabileren und besser lesbaren Chartmustern führt. Hauptmerkmale: Klare und geglättete Visualisierun
FREE

Global Trading Sessions ist ein technischer Indikator für MetaTrader 5, der die Eröffnungszeiten der vier wichtigsten Finanzsitzungen ermittelt und markiert: Tokio, London, New York und Sydney . Der Indikator löst das Problem der unterschiedlichen Serverzeiten der Broker, indem er eine GMT-basierte Berechnungslogik verwendet. Durch die Synchronisierung mit der Global Mean Time (GMT) stellt der Indikator sicher, dass die Sitzungsgrenzen unabhängig von der lokalen Zeitzone der Brokerplattform gena
FREE
Pivot Points Indicator - eine schnelle, zuverlässige und vollständig anpassbare Pivot-Erkennung für MetaTrader 5. Dieser Indikator nutzt die MetaTrader-eigenen Funktionen iHighest und iLowest, um Pivot-Hochs und -Tiefs zu identifizieren, indem er nach den höchsten und niedrigsten Kursen innerhalb eines benutzerdefinierten Fensters von Bars sucht. Ein Pivot wird nur dann bestätigt, wenn der aktuelle Balken das absolute Maximum oder Minimum innerhalb der ausgewählten Spanne ist, wodurch genaue un
FREE
Der Flower-Indikator ist ein technisches Analysetool, das hauptsächlich zur Trenderkennung und zur Unterstützung von Scalping- oder Intraday-Handelsstrategien eingesetzt wird.
Der Flower-Indikator ist ein Signaltrendindikator, der auf technischen Analysen und Preisdynamikanalysen basiert. Er visualisiert Trends mithilfe farbiger Blumen – blaue Blumen signalisieren einen Aufwärtstrend, rote Blumen einen Abwärtstrend.
Jedes Level kann als Unterstützung und Widerstand fungieren (achten Sie auf +
FREE

Dies ist ein nicht-parametrisches ZigZag, das 4 verschiedene Berechnungsmethoden bietet. Die Aufwärtsflanke setzt sich bei neuen Balken fort, wenn deren "Hochs" über dem höchsten "Tief" der vorherigen Balken liegen, die Abwärtsflanke setzt sich bei den nächsten Balken fort, wenn deren "Tiefs" unter dem niedrigsten "Hoch" der vorherigen Balken liegen; Gann-Schwung: Die Aufwärtsflanke setzt sich fort, wenn die "Hochs" und "Tiefs" höher sind als beim linken benachbarten Balken, die Abwärtsflanke s
FREE
Indikator "Step Channel Momentum Trend" (MT5 Indicator) Step Channel Momentum Trend ist ein leistungsstarker, momentum-basierter Indikator, der darauf abzielt, Händlern einen adaptiven Vorteil zu verschaffen, indem er Marktstruktur mit dynamischer Volatilitätsanalyse kombiniert. Dieses Tool hilft Ihnen, Trend und Range klar zu unterscheiden, ohne auf glättungsanfällige Techniken zurückzugreifen, und nutzt eine einzigartige stufige Mittellinie und einen ATR-gefilterten Kanal. Hauptmerkmale Stru
FREE

Thermo MAP ist ein Multicurrency- und Multitimeframe-Indikator, der eine intelligente Heatmap anzeigt, die auf proprietären Berechnungen basiert. Beobachten Sie mit einem einzigen Dashboard, wie sich der Forex-Markt bewegt hat und aktuell bewegt und haben Sie eine konsistente und gute Vorstellung davon, was passiert!
Der Indikator eignet sich sowohl für Scalping als auch für mittel-/langfristige Transaktionen, wählen Sie einfach die Optionen aus, die besser zu Ihrem Handelsstil passen. Die Symb
FREE

Das Gleichgewicht von Angebot und Nachfrage ist eine einfache und wirksame Methode der Marktanalyse. Das Diagramm von Angebot und Nachfrage kann Ihnen im Voraus, noch vor der Trendumkehr, zeigen, wo das Angebot endet und die Nachfrage bereits entsteht, wo die Nachfrage endet und das Angebot entsteht, und dabei die Wahrscheinlichkeit, ein Geschäft in die richtige Richtung und mit einem hohen Gewinnfaktor zu machen, erheblich erhöhen.
Signale des Indikators Der Indikator verwendet die Preis-/Volu

Mehrwährungs- und Mehrzeitrahmen-Indikator Inside Bar (IB). In den Parametern können Sie alle gewünschten Währungen und Zeitrahmen angeben. Das Panel zeigt das zuletzt gefundene Inside Bar (und Mother Bar) Muster, die aktuelle Preisposition und den Durchbruch der Levels der Mother und Inside Bars an. Sie können die Größe und Farbe der Balken und des Textes in den Zellen einstellen. Der Indikator kann auch Benachrichtigungen senden, wenn Niveaus durchbrochen werden. Das Dashboard hebt Double Ins

Die TMA - RSI Divergence, die Sie in Trading View sehen, wurde für die Verwendung in MT5 erstellt. TMA RSI Divergence ist ein technischer Indikator, der TMA (Triple Moving Average ) und RSI (Relative Strength Index ) kombiniert. Es handelt sich um eine Technik zur Erkennung von Divergenzen, bei denen sich der Preis und der RSI in entgegengesetzte Richtungen bewegen . Der RSI wird in der Regel durch den TMA geglättet , und die TMA-Linie selbst wird anstelle des RSI verwendet , anstatt den RSI all
FREE

Volatilitätsdurchbruch-Signale Beschreibung:
Volatility Break Signals ist ein Indikator, der entwickelt wurde, um potenzielle Trendwechsel zu erkennen und gleichzeitig das Marktrauschen teilweise zu filtern. Er verwendet ein adaptives Volatilitätsmaß auf der Grundlage des ausgewählten Preises (Close, Open, High, Low, etc.) und generiert Kauf- und Verkaufssignale , wenn der Preis eine Umkehrung gegenüber der vorherigen Richtung zeigt. Wie es funktioniert: Messung der Preisvolatilität Der Indikat
FREE

Der **Heiken Ashi Smoothed** ist eine geglättete Version des technischen Indikators Heiken Ashi, der in der Candlestick-Chartanalyse verwendet wird, um Markttrends zu erkennen und Kursbewegungen vorherzusagen. Dieser Indikator basiert auf der Mittelwertbildung von Kursdaten zu einem Candlestick-Chart, der Händlern hilft, Marktstörungen herauszufiltern.
**Wofür wird er verwendet? Dieser Indikator wird verwendet, um zu erkennen, wann Händler in einem Handel bleiben sollten und wann eine Pause od
FREE

Der Simple Market Sessions Indicator hilft Händlern, den aktuellen Status der wichtigsten Devisenmarktsitzungen zu visualisieren: Asien , London , New York und Sydney . Er zeigt direkt auf dem Chart an, ob der jeweilige Markt geöffnet , aktiv (basierend auf dem Volumen) oder geschlossen ist. Mit anpassbaren Sitzungszeiten und einem Schwellenwert für das Handelsvolumen hilft dieses Tool den Händlern bei der Überwachung der Sitzungsaktivität und der Volumenstärke und erleichtert ihnen die Entschei
FREE

Die japanische Candlestick-Analyse gibt es schon seit Hunderten von Jahren und ist eine gültige Form der technischen Analyse. Das Candlestick-Charting hat seine Wurzeln in der militaristischen Kultur, die im Japan der 1700er Jahre vorherrschte. In der japanischen Literatur zu diesem Thema finden sich viele Begriffe, die auf militärische Analogien verweisen, wie z. B. das Muster der drei weißen Soldaten. Im Gegensatz zu konventionelleren Charting-Methoden ermöglicht das Candlestick-Chart einen ti
FREE
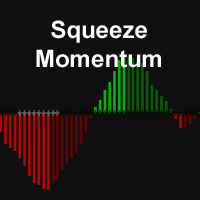
Der Squeeze-Momentum-Indikator identifiziert Perioden geringer Volatilität ("Squeeze"), wenn sich die Bollinger-Bänder innerhalb des Keltner-Kanals befinden, was durch schwarze Kreuze auf der Mittellinie gekennzeichnet ist. Dies deutet darauf hin, dass sich der Markt auf eine bedeutende Bewegung vorbereitet.
Graue Kreuze weisen auf einen "Squeeze Release" hin, der einen potenziellen Ausbruch signalisiert. Warten Sie auf das erste graue Kreuz nach einem schwarzen Kreuz und handeln Sie dann in d
FREE

Mein Fibonacci MT5 Ein automatisierter Fibonacci-Indikator für MetaTrader 5, der die Erkennung von ZigZag-Schwüngen mit einer umfassenden Expert Advisor-Integration durch ein 20-Puffer-System kombiniert. More details about data specification and EA integration: https://www.mql5.com/en/blogs/post/764114 Kernfunktionen Automatisierte Fibonacci-Erkennung Der Indikator identifiziert Swing-Punkte anhand konfigurierbarer ZigZag-Parameter und zeichnet automatisch Fibonacci-Retracements und -Extensions
FREE

1. Einführung Smart Volume S/R Pro ist ein leistungsstarkes technisches Analysetool, das für die MetaTrader 5-Plattform entwickelt wurde. Im Gegensatz zu traditionellen Support & Resistance (S/R) Indikatoren, die sich auf Preisspitzen und -tiefs stützen, identifiziert dieser Indikator automatisch kritische S/R-Zonen auf der Basis eines Kernfaktors: Das Handelsvolumen . Grundprinzip: Kursniveaus, die in der Vergangenheit ein außergewöhnlich hohes Handelsvolumen aufwiesen, werden oft zu wichtigen
FREE
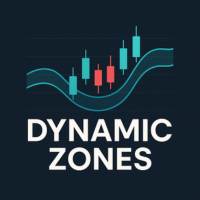
Der dynamische Angebots- und Nachfrageindikator identifiziert automatisch Angebots- und Nachfragezonen und zeigt diese auf der Grundlage von Preisaktionsmustern und der Marktstruktur auf Ihrem Chart an. Diese Zonen stellen Bereiche dar, in denen in der Vergangenheit institutioneller Kauf- oder Verkaufsdruck aufgetreten ist, was sie zu Schlüsselebenen für potenzielle Preisreaktionen macht. Diese Form des Indikators orientiert sich an der ICT sowie an traditionellen Unterstützungs- und Widerstands
FREE

Der gleitende T3-Durchschnitt von Tillson wurde der Welt der technischen Analyse in dem Artikel "A Better Moving Average" vorgestellt, der in der amerikanischen Zeitschrift Technical Analysis of Stock Commodities veröffentlicht wurde. Der von Tim Tillson entwickelte gleitende Durchschnitt faszinierte schon bald die Analysten und Händler auf den Futures-Märkten, da er die Preisreihen glättet und gleichzeitig die für Trendfolgesysteme typische Verzögerung (Lag) verringert.
FREE
Signalanzeige für binäre Optionen, die sich auch auf dem Forex-Markt und anderen Märkten effektiv einsetzen lässt. Geeignet für kurzfristigen Grid-Handel auf M1–M5 und enthält Signale zum schrittweisen Positionsaufbau. Die kostenlose Version funktioniert nur auf dem Währungspaar XAUUSD. Die Vollversion für MetaTrader 5 finden Sie hier: https://www.mql5.com/en/market/product/156185 Der Indikator verwendet eine zweistufige Anpassung: ein grundlegendes Geschwindigkeitsprofil (Einstellung „schnell/r
FREE
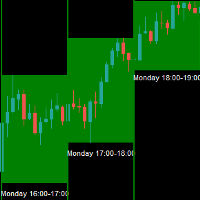
Der Entry Signal Analyzer ist ein hochentwickelter MetaTrader 5-Indikator, der entwickelt wurde, um die optimalen Handelszeiten auf der Grundlage von Kursbewegungsmustern zu analysieren und zu identifizieren. Der Indikator analysiert nur Gold Währung eine aktualisierte Version wird derzeit für andere Symbol der Indikator in der Strategie-Tester ist nicht-funktionale Arbeiten auf dem realen Chart entwickelt Statistische Analyse: Analysiert historische Preisbewegungen für jede Stunde des Handelsta
FREE

Der Jackson Trendline-Scanner ist ein leistungsfähiges Preisaktionswerkzeug , das genaue Trendlinien zeichnet und Ausbruchssignale anzeigt . Wie wir alle wissen, dass Trendlinien es ein mächtiges Werkzeug in der Preis-Aktion, indem sie uns mit verschiedenen Chart-Muster. zB Bullish Flag, Pennant, Keile und mehr... Es ist nicht einfach, Trendlinien zu zeichnen, die meisten erfolgreichen Händler verwenden Trendlinien, um die nächste Bewegung auf der Grundlage von Chart-Muster und Ausbruch vorherz
FREE
Hierbei handelt es sich um einen einfachen RSI-Indikator, der jedoch im Gegensatz zum ursprünglichen Indikator Warnungen sendet, wenn das Volumen unter das obere Niveau fällt oder über das untere Niveau ansteigt, so dass Sie keine Handelsmöglichkeit verpassen. In Kombination mit Unterstützungs- und Widerstandsniveaus kann er gute Einstiegsmöglichkeiten in den Markt bieten. Ich empfehle, die Niveaus so zu belassen, wie sie sind, d.h. 75 oben und 25 unten. Schauen Sie sich mein Signal "PipStorm In
FREE
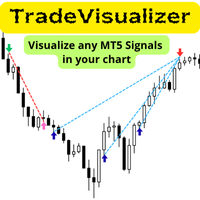
Der Trade Visualizer Indikator erweckt Ihre Handelsdaten zum Leben, indem er Ihre gesamte Handelshistorie direkt auf den MT5-Charts anzeigt. Egal ob Sie Ihre eigene Performance analysieren oder MQL5-Signalanbieter untersuchen – dieses Tool verwandelt Rohdaten in klare, intuitive Visualisierungen. Jeder Trade wird mit Ein- und Ausstiegspfeilen, Verbindungslinien und detaillierten Tooltips zu Preis, Gewinn, Volumen und Pips dargestellt. Hinweis: Wenn Sie diesen Indikator heruntergeladen haben, sen
FREE

Utazima 001 Indikator AI Professionelles Marktstruktur- & Eröffnungsbereichssystem HÖR AUF ZU RATEN. BEGINNEN SIE MIT STRUKTUR ZU HANDELN. Utazima 001 Indicator AI ist ein Marktstruktur- und Eröffnungsspannen-Intelligenzsystem der nächsten Generation, das für Trader entwickelt wurde, die Klarheit, Präzision und Konsistenz wünschen. Es handelt sich nicht um ein Tool zum Nachmalen von Signalen.
Es handelt sich um eine Logik von institutioneller Qualität , vereinfacht und automatisiert für E
FREE
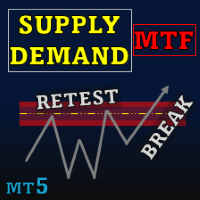
Special offer : ALL TOOLS , just $35 each! New tools will be $30 for the first week or the first 3 purchases ! Trading Tools Channel on MQL5 : Join my MQL5 channel to update the latest news from me Supply Demand Retest and Break Multi Timeframe , dieses Tool zeichnet Angebots- und Nachfragezonen basierend auf starken Momentum-Kerzen und ermöglicht es Ihnen, diese Zonen über mehrere Zeitrahmen hinweg mit der Funktion timeframe selector zu identifizieren. Mit Retest- und Break-La

Price Sessions ist ein exklusiver MetaTrader 5-Indikator, der Symbolinformationen und Handelssitzungen in Ihren Chart integriert. Er stellt keine Verbindung zu Kontoinformationen oder externen Quellen her, um die Sicherheit des Benutzers zu gewährleisten. Hauptmerkmale: 1. Symbol-Informationen Aktuelles Symbol Live-Kurs Live-Spread 2. Handelssitzungen (Zeitzone UTC/GMT+0) Tokio-Sitzung Londoner Sitzung New Yorker Sitzung Wenn Sie dieses Dienstprogramm hilfreich finden, bewerten Sie es bitte. We
FREE

Ich bin sicher, dass Sie nach vielen Recherchen im Internet keinen Indikator gefunden haben, der Ihnen beim Forex- oder Binärhandel in der neuesten Wahrscheinlichkeitsstrategie des berühmten Händlers Ronald Cutrim helfen kann. Die Strategie basiert auf einer einfachen Zählung grüner und roter Kerzen, wobei ein numerisches Ungleichgewicht zwischen ihnen über einen bestimmten Zeitraum auf einem Investmentmarkt-Chart überprüft wird. Wenn sich dieses Ungleichgewicht bestätigt und mindestens 16 % bet
FREE

MTF Candlestick-Muster-Detektor : Ihre ultimative Kommandozentrale für Preisaktionen In der schnelllebigen Welt des Handels kann das Verpassen eines einzigen Umkehrmusters den Unterschied zwischen einer profitablen Woche und einer verpassten Gelegenheit ausmachen. Der MTF Candlestick Patterns Detector ist ein professioneller MQL5-Indikator, der über 24 legendäre Candlestick-Muster in allen Zeitrahmen gleichzeitig scannt, erkennt und zusammenfasst. Hören Sie auf, durch Charts zu jagen und zu rate

Dieser einfache Indikator hilft bei der Bestimmung der wahrscheinlichsten Trendrichtung, ihrer Dauer und Intensität sowie bei der Abschätzung der möglichen Bandbreite von Kursschwankungen. Sie können auf einen Blick erkennen, in welche Richtung sich der Kurs bewegt, wie lange der Trend anhält und wie stark er ist. All dies macht den Indikator zu einem einfach zu bedienenden Trendhandelssystem sowohl für Anfänger als auch für erfahrene Trader.
Parameter Zeitraum - Mittelungszeitraum für die Bere

## NUR GOLD
## NUR GOLD
**Mercaria Professional Trading Zones - Vollständiger Leitfaden** ## **Mercaria Professionelle Handelszonen - Vollständiger Leitfaden**
### **Wie Mercaria-Zonen funktionieren**
**Englisch:** Mercaria Zones ist ein fortschrittlicher Handelsindikator, der mithilfe von ZigZag-Extremen in Kombination mit mathematischen Zonenberechnungen hochwahrscheinliche Unterstützungs- und Widerstandsbereiche identifiziert. Der Indikator arbeitet auf mehreren Zeitrahmen gleichzeitig un

Volume Horizon ist ein horizontaler Volumenindikator, mit dem Sie die Dichte des Volumens der Marktteilnehmer über verschiedene Preis- und Zeitintervalle hinweg beobachten können. Volumenhistogramme können auf der Basis auf- oder absteigender Marktwellen sowie einzelner Bars erstellt werden. Dieses Tool ermöglicht eine präzisere Bestimmung von Einstiegs- oder Ausstiegspunkten, die sich auf maximale Volumina oder volumengewichtete Durchschnittspreise (VWAP) stützen.
Was macht Volume Horizon ein

Der Supertrend etradro Indikator ist volatilitätsbasiert und hat eher die Funktion eines Trendfolgeindikators. Der ATR-Indikator, der in die Berechnung des Supertrends integriert ist, berechnet auch Kurslücken (Gaps) und lässt diese nicht außer Acht. Dadurch können genauere Werte berechnet werden. Bei der Messung der Volatilität dient der Mittelwert des aktuellen Kurses als Basis. Da der Supertrend-Indikator über gleitende Stopp- und Umkehrlinien verfügt, ist er in seiner Funktion dem Parabolic
FREE
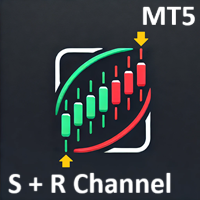
Unterstützung-Widerstand-Kanal MT5 Der Support Resistance Channel MT5-Indikator stellt dynamische Unterstützungs- und Widerstandsniveaus auf der Grundlage eines konfigurierbaren Rückblicks dar, die als grüne bzw. rote Linien angezeigt werden. Er zeigt optional goldfarbene Pfeile an, wenn der Kurs diese Niveaus berührt, und weist so auf mögliche Trendänderungen hin (keine expliziten Kauf-/Verkaufssignale) , zusammen mit anpassbaren "RES"- und "SUP"-Beschriftungen. Mit einstellbaren Parametern wi
FREE
Erfahren Sie, wie man einen Handelsroboter im MetaTrader AppStore, dem Shop für Applikationen für die MetaTrader Handelsplattform, kaufen kann.
Das Zahlungssystem der MQL5.community ermöglicht Zahlungen mit PayPal, Kreditkarten und den gängigen Zahlungssystemen. Wir empfehlen Ihnen eindringlich, Handelsroboter vor dem Kauf zu testen, um eine bessere Vorstellung von dem Produkt zu bekommen.
Sie verpassen Handelsmöglichkeiten:
- Freie Handelsapplikationen
- Über 8.000 Signale zum Kopieren
- Wirtschaftsnachrichten für die Lage an den Finanzmärkte
Registrierung
Einloggen
Wenn Sie kein Benutzerkonto haben, registrieren Sie sich
Erlauben Sie die Verwendung von Cookies, um sich auf der Website MQL5.com anzumelden.
Bitte aktivieren Sie die notwendige Einstellung in Ihrem Browser, da Sie sich sonst nicht einloggen können.