Technische Indikatoren für den MetaTrader 5 - 25
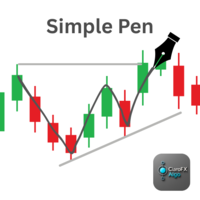
ClaroFxAlgo - Einfacher Stift v1.00 Freihand-Zeichentool für MetaTrader 5 Überblick:
ClaroFxAlgo - Simple Pen ist ein leichtes und intuitives Tool, mit dem Händler direkt auf dem MT5-Chart zeichnen können, indem sie einfach die Maus bewegen. Dieses Tool wurde entwickelt, um die visuelle Analyse zu verbessern und erleichtert das Skizzieren von Trends, das Hervorheben von Zonen oder das Markieren von Chart-Verhalten während des laufenden Betriebs. Hauptmerkmale: Zeichnen Sie im Chart, indem Sie
FREE

Zyklus Sniper MT5 Cycle Sniper MT4 Version und Definitionen : https://www.mql5.com/en/market/product/51950 Wichtige Hinweise: Die MT5 Version beinhaltet nicht die Funktionen Breakout Mode und Late Entry Mode.
Die MT5 Version enthält keinen RSI und MFI Filter. **Bitte kontaktieren Sie uns nach dem Kauf und wir werden Ihnen die zusätzlichen Indikatoren zur Vervollständigung des Systems zusenden.
Dieser Indikator sendet kein Signal ohne Grund...Sie können den Indikator und die Signale, die er sen

Dieser Indikator kombiniert die klassischen MACD- und Zigzag-Indikatoren, um Abweichungen zwischen Preis und Indikatoren zu erkennen. Es nutzt außerdem fortschrittliche Technologie der künstlichen Intelligenz (KI), um die Gültigkeit von Divergenzen zu erkennen.
MACD ist als „König der Indikatoren“ bekannt, und Zigzag ist ebenfalls ein sehr nützlicher Indikator. Durch die Kombination dieser beiden Indikatoren nutzt dieser Indikator die Stärken beider.
Die Erkennung von Divergenzen ist ein prob

Diese Supertrend-Strategie ermöglicht es Ihnen, bei einem Supertrend-Trendwechsel eine Long- oder Shortposition einzugehen. Sowohl die ATR-Periode als auch der ATR-Multiplikator sind einstellbar. Wenn Sie das Kontrollkästchen "ATR-Berechnungsmethode ändern" aktivieren, wird die Berechnung auf der Grundlage des SMA durchgeführt und Sie erhalten leicht abweichende Ergebnisse, die je nach Asset besser funktionieren können. Achten Sie darauf, dass Sie Slippage und Kommission in die Eigenschaften ein
FREE

Kein Docht-Kerzen-Identifikator Am besten geeignet für Gold (XAUUSD) und Devisenpaare | Funktioniert in jedem Zeitrahmen Der No Wick Candle Identifier ist ein Preisaktionsindikator , der Kerzen mit hoher Intensität aufzeigt, bei denen der Preis genau am Extremwert (Hoch oder Tief) eröffnet.
Diese Kerzen spiegeln eine starke institutionelle Beteiligung wider und fungieren oft als Entscheidungspunkte, Auslöser für eine Fortsetzung des Kurses oder als hochwahrscheinliche Reaktionsstufen , wenn der
FREE

2025 Spike Killer Dashboard - Erweiterte Handelssignale & Marktanalysen Transformieren Sie Ihr Trading mit intelligenten Markteinblicken! Das 2025 Spike Killer Dashboard ist ein leistungsstarker MQL5-Indikator, der modernste Signalerzeugung mit einem intuitiven Crystal Dashboard für Echtzeit-Marktanalysen kombiniert. Dieses All-in-One-Tool wurde für Trader entwickelt, die Präzision und Klarheit verlangen, und liefert umsetzbare Signale und umfassende Marktmetriken auf einen Blick. Hauptmerkmale:

Der Indikator, der die aktuelle Uhrzeit auf den wichtigsten Märkten der Welt anzeigt. Es zeigt auch die aktuelle Sitzung an. Sehr einfach zu bedienen. Es nimmt nicht viel Platz auf einem Diagramm ein. Es kann zusammen mit Expert Advisors und anderen Panels wie VirtualTradePad verwendet werden . Die klassische Variante. Liebe Freunde und Benutzer unserer EAs, bitte fügen Sie Ihre Bewertungen im Abschnitt Bewertungen hinzu. Alle Updates unserer Forex-Software sind kostenlos ! Dies ist e
FREE

Dieser MT5-Chart-Trend-Checker durchbricht das Rauschen der Marktvolatilität und liefert ein klareres Bild von Trends und Kursbewegungen. Er enthält die folgenden Funktionen, die für mehr Klarheit bei der Markteinschätzung sorgen können: 1 anpassbarer gleitender Mehrperioden-Durchschnitt Optionale Heikin-Ashi-Kerzen 3 umschaltbare Fokus-Modi Eindeutige Farben für eine einfache Analyse
Link zur MT4-Version: https://www.mql5.com/en/market/product/106708/
Dieser Indikator zeigt Ihren bevorzugten
FREE
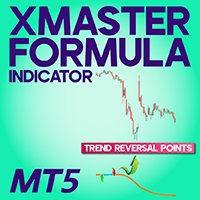
XMaster XHMaster Formula MT5-Indikator - No Repaint Strategie Der XMaster / XHMaster Formula-Indikator für MetaTrader 5 (MT5 ) ist eine verbesserte Version des beliebten MT4-Tools, das entwickelt wurde, um Trendrichtungen, Momentumverschiebungen und wahrscheinliche Umkehrzonen zu erkennen. Mit einer verbesserten Optimierung für die MT5-Engine liefert der Indikator stabile No-Repaint-Signale und arbeitet effizient mit verschiedenen Anlageklassen wie Devisen, Gold, Kryptowährungen und Indizes. Die
FREE

Willkommen in der Zukunft des Tradings mit dem KMeans Price Zones Detector, einem innovativen MetaTrader-Indikator, der die Kraft des maschinellen Lernens nutzt, um wichtige Preiszonen zu identifizieren. Dieses Tool verwendet den KMeans-Cluster-Algorithmus, um dynamisch Schwerpunkte in Preisdaten zu erkennen und Bereiche hervorzuheben, in denen Preise wahrscheinlich auf Unterstützung, Widerstand oder Konsolidierung stoßen. Innovativer KMeans-Algorithmus Der KMeans Price Zones Detector zeichnet s
FREE
UT Bot Alerts ist ein technischer Indikator für MetaTrader 5, der potenzielle Richtungsänderungen aufgrund von Momentum-Bedingungen hervorhebt.
Der Indikator markiert Signalpunkte direkt auf dem Chart und kann optional Benachrichtigungen generieren. Die Signalerzeugungslogik kann in zwei Modi arbeiten: Closed-Bar-Modus: Signale werden erst nach dem Schließen des Balkens bestätigt. Live-Bar-Modus: Signale werden während der Bildung des aktuellen Balkens angezeigt. Beide Modi sind je nach dem bev

Der technische Indikator Wave Vision misst die relative Stärke der Trendbewegungen des Kurses gegenüber seinen Durchschnittswerten über einen bestimmten Zeitraum. Das Histogramm zeigt die Stärke der Preisbewegung im Verhältnis zur Nulllinie an. Histogrammwerte nahe der Null-Linie zeigen die Gleichheit der Kräfte zwischen Käufern und Verkäufern an. Oberhalb der Nulllinie - Aufwärtstrend (positive Werte des Balkendiagramms). Unterhalb der Nulllinie - Abwärtstrend (negative Werte des Balkendiagramm
FREE

Revolution Martingale ist ein Indikator, der für den Handel mit binären Optionen auf dem M5-Zeitrahmen entwickelt wurde. Merkmale: M5-Zeitrahmen: Es wird empfohlen, den Indikator für den optimalen Handel auf dem M5-Zeitrahmen zu verwenden. Handelseinstieg: Trades sollten nur bei der ersten Kerze nach dem Erscheinen eines Signals eröffnet werden. Signale: Eine blaue Raute zeigt eine Kaufgelegenheit für eine Aufwärtsbewegung an, während eine rote Raute eine Kaufgelegenheit für eine Abwärtsbewegun
FREE

TransitGhost Signal Indikator, das ist einer meiner besten Forex-Handelsstrategie. Die Strategie basiert auf der einfachen gleitenden Durchschnitt kreuzen, 5 SMA und 200 SMA, von denen eine längere Zeit dauern, zu kreuzen. Wann immer sich der 5 SMA und der 200 SMA kreuzen, wird ein Signal gegeben. Wenn der 5 SMA den 200 SMA nach oben kreuzt, erscheint ein Kaufpfeil auf dem Chart und eine Push-Benachrichtigung (Alarm) "Buy now, use proper risk management" wird sowohl auf dem MT5 PC als auch auf d
FREE
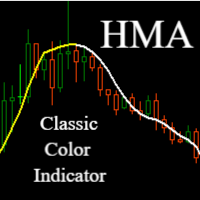
Hull Moving Average (HMA) - Schnellere und präzisere Trendverfolgung
Der Hull Moving Average stellt einen revolutionären Ansatz für die Trendanalyse dar, der die üblichen Unzulänglichkeiten herkömmlicher gleitender Durchschnitte überwindet. Dieser fortschrittliche Indikator, der von Alan Hull entwickelt wurde, eliminiert praktisch die Verzögerung, die für gleitende Standarddurchschnitte typisch ist, während er gleichzeitig eine außergewöhnliche Signalgleichmäßigkeit beibehält.
Wichtigste Vort
FREE

Hochgradig konfigurierbarer Bollinger Bands Indikator. Merkmale: Hochgradig anpassbare Alarmfunktionen (bei Levels, Kreuzen, Richtungsänderungen per E-Mail, Push, Sound, Popup) Multi-Timeframe-Fähigkeit Farbanpassung (bei Niveaus, Kreuzen, Richtungswechseln) Option für lineare Interpolation Funktioniert im Strategie-Tester im Multi-Timeframe-Modus (auch am Wochenende ohne Ticks) Parameter:
Bollinger Bands Timeframe: Sie können den unteren/höheren Zeitrahmen für Bollinger Bands festlegen. Bollin
FREE

RITZ SMART TREND ADAPTIVE FINDER Präzise Trend-Intelligenz. Anpassungsfähig. Aufschlussreich. In Echtzeit. Der Ritz Smart Trend Adaptive Finder ist ein fortschrittlicher Marktintelligenz-Indikator, der entwickelt wurde, um sich entwickelnde Marktstrukturen mit dynamischer Präzision zu erkennen und sich ihnen anzupassen.
Er kalibriert seinen Analysezeitraum automatisch auf der Grundlage von Echtzeit-Volatilität, Kursmomentum und Korrelationsstärke - und liefert so eine echte adaptive Trenderkennu
FREE

Einführung in den Timebox-Indikator Der Time Box Indicator ist ein unverzichtbarer Indikator für jeden Trader. Er zeigt tägliche, wöchentliche und monatliche Boxen an, je nach Ihren Präferenzen. Sie können jedoch alle wichtigen Kursniveaus in Ihrem Chart automatisch erweitern. Sie können diese als wichtige Unterstützungs- und Widerstandsniveaus verwenden. Es ist ein sehr einfaches, aber effektives Werkzeug für Ihren Handel.
Grafik-Einstellung Weißes Diagramm verwenden Linienstil für den aktuell
FREE

Es handelt sich um den gleichen klassischen Stochastik-Indikator, aber mit einem kleinen Twist: Wir haben die Signallinie durch eine 2-farbige Linie ersetzt, so dass wir ihn mit EAs als Filtersystem verwenden können. Und das war's! Ich weiß, es könnte dumm erscheinen, aber ich brauchte das, also habe ich es erstellt. Die ursprüngliche Formel stammt direkt von Metaquote, keine Hinzufügungen, keine Subtraktionen, es ist Stochastics in seinem Kern.
Daher werde ich die Stochastics-Parameter hier nic
FREE

INDICATOR: Trendlinie GEN INDICATOR: Trendlinie GEN Entwickler: gedeegi Allgemeine Beschreibung Trend Line GEN adalah indikator yang secara otomatis menggambar trendline berdasarkan titik-titik swing penting (highs dan lows) pada chart. Dieser Indikator kann als Unterstützung und Widerstand dienen, um den Handel zu unterstützen. Hauptmerkmale Automatische Swing-Erkennung: Mengidentifikasi pivot high dan pivot low secara otomatis. Flexible Slope-Berechnung: Pilihan metode perhitungan kemiringan
FREE

"Präsentieren Sie NakaTrend: Ihr ultimativer Trenddetektor für MetaTrader 5!
Bereit, Ihr Handelserlebnis zu revolutionieren? Lernen Sie NakaTrend kennen, Ihren zuverlässigen Indikator zur präzisen und einfachen Identifizierung von Trendwechseln.
Mit NakaTrend verpassen Sie nie wieder die Gelegenheit, Marktschwankungen zu nutzen. Wenn ein Bullentrend entsteht, signalisiert NakaTrend dies mit einem grünen Dollarzeichen und fordert Sie auf, eine Kauforder zu platzieren. Und wenn sich die Stimmun
FREE

Der Algorithmus basiert auf der Idee des Currency Power Meter-Indikators. In dieser Version ist die Anzahl der angezeigten Werte unbegrenzt, der Code ist kompakter und schneller, Werte des aktuellen Balkens können über Indikatorpuffer abgerufen werden. Was der Indikator zeigt : Ein dünnes Band und die obere Zahl vor der Währung zeigen den relativen Stärkeindex für die letzten N Stunden (N wird in den Parametern in der Variablen 'Stunden' eingestellt), ein breiteres Band zeigt den Tagesindex an
FREE

1. Überblick Vielen Dank, dass Sie sich für die SuperTrend Suite für MT5 entschieden haben. Dieses Paket bietet eine Reihe von leistungsstarken Tools für die Trendanalyse, die sich nahtlos in Ihre MetaTrader 5-Plattform integrieren lassen. Diese Suite umfasst zwei Komponenten: SuperTrend-Indikator : Ein robuster Trendfolge-Indikator, der den aktuellen Markttrend direkt auf Ihrem Chart anzeigt, komplett mit Einstiegssignalen und Warnungen. SuperTrend Screener EA : Ein Multi-Symbol-Dashboard, das
FREE

Sehen Sie sich meinen TRADE PLANNER MT5 an - dringend empfohlen, um Kontoszenarien zu antizipieren, bevor Sie Geld riskieren. Dies ist der Bill Williams Awesome Oscillator-Indikator, der aus Heikin Ashi-Kerzen berechnet wird. Hier finden Sie ein mehrfarbiges Histogramm, das hilfreich ist, wenn Sie Schwäche oder Stärke des Trends auf dem Markt erkennen wollen. Um ihn zu verwenden, legen Sie ihn einfach auf dem Chart ab und Sie müssen keine Parameter ändern, außer einem: zwischen Heikin Ashi und
FREE
TW Volume Signal Pro MT5 nutzt fortschrittliche KI-Technologien und proprietäre intelligente Algorithmen, um Ihnen ein selbstbewusstes Handeln am Goldmarkt zu ermöglichen und ein einzigartiges, unvergleichliches Handelserlebnis zu bieten.
Suchen Sie nach hoher Genauigkeit und außergewöhnlichen Handelssignalen im Goldmarkt? Mit TW Volume Signal Pro MT5 können Sie ein professioneller Trader werden und großen Erfolg im Goldhandel erzielen. Probieren Sie es kostenlos aus!
Hauptfunktionen von TW V
Der Absorption & Exhaustion Detector Professional-Indikator ist ein hochentwickeltes Instrument zur Volumenanalyse, das dazu dient, kritische Wendepunkte auf dem Markt zu identifizieren, indem es die Beziehung zwischen der Preisbewegung und dem kumulativen Volumen-Delta (CVD) analysiert. Dieser Indikator hilft Händlern zu erkennen, wenn Kursbewegungen nicht durch das Volumen bestätigt werden, was auf potenzielle Absorptions- oder Erschöpfungszonen hinweist. SCHLÜSSEL-EIGENSCHAFTEN Berechnung und

Dieser Indikator zeigt Point & Figure Charts (PnF-Charts) im Indikatorfenster an. PnF-Diagramme zeigen nur Kursbewegungen an, die größer als die angegebene Boxgröße sind. Dies hilft, Rauschen zu eliminieren und ermöglicht die Konzentration auf die wichtigsten Trends. Die Zeit spielt hier keine Rolle. Es werden nur Preisbewegungen berücksichtigt. Aus diesem Grund ist der PnF-Chart nicht mit dem Hauptchart synchronisiert, an den er angehängt ist. Mehr über PnF-Charts: http://stockcharts.com/school
FREE
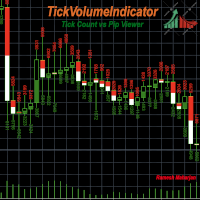
Es gibt verschiedene Indikatoren und Methoden, um Trends in einem Chart zu erkennen. Der TickVolumeIndicator ist einer davon. Er hilft Ihnen, zukünftige Trends zu erkennen und vorherzusagen, indem er vergangene Trends anhand von Tick-Daten anzeigt.
Der TickVolumeIndicator ist ein Indikator, der die im Chart sichtbaren Kerzen anhand der Tick-Volumina einfärbt. Tick-Volumina sind Geld- und Briefwerte. Benutzer können entweder die Geld- und Briefwerte der Ticks oder die Pip-Änderungen für den Zei
FREE

Hast du schon einmal daran gedacht, einen Scanner zu haben, der alle Strategien durchsucht und die Kauf- und Verkaufspunkte aller Zeiträume für dieses Asset gleichzeitig anzeigt? Genau das macht dieser Scanner. Dieser Scanner wurde entwickelt, um die Kauf- und Verkaufssignale anzuzeigen, die du im Rule Plotter: Strategieersteller ohne Programmierung erstellt hast, und sie in diesem Scanner auf verschiedenen Assets und Zeiträumen auszuführen. Die Standardstrategie des Rule Plotters besteht nur au
FREE

TransitTrendlines ist ein automatischer Trendlinienzeichner, der sowohl horizontale als auch diagonale Trendlinien zeichnet. Die horizontalen Trendlinien sind die Pivotpunkte des Tageszeitrahmens und die diagonalen Trendlinien basieren auf den aktuellen Zeitrahmen. Sie können die diagonalen Trendlinien anpassen, indem Sie die Anzahl der Balken erhöhen, um die diagonale Trendlinie zu zeichnen, und Sie können auch die Steilheit anpassen. Beachten Sie, dass die horizontalen Trendlinien auf den Tage
FREE

Prinzip der Funktionsweise Der Indikator basiert auf den grundlegenden Kursdaten: Hoch, Tief und Schlusskurs , die in Form von Ganzkörperkerzen angeordnet sind.
Jede Kerze stellt visuell das Marktverhalten über einen bestimmten Zeitraum dar. Wenn die Kerze bullisch ist, deutet dies auf Kaufdruck hin. Wenn die Kerze bärisch ist, deutet dies auf Verkaufsdruck hin. Die Größe des Kerzenkörpers zeigt die Stärke von Käufern oder Verkäufern an:
Größere Körper weisen auf eine stärkere Dynamik hin, währe
FREE

Dies ist ein nützliches Dienstprogramm zur Überwachung der Ausbreitung und auch zur Aufzeichnung von Informationen in einer Datei. (Die Dateien werden in "Common\Files\Spread Monitor" gespeichert). Es besteht die Möglichkeit, den Indikator dank des Herunterladens von Ticks Hoch/Tief in die Vergangenheit berechnen zu lassen. (Das ist eine langsame und sinnvolle Sache! Am besten ist es, wenn Sie den Indikator an einen Chart anhängen und ihn den Spread in Echtzeit aufzeichnen lassen). Es gibt auch
FREE

Der VWAP-Level-Indikator ist ein technisches Analyseinstrument, das den gewichteten Durchschnittspreis für das gehandelte Volumen eines bestimmten Vermögenswerts berechnet. Der VWAP liefert Händlern und Anlegern den Durchschnittspreis eines Vermögenswerts über einen bestimmten Zeitraum.
Er wird häufig von Anlegern verwendet, um Daten zu "passiven" Handelsgeschäften zu vergleichen, z. B. von Pensionsfonds und Investmentfonds, aber auch von Händlern, die überprüfen wollen, ob ein Vermögenswert z
FREE

Bollinger Bands Stop Indicator holds significant importance for traders navigating the complex world of financial markets. Its relevance lies in several key aspects. Firstly, it aids in trend identification. By analyzing price movements relative to the Bollinger Bands, traders can discern whether the market is in an uptrend, downtrend, or ranging phase. Secondly, the indicator provides valuable insights into market volatility. Wider bands indicate higher volatility, while narrower bands suggest
FREE

Das ADX-Histogramm ist eine moderne und visuelle Erweiterung des klassischen Average Directional Index (ADX ).
Es wandelt die Standard-ADX- und DI+ / DI--Werte in ein farbkodiertes Histogramm um, wodurch die Trendanalyse viel klarer und schneller wird. Hauptmerkmale: Histogramm mit vier Zuständen : Blau = Normaler Kauftrend Grün = Starker Kauftrend Orange = Normaler Verkaufstrend Rot = Starker Verkaufstrend Automatische Erkennung der Stärke : verwendet die ADX-Linie, um "normale" von "starken" S
FREE
Der Hammer- und Doji-Scanner ist ein leistungsstarkes technisches Analysetool, das für MetaTrader-Plattformen wie MetaTrader 4 (MT4) und MetaTrader 5 (MT5) entwickelt wurde, um wichtige Candlestick-Muster, insbesondere den Hammer und den Doji , zu erkennen und hervorzuheben. Diese Muster werden von Händlern häufig verwendet, um potenzielle Trendumkehrungen oder Phasen der Unentschlossenheit auf dem Markt zu erkennen. Hammer: Der Hammer ist ein bullisches Umkehrkerzenmuster, das nach einem Abwärt
FREE

Ein einfacher Preis-Aktions-Indikator, um innere und äußere Balken (Kerzen) mit Farben hervorzuheben. Es ist möglich zu wählen, welche Art von Bar hervorgehoben werden kann: innen, außen oder beides. Es ist möglich, eine erste spezifische Farbe für den Schatten und den Rand der Balken (Kerzen), eine zweite spezifische Farbe für Hoch-/Bullenbalken (Kerzen) und eine dritte spezifische Farbe für Abwärts-/Bärenbalken (Kerzen) zu wählen.
FREE

Der volumengewichtete Durchschnittspreis (VWAP) ist eine von den großen Akteuren häufig verwendete Handelsbenchmark, die den Durchschnittspreis angibt, zu dem ein Symbol während des Tages gehandelt wurde. Er basiert sowohl auf dem Volumen als auch auf dem Preis. Dieser Indikator enthält Daily VWAP und MIDAS' VWAP, d.h. Sie können den Beginn der MIDAS-Berechnungen verankern und somit diese Methodik nutzen, um Preis- und Volumenbewegungen nach dem Ankerpunkt zu untersuchen. Sie können bis zu 3 HIG
FREE

The Stochastic Oscillator is one of the main indicators used in the analysis of financial assets. It is one of the highlights in the study of price movements and can be an important indicator of changing trends in the capital market. Stochastic is an oscillator used to identify when an asset is overbought or oversold. It consists of two lines: %K, which is calculated from the highs and lows of a period, and %D, which is a moving average of %K. Our version contains color filling, which facilitate
FREE

RSI-Indikatoren (Relative Strength Index) in Kerzenfarben ändern die Farben der Kerzen auf dem Kursdiagramm, um RSI-Bedingungen wie überkaufte/überverkaufte Niveaus oder bullisches/barrisches Momentum visuell darzustellen. Dabei werden Farben wie Rot für überkauft/barrisch und Grün für überverkauft/bullisch verwendet, um Händlern zu helfen, Umkehrungen oder Stärke auf einen Blick zu erkennen, ohne auf das separate RSI-Fenster zu schauen. Diese benutzerdefinierten Indikatoren färben Kerzen oft
FREE
Correlation Monitor ist ein Indikator zur schnellen Erkennung von Zusammenhängen zwischen Instrumenten: Er hilft, Paare mit starker positiver/negativer Korrelation zu finden, Divergenzen zu erkennen und fundiertere Entscheidungen für Hedging, Pair‑ und Basket‑Trading zu treffen. Meta traider 4. Hauptfunktionen • Korrelationsmatrix und kompakte Liste: zeigt sofort die Stärke der Beziehung zwischen ausgewählten Symbolen; farbliche Kennzeichnung erleichtert das Lesen. • Mini‑Chart des korrelierten
FREE

Der Indikator Angebotsnachfrage RSJ PRO berechnet und zeichnet die Zonen "Angebot" und "Nachfrage" auf dem Diagramm, identifiziert den Zonentyp (schwach, stark, verifiziert, nachgewiesen) und zeigt im Falle von erneuten Tests der Zone an, wie oft es ist wurde erneut getestet. "Angebots"-Zonen sind die Preiszonen, in denen mehr Angebot als Nachfrage aufgetreten ist, was die Preise nach unten treibt. "Nachfrage"-Zonen sind die Preiszonen, in denen mehr Nachfrage als Angebot aufgetreten ist, was d
Regime Radar - Marktregime + Bias Stops (MT5) Regime Radar zeigt das aktuelle Marktregime - Range, Schwacher Trend, Starker Trend oder Schock - und zeichnet ATR-basierte Stop-Linien auf dem Chart. Es bietet auch ein kompaktes Panel mit Regime, Richtung, Vertrauen und optionalen RSI/Bollinger-Vorschlägen. Dies ist ein Analysetool; es liefert keine Handelssignale und garantiert keine Gewinne. Wichtigste Funktionen Regime-Erkennung in vier Zuständen (Range, Schwacher Trend, Starker Trend, Schock).
FREE

Dieser Indikator basiert auf dem Parabolic SAR Indikator. Er hilft dem Benutzer zu erkennen, ob er kaufen oder verkaufen soll. Er verfügt über einen Alarm, der ertönt, sobald ein neues Signal erscheint. Ihre E-Mail-Adresse und die Einstellungen für den SMTP-Server sollten im Einstellungsfenster der Registerkarte "Mailbox" in Ihrem MetaTrader 5 angegeben werden. Blauer Pfeil nach oben = Kaufen. Roter Pfeil nach unten = Verkaufen. Linie = Trailing Stop. Sie können eines meiner Trailing Stop-Produk
FREE

[ MT5-Version ] AO unbezahlte Abweichungen MT5 AO unbezahlte Divergenzen ist der erste Indikator, der entwickelt wurde, um regelmäßige und versteckte Divergenzen detailliert zu analysieren. Es verwendet diese Analyse, um mögliche Einstiegspunkte und Take Profit-Punkte zu finden. Nachfolgend einige der Merkmale dieses Indikators: Zeitersparnis Hochgradig anpassbar Funktioniert für alle Paare (Krypto, Forex, Aktien, Indizes, Rohstoffe...) Geeignet für Scalping oder Swing-Trading Mögliche Umk

Trading Dashboard Pro: Die ultimative Kommandozentrale für MT5 Verwandeln Sie Ihr Terminal in eine professionelle Trading-Station Trading Dashboard Pro ist ein umfassendes Tool für Risikomanagement und Kontoanalyse. Es bündelt wichtige Marktdaten und Kennzahlen zur Kontogesundheit in einer eleganten Oberfläche, damit Sie sich auf das Wesentliche konzentrieren können: die richtigen Entscheidungen zu treffen. WARUM SIE DIESES DASHBOARD BRAUCHEN 1. Für Prop-Trading-Firmen (FTMO, MFF usw.)

Trendy Stock ist ein Preisverfolgungsindikator, der die Stochastik verwendet, um zu zeigen, wann der Preis den überverkauften oder überkauften Bereich verlässt. Der Algorithmus ermöglicht es Ihnen, länger in einem Trend zu bleiben, wenn die Bullen oder Bären die Kontrolle haben. Der Indikator ändert seine Farbe, sobald der Preis den überverkauften/überkauften Bereich verlässt. Kurz gesagt, die [roten] Abwärtstrend-Balken beginnen zu malen, wenn der Kaufdruck nachlässt, während die [grünen] Aufwä
FREE
FOTSI – Forex Übersicht True Strength Index Entdecke die wahre Stärke jeder Währung und handle mit Vorteil. Der FOTSI Indikator ist ein Multiwährungs-Oszillator , der die reale Dynamik jeder Hauptwährung (USD, EUR, GBP, JPY, CHF, AUD, CAD, NZD) über alle Paare hinweg misst. Anstatt nur ein einzelnes Chart zu analysieren, kombiniert FOTSI Daten mehrerer Paare, glättet die Bewegungen und wendet den True Strength Index (TSI) -Algorithmus an, um eine klare, stabile und verzögerungsfreie Ansicht der

Entdecken Sie die Geheimnisse, die die großen Marktteilnehmer Ihnen vorenthalten wollen. Haben Sie sich jemals gefragt, ob die Markt- „Wale“ immer zur gleichen Zeit und in die gleiche Richtung einsteigen? Dieser Indikator zeigt es Ihnen. Er liefert keine direkten Einstiegssignale, aber er enthüllt historische Bewegungsmuster nach Stunden oder Tagen , die normalerweise unbemerkt bleiben würden. Sie könnten beispielsweise feststellen, dass der EURUSD donnerstags um 15:00 Uhr eine 80%ige Wahrschein
FREE

Prior Cote ist ein einfacher, moderner und unverzichtbarer Indikator für Trader, die technische Analysen basierend auf den Kursniveaus des Vortags verwenden. Er zeichnet automatisch die folgenden Levels der vorherigen Handelssitzung in deinem Chart ein: • Eröffnung
• Hoch
• Tief
• Schlusskurs
• Typischer Preis Perfekt geeignet für:
• Umkehr- und Ausbruchsstrategien
• Analyse von Unterstützungs- und Widerstandszonen
• Intraday- und Swing-Trading-Setups ️ Vollständig anpassbar:
• Jede Linie
FREE
Advanced UT BOT ALERTS for MT5 Professionelles Multi-Filter-Trend-Erkennungssystem | Verbesserte UT BOT Engine Wir bieten ausschließlich hochwertige Indikatoren an. Advanced UT BOT wurde für den professionellen Einsatz entwickelt und verwendet eine stabile Signallogik sowie sichere Berechnungen, um Verzögerungen oder fehlerhafte Aktualisierungen zu vermeiden.
Er zeichnet keine Signale neu, entfernt oder verändert keine historischen Daten.
Alle BUY- und SELL-Signale werden erst nach dem Kerzensch

DailyHiLo Indicator
Beherrschen Sie die tägliche Handelsspanne wie ein Profi. Dieser Indikator zeigt automatisch die Höchst- und Tiefststände des Vortags - ein Kernelement des (Beat The Market Maker) Handelsansatzes - direkt auf Ihrem Chart an. Diese Niveaus dienen als natürliche Grenzen für die Intraday-Kursentwicklung und helfen Händlern, potenzielle Umkehrzonen, Ausbruchspunkte und Liquiditätsziele zu identifizieren. Wichtigste Merkmale Präzise Darstellung des gestrigen Hochs und Tiefs für j
FREE

Eine persönliche Implementierung eines berühmten Trendprinzips, bekannt als höheres Hoch, höherer Schluss, niedrigeres Tief, niedrigerer Schluss (HHHC - HHHL). Es nutzt allein die Preisbewegung, um Trendrichtung, Trendwechsel und Pullback-Zonen zu bestimmen. [ Installationsanleitung | Update-Anleitung | Fehlerbehebung | FAQ | Alle Produkte ] Anpassbarer Ausbruchszeitraum Anpassbare Farben und Größen Es ist nicht-nachmalend und nicht-zurückmalend Er implementiert alle Arten von Alarmen Der Indika
FREE
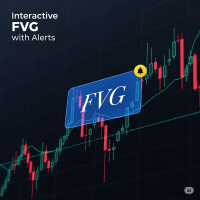
FVG-Indikator mit Warnungen Beschreibung: Dies ist ein einfacher und effektiver Indikator zur Identifizierung und Anzeige von Fair Value Gaps (FVGs) auf jedem Zeitrahmen. Der Indikator hilft Ihnen, wichtige Preisungleichgewichte zu erkennen und bietet leistungsstarke interaktive Tools für Ihre Analyse. Hauptmerkmale: Erkennt FVGs: Identifiziert klar und deutlich Bullish- und Bearish-Fair-Value-Gaps und zeichnet entsprechende Kästchen. Mittellinie: Zeigt das 50%-Gleichgewichtsniveau innerhalb jed
FREE

Volumen gibt der Preisaktion Tiefe! Volume Critical kann die günstigsten Bereiche für die Platzierung von Trades genau lokalisieren. Steigen Sie so früh wie möglich in Umkehrbewegungen ein, um die besten Risiko-Ertrags-Setups zu erhalten!
Merkmale Aggressiver Algorithmus, der Umkehrungen vorhersagt Volumen-Klassifizierungen Graue Histogramme - Normales Volumen, durchschnittliche Marktaktivität Orange Histogramme - Trending Volume, erhöhte Marktaktivität Rosa Histogramme - Überkauftes Volumen, w

Easy Correlations-Indikator Der Easy Correlations Indic ator wurde entwickelt, um Händlern bei der Analyse der Beziehung zwischen zwei korrelierten Instrumenten zu helfen. Durch die Überwachung des Abstands zwischen ihren Relative Strength Index (RSI)-Werten hebt der Indikator Situationen hervor, in denen sich ein Instrument deutlich weiter bewegt hat als das andere. Dies schafft potenzielle Handelsmöglichkeiten: Verkaufen Sie das stärkere Instrument (überstreckter RSI) Kauf des schwächeren Inst
FREE

LogVar ist ein Indikator, der die logarithmische Preisänderung berechnet und anzeigt – eine präzisere Methode zur Messung prozentualer Veränderungen zwischen Perioden. Er vergleicht den aktuellen Schlusskurs mit dem Schlusskurs n Perioden zuvor ( iPeriod ) und zeigt das Ergebnis auf einer verstärkten logarithmischen Skala. Die Linie ändert automatisch ihre Farbe: Grün: aktueller Preis über dem Referenzwert (Aufwärtstrend) Rot: aktueller Preis darunter (Abwärtstrend) Das 0-Niveau ist die neutrale
FREE
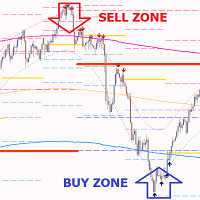
Gold PL MTF – dies ist ein hervorragender technischer Aktienindikator. Der Indikatoralgorithmus analysiert die Bewegung des Vermögenspreises und spiegelt automatisch die wichtigen Pivot-Levels des angegebenen Zeitrahmens (TF) mithilfe der Fibonacci-Methode (Goldener Schnitt) wider.
Der Indikator beschreibt die Preisentwicklung des ausgewählten Zeitrahmens (Tag, Woche, Monat, Jahr) perfekt, bestimmt den Beginn eines Trends und den Beginn einer Korrektur, die sich zu einem entgegengesetzten Tren

Der Channels-Indikator malt nicht neu, da er auf der Projektion der fallenden und steigenden Kanäle basiert. Als Händler benötigen Sie einen Weg, um Ihre Kauf- und Verkaufstransaktionen zu platzieren: Angebot und Nachfrage , Fallende und steigende Kanäle. Fallende und steigende Kanäle können sich in jedem Zeitrahmen und auch in allen Zeitrahmen gleichzeitig befinden, und der Preis bewegt sich immer innerhalb dieser Kanäle. Erfahrene Händler werden die Schlüsselebenen und Kanäle um die Zeitrahme
FREE

Jackson Support and Resistance V ist ein leistungsfähiger Indikator für Unterstützung und Widerstand, der Signale auf der Grundlage von Preisaktionen liefert. Er soll es jedem leicht machen, Unterstützung und Widerstand zu zeichnen. Wir glauben, dass die meisten Strategien mit Unterstützung und Widerstand als Grundlage aufgebaut werden, und dass eine perfekte Unterstützung und ein perfekter Widerstand Ihre Handelsweise verändern können. Es ist flexibel für alle Instrumente. Vergessen Sie nicht,
FREE

Divergence Hunter - Professionelles Multi-Oszillator-Divergenzerfassungssystem Übersicht Divergence Hunter ist ein professioneller technischer Indikator zur automatischen Erkennung und Visualisierung von Preis-Oszillator-Divergenzen über mehrere Zeitrahmen hinweg. Dieser Indikator wurde für ernsthafte Trader entwickelt, die die Macht des Divergenzhandels verstehen. Er kombiniert präzise Erkennungsalgorithmen mit einer intuitiven visuellen Schnittstelle. Hauptmerkmale Unterstützung mehrerer Osz
FREE

Auto Fixed Range Volume Profile mit Warnungen für MT5
Dieser Indikator zeigt, wo der Preis mehr Zeit verbracht hat, und hebt wichtige Niveaus hervor, die beim Handel verwendet werden können.
und kann die Preisdichte im Laufe der Zeit anzeigen und die wichtigsten Preisniveaus, den Wertbereich und den Kontrollwert einer bestimmten Handelssitzung umreißen. Dieser Indikator kann an Zeitrahmen zwischen M1 und D1 angehängt werden und zeigt das Marktprofil für tägliche, wöchentliche, monatliche oder

Beschreibung :
Wir freuen uns, Ihnen unseren neuen kostenlosen Indikator vorzustellen, der auf einem der professionellen und beliebten Indikatoren auf dem Devisenmarkt (Parabolic SAR) basiert. Dieser Indikator ist eine neue Modifikation des ursprünglichen Parabolic SAR-Indikators. Diese Überkreuzung ist kein Signal, sondern spricht über das Potenzial für das Ende der Bewegung. Sie können mit dem Kauf bei einem neuen blauen Punkt beginnen und einen Stop-Loss ein Atr vor dem ersten blauen Punkt
FREE

King Smart Liquidity MT5 ist ein fortschrittlicher analytischer Indikator, der speziell dazu entwickelt wurde, institutionelle Geldflüsse und Großbanken auf Forex, Gold, Indizes, Bitcoin und anderen Märkten zu verfolgen. Dieser Indikator wurde auf der Grundlage der "Smart Money Concept"-Methodik entwickelt, die auf dem Verständnis von Price Action, Liquiditätszonen und dem Marktverhalten großer Finanzinstitute basiert. Der Indikator zeichnet nicht nur einfach Linien oder Zonen, sondern bietet e

Dies ist Ihre Chance, mit dem Raten aufzuhören und Ihre Strategie zu verstehen. 281 Trades verfolgt | 64% Gewinnrate | 70% Risiko-zu-Rendite-Verhältnis in historischen Daten Dies sind nicht nur Zahlen – es sind echte Statistiken, die Ihnen zeigen, wie diese Strategie funktioniert. Wenn Sie nach einer Möglichkeit suchen, intelligenter zu handeln, ist dies das Werkzeug, das Sie dorthin bringt. Haben Sie gerne die Realität der Engulfing-Strategie gesehen? Nach Ihrem Kauf kontaktieren Sie uns , und
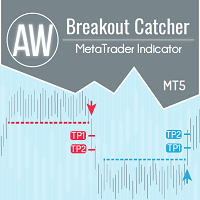
Aufschlüsselung der Preisniveaus, erweiterte Statistiken, TakeProfit-Berechnung und 3 Arten von Benachrichtigungen. Vorteile: Zeichnen Sie Ihre Ergebnisse nicht neu Signal ausschließlich am Ende der Kerze Filteralgorithmus für falsche Aufschlüsselung Es passt gut zu jeder Trendstrategie. Funktioniert mit allen Tools und Zeitreihen Handbuch und Anleitung -> HIER / Problemlösung -> HIER / MT4-Version -> HIER Wie man mit dem Indikator handelt Handeln Sie mit AW Breakout Catcher in nur dr
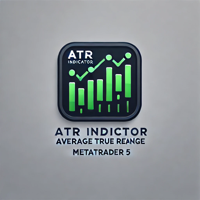
Der ATR-Indikator (Average True Range) ist ein leistungsstarkes Instrument zur Messung der Marktvolatilität. Dieser Indikator liefert genaue Daten zu den Preisbewegungsspannen und hilft Händlern, Risiken effektiver zu verwalten und fundierte Handelsentscheidungen zu treffen. Er basiert auf dem weit verbreiteten ATR-Indikator und eignet sich sowohl für professionelle Händler als auch für Anfänger zur Analyse der Marktvolatilität. Mit dem ATR-Indikator können Sie die aktuelle Kursbewegungsspanne v
FREE

Spline Searcher MT5 — Multi-Währungs-Indikator zur Früherkennung von Preissplines und Interessenspunkten Hilfswerkzeug zur automatischen Erkennung und Visualisierung früher Stadien komplexer Preisformationen. Der Indikator ist ausschließlich für das manuelle Trading konzipiert und eignet sich für Händler, die mit der Früherkennung fortgeschrittener Marktformationen oder Trends experimentieren, deren Bestandteil einfachere Formationen sein können. Der Indikator identifiziert bis zu sechs Arten v

Channel Searcher MT5 — Multi-Währungs-Indikator zur Erkennung von Preis-Kanälen Hilfswerkzeug zur automatischen Erkennung und Visualisierung von Preis-Kanälen auf Basis fraktaler Extrempunkte und geometrischer Analyse. Der Indikator ist ausschließlich für das manuelle Trading konzipiert und eignet sich für Trader, die einen strukturellen Marktzugang bevorzugen. Er identifiziert Kanäle anhand mehrerer Kriterien: Anzahl der Berührungen, Neigung, Füllgrad, Tiefe des Breakouts und relative Position

MaRSI Scalper & Trader Die Kombination aus gleitenden Durchschnitten und RSI Diese Einstellung ist flexibel, so dass sie im Hinblick auf den Benutzertest eingestellt werden kann verwendet 1. Für Scalping 2. Für den langfristigen Handel
Merkmale 1. Sendet Push-Benachrichtigungen 2. Sendet Benachrichtigungen an Computer 3. Zeichnet Pfeile 4. Zeichnet entsprechende Indikatoren (diese Funktion wird in Zukunft bearbeitet werden)
Feedback haben https://t.me/Tz_Trade_Logics oder rufen Sie einfach +2
FREE
MetaTrader Market - der einzige Shop, in dem man Handelsroboter als Demoversion herunterladen und testen sowie anhand historischer Daten optimieren kann.
Lesen Sie die Beschreibung und Bewertungen anderer Kunden über das gewünschte Produkt, laden Sie es direkt ins Terminal herunter und erfahren Sie, wie man einen Handelsroboter vor dem Kauf testet. Nur bei uns können Sie ein Programm testen, ohne dafür zu bezahlen.
Sie verpassen Handelsmöglichkeiten:
- Freie Handelsapplikationen
- Über 8.000 Signale zum Kopieren
- Wirtschaftsnachrichten für die Lage an den Finanzmärkte
Registrierung
Einloggen
Wenn Sie kein Benutzerkonto haben, registrieren Sie sich
Erlauben Sie die Verwendung von Cookies, um sich auf der Website MQL5.com anzumelden.
Bitte aktivieren Sie die notwendige Einstellung in Ihrem Browser, da Sie sich sonst nicht einloggen können.