Technische Indikatoren für den MetaTrader 5 - 12

Volume Profile Flex - POC, VAH und VAL mit Preisniveauanzeige
Volume Profile Flex ist ein flexibler und leistungsoptimierter Volumenprofil-Indikator, der Händlern helfen soll, wichtige Kursniveaus auf der Grundlage des gehandelten Volumens und nicht der Zeit zu identifizieren.
Der Indikator bietet einen klaren Überblick über Marktakzeptanzbereiche, Preisablehnungszonen und die am aktivsten gehandelten Preisniveaus direkt im Chart. Hauptmerkmale:
Der Indikator berechnet automatisch die wichtigs
FREE

Dieser Indikator implementiert den QQE-Algorithmus (Qualitative Quantitative Estimation) für MetaTrader 5, der die Logik der Volatilitätsbänder beinhaltet. Der Indikator kombiniert den Relative Strength Index (RSI) mit der Average True Range (ATR), um die Marktrichtung zu bestimmen. Das Histogramm ändert seine Farbe auf der Grundlage der Interaktion zwischen dem RSI-Momentum und dem berechneten Volatilitätskanal. Technische Logik: Der Algorithmus glättet die RSI-Werte und konstruiert obere und u
FREE

Delta Single Volume ist ein sehr leistungsfähiger Indikator, der das Angebot auf dem Markt anzeigt.
Er berechnet das Delta aus der Bewegung des Preises und der Differenz der KAUF- und VERKAUFS-Volumina. Seine spezielle Struktur ermöglicht es Ihnen, alle auf der MT5-Plattform verfügbaren Zeitrahmenwerte zu erhalten. Es arbeitet mit Tick-Volumen und Real-Volumen (falls bei Ihrem Broker verfügbar). Eine gute Beobachtung dieses Instruments kann großartige Einstiegspunkte und mögliche Umkehrungen vo

Fractals Dynamic Fractals Dynamic – ist ein modifizierter freier Fraktalindikator von Bill Williams, bei dem Sie die Anzahl der Balken links und rechts manuell festlegen und so einzigartige Muster im Diagramm erstellen können. Jetzt haben alle Handelsstrategien, die auf dem Fractals Dynamic-Indikator basieren oder auf denen der Indikator basiert, ein zusätzliches Signal.
Darüber hinaus können Fraktale als Unterstützungs- und Widerstandsniveaus fungieren. Und einige Handelsstrategien zeigen
FREE

Hier kommt der Indikator zu Ihnen, der den Handel mit synthetischen CRASH-Indizes auf der Handelsplattform Deriv mt5 revolutionieren wird.
God-Spike-Crash.
Haupteigenschaften:
Wird nur in CRASH-Indizes verwendet. Es hat einen Trendfilter. Senden Sie Warnungen nur, wenn der Markt nach unten geht. Akustische Warnungen. Sie können Benachrichtigungen an Mobiltelefone senden.
Wie benutzt man:
Gelten in Zeitlichkeiten von m1 und m5. Warten Sie auf den akustischen Alarm. Analysieren Sie, ob e
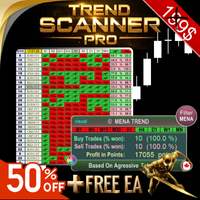
Trend-Scanner PRO Zunächst einmal ist es wichtig zu betonen, dass dieses Handelssystem zu 100 % nicht nachzeichnend, nicht nachziehend und nicht nachlaufend ist ,
was es ideal für manuelle und algorithmische Handelssysteme macht. Online-Kurs, Benutzerhandbuch und herunterladbare Voreinstellungen inbegriffen. Das Trend Scanner Dashboard ist ein professioneller Multi-Paar-Scanner , der mehrere Symbole und Zeitrahmen gleichzeitig analysiert und Ihnen einen sofortigen Überblick über die tatsächliche

Der VR Donchian -Indikator ist eine verbesserte Version des Donchian-Kanals. Die Verbesserungen betrafen fast alle Funktionen des Kanals, der Hauptbetriebsalgorithmus und die Kanalkonstruktion blieben jedoch erhalten. Je nach aktuellem Trend wurde dem Ball-Indikator eine Änderung der Farbe der Niveaus hinzugefügt – dies zeigt dem Händler deutlich eine Trendänderung oder eine Seitwärtsbewegung an. Es wurde die Möglichkeit hinzugefügt, den Händler über den Ausbruch einer von zwei Kanalebenen per S
FREE

SMC LIQUIDITY Fortgeschrittene Smart Money- und Liquiditätsanalyse-Suite für MT5 in institutioneller Qualität SMC LIQUIDITY ist ein umfassendes institutionelles Toolkit, das für Händler entwickelt wurde, die ein präzises Liquiditäts-Mapping, Marktstruktur-Intelligenz, Smart Money-Konzepte und Orderflow-Bewusstsein in einer einzigen integrierten Schnittstelle benötigen. Es wurde für professionelle Arbeitsabläufe, Multi-Timeframe-Klarheit und nahtlose Ausführung unter schnelllebigen Bedingungen en
FREE

Dies ist eine erweiterte Multi-Timeframe-Version des beliebten Hull Moving Average (HMA) Merkmale Zwei Linien des Hull-Indikators in verschiedenen Zeitrahmen auf demselben Diagramm. Die HMA-Linie des höheren Zeitrahmens definiert den Trend, und die HMA-Linie des aktuellen Zeitrahmens definiert die kurzfristigen Preisbewegungen. Ein grafisches Panel mit den Daten des HMA-Indikators aus allen Zeitrahmen zur gleichen Zeit . Wenn der HMA in einem beliebigen Zeitrahmen seine Richtung geändert hat, ze

INDICATOR: GEN Zenith Entwickler: gedeegi Allgemeine Beschreibung GEN Zenith ist ein technischer Indikator zur automatischen Erkennung von Preisumkehrmustern (Zenith) auf der Grundlage der Erkennung von Pivotpreisen und Delta-Volumenbewegungen. Dieser Indikator sucht nach Punkten, an denen der Preis ein Swing-Hoch oder Swing-Tief bildet, und erkennt dann einen Ausbruch aus diesem Bereich, um ein starkes Umkehrsignal zu bestätigen. Dieser Indikator eignet sich hervorragend für Umkehr- und Ausbru
FREE

Metatrader 5 Version des berühmten Andre Machado's Tabajara Indikators. Wenn Sie Andre Machado's Technische Analyse nicht kennen, brauchen Sie diesen Indikator nicht... Für diejenigen, die ihn brauchen, und für die vielen befreundeten Trader, die um diese Portierung von anderen Plattformen gebeten haben, hier ist er...
FEATURES
8-periodischer gleitender Durchschnitt 20-Perioden Gleitender Durchschnitt 50-periodischer gleitender Durchschnitt 200-periodischer gleitender Durchschnitt Farbige Kerze
FREE

Der Markt ist schon allein deshalb unfair, weil 10 % der Teilnehmer 90 % der Mittel verwalten. Ein gewöhnlicher Händler hat kaum eine Chance, sich gegen diese "Geier" durchzusetzen. Dieses Problem kann gelöst werden. Man muss nur zu diesen 10 % gehören, lernen, ihre Absichten vorherzusehen und sich mit ihnen zu bewegen. Das Volumen ist der einzige präventive Faktor, der bei jedem Zeitrahmen und Symbol einwandfrei funktioniert. Zuerst erscheint das Volumen und wird kumuliert, und erst dann bewegt
If you love this indicator, please leave a positive rating and comment, it will be a source of motivation to help me create more products <3 Wichtigste Erkenntnisse Der Zig Zag Advanced-Indikator zeichnet Punkte auf einem Diagramm, wenn sich die Kurse um den vom Händler im Eingabebereich festgelegten Prozentsatz umkehren. Der Zig Zag Advanced-Indikator verringert die Auswirkungen zufälliger Kursschwankungen und wird zur Erkennung von Trends und Trendänderungen verwendet. Der Indikator senkt den
FREE

Dieser Indikator basiert auf dem Zickzack... Hinzugefügt: 1. 1. zusätzliche Pfeile, um das Diagramm deutlicher zu machen. 2) Preisanzeige hinzugefügt, so dass Sie den Preis besser sehen können. 3) Alarm-Einstellungen hinzugefügt, und kann das Senden von E-Mails unterstützen. Merkmale des ursprünglichen Indikators. 1) Grundlegende Konfiguration des Wellenindikators. 2. die letzten 2 ZIGZAG Punkte haben keine Stabilität, mit dem Markt und ändern, (das heißt, sagte der Benutzer die Zukunft Funktion
FREE

Heiken Ashi MT5 Indikator Verbessern Sie Ihre Marktanalyse mit dem Heiken Ashi MT5 Indikator. Dieses leistungsstarke Tool verwandelt Standard-Preisdaten in glattere, trendorientierte Kerzen, wodurch die Identifizierung von Markttrends und potenziellen Umkehrpunkten erleichtert wird. Hauptmerkmale: Klare Trendidentifikation: Unterscheiden Sie visuell zwischen Aufwärts- und Abwärtstrends durch unterschiedliche Kerzenfarben. Rauschreduktion: Filtern Sie Preisschwankungen heraus und erhalten Sie ei
FREE

Divergence Force Divergenz-Indikator Beschreibung Divergence Force ist ein Indikator, der entwickelt wurde, um Divergenzen zwischen dem Preis eines Vermögenswerts und dem MACD (Moving Average Convergence Divergence) zu identifizieren. Dieser Indikator zeichnet automatisch die Trendlinien auf den Hoch- und Tiefpunkten des Preises und des MACD und hebt potenzielle Handelsmöglichkeiten hervor. Hauptfunktionen Automatische Divergenz-Erkennung : Der Indikator erkennt automatisch bullische und bärisch
FREE
Das Level Box Tool ist ein leistungsstarker und benutzerfreundlicher benutzerdefinierter Indikator für Händler, die technische Analysewerkzeuge wie Rechtecke und Trendlinien verwenden, um wichtige Unterstützungs-, Widerstands- und Preiszonen zu identifizieren. Dieses Tool vereinfacht und beschleunigt den Prozess der Markierung von Chart-Levels und bietet mit seinem vollständig anpassbaren Panel sowohl visuelle Klarheit als auch Präzision und umfasst jetzt auch Preis-Cross-Warnungen - damit Sie n
FREE

Chart Symbol Changer für MT5 ist ein Indikator/Dienstprogramm, das Ihnen die Möglichkeit bietet, das aktuelle Chartsymbol, das mit einem Klick auf eine Symbolschaltfläche auf seinem Panel verbunden ist, zu ändern. Chart Symbol Changer für MT5 bietet Ihnen die Möglichkeit, die 32 Symboltasten nach Ihren persönlichen Vorlieben zu konfigurieren, indem Sie die Paare hinzufügen, die Sie im Auge behalten und am häufigsten handeln möchten. Auf diese Weise verpassen Sie keine Gelegenheit, denn mi
FREE

Angebots-/Nachfragezonen: beobachtbare Bereiche, an die der Preis in der Vergangenheit mehrfach herangekommen ist. Multifunktionales Tool: 66+ Funktionen , einschließlich dieses Indikators | Kontaktieren Sie mich bei Fragen | MT4-Version Der Indikator zeigt, wo sich der Preis potenziell wieder umkehren könnte. Normalerweise ist ein Level umso bedeutender, je öfter der Preis daran abgelehnt wurde. In den Eingabeeinstellungen können Sie anpassen: Schwache Zonen aktivieren oder deaktivier

* Aufgrund der Authentizität der Daten für alle wichtigen Währungen wird die Verwendung von Live-Charts empfohlen.
Was ist der UEX Pure USD Euro Index ? Beschreibung auf Englisch: https://www.mql5.com/en/market/product/152936
Entdecken Sie den wahren Puls des Devisenmarktes mit dem Pure USD & Euro Index – einem innovativen Indikator, der die verborgenen Stärken und Schwächen der beiden stärksten Währungen der Welt aufdeckt.
Anstatt sich auf ein einzelnes Paar wie EUR/USD zu verlassen, misst

War: $69 Jetzt: $49 Blahtech VWAP - Der volumengewichtete Durchschnittspreis (VWAP) ist das Verhältnis des Preises zum Gesamtvolumen. Er liefert einen Durchschnittspreis über ein bestimmtes Zeitintervall. Links [ Installieren | Aktualisieren | Dokumentation ] Funktions-Highlights
Konfigurierbare VWAP-Linie Sessions, Intervalle, verankert oder kontinuierlich Linie für die Abrechnung am Vortag Standardabweichungsbänder Warnungen bei Bar-Close oder in Echtzeit Automatische Broker- oder Tick-Volum

Der ultimative M5-Indikator für den Boom 300 indx, der klare, gefilterte Kauf-/Verkaufssignale liefert, um Marktgeräusche zu eliminieren und Ihre Handelspräzision zu verbessern. Nutzenorientiert Rechtzeitige Spike-Alarmierung
Spike-Signale
Spike-Trade-Sl 5 Kerzen
Trendfolge-Dashboard, um die Trendstärke und -richtung zu erkennen
Verwenden Sie es unter allen Marktbedingungen und es wird Ihnen helfen, profitabel und konsistent zu bleiben es sendet mt5 und mobile Benachrichtigungssignale pünktli

Dies ist eigentlich nur eine Kombination von 3 klassischen TTM_Squeeze Indikatoren, nichts besonderes. Wie ich genau weiß, ist dies im originalen TTM_Squeeze PRO Indikator implementiert. Er zeigt einen starken, mittleren und schwachen Squeeze an. Falls es jemanden interessiert, TTM_Squeeze ist nicht komplett John Carter's Erfindung. Das Konzept des Squeeze ist allgemein bekannt, ebenso wie die Methode der Squeeze-Suche mittels Bollinger Bands und Kelthner Channels. Wie verwenden
Wie immer gibt

Volumen-Delta-Kerzen bieten eine unkomplizierte Möglichkeit, die Handelsaktivitäten innerhalb jeder Kerze zu analysieren, wodurch es einfacher wird, zu sehen, was passiert, ohne einen zusätzlichen Volumenindikator zu benötigen. Dieses Tool verwendet Daten mit niedrigerem Zeitrahmen oder in Echtzeit, um den Prozentsatz des Kauf- und Verkaufsvolumens innerhalb einer Kerze als farbigen Balken anzuzeigen. Vergewissern Sie sich, dass Sie Volumen und Volumendelta verstehen, bevor Sie sich darauf einla

NeoBull Predictive Ranges ist ein umfassendes technisches Analysesystem für den MetaTrader 5. Der Indikator kombiniert fortschrittliche Volatilitätsberechnungen mit einer volumenbasierten Trendanalyse. Das Ziel dieses Systems ist es, Tradern präzise Informationen über die Marktstruktur und den Orderflow zu liefern, ohne das Chartbild zu überladen. Dieses professionelle Werkzeug wird der Community kostenlos zur Verfügung gestellt. Konzept und Hintergrund Die strategische Grundlage und die Kombina
FREE
Trendline Alert Pro ist ein MetaTrader 5-Indikator, der die von Ihnen erstellten Objekte wie Trendlinien, horizontale Linien, Rechtecke, Fibonacci-Levels überwacht und Sie sofort benachrichtigt, wenn der Preis mit ihnen interagiert.
Die MT4-Version finden Sie hier Senden Sie mir eine PM, um eine 7-tägige Testversion des Produkts zu erhalten.
Multi-Objekt-Überwachung Trendlinien, Kanäle und abgewinkelte Linien Horizontale und vertikale Linien Rechtecke (Unterstützungs-/Widerstandszonen) Fibon

Dies ist ein sehr einfacher Indikator und für jeden leicht zu verwenden. Es ist jedoch sehr visuell, nützlich und effektiv. Es ist für jedes Forex-Symbol und jeden Zeitrahmen geeignet. Aber nach meinen Tests und Untersuchungen empfehle ich nicht, es mit den Zeitrahmen M1, M5, M15 zu verwenden.
Einstellung.
- Wählen Sie Alarm Ein/Aus (standardmäßig EIN). - Wählen Sie die Zeit (Sekunden) zwischen 2 Alarmen. Standard ist 30 Sekunden
Wie es funktioniert?
- Aufwärtstrend – Wenn die Farbe des Bal
FREE
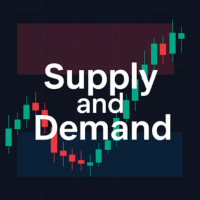
Dieser Indikator hilft beim Zeichnen von Angebots- und Nachfragezonen auf der Grundlage der ICT-Konzepte. Händler können die Farbe ihrer Nachfrage- und Angebotszonen anpassen. Standardmäßig ist die Nachfrage rot und das Angebot blau. Die vom ICT empfohlene Handelsweise besteht darin, in der Nachfragezone zu kaufen und in der Angebotszone zu verkaufen. Denken Sie daran, mehrere andere Zusammenflüsse beim Handel zu berücksichtigen. Denken Sie daran, dass es möglich ist, dass sich Angebots- und Nac
FREE

Mit dem Indikator Volume Order Blocks stellen wir Ihnen ein revolutionäres Tool vor, das für Händler entwickelt wurde, die bei ihrer Marktanalyse Präzision und Klarheit verlangen. Dieser fortschrittliche Indikator identifiziert nicht nur Orderblöcke, sondern integriert auch wichtige volumetrische Daten, die es Ihnen ermöglichen, die Stärke dieser Blöcke mit unvergleichlicher Genauigkeit zu beurteilen. MT4-Version - https://www.mql5.com/en/market/product/121237/ Hauptmerkmale der Volume Order

Spike Catch Pro 22:03 Neuerungen Erweiterte Engine für die Suche nach Handelseinträgen in allen Boom- und Crash-Paaren (300, 500 und 1000)
Programmierte Strategien Verbesserungen Mx_Spikes (um Mxd,Mxc und Mxe zu kombinieren), Tx_Spikes, RegularSpikes, Litho_System, Dx_System, Md_System, MaCross, Omx_Entry(OP), Atx1_Spikes(OP), Oxc_Retracement (AT),M_PullBack(AT) Wir haben einen Pfeil zur Strategieidentifikation hinzugefügt, der auch beim visuellen manuellen Backtesting der enthaltenen Strategie
FREE

Dies ist RSI mit Alarm und Push-Benachrichtigung -ist ein Indikator auf der Grundlage der beliebten Relative Strength Index (RSI) Indikator mit gleitendem Durchschnitt und Sie können es in Forex, Krypto, Traditionelle, Indizes, Rohstoffe verwenden. Sie können die Farben ändern, um zu sehen, wie er zu Ihnen passt. Testen Sie ihn und finden Sie heraus, was für Sie am besten funktioniert. Dieses Produkt ist ein Oszillator mit dynamischen überkauften und überverkauften Niveaus, während beim Standard
FREE

Entwickelt von smart2trader.com Der Pin Bar Color-Indikator erkennt und malt automatisch Pin Bar-Muster auf dem Chart in anpassbaren Farben und bietet flexible Einstellungen zur Identifizierung von Handelsmöglichkeiten. Darüber hinaus können Sie mit unserem Pin Bar-Indikator Pin-Bar-Musterformationen in Echtzeit überwachen und werden immer in den letzten 30 Sekunden vor dem Schließen der Kerze benachrichtigt.
Über das Pin Bar-Muster
Das Pin-Bar-Muster wird in der technischen Analyse häufig verw
FREE
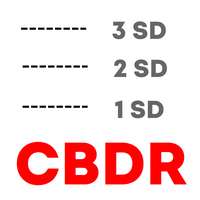
Haven CBDR ist ein benutzerfreundlicher Indikator, der im Chart den ICT „Central Bank Dealers Range“ (CBDR) Bereich anzeigt. Das Programm zeichnet Rechtecke, die den Preisbereich des CBDR markieren, und zeigt zusätzlich Standardabweichungslinien an, um mögliche Unterstützungs- und Widerstandsniveaus zu erkennen. Das Produkt ermöglicht es, den CBDR-Zeitrahmen, die Anzahl der anzuzeigenden Kalendertage, die Farben und Stile der grafischen Elemente zu konfigurieren und passt das Farbschema automati
FREE

Stargogs Spike Catcher V4.0 Dieser Indikator wurde entwickelt, um die BOOM und CRASH Indizes zu melken.
funktioniert jetzt auch auf weltrade für PAIN und GAIN Indizes. Senden Sie mir eine Nachricht, wenn Sie Hilfe mit dem Indikator benötigen. ÜBERPRÜFEN SIE DIE STARGOGS SPIKE CATCHER EA/ROBOT V3: KLICKEN SIE HIERALSO ÜBERPRÜFEN SIE DIE ZWEITE ZU NONEFX SPIKE CATCHER: KLICKEN SIE HIER STARGOGS SPIKE CATCHER V4.0 WAS NEUES! Brandneue Strategie. Dies ist der Indikator, den Sie für 2025 brauchen. N

Der ADR-Umkehrindikator zeigt Ihnen auf einen Blick, wo der Preis derzeit im Verhältnis zu seiner normalen durchschnittlichen Tagesspanne gehandelt wird. Sie erhalten sofortige Benachrichtigungen per Pop-up, E-Mail oder Push, wenn der Preis seine durchschnittliche Spanne und darüber liegende Niveaus Ihrer Wahl überschreitet, sodass Sie schnell in Pullbacks und Umkehrungen einsteigen können. Der Indikator zeichnet horizontale Linien auf dem Chart an den durchschnittlichen täglichen Range-Extreme

Sehr leistungsfähiger Indikator! Konvertiert von TradingView mit verbesserten Alerts und zusätzlichen Benachrichtigungen. Ideal für den Einsatz in EAs.
Verwenden Sie ihn als ergänzenden Indikator, um Ihre Eingaben zu bestätigen, aber er ist genauso gut für sich allein.
Der Indikator besteht aus 3 verschiedenen Trend-Metern und 2 Trend-Balken, die zur Trendbestätigung verwendet werden
Wie man es benutzt:
Je mehr Trend-Meter aufleuchten, desto besser =>>
-mehr GRÜNE FARBEN bei einem Balken bed

Dieses Dashboard ist ein Warntool zur Verwendung mit dem Indikator für die Umkehrung der Marktstruktur. Sein Hauptzweck besteht darin, Sie auf Umkehrmöglichkeiten in bestimmten Zeitrahmen und auch auf die erneuten Tests der Warnungen (Bestätigung) aufmerksam zu machen, wie es der Indikator tut. Das Dashboard ist so konzipiert, dass es auf einem eigenen Chart sitzt und im Hintergrund arbeitet, um Ihnen Benachrichtigungen zu Ihren ausgewählten Paaren und Zeitrahmen zu senden. Es wurde entwickelt,

Dieser Indikator wurde entwickelt, um den Prozess der Identifizierung und Visualisierung der Marktstruktur zu automatisieren, ein Eckpfeiler der Preisaktion und des Smart Money Concepts (SMC) Handels. Er bildet auf intelligente Weise den Fluss des Marktes ab, indem er höhere Hochs (HH), höhere Tiefs (HL), niedrigere Hochs (LH) und niedrigere Tiefs (LL) direkt auf Ihrem Chart darstellt. Wie funktioniert er? Die Logik des Indikators basiert auf der Erkennung von Pivot-Schwungpunkten anhand einer k
FREE

Dieser Indikator ist speziell für den Boom 1000 Index entwickelt worden. Der Indikator enthält optimierte Trendfilter, um Kaufspitzen in einem Aufwärtstrend zu erkennen. Der Indikator fügt außerdem ein Raster-Kaufsignal hinzu, um einen Teil des Verlustes des ersten Kaufsignals wieder aufzuholen. Der Indikator liefert auch Ausstiegssignale für verzögerte Spikes, die beim Risikomanagement helfen können, analysiert Signale für historische Daten und zeigt den Prozentsatz der guten Signale an, die d
FREE

Ein einfacher Indikator, der automatisch alle FVGs (Fair Value Gaps) hervorhebt, die sich im Chart gebildet haben, sowie die FVGs in der Historie. Es ist möglich, Farben für FVGs verschiedener Richtungen (lang oder kurz) auszuwählen, das Zeitintervall zu wählen, die Farbe des Mittelpunktes zu wählen und Sie können auch wählen, ob gefüllte FVGs gelöscht werden sollen oder ob sie auf dem Chart verbleiben sollen (die Option ist für Backtesting von Vorteil). Der Indikator kann sehr nützlich für diej
FREE

Das Penta-O ist ein 6-Punkt-Retracement-Harmonacci-Muster, das normalerweise großen Marktbewegungen vorausgeht. Penta-O-Muster können sich ausdehnen und ziemlich viel neu malen. Um die Dinge einfacher zu machen, implementiert dieser Indikator eine Wendung: Er wartet auf einen Donchian-Ausbruch in die richtige Richtung, bevor er den Handel signalisiert. Das Endergebnis ist ein sich ansonsten wiederholender Indikator mit einem sehr zuverlässigen Handelssignal. Die Donchian Breakout-Periode wird al
FREE
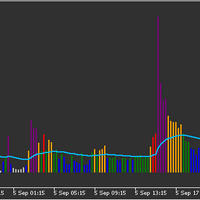
Der Volumenindikator beurteilt das Volumen pro Bar entsprechend den Regeln der Volume Spread Analysis. Es können entweder statische Volumenniveaus oder dynamische Volumenniveaus festgelegt werden, die auf einem mit dem gleitenden Durchschnitt vergleichbaren Verhältnis basieren. Die Balken werden auf der Grundlage des Verhältnisses oder der statischen Niveaus eingefärbt, wodurch das Niveau des Volumens (niedrig, durchschnittlich, hoch, extrem hoch) visuell dargestellt wird. Anmerkungen zur Versio
FREE

Liquiditätsschwankungen SMC-Zonen Liquidity Swings SMC Zones ist ein professioneller Indikator für MetaTrader 5, der automatisch liquiditätsbasierte Swing-High- und Swing-Low-Zonen direkt auf Ihrem Chart erkennt, anzeigt und aktualisiert. Dieses Tool wurde für Händler entwickelt, die Smart Money Concepts (SMC), Angebot und Nachfrage oder Unterstützungs- und Widerstands-Handelsmethoden verwenden. Merkmale Automatische Zonenerkennung:
Identifiziert signifikante Swing-Hochs und Swing-Tiefs basier
FREE
Trenddauer-Prognose Es verwendet einen gleitenden Hull-Durchschnitt (HMA), um die Trendrichtung zu erkennen und prognostiziert statistisch die wahrscheinliche Dauer der aktuellen Bewegung auf der Grundlage des historischen Marktverhaltens. Hauptmerkmale Reibungslose Trenderkennung: Verwendet den gleitenden Hull-Durchschnitt (HMA), um Rauschen zu filtern und gleichzeitig die Verzögerung zu minimieren, was klare Bullish/Bearish-Signale liefert. Echtzeit-Dauerzähler: Zeigt zu Beginn des aktuellen T
FREE

Z-Score Panel Pro Professionelles Multi-Zeitrahmen Z-Score Dashboard mit erweitertem Alarmsystem Z-Score Panel Pro verwandelt komplexe statistische Analysen in ein intuitives visuelles Dashboard, das Händlern hilft, überkaufte und überverkaufte Marktbedingungen präzise zu identifizieren. Dieser professionelle Indikator zeigt Echtzeit-Z-Score-Berechnungen über mehrere Zeitrahmen hinweg an und bietet sofortige Markteinblicke durch farbcodierte Zonen und umfassende Alarmbenachrichtigungen. Im Gegen
FREE

Phoenix Auto Fibonacci Monitor (MT5)
Professionelles Fibonacci-Analyse- und Swing-Analyse-Tool für MetaTrader 5. Erkennt automatisch dominante Marktschwankungen und liefert erweiterte Fibonacci-Retracement-Einblicke über ein visuelles Echtzeit-Dashboard.
Übersicht
Phoenix Auto Fibonacci Monitor identifiziert automatisch wichtige Marktschwankungen mithilfe von Pivot-Punkten und ATR-Validierung in höheren Zeitrahmen und zeichnet dann intelligente Fibonacci-Retracement-Niveaus direkt auf dem Cha
FREE

Closing Price Reversal ist ein sehr bekanntes und gehandeltes Candlestick-Muster. Dieser kleine Indikator malt mit spezifischen (vom Benutzer ausgewählten) Farben die Muster Closing Price Reversal Up und Down, sowie die Inside Bars (als Bonus). Höhere Zeitrahmen sind effektiver als bei allen anderen Candlestick-Mustern. Handeln Sie NICHT ausschließlich nach diesem Indikator. Suchen Sie im Internet nach "Closing Price Reversal", um mehr über die verschiedenen Ansätze zu erfahren, die mit diesem M
FREE

Schlusskurs des Vortages und Balkenverschiebung für MetaTrader! Der Indikator für den Schlusskurs des Vortages und die Balkenverschiebung ist ein Werkzeug, das entwickelt wurde, um die technische Analyse und Entscheidungsfindung im Trading zu verbessern. Mit diesem Indikator erhalten Sie detaillierte Informationen über die Eröffnungs-, Höchst-, Tiefst- und Schlusskursniveaus jedes Balkens, was eine präzise und umfassende Analyse der Marktbewegungen ermöglicht. Stellen Sie sich vor, Sie könnten e
FREE
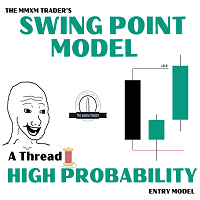
Einführung des Swing Point Model Indicator - ein professionelles Handelsinstrument Der Swing-Point-Modell-Indikator ist ein innovatives Tool, das für Händler entwickelt wurde, die die Marktstruktur erfassen und potenzielle Handelsmöglichkeiten identifizieren möchten. Mit einem logischen und transparenten Ansatz hilft Ihnen das Swing Point Model, tiefere Markteinblicke zu gewinnen und präzise Handelsentscheidungen zu treffen. Es handelt sich um einen Indikator mit mehreren Zeitrahmen, so dass Sie

Der von Chuck LeBeau entwickelte Chandelier Exit-Indikator verwendet das höchste Hoch / niedrigste Tief -/+ ein Vielfaches des ATR-Wertes, um Trailing-Stop-Linien (orange unter Käufen, magenta über Verkäufen) zu ziehen, die mit dem Trend vorrücken, bis der Trend seine Richtung ändert. LeBeau wählte den Namen Kronleuchter, denn "so wie ein Kronleuchter von der Decke eines Raumes herabhängt, hängt der Kronleuchter-Exit vom Hochpunkt oder der Decke unseres Handels herab". Der Chandelier Exit verwe
FREE

WickSniper Pro - Präziser Umkehrindikator für clevere Trader ===============================================================
WickSniper Pro ist ein leistungsfähiger **nicht-nachzeichnender** Preisaktionsindikator, der **innerhalb des Balkens liegende Ausbruchsumkehrungen** mit einer Genauigkeit wie ein Scharfschütze erkennt. Egal, ob Sie Scalper, Swing Trader oder Day Trader sind, WickSniper Pro hilft Ihnen dabei, hochwahrscheinliche Wendepunkte im Markt mit klaren, intuitiven Signalen zu erke
FREE
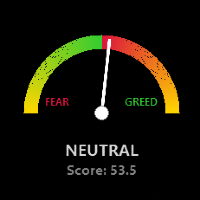
Global Market Risk Sentiment Meter 1. Abstraktion Das Global Market Risk Sentiment Meter ist ein hochentwickeltes Analysetool, das für die MetaTrader 5 (MQL5) Plattform entwickelt wurde. Im Gegensatz zu traditionellen Indikatoren, die einen einzelnen Vermögenswert isoliert analysieren, verwendet dieses Tool einen Ansatz der Inter-Market-Analyse , um den psychologischen Zustand der globalen Finanzmärkte zu rekonstruieren. Durch die Aggregation von Echtzeitdaten aus US-Indizes, globalen Aktien, K
FREE

Swing-Punkte-Indikator für MetaTrader 5
Der **Swing Points Indicator** ist ein speziell für den MetaTrader 5 (MT5) entwickeltes technisches Tool, das in erster Linie dazu dient, entscheidende Umkehrpunkte in der Preisbewegung zu identifizieren. Durch die Darstellung von Hoch- und Tiefpunkten werden potenzielle Trendumkehrpunkte hervorgehoben, was ihn zu einem wertvollen Instrument für Händler macht, die sich auf Preisaktionsanalysen verlassen. Dieser Indikator hilft Händlern, Änderungen in der
FREE
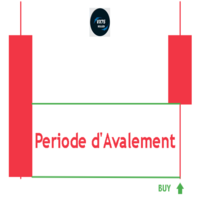
Engulfing Period V75Killed Indikator: Revolutionieren Sie Ihre Trading-Strategie!
(Dieser Indikator ist PRIVAT und ausschließlich für Trader gedacht, die seinen spezifischen Zweck und Wert kennen.) Der Engulfing Period V75Killed Indikator ist ein Game-Changer für Trader, die mühelos wichtige Engulfing-Perioden über mehrere Zeitrahmen hinweg erkennen möchten. Durch das Markieren von Engulfing-Zonen direkt auf Ihrem Chart spart dieser Indikator Zeit und verbessert Ihre Fähigkeit, Handelsmöglichke
FREE
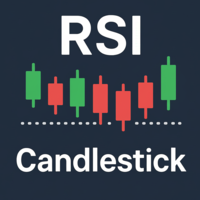
Haven RSI Candlestick ist ein innovativer technischer Indikator, der das traditionelle Liniendiagramm des Relative Strength Index (RSI) in ein intuitives Candlestick-Chartformat umwandelt.
Dieses Tool wurde für Trader entwickelt, die sich auf die technische Analyse verlassen und das Marktmomentum sowie potenzielle Umkehrpunkte schneller und tiefgehender interpretieren möchten. Weitere Produkte -> HIER . Hauptmerkmale: RSI-Visualisierung als Candlesticks: Die Kernfunktion. Sie können jetzt direkt
FREE

Sehen Sie sich meinen TRADE PLANNER MT5 an - dringend empfohlen, um Kontoszenarien zu antizipieren, bevor Sie Geld riskieren. Sie erhalten einen professionellen gleitenden Durchschnittsindikator mit mehreren verfügbaren Berechnungsmethoden, darunter exponentielle, lineare, geglättete und linear gewichtete Ansätze. Der Indikator wurde für geglättete Heikin Ashi-Kerzen entwickelt, die im Ordner "Beispiele" von Meta Trader 5 enthalten sind. Durch die Anwendung dieses Tools können Händler unerwünsc
FREE

Dieser Indikator verwendet den Zigzag-Indikator, um Schwunghochs und Schwungtiefs im Preisdiagramm zu identifizieren. Sobald er die Schwunghochs und Schwungtiefs identifiziert hat, kann er sie zur Bestimmung potenzieller Unterstützungs- und Widerstandsniveaus verwenden. Ein Unterstützungsniveau entsteht, wenn der Kurs fällt und von einem Schwungtief wieder nach oben abprallt, was darauf hindeutet, dass auf diesem Niveau ein Kaufdruck besteht. Ein Widerstandsniveau entsteht, wenn der Kurs steigt
FREE
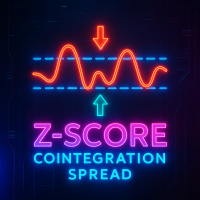
Der Indikator berechnet und zeigt den Z-Score-Spread (kointegrierter Spread) zwischen zwei Finanzinstrumenten an. Er basiert auf der Methode der gewöhnlichen kleinsten Quadrate (OLS) zur Schätzung des Beziehungskoeffizienten zwischen den Preisen zweier Symbole und normalisiert dann die Spread-Verteilung in Z-Score-Werte. In einem separaten Indikatorfenster sehen Sie: Haupt-Z-Score-Linie (rot) Obere und untere Schwellenwerte (silber, gestrichelt), die vom Benutzer festgelegt werden Wenn die Schwe
Meine anderen Indikatoren: h ttps:// www.mql5.com/en/market/product/156702 https://www.mql5.com/en/market/product/153968 (KOSTENLOS) https://www.mql5.com/en/market/product/153960 (KOSTENLOS)
Dieser Indikator zeigt Kerzen mit höherem Zeitrahmen direkt auf Ihrem Chart mit niedrigerem Zeitrahmen an. Er ermöglicht es Ihnen, die Kursentwicklung in einem höheren Zeitrahmen zu beobachten, ohne zwischen den Charts wechseln zu müssen. Was dieser Indikator tut: Der Indikator platziert Kerzen eines ausgew
FREE

Der Pivot-Point-Indikator berechnet automatisch die Pivot-Point-Linie sowie die Unterstützungs- und Widerstandsniveaus und zeigt diese an. Der Pivotpunkt kann nach der Classic-, Floor-, Fibonacci-, Woodie-, Camarilla- oder DeMark-Formel berechnet werden. Es ist auch möglich, den Zeitraum für die Berechnung des Indikators zu wählen. Der Händler kann zwischen täglichen, wöchentlichen, monatlichen oder benutzerdefinierten Zeiträumen wählen.
Arten von Pivots Klassisch Boden Fibonacci Woodie Camari
FREE
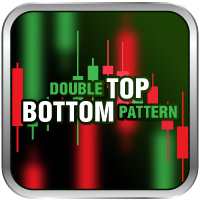
Was ist Double Top and Bottom?
Doppelte Top- und Bottom-Muster sind Diagrammmuster, die auftreten, wenn sich die zugrunde liegende Anlage in einem ähnlichen Muster wie der Buchstabe „W“ (Double Bottom) oder „M“ (Double Top) bewegt. Die Double-Top-and-Bottom-Analyse wird in der technischen Analyse verwendet, um Bewegungen in einem Wertpapier oder einer anderen Investition zu erklären, und kann als Teil einer Handelsstrategie verwendet werden, um wiederkehrende Muster auszunutzen.
Sie können die

Das wichtigste Kursniveau in jedem "Volumenprofil" ist der "Point of Control" . Dies ist das Preisniveau mit dem höchsten Handelsvolumen. Es ist in erster Linie das Niveau, auf dem große Marktteilnehmer ihre Positionen eröffnen, was es zum Akkumulations-/Verteilungsniveau für das "Smart Money" macht.
Die Idee zu diesem Indikator entstand, nachdem der Indikator "MR Volume Profile Rectangles" entwickelt wurde. Bei der Erstellung des "MR Volume Profile Rectangles" -Indikators haben wir viel Zeit d
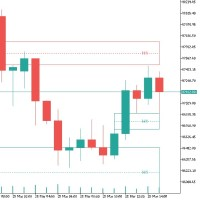
Ungleichgewichte im Trading: Grundlagen und Strategien Ein Ungleichgewicht im Trading ist ein Phänomen, bei dem ein Ungleichgewicht zwischen Angebot und Nachfrage am Markt besteht. Dies kann sich als Überschuss an Kaufaufträgen (bullisches Ungleichgewicht) oder Verkaufsaufträgen (bärisches Ungleichgewicht) äußern, was zu einer ineffizienten Preisgestaltung führt und Möglichkeiten für Trader schafft. Technische Aspekte "Kerzenmuster" : Ein Ungleichgewicht wird oft durch ein Drei-Kerzen-Muster dar
FREE
Der Indikator „UZFX-Alpha Strike Signals“ für MetaTrader 5 ist ein umfassendes Tool, das entwickelt wurde, um Handelsentscheidungen zu vereinfachen und die Disziplin zu verbessern. Er identifiziert automatisch Kauf- und Verkaufssignale mit hoher Wahrscheinlichkeit und eliminiert so Emotionen und Spekulationen aus dem Prozess.
Für jedes generierte Signal liefert der Indikator einen vollständigen Handelsplan direkt auf dem Chart. Er zeichnet präzise Einstiegs-, Stop-Loss- und bis zu fünf Take-Pro
FREE

Ein Tool für das Backtesting von Strategien auf dem Chart und die Leistungsanalyse.
Ein Dienstprogramm für die Entwicklung, das Debugging und das Testen von benutzerdefinierten Handelsideen und Indikatorfunktionen.
Ein Indikator zum schnellen Testen von Handelskonzepten und zur Visualisierung der Effektivität verschiedener Eingabeparameter.
Eine All-in-One-Sandbox zum Testen von einfachen Crossovers bis hin zu komplexen Handelssystemen mit mehreren Bedingungen.
.

Der VWAP Session Bands Indikator ist ein leistungsstarkes Tool für Meta Trader 5. Dieser Indikator berechnet den volumengewichteten Durchschnittspreis (VWAP) und seine Standardabweichungsbänder innerhalb anpassbarer täglicher Sitzungen und bietet Händlern einen klaren Überblick über Preistrends und Volatilität. Im Gegensatz zu traditionellen VWAP-Indikatoren sorgt er für glatte, kontinuierliche Linien über die Sessiongrenzen hinweg, indem er die Werte der vorherigen Kerze für den aktuellen (unvo
FREE

THE PREDICTOR: Fortgeschrittenes maschinelles Lernen und ICT-Kraftwerk Verwandeln Sie Ihren Handel vom Rätselraten in datengesteuerte Präzision. Der Predictor ist nicht nur ein weiterer Indikator, sondern eine hochentwickelte Marktanalyse-Engine, die KI-Mustererkennung mit der institutionellen Kraft von ICT-Strategien (Inner Circle Trader) kombiniert. Entwickelt für professionelle Trader, die hochpräzise Signale für Forex, Boom/Crash und Volatilitätsindizes benötigen. Warum "The Predictor

Der RoundNumbers-Indikator ist ein einfaches und leistungsstarkes psychologisches Kursniveau. Trader verwenden diese Niveaus normalerweise als Unterstützung und Widerstand (SnR). Indikator Eingabe: Levels - Anzahl der auf dem Chart gezeichneten Levels, Standardwert 30 Levels. BoxSize - Größe der Box, die auf jedem Level gezeichnet wird und die Puffer um die Levels anzeigt. 1pips (10point) oberhalb und unterhalb jedes Levels ist der Standardwert. ZoneSize - Abstand zwischen den einzelnen Levels,
FREE
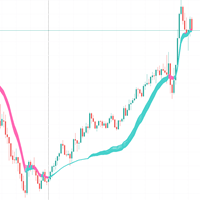
Den RSI Adaptive EMA-Indikator verstehen Dieser Code implementiert einen eigenen Handelsindikator namens "RSI Adaptive EMA" für MetaTrader-Plattformen. Es ist ein faszinierender Ansatz, der den RSI (Relative Strength Index) mit einem Exponential Moving Average (EMA) so kombiniert, dass sich der EMA an die Marktbedingungen anpasst.
Kernkonzept Herkömmliche EMAs verwenden einen festen Glättungsfaktor (Alpha), aber dieser Indikator erzeugt einen dynamischen Glättungsfaktor, der sich auf der Grundl
FREE

FORTGESCHRITTENER MARKTANALYSE-INDIKATOR Überblick über den Indikator
Dies ist kein einfacher Indikator, sondern ein prädiktives Multi-Analyse-System. Er kombiniert:
Volumenprofil (POC, VAH, VAL)
Fibonacci-Ausdehnungen
Pivot Levels (täglich, wöchentlich, 4H)
Trend-Bestimmung (MA-basiert)
Smart Money Concepts & Pattern Detection (grundlegende Platzhalter für Erweiterungen)
Prediction Engine (projiziert den Preis für 1 Stunde in die Zukunft)
Es gibt Ihnen:
Zielpreislinie (Projektion)
S
FREE
MetaTrader Market - Handelsroboter und technische Indikatoren stehen Ihnen direkt im Kundenterminal zur Verfügung.
Das MQL5.community Zahlungssystem wurde für die Services der MetaTrader Plattform entwickelt und steht allen registrierten Nutzern der MQL5.com Webseite zur Verfügung. Man kann Geldmittel durch WebMoney, PayPal und Bankkarten einzahlen und sich auszahlen lassen.
Sie verpassen Handelsmöglichkeiten:
- Freie Handelsapplikationen
- Über 8.000 Signale zum Kopieren
- Wirtschaftsnachrichten für die Lage an den Finanzmärkte
Registrierung
Einloggen
Wenn Sie kein Benutzerkonto haben, registrieren Sie sich
Erlauben Sie die Verwendung von Cookies, um sich auf der Website MQL5.com anzumelden.
Bitte aktivieren Sie die notwendige Einstellung in Ihrem Browser, da Sie sich sonst nicht einloggen können.