适用于MetaTrader 5的技术指标 - 19

FREE

Big Figure Levels – Key Psychological Price Zones for MT5 Big Figure Levels is a professional trading tool designed for MetaTrader 5 that automatically identifies and draws major psychological price levels, including quarter and half levels. These levels are known to act as powerful support and resistance zones due to their influence on both institutional and retail trader behavior. This indicator is perfect for any trading style—whether you're a scalper, day trader, or swing trader—and is compa
FREE
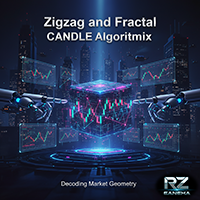
ZIGZAG and FRACTAL CANDLE PRO ( Only candles, No RSI strength panel) " Suitable for QQE RITZ " > Check My Product is an advanced market structure visualization system built for precision trend detection, powered by dynamic fractal logic and adaptive swing validation.
It seamlessly identifies Higher Highs (HH), Lower Lows (LL), and key structural shifts — allowing traders to read the true rhythm of market transitions with institutional clarity. This system combines ZigZag precision , fractal
FREE
VWAP 机器学习波段: 交易者的预测优势 使用 VWAP 机器学习波段,解锁市场分析的下一个层次——一款创新的 MQL5 指标,旨在提供对市场趋势、动态支撑/阻力以及高概率交易信号的无与伦比的洞察力。 该指标利用专有的自适应机器学习算法与成交量加权平均价格 (VWAP) 的强大功能相结合,超越了传统分析。它旨在为您提供真正的预测优势,帮助您在价格走势完全展开之前预测其动向并抓住市场机会。 为什么 VWAP 机器学习波段将成为您的首选指标: 智能自适应 ML-VWAP 核心: 体验真正动态的 VWAP 计算。我们独特的机器学习方法会根据实时波动性和市场状况自动调整其平滑度,提供比标准 VWAP 更灵敏、更准确的趋势表示。 专有预测引擎: 使用“预测”参数获得预见性。这项尖端功能将 ML 平滑的 VWAP 向前投影,让您能够强大地洞察潜在的未来价格路径,并帮助您为即将到来的市场变化做好准备。 波动率优化波段调整: 使用“Sigma”参数微调指标的灵敏度。精确控制波动率如何影响 ML 平滑和波段扩展,确保指标完美适应任何市场环境——从平静的盘整到爆发性趋势。 多层动态标准差波段: 精确识别

Fractal Model Indicator for Metatrader , meticulously crafted around the renowned Fractal Model by TTrades. This powerful tool empowers traders to navigate price action with precision, leveraging multi-timeframe analysis to anticipate momentum shifts, swing formations, and trend continuations. Designed for MetaTrader , the Fractal Model Indicator combines advanced algorithmic insights with customizable features, making it an essential addition for traders seeking to capitalize on expansive mar

SuperTrend TV-Style replicates the classic SuperTrend indicator from TradingView, now available for MetaTrader. It uses ATR-based volatility to detect trend direction and plot dynamic buy/sell zones on the chart. Green line: uptrend Red line: downtrend Arrows: buy/sell signals at trend shifts Customizable source price (HL2, HLC3, etc.) and ATR method Simple, fast, and familiar - ideal for traders switching from TradingView or looking for a clean trend-following tool.
FREE
Developed by smart2trader.com
The Didi Index Nuvem Indicator is an indicator based on the original Didi Aguiar (Didi Index) indicator, featuring two visualization methods for the moving averages: as a cloud or as lines (original). This customization offers a new way to visualize the moving average crossovers in the Didi Index indicator. About the Didi Index Indicator The Didi Index Indicator , created by Brazilian trader Didi Aguiar, is a technical analysis tool based on the crossover of three
FREE

Highly configurable Trader Dynamic Index (TDI) indicator.
Features: Highly customizable alert functions (at levels, crosses, direction changes via email, push, sound, popup) Multi timeframe ability (higher and lower timeframes also) Color customization (at levels, crosses, direction changes) Linear interpolation and histogram mode options Works on strategy tester in multi timeframe mode (at weekend without ticks also) Adjustable Levels Parameters:
TDI Timeframe: You can set the lower/higher ti
FREE

Precision Arrows – 内置止盈止损的智能交易信号 Precision Arrows 是一款功能强大的交易指标,专为追求 精准、清晰与稳定 的交易者设计。它能够识别高概率的买入和卖出信号,并自动生成 止盈(Take Profit) 和 止损(Stop Loss) 水平,帮助您在 外汇、指数、加密货币及合成指数 市场中实现纪律化、持续性的交易表现。 该指标结合了精准信号识别、智能过滤算法以及多周期趋势面板,为交易者提供一套适用于任何市场环境的完整交易解决方案。 限时优惠 Precision Arrows 指标现仅售 75 美元,终身使用 (原价 199.99 美元 )
(优惠已延长) 重要提示: 购买后请立即与我联系,以获取 使用说明与特别赠品 。 主要功能特点 三种交易模式
根据您的交易风格选择 Scalping(剥头皮) 、 Intermediate(中期) 或 Swing(波段) 模式。每种模式都会自动调整信号灵敏度与风险参数,以适应不同的市场波动情况。 内置止盈与止损
每个信号都附带预设的 TP 和 SL 水平,基于波动率与市场结构自动计算,确保稳定的交易管理并
The Moving Average Ribbon is a technical indicator that overlays a series of moving averages (MAs) on a price chart to visualize trend direction, strength, and potential reversals or reentries. It supports both Exponential Moving Averages (EMA) and Simple Moving Averages (SMA), configurable via user input.
Key Features:
Ribbon Composition: Displays 18 moving averages with periods ranging from 5 to 90 in increments of 5 (e.g., MA5, MA10, ..., MA90), plus an internal MA100 for reference. The MA5
FREE

Like most things that work in trading, it's really simple. However, it's one of the most powerful tools I have that makes entries of many systems much more precise.
In its essence, it measures the recent volatility against the medium-term average. How does it work? Markets tend to be prone to strong trending movements when relative volatility is low and tend to be mean-reverting when relative volatility is high.
It can be used with both mean-reversion systems (like the Golden Pickaxe) and mo
FREE
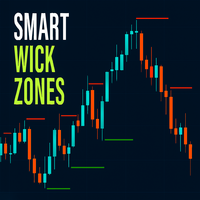
Smart Wick Zones indicator is a powerful tool designed to highlight hidden areas of price rejection and liquidity on your chart. By analyzing candle wicks (also called shadows or tails), the indicator automatically draws horizontal zones where strong buying or selling pressure has previously appeared. These wick zones often mark turning points in the market or areas where price reacts strongly, making them excellent references for support and resistance.
Instead of manually scanning candles for
FREE

Volume Weighted Average Price (VWAP) is a trading benchmark commonly used by Big Players that gives the average price a Symbol has traded throughout the day. It is based on both Volume and price. Additionally we put in this indicator the MVWAP (Moving Volume Weighted Average Price). For those who do not know the usage and the importance od this indicator I recommend a great article about this subject at Investopedia ( https://www.investopedia.com/articles/trading/11/trading-with-vwap-mvwap.asp )
FREE

Volume Weighted Average Price is used by financial institutions to place large trades at what is considered the fair value for the session. Standard deviation channels around VWAP provide potential entry points for mean reversion or breakout strategies, and the VWAP itself can act as a high quality exit level. If you've heard that volume-based analysis doesn't work for forex and CFDs, try looking at VWAP with standard deviation bands on a chart, and note the frequency with which price reacts to
FREE

這是最終的RVI指標。 添加警報箭頭 他可以確定潛在的阻力水平 額外的2個過濾器,以提高讀數 另外平滑以顯示良好的效果 它被配置為從m1到m30的短時間範圍 也不會很糟糕 我建議使用此指示器和屏幕截圖macd中的其他過濾器 這是最終的RVI指標。 添加警報箭頭 他可以確定潛在的阻力水平 額外的2個過濾器,以提高讀數 另外平滑以顯示良好的效果 它被配置為從m1到m30的短時間範圍 也不會很糟糕 我建議使用此指示器和屏幕截圖macd中的其他過濾器 這是最終的RVI指標。 添加警報箭頭 他可以確定潛在的阻力水平 額外的2個過濾器,以提高讀數 另外平滑以顯示良好的效果 它被配置為從m1到m30的短時間範圍 也不會很糟糕 我建議使用此指示器和屏幕截圖macd中的其他過濾器
FREE

AllTF Trend Bias Indicator is a professional tool to visualize market bias, designed mainly for 1-minute charts. The colors are not trading signals by themselves, but a visual compass to guide your decision-making: HiddenEdge release model
All HiddenEdge tools follow the same structured release plan.
Each indicator is released initially for free to collect feedback.
After reaching a stable user base, it moves to a fixed paid tier.
Some utilities remain permanently free as part of the Hidde
FREE
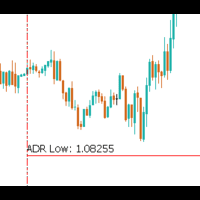
The Average Daily Range (ADR) is a powerful tool for traders, especially those focused on intraday and scalping strategies. It provides valuable insights into the expected price movement for the day and how price action is behaving relative to historical trends. The ADR indicator shows the following key information: Today's ADR : The typical range of price movement for the current trading day, based on historical data. 3x Today's ADR : Three times the current ADR, showing potential price moveme
FREE

上市特别优惠 – 免费至 2026年01月05日,或限前 100 次下载(以先到者为准) 如果您正在查看此页面,说明您仍处于专属上市推广期内。超过该期限后,本指标将按正常价格在 MQL5 Market 上出售。 Mikko Breakout Indicator – MetaTrader 5 智能突破识别指标 适用于 MetaTrader 5 的专业突破指标,支持外汇、指数和加密货币市场。 SqueezeMAX Pro 是一款专业级突破识别指标,专为追求客观性、精准度和真实执行性能的交易者设计。无重绘、无虚假信号。 该指标适用于真实账户、VPS 以及持续运行的交易环境,基于动态高点与低点的稳健逻辑,在突破发生的第一时间进行识别。 为什么经验丰富的交易者选择 SqueezeMAX Pro 有效减少图表噪音和滞后信号 实时识别高质量突破 自动适配图表显示风格 信号在 K 线收盘后固定,不会改变 极低 CPU 占用,适合 VPS 适用于外汇、指数、股票和加密货币交易,从剥头皮到波段交易均可使用。 运行逻辑 计算指定周期内的最高价与最低价 当价格突破周期最高点时识别为多头突破 当价格跌破周期最
FREE

ATR Smart Levels – 清晰了解市场可能达到的真实区域 许多交易者亏损并不是因为策略不好,而是因为错误的入场位置: 过早、在区间中间、没有合理的盈亏比结构。 ATR Smart Levels 用一个指标和三个按钮解决这一问题。 指标会自动绘制价格上下的 三个 ATR 目标区间 (TP1、TP2、TP3)。 你可以立即判断入场是否合理,以及是否有足够的波动空间。 ATR Smart Levels 的功能 基于所选周期计算 ATR。 绘制向上的 ATR 目标区。 绘制向下的 ATR 目标区。 显示市场当前的实际波动潜力。 帮助更合理地规划 入场、止损、止盈 。 三个简单按钮 DRAW – 实时生成 ATR 目标区。 FREEZE – 固定当前目标区。 DELETE – 一键删除所有 ATR 线(切换周期后也有效)。 适合的人群 初学者 :需要明确入场区域。 进阶交易者 :将波动性纳入计划。 价格行为交易者。 日内交易者与剥头皮交易者。 波段交易者。 为什么 ATR 目标区有效 ATR 测量 真实市场波动 ,因此这些区域: 客观 数学上合理 适用于所有市场 非常适合交易规划 优
FREE

VR 网格指示器 设计 用于创建具有用户定义设置的图形网格。与 标准网格 不同,VR 网格用于构建 圆形关卡 。根据用户的选择,轮次级别之间的步长可以是任意的。此外,与其他指标和实用程序不同,即使时间段发生变化或终端重新启动,VR Grid 也能保持网格的位置 。 设置、设置文件、演示版本、说明、问题解决,可以从以下位置获取 [博客]
您可以在以下位置阅读或撰写评论 [关联]
版本为 [MetaTrader 4] 垂直级别 基于实际时间间隔并 忽略缺失 或不存在的周期。因此,级别之间的步长严格对应于用户选择的值。 使用 VR 网格指标时,交易者 可以更改任何级别的垂直线和水平线的样式 、颜色和粗细。这使您可以控制金融工具的 回合水平 。 整数位是 以两个或多个零结尾 的价格(例如:1.23500、5.65900、1923.200)。人们相信,这样的水平 经常充当 作为支撑或阻力的强点。 Horizontal line settings Horizontal line step Horizontal line color Horizontal line style Horizonta
FREE

MomoPoints 是一个在图表上显示多头和空头入场点/加仓点的指标。
根据势头和趋势强度,MomoPoints 显示具有良好风险回报率的条目/添加。
设置
----------------------------------
设计:信号的颜色、大小和翼形(图形符号)可以调整。
信号设置:可以设置移动平均线周期、趋势强度、移动平均线到价格的距离以及RSI周期。
信号值可以显示为注释,以便为资产设置正确的值。该指标还可以适合每个交易对或资产。
每个资产都需要自己的设置来显示好的条目。如果您需要特定配对的设置并且您无法自行找到它,我可以帮助您。
警报:可以激活推送通知和声音语音警报。
信号实时发生,无需重新绘制
如果您有任何疑问或需要其他信息或功能,我可以随时与您联系。
FREE

Daily session open lines shows the traders three important trading session opens. By default it is set up to show you: Zero GMT Open Line London Open Session Line New York Open Session Line The default times are set according to GMT+2 and as such you are able to change and customise according to your specific time zone. The Indicator is usefull specially for the trader who trades the London and NewYork sessions.
FREE

高级甘氏形态指标 - 彻底改变您的交易方式
揭秘胜率高达 70-95% 的专业交易员不愿让您知道的秘密交易系统!
您是否厌倦了那些会重绘、发出错误信号或让您对入场和出场时机感到困惑的指标?高级甘氏形态指标将彻底改变这一切。该指标基于 W.D. Gann 传奇的 123 形态理论——正是这套系统帮助他实现了超过 90% 的交易准确率——将百年智慧融入现代自动化交易。
为什么高级甘氏形态指标能彻底改变交易格局
大多数指标的问题:
错误信号过多
没有清晰的入场/出场点
目标位模糊不清
频繁重绘
没有真实的胜率数据
使用复杂
高级甘氏形态指标的解决方案:
初步目标位准确率高达 95%
主要盈利区域胜率高达 70-80%
清晰的买入/卖出箭头
自动计算精准的止盈/止损位
实时绩效统计
设置后即可自动运行
颠覆性功能
1. 自动识别 123 形态
无需手动绘制!该指标可自动识别图表上 W.D. Gann 强大的 123 形态。当出现高概率交易机会时,您将立即知晓。
您将获得:
自动
FREE

该指标分析分形的价格结构并确定市场动态中可能的反转点。 分形可用作支撑位和阻力位
优点:
适用于所有仪器和时间序列, 不重绘其结果, 指示元素的可定制颜色, 与任何趋势策略完美搭配, 调整分形的强度。
MT4 版本指示器 -> 这里 / AW 分形 EA MT5 -> 这里
战略:
分形是蜡烛的组合,形成楔形的几何图形,中心有一个峰。也就是说,当平均价格处于峰值并且峰值之前的后续价格和前一个价格位于峰值蜡烛的下方或上方时。这些标记可以用作支撑位和阻力位。 AW 灵活分形是一种指标,它不是立即指示信号,而是由于分形的结构而有延迟。 要检测变量“分形每侧的蜡烛数”中的信号,您可以调整分形中心点每侧的柱数。 默认设置使用值“2” - 这意味着当相对于中心(上部)分形每侧都有 2 个较低的条时,将设置信号。其中,每侧最接近分形的一个将是中间的一个,下一个将是该组中最低的一个。当形态中的所有柱均闭合时,指标将绘制分形。 交易者可以调整分形的类型: 当使用“全分形”类型时,将会有更多信号,因为到达的信号的分形图不必是精确的。 当使用“强分形”类型时,接收到的信号会
FREE

Break Even Line by MMD
The Break Even line is a useful indicator for people using strategies that allow simultaneous trades in both directions, such as the MMD methodology. This indicator is useful when playing statistical models and averaging positions in accumulation and distribution zones. The indicator draws levels by summing positions in three groups: positions included in BUY, positions included in SELL and all positions included.
Functionality description:
Show BUY BELine - shows or
FREE
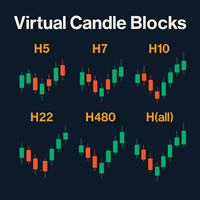
虚拟K线块(Virtual Candle Blocks)—— 视觉化无界市场 虚拟K线块 是一款为 MetaTrader 5 设计的高级指标,它能让你创建并观察任何自定义周期的 K 线,即使是那些平台本身不提供的周期。 主要特点: 自定义周期 :将基础 K 线组合成任意时长的 K 线块(例如:5 小时、14 小时、28 小时、72 小时等),从而创建全新的虚拟 K 线。这使你能够使用像 TradingView 等高级平台独有的周期。 清晰的视觉效果 :直接在图表上绘制带有实体和影线的虚拟 K 线。你可以自定义颜色、实体宽度,并选择是否显示影线,以便进行纯粹的价格行为分析。 高度可定制 :该指标包含一个简约面板,用于显示你选择的虚拟周期。它与 MT5 的所有绘图工具兼容,允许你在虚拟 K 线上标记支撑位、阻力位和趋势线。 高级分析 :将图表周期用作“缩放”功能,以检查每根虚拟 K 线的内部结构,从而提高你发现模式和趋势变化的能力。 理想用户: 价格行为交易者 :喜欢干净、无干扰图表的人。 技术分析师 :使用非标准周期来获得视觉和概念优势的人。 使用建议: 为了获得无重叠的视觉效果,我们建
FREE
This indicator provides a clear, at-a-glance dashboard for monitoring both the Relative Strength Index (RSI) and Stochastic Oscillator on any instrument or timeframe.
Whenever both RSI and Stochastic %K simultaneously exceed their respective overbought or oversold levels, the indicator displays an arrow signal in the indicator window.
These signals highlight strong momentum and can help traders quickly identify high-probability reversal zones. As with all my free tools, the arrow symbol can be e
FREE

GomerAI REGIME 指标是一款适用于 MetaTrader 5 的市场状况分类指标,旨在帮助交易者了解他们当前所处的市场环境类型。 REGIME 指标并非生成交易信号或执行交易,而是分析价格行为的三个维度——趋势强度、波动性和区间行为——将当前市场分为三种明确定义的市场状态之一: 平静期 – 低波动性,区间震荡
趋势期 – 方向性运动,波动性适中
极端期 – 波动性剧烈,可能出现趋势耗尽或转折区域
该指标以直方图的形式在图表下方的一个单独窗口中显示其输出。柱状图的颜色代表当前的市场状态,而柱状图的高度代表分类的置信水平(0-100)。 主要特点 市场状态分类(平静期/趋势期/极端期)
基于置信度的可视化(0-100)
非重绘,基于收盘价计算
适用于所有交易品种和时间周期
优化低CPU占用率
可选的遥测和许可集成
完全离线运行(独立模式)
专为提供市场背景信息而设计,而非执行交易
REGIME 指标不进行交易、管理头寸或提供入场/出场指令。它是一个提供市场背景信息的指标,旨在帮助交易者和智能交易系统根据当前市场状况调整策略。 不同的策
FREE

Chỉ báo Watermark là một công cụ trực quan thường được sử dụng để lưu trữ các ký hiệu giao dịch và khung thời gian. Các tính năng chính trên chỉ báo: Tạo nhãn dán ký hiệu giao dịch tạo nhãn dán khung thời gian giao dịch Cố định vị trí theo chart giá Chỉ báo không tác động đến các tín hiệu giao dịch của nhà đầu tư. Nếu có bất kỳ vấn đề vui lòng phản hồi lại để chúng tôi có thể cải thiện sản phẩm.
FREE

FREE

Eagle Spikes Detector v1.50 - Professional Trading Signal System Ultimate Precision Trading with Advanced SuperTrend Filtering Technology join my telegram channel to trade with me: https://t.me/ +9HHY4pBOlBBlMzc8
The Eagle Spikes Detector is a sophisticated, professional-grade trading indicator designed for serious traders who demand precision, reliability, and visual excellence. Combining advanced multi-timeframe analysis with cutting-edge SuperTrend filtering, this indicator identifi
FREE

https://www.mql5.com/en/users/gedeegi/seller
QuantumFlux Trend combines concepts from statistical physics (temperature T & energy step alpha ) with Boltzmann-style exponential weighting to produce a trend line that is more “context-adaptive” compared to traditional moving averages. The result is then smoothed with an EMA to deliver cleaner signals that are easy to read across all timeframes. The indicator automatically colors candles and trend lines: green for bullish phases, red for bearish
FREE

图表覆盖 指标在同一张图表上显示几种工具的价格走势,使您能够评估货币对相对彼此波动的差异。 [ 安装指南 | 更新指南 | 故障排除 | 常见问题 | 所有产品 ]
轻松找到超买或超卖的货币对 在同一图表上绘制最多六个货币对 必要时显示倒置符号 适应图表大小,缩放和时间表 自动价格水平计算 可定制的价格水平密度 可自定义的颜色和尺寸
什么是反向货币对? 反转货币对意味着显示两种货币之间的汇率,从而反转交易的主要货币。例如,如果要将EURUSD,GBPUSD和USDJPY绘制到同一覆盖图中,则有必要反转USDJPY以使价格反映反向汇率:JPYUSD。这样,日元/美元价格将与覆盖图的其他两个符号呈正相关关系移动,从而使图表更易于研究。
测试指标 该指标使用来自多个交易品种的价格数据绘制单个图表。由于MetaTrader 4测试仪(在撰写本文时)不支持多货币回溯测试,因此该指标无法回溯测试,因为它将不会收到来自其他本应覆盖的交易品种的报价。要测试它,请租用一个月。
输入 符号设置-键入要在覆盖图上显示的货币对或符号的名称。您需要至少输入其中之一,以便覆盖图具有两个货币对(本机和外
FREE

在資訊安全領域,暴力攻擊是指透過系統性的反覆試驗方法來取得密碼、登入憑證或加密金鑰。受此方法的啟發,我們開發了「暴力趨勢」 (Brute Force Trend),這是一款利用演算法識別模式和反轉點的市場分析工具。
主要特點:
多種計算方法-九種不同的價格處理方式,可適應不同的交易風格。
非重繪指標-訊號在K線收盤後固定,可靠度更高。
直覺的視覺化-彩色直方圖指示趨勢強度,顏色越深,越能反映趨勢的可信度。
可自訂的警報-當指標突破中心線時,提供視覺、聲音或推播通知。
配置靈活性-可根據不同的市場和策略調整週期、強度和樣式。
使用方法:
高點:當指標突破中心線時。
低點:當指標突破中心線時。
趨勢強度:顏色越深,趨勢強度越大,而灰色區域則表示市場橫盤整理或波動性較低。
強力趨勢旨在作為您分析的輔助工具,幫助您基於結構化資料做出決策。建議在不同的市場條件下進行測試,並結合其他技術進行驗證。
了解更多:@SAC_BARBOSA
FREE
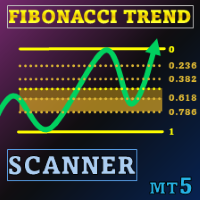
特别优惠 : ALL TOOLS ,每款仅 $35 ! New tools will be $30 for the first week or the first 3 purchases ! Trading Tools Channel on MQL5 : Join my MQL5 channel to update the latest news from me 在波动剧烈的交易环境中,一款功能强大且直观的分析工具可以帮助您迅速抓住机会。Fibonacci Trend Scanner不仅结合了传统Fibonacci指标与SuperTrend功能,而且通过货币对扫描、多周期监控以及当趋势在多头与空头之间转换时的智能提醒,进一步扩大了其应用范围。 See more MT4 version at: Fibonacci Trend MT4 Scanner See more products at: All Products 1. 结合SuperTrend技术的趋势分析 Fibonacci Trend Scanner采用 SuperTrend 算法,可快速准确
TripleWave Signal Indicator - 多时间周期趋势确认系统 是一个专业级交易系统。它能 同时分析 M15、H1、H4 三个关键时间周期 , 独家提供 经过三重确认的 最可靠 BUY/SELL 信号 。助您 永远不会错过 真正的高概率交易机会! 【推荐设置】 黄金 (XAUUSD) :当前默认设置即可直接应用。 【核心优势】 您将即刻获得: 强大的 多时间周期趋势分析引擎 。 图表上 清晰直观的 BUY/SELL/EXIT 视觉箭头 。 实时状态仪表板 ,市场概况一目了然。 弹出式和移动推送通知 ,交易信号绝不遗漏。 完全可定制 的参数(如 EMA 周期、颜色等)。 一次购买,享受终身免费更新服务 。 立即下载 TripleWave Signal Indicator , 停止追逐 那些烦人的错误信号! 开始 以更智能、更自信的方式进行交易,把握每一次盈利机会。
FREE

Product Description Clean, Smart Sessions is a professional trading sessions indicator designed to provide traders with a clear, accurate, and clutter-free view of the active market sessions directly on the chart. The indicator dynamically detects and displays the active trading session (Asian, London, and New York) in real time, drawing a clean session box that continuously updates to reflect the session’s true high and low. When sessions overlap, each active session is handled independently
FREE
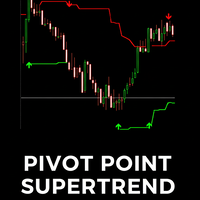
The Pivot Point Supertrend indicator is a technical analysis tool designed for the MetaTrader 5 (MT5) platform. It combines two popular analytical methods: Pivot Points: Uses significant historical price highs and lows to identify potential support and resistance zones. These points are objective and stable. Supertrend: A well-known trend-following indicator that helps identify the current market trend and provides dynamic stop-loss levels. Indicator's Goal: By using the stability of Pivot Point
FREE

The indicator has been designed for use on FORTS, but it can also work on other markets, at brokers broadcasting the required data. A peculiarity of these data is that they cannot be requested from the broker's server as a section of history, but can only be obtained for the current moment. The indicator periodically requests the broker, collects to a file and displays the following history from the stored file: The weighted average price. The volume of buy pending orders. The volume of sell pen
FREE
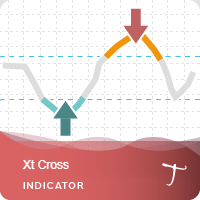
Xt Cross是著名的 TS /MT 指标的端口, 是一种具有动态超买和超卖水平的振荡器,而在标准 Stochastic Oscillator 中,这些水平是静态的并且不会改变。 这使得 Xt Cross 能够适应不断变化的市场。
当振荡器高于超买带(红线)并向下穿过信号(虚线)时,通常是一个很好的卖出信号。 同样,当震荡指标在超卖带(绿线)下方穿过信号上方时,这是一个很好的买入信号。 Xt Cross 非常适合交易货币(包括加密货币)和二元期权. Xt Cross 的优势 该指标适用于剥头皮交易和日内交易。 可以评估指标对历史的有效性。 指标不会重新绘制(重新计算),信号严格在“柱线收盘价”时生成。 它可以用作独立工具或与其他指标一起使用。 新指标信号的电子邮件和移动设备通知系统。 能够自定义指标的配色方案。
FREE

体验 "Demark Trends" 指标的威力,进行全面趋势分析和获取交易见解。 Demark 指标以其在评估市场趋势和耗尽点方面的有效性而闻名。我们的 "Demark Trends" 指标将此经验提升到新的水平,自动在您的图表上绘制精确的趋势线。通过可自定义的参数,包括计算中的蜡烛数量、警报设置和线条颜色,您可以完全掌控您的分析。无论您是新手还是经验丰富的交易者,我们的指标都可以简化趋势分析,节省您的时间和精力。 释放 "Demark Trends" 指标的潜力: 准确识别趋势: 使用自动绘制的精确趋势线,无缝分析市场趋势。 高效的交易策略: 评估当前趋势状态,预测潜在的耗尽点,做出明智的交易决策。 可自定义的参数: 通过调整蜡烛数量、警报设置和线条颜色,将指标定制为您的偏好。 用户友好的界面: 只需将指标拖放到您的图表上,即可立即可视化趋势线。 节省时间: 告别手动绘制趋势线,为战略性决策节省宝贵时间。 增强的模式识别: 在趋势线的背景下轻松识别模式,提升交易策略。 全面的趋势分析: 借助 "Demark Trends" 指标,深入了解市场趋势和潜在反转。 不要错过 "Demar
FREE

缠师在新浪博客中以 108 篇博文详细地解释了缠论这一个精妙的数学模型。 “ 缠论 ” 是基于形态学,几何学的一种技术分析理论。这一理论似乎适用于一切具有波动走势的投资市场,比如股票、权证和期货等 。 然而,要应用缠论做交易就必须有足够的时间去正确地画 “ 笔 ” 。可是画 “ 笔 ” 又是一项耗费时间且极易出错误的工作,令众多缠论爱好者痛苦不堪。 本指标依据缠师的缠论原作实现,能够自动且精确地在图表中画出笔、中枢和线段,帮助交易者解决了画笔和线段的烦恼,使得交易者可以直接分析和预测市场走向。
本指标中添加了中枢和线段的选项,可以完整的帮助用户画出缠论中的所有基本构件。
本指标中笔、中枢和线段的颜色、透明度与线宽等,均可由用户自行设定。
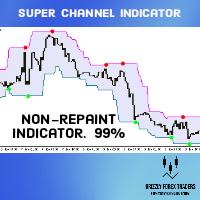
Super Signals Channel Indicator Its channel is a non-repaint indicator that reacts more with recent price movements. For this reason, the Super Signals Channel Indicator is a better match for short-term or day trading strategy. The Super Signals Channel only plots swing trading opportunities. So most of its trade signals appear during consolidation or sidelined periods of the market. Super Signals Channel Indicator for MT5 Explanation The green band below the price shows the dynamic support lev

VORTEX OSCILLATOR: Master the Volume Flow VORTEX OSCILLATOR is a high-performance trading tool that reimagines the classic Vortex indicator as an ultra-responsive precision oscillator. Designed for traders who demand absolute clarity, it fuses price action with Tick Volume to reveal the true momentum behind every market move. Why VORTEX OSCILLATOR is a Game Changer Most indicators only track price, often reacting too late. VORTEX OSCILLATOR uses a sophisticated Volume-Weighted Flow algorit

This indicator displays buy or sell signals according to Bill Williams' definition of the Trading Zone. [ Installation Guide | Update Guide | Troubleshooting | FAQ | All Products ] Easy to use and understand Avoid trading flat markets Deterministic indicator with clear rules The indicator is non-repainting It implements alerts of all kinds It has straightforward trading implications. A blue arrow is a buy signal A red arrow is a sell signal According to Bill Williams trading in the zone helps t
FREE
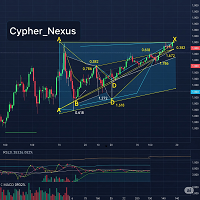
Cypher Pattern Detector A tool for automatic detection of Cypher harmonic patterns (XABCD) in financial charts. Overview The Cypher Pattern Detector identifies both bullish and bearish Cypher harmonic patterns in real time. It applies Fibonacci ratio validation and a quality scoring system to highlight patterns that closely match the defined structure. This helps traders observe and analyze potential market structures more consistently, without the need for manual drawing. Main Features Pattern
FREE
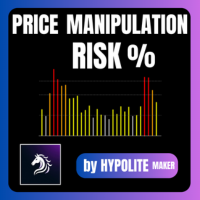
Price Manipulation Risk Indicator Advanced Tool for Market Risk Evaluation & Manipulation Detection Price Manipulation Risk Indicator is a professional tool designed to measure the current risk level in the market.
It evaluates price behavior, market activity, and candle dynamics to detect unstable or potentially manipulated environments. This indicator helps traders avoid traps , filter false signals , and improve timing in both entries and exits. Product Purpose Provide an immediate a
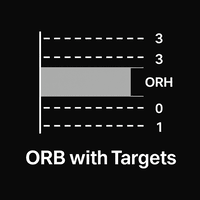
Product Name: Opening Range Breakout Pro MT5 Opening Range Breakout Pro is a technical indicator for MetaTrader 5 that identifies and plots the opening range based on user-defined session times. It is designed to assist traders who utilize session-based breakout strategies by automating the calculation of range boundaries and expansion levels. The indicator identifies the high and low of the opening period and projects multiple target levels above and below this range. These levels remain stati

Probability emerges to record higher prices when MACD breaks out oscillator historical resistance level. It's strongly encouraged to confirm price breakout with oscillator breakout since they have comparable effects to price breaking support and resistance levels; surely, short trades will have the same perception. As advantage, many times oscillator breakout precedes price breakout as early alert to upcoming event as illustrated by 2nd & 3rd screenshot. Furthermore, divergence is confirmed
FREE
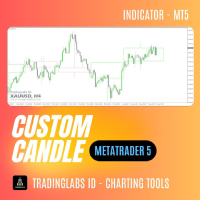
Custom Candle – Multi-Timeframe Visualization Analyzing multiple timeframes is essential for accurate trading decisions, but switching between charts can be inconvenient and inefficient. The Custom Candle indicator solves this problem by overlaying higher-timeframe (HTF) candles directly onto your lower-timeframe (LTF) chart. This allows you to see the bigger picture at a glance, align with the higher trend, and improve trade accuracy—without leaving your current chart. Key Features Multi-Timefr
FREE

该指标是My candle的演示版本,完整版可以在此处下载: 蜡烛图案创建器 通过完整版,您可以创建自己的蜡烛规则,并修改传统蜡烛图案以更准确地适应您的策略。 该指标包含了多个示例蜡烛规则,但这里我只展示其中几个: Pattern Rule Candle Green C > O Candle Red C < O Doji C = O Hammer (C > O and (C-O) *2 < O-L and (C-O) *0.5 > H-C) or (C < O and (O-C) *2 < C-L and (O-C) *0.5 > H-O) Hammer Green C > O and (C-O) *2 < O-L and (C-O) *0.5 > H-C Hammer Red C < O and (O-C) *2 < C-L and (O-C) *0.5 > H-O Marubozu (C > O and C-O > (H-L) * 0.7 ) or (C < O and O-C > (H-L) * 0.7 ) Marubozu Green C > O and C-O > (H-
FREE
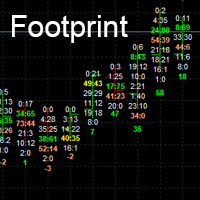
Footprint charts can add a level of depth to your visuals that standard charts cannot achieve.
Footprint charts are a powerful way to visualize the ups and downs of the market, helping you potentially to make better trading decisions. Orderflow Footprint in MT5. show # of market orders at each tick.
Inputs
Point Scale *1 to *10000
Number of candle to show. Font Size Max Bid Color (Top Seller) Max Ask Color (Top Buyer) Max Bid and Ask Color
Normal color

Based on the Extreme Trend Indicator on Trading View converted for MT5. Usage of the Indicator is free, but if you want the source code, you can purchase the source code by messaging me.
Extreme Trend is an indicator that identifies when a new trend is forming and creates a trading signal. This indicator can be used for many markets, forex, gold etc. If you have any inquiries or want to create an EA using this indicator, you can message me.
FREE
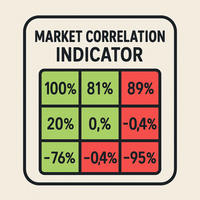
总体描述
该指标实时计算多个金融工具之间的皮尔逊相关系数。它显示一个动态相关性矩阵,用于展示货币、指数、股票和大宗商品之间关系的强度和方向。 主要参数 SymbolsList : 需要比较的工具列表(用逗号分隔) BarsToAnalyze : 用于计算的历史K线数量 TimeFrame : 相关性分析的时间周期 相关性解释 接近 +1.00 的值表示强正相关 接近 -1.00 的值表示强负相关 接近 0.00 的值表示弱相关或无相关 交易优势 监控持仓之间的相关性以降低过度暴露风险 识别投资组合中的多样化机会 支持对冲和套利策略 通过跨市场分析验证交易信号 重要提示
该指标适用于交易终端中的所有金融工具,支持日内、日线及更高级别的时间周期。内置的颜色编码系统可帮助快速识别强相关、弱相关和负相关。 关键词
mt5相关性指标, 外汇相关性, 相关性矩阵, 跨市场分析, 货币对相关性, 市场相关性, 多资产交易, 风险管理, 投资组合多样化, 外汇对冲, 套利交易, 指数相关性, 股票相关性, 大宗商品相关性, 负相关性, 正相关性, 皮尔逊系数, 金融工具相关性, 交易相关性分析
FREE
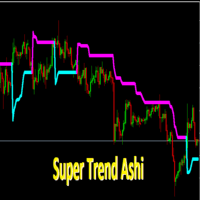
SuperTrendAshi Description SuperTrendAshi is an advanced and optimized version of the SuperTrend indicator that incorporates Heikin Ashi calculation to provide smoother and more reliable signals. This unique combination results in an indicator that reduces false signals and identifies trends with greater precision. Key Features Combines the strength of SuperTrend with Heikin Ashi smoothing More stable signals with less noise Intuitive color system (Aqua for uptrend, Magenta for downtrend) Custo
FREE

BBMA by RWBTradeLab is a clean chart-plotting indicator for MetaTrader 5 that combines Bollinger Bands , Linear Weighted Moving Averages (LWMA) on High/Low , and an EMA on Close to help traders read market structure visually. What it plots Bollinger Bands (Upper / Basis / Lower) LWMA on Low : 5 & 10 periods LWMA on High : 5 & 10 periods EMA on Close : default 50 periods Key features Plot-only indicator (no alerts, no trade execution) Non-repainting calculations (standard indicator plotting) Opti
FREE
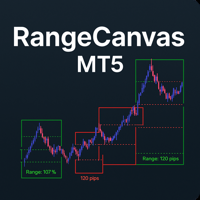
Daily Range Boxes : The indicator draws rectangular boxes around each day's high and low prices, creating a clear visual boundary for the daily trading range. Color-Coded Logic : Green boxes when the current price (or close) is above the daily open Red boxes when the current price is below the daily open Percentage Level Lines : Inside each box, it draws three horizontal lines at: 25% of the daily range 50% of the daily range (midpoint) 75% of the daily range Range Information : Each box displa
FREE
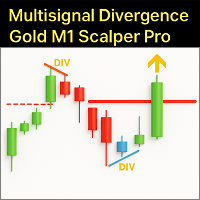
Master the volatile Gold (XAUUSD) market on the M1 timeframe with the Multisignal Divergence Gold M1 Scalper Pro . This indicator is not just another tool, but an advanced trading engine, meticulously designed to provide scalpers with high-precision entry signals, filtering out noise and focusing on robust confluences. The Challenge of Gold M1 Scalping:
Scalping, especially on an asset like Gold on the M1, demands speed, precision, and an exceptional ability to identify momentary reversals and

If you love this indicator, please leave a positive rating and comment, it will be a source of motivation to help me create more products <3 How to use SuperTrend? When the price crosses above the supertrend line it signals a buy signal and when the price crosses below the supertrend line it signals a sell signal. The supertrend indicator which acts as a dynamic level of support or resistance and helps traders make informed decisions about entry and exit points. When prices are above s upertre
FREE
介绍绘图指标:释放您在图表上的创造力!
您是否厌倦了在交易图表上进行注释的困扰?是否试图理解自己的分析或有效传达自己的想法?别再犹豫了!我们非常高兴向您推荐绘图指标,这是一款创新的工具,让您只需点击几下鼠标或挥动笔尖,就能轻松地在图表上进行绘图和注释。
我们创新的绘图指标旨在增强您的图表体验,释放您的创造潜力。有了这个强大的工具,您可以轻松表达自己的想法,标记重要水平,突出显示模式,并以前所未有的方式可视化您的交易策略。无论您是经验丰富的交易者、技术分析师还是初学者探索迷人的交易世界,绘图指标都是一个宝贵的资产,将彻底改变您与图表互动的方式。
主要特点:
用户友好界面:我们理解无缝用户体验的重要性。我们直观的界面确保您可以轻松地操作工具,并轻松访问所有功能。告别繁琐的设置,迎接简单性。
精准绘图:绘图指标允许您直接在图表上绘制线条、形状和注释。无论您是使用鼠标还是笔,我们的工具都提供流畅且响应灵敏的绘图体验,确保您的创造力无障碍地流动到图表上。
删除和重绘:犯了个错误或者想重新开始?没问题!我们方便的删除按钮可以轻松删除之前的绘图或注释。通过纠正和完善您的作品,您可以保持
FREE

I think you all know Donchian Channels. so I am not going to write about it.
With this indicator I tried to create Donchian Trend Ribbon by using Donchian Channels.
How it works ?
- it calculates main trend direction by using the length that is user-defined. so you can change it as you wish
- then it calculates trend direction for each 9 lower lengths. if you set the length = 20 then the lengths are 19, 18,...11
- and it checks if the trend directions that came from lower lengths is same
FREE

Developed by Jack Hutson in the 80's, the Triple Exponential Moving Average (a.k.a. TRIX ) is a Momentum technical indicator that shows the percentage of change in a moving average that has been smoothed exponentially 3 times. The smoothing process was put in place in order to filter out price movements that are considered insignificant for the analysis period chosen. We at Minions Labs found hard to follow the smoothness of the original TRIX line, so we colored the TRIX line with BUY and SELL t
FREE

Trade Hunter MT5 - Buy and Sell Indicator
Unlock precise trading opportunities with Trade Hunter MT5! This powerful indicator identifies potential buy and sell signals by analyzing price movements over a customizable period. Blue arrows mark buy opportunities below key lows, while red arrows highlight sell signals above critical highs. With adjustable parameters like bar range, percentage offset, and alert settings, Trade Hunter adapts to your strategy. Optional alerts and notifications ensur
FREE

Are you tired of drawing trendlines every time you're analyzing charts? Or perhaps you would like more consistency in your technical analysis. Then this is for you. This indicator will draw trend lines automatically when dropped on a chart. How it works Works similar to standard deviation channel found on mt4 and mt5. It has 2 parameters: 1. Starting Bar 2. Number of bars for calculation The starting bar is the bar which drawing of the trend lines will begin, while the number of bars for c
FREE

Original supertrend indicator in Tradingview platform. Indicator type: Price Action indicator Introduction: The Supertrend Indicator - Enhancing Your Trend Analysis. If you haven't yet found a Supertrend indicator with good graphics on the MQL5 platform, this is the indicator for you. Overview: The Supertrend Indicator is a powerful tool designed to provide traders with valuable insights into the current and historical trends of financial markets. It serves as a valuable addition to any t
FREE

Weis Waves(魏斯波浪) 是由大卫·魏斯 (David Weis) 开发的技术指标,灵感来源于理查德·威科夫 (Richard Wyckoff) 的原理。
与传统逐根显示的成交量不同,Weis Waves 将成交量累积为连续的上涨或下跌“波浪”,当价格方向反转时重新开始计算。 这种方法使交易者能够清晰地看到市场运动的 真实力度 ,因为每一波浪都反映了支撑一系列K线的成交量强度。 主要特点: 将成交量分组为买入波浪和卖出波浪。 突出显示市场的主导力量(买方或卖方)。 有助于识别 趋势延续 或 潜在反转 。 基于威科夫方法论,被广泛应用于成交量与资金流分析。 Weis Waves 被众多专业交易者使用,用于分析价格与成交量之间的平衡,提供更深入的市场动态视角。
FREE

Overlay indicator on chart between 2 pairs
The Timeframe Overlay indicator displays the price action of timeframes on a single chart, allowing you to quickly assess different timeframes from a single chart. The advantage is to observe and follow the correlations of price movements in real time to help you find potential trades at a glance.
---- Symbol 1 ----
Symbol = EURUSD
Correlation Inverse = false
Display = true
Ratio
FREE

This indicator calculates fibonacci levels via moving averages trend and draw these lines. You can change fast and slow Moving Averages settings for customization. Inputs:
Fast MA Time Period : 64 Fast MA Shift: 0 Fast MA Method: Smoothed Fast MA Apply To: Median Price Slow MA Time Period: 32 Slow MA Shift: 0 Slow MA Method: Smoothed Slow MA Apply To: Median Price ZigZag: False ZigZag Color: Red ZigZag Type: DashDot ZigZag Width: VeryThin Fibo Settings TrendFibonacci: True FiboTrendColor: Black
FREE
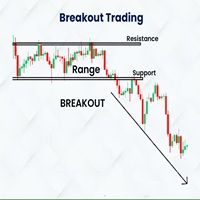
Indicador Basado en la estrategia de ruptura del rango de londres de Amaury Benedetti.
Este indicador dibuja automaticamente el rango, el maximo y minimo y sus correspondientes lineas de stoploss, entrada y takeprofit.
SE RECOMIENDA USAR EN M1 EN EL US30 (DE ACUERDO A LA ESTRATEGIA)
Los valores se pueden modificar de acuerdo a la necesidad del usuario, tambien se tienen mas configuraciones para dibujar cualquier rango en diversos horarios y con diferentes configuraciones de sl, tp, etc
Detal
FREE
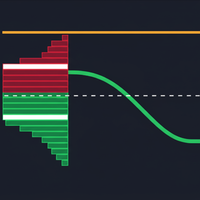
The "Volume Range Profile with Fair Value" (VRPFV) indicator is a powerful volume analysis tool designed to help traders better understand market structure and identify key price areas where significant institutional activity occurs. Instead of just looking at volume on individual candlesticks, VRPFV analyzes the distribution of volume by price level within a specific time range, providing deep insights into the "footprint" of smart money. VRPFV consists of the following core components: Upper &
FREE
MetaTrader市场是 出售自动交易和技术指标的最好地方。
您只需要以一个有吸引力的设计和良好的描述为MetaTrader平台开发应用程序。我们将为您解释如何在市场发布您的产品将它提供给数以百万计的MetaTrader用户。
您错过了交易机会:
- 免费交易应用程序
- 8,000+信号可供复制
- 探索金融市场的经济新闻
注册
登录