Conheça o Mercado MQL5 no YouTube, assista aos vídeos tutoriais
Como comprar um robô de negociação ou indicador?
Execute seu EA na
hospedagem virtual
hospedagem virtual
Teste indicadores/robôs de negociação antes de comprá-los
Quer ganhar dinheiro no Mercado?
Como apresentar um produto para o consumidor final?
Indicadores Técnicos para MetaTrader 5 - 19

This Quarter Levels Indicator for MQL5 is a sophisticated technical analysis tool designed to capitalize on "Psychological Levels" or "Round Numbers" in financial markets. It operates on the principle that institutional order flow, stop-losses, and take-profit targets tend to cluster at specific mathematical intervals—specifically the whole numbers ( 00 ), midpoints ( 50 ), and quarter points ( 25 and 75 ). By dividing price action into these four distinct quadrants, the indicator provides a cle
FREE
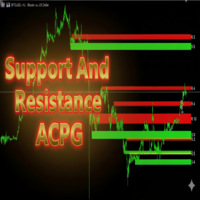
Support And Resistance ACPG Indicator
The Support And Resistance ACPG Indicator (developed by Grok by xAI) is an advanced tool for the MetaTrader 5 (MQL5) platform, designed to identify and visualize support and resistance zones on a price chart. Unlike traditional support and resistance indicators, the ACPG method combines a dynamic approach based on swing points, volatility analysis using the Average True Range (ATR), and an adaptive clustering system to detect high-relevance zones in the
FREE

WaveTrendPro Arrow – Adaptive Cross Signal with Smart Alerts Description WaveTrendPro Arrow is a clean and powerful visual indicator designed to detect trend-reversal points using the classic WaveTrend oscillator (WT1/WT2 cross) , enhanced with intelligent on-chart arrows , real-time alerts , and mobile push notifications . Unlike traditional WaveTrend indicators that display signals in a subwindow, this version shows precise entry arrows directly on the main chart , positioned adaptively
FREE
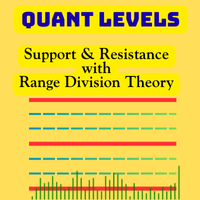
Quant Levels Indicator is a premium component of the Quantitative Trading Analysis Toolkit , designed to transform subjective trading into data-driven decision making. This advanced tool provides institutional-grade support and resistance analysis directly on your MT5 charts. " Please support our work by leaving a review ". As a thank-you gift , we’ll share a special template that helps you display signal trade history directly on your chart. Free indicator to visualize any MT5/MT4 signals i
FREE

O indicador Weis Waves RSJ soma os volumes de cada onda. É assim que recebemos um gráfico de barras de volumes cumulativos de ondas alternadas. Ou seja, o volume cumulativo torna os gráficos de ondas Weis únicos.
Isto lhe permite comparar a relação das características da sequência de ondas, como correspondência da força aplicada (expressa no volume) e resultado recebido (evolução do preço).
FREE

Fair Value Gap Sweep is a unique and powerful indicator that draws fair value gaps on your chart and alerts you when a gap has been swept by the price. A fair value gap is a price gap that occurs when the market opens at a different level than the previous close, creating an imbalance between buyers and sellers. A gap sweep is when the price moves back to fill the gap, indicating a change in market sentiment and a potential trading opportunity.
Fair Value Gap Sweep indicator has the following
FREE

TCM Breakeven Calculator Ultra is a professional utility designed to instantly visualize your True Weighted Average Entry Price with the Total Lot Size . Unlike simple averages, this tool mathematically accounts for Lot Sizes , giving you the exact price where your net position reaches zero loss. It automatically scans your terminal and isolates trades based on the chart you are viewing. If you are trading multiple pairs (e.g., EURUSD and Gold) simultaneously, this indicator will onl
FREE
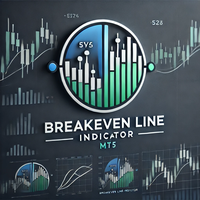
Simple indicator to show Breakeven line for all orders on attached chart pair. This indicator also comes with additional information such as Total Lot Size, Floating Drawdown in account's currency and Number of open positions and Difference from current price in Points. Do you use DCA (dollar cost average) or Hedging approach on your trading? Then this indicator you MUST have. Really useful, when you have multiple orders (hedging), this can help you quickly identify breakeven point without calc
FREE

Hull Suite by Riz | MT5 Indicator Overview: Hull Suite is a premium trend-following indicator that combines three powerful Hull Moving Average variations (HMA, EHMA, THMA) into one versatile tool. Designed for traders who demand clarity and precision, this indicator helps identify trend direction with minimal lag while filtering out market noise. Key Features: Three Hull Variations – Switch between HMA (classic), EHMA (exponential smoothing), and THMA (triple weighted) to match your trading styl
FREE

Indicator Introduction: The indicator comes from network ,It is more stable relative to RSI or CCI. You can set the indicator to send emails/notifications/alerts when the previous bar has an up or down arrow, you can specify the text of emails by inputing string into the parameter box of "UpMessages/DownMessages". It can be used to analyze market trend and design new expert that is based on trend. If the indicator below the axis ,this is a buy zone. The trend indicator is suitable for M1 and ab
FREE
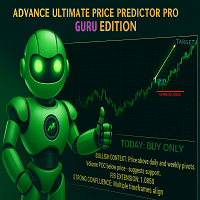
THE ADVANCE PRICE PREDICTOR - GURU EDITION Tired of Guesswork?
Meet the AI-Powered "Almighty Predictor" – Pinpoints High-Probability Targets Before the Move, With Surgical Precision
Stop chasing pips. Start attracting them. Our proprietary algorithm fuses Multi-Timeframe Analysis + Smart Money Concepts + Real-Time Confluence Scoring to give you a clear, calculated edge on every trade.
Are You Constantly Wondering…
"Is this the top, or will it keep going?"
"Where should I real
FREE

TrendBite v1.5 - Indicador profissional de acompanhamento de tendências Desenvolvedor: 8aLt4 Versão: 1.5 Plataforma: MetaTrader 5
Visão geral O TrendBite v1.5 é um indicador de análise técnica avançado, concebido para identificar mudanças de tendência no mercado e fornecer sinais de compra e venda claros aos investidores. Baseado no algoritmo das Bandas de Bollinger, esta ferramenta capta com precisão as inversões de tendência, sendo ideal tanto para principiantes como para traders experiente
FREE

Detailed blogpost: https://www.mql5.com/en/blogs/post/766378
Key Features
Adaptive Upper/Lower bands Smooth Center Line Customizable Length (sensitivity) Non-Repainting (only current ongoing bar is updated every "Refresh After Ticks" number of ticks) Multiple Price Sources - Choose from close, open, high, low, median, typical, or weighted close Components:
The Basis Line The smooth center line represents the weighted average of price. Think of this as the "true" price level when all the noise
FREE

Think of the Super Fractal Indicator as the Bill WIlliams Indicator on Steroids. Indicator Abilities: 1. Adjust Candle around Fractal High or Low. 2. Adjust Lookback period and only plot for a specific number of history candles avoiding cluttering your trading desk. 3. The Indicator uses buffers so you call and use it from any EA.
Note : The higher the candles around Fractal, the stronger the Turning point anfd viceversa is true.
FREE

The ChanLun or Chan theory is one of the most popular trading theories in China. But it seems like that it has little influence in western countries. Actually, the Chan Theory is based on a sophisticated mathematical model. The basic idea ChanLun is to simplify the bar chart by its model. With the help of ChanLun, a trader can analyze and predict the trend of future goods, stocks.
In ChanLun, there are several basic elements called fractals, strokes, line segments and pivots . A trader should pa
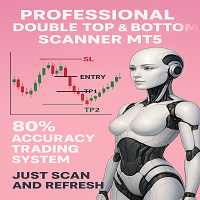
PROFESSIONAL DOUBLE TOP/BOTTOM PATTERN SCANNER
The Ultimate Reversal Trading System for Forex & Crypto Traders
TRANSFORM YOUR TRADING WITH INSTANT PATTERN RECOGNITION
Are you tired of missing profitable reversal setups? Exhausted from staring at charts for hours, trying to spot double tops and bottoms? Frustrated with false breakouts and missed entries?
What if I told you there's a professional-grade tool that: SCANS ALL SYMBOLS AUTOMATICALLY - No more manual chart hunting DRAWS PATTER

With this easy to set up indicator you can display and set alerts for the following candlestick formations: Bull Breakout, Bear Breakout, Hammer, Pin, Bullish Engulfing, Bearish Engulfing. Input parameters: ShortArrowColor: The color of the Arrows, displaying a Bearish candle formation LongArrowColor: The color of the Arrows displaying a Bullish candle formation BullishEngulfing: Disabled/Enabled/EnabledwithAlert BearishEngulfing: Disabled/Enabled/EnabledwithAlert Pin: Disabled/Enabled/Enabledw
FREE
WYSIWYG OPEN RANGE BREAKOUT - PRO EDITION
Ultra-precise ORB indicator with smart line-breaking, dynamic ATR-based targets, and multi-session adaptability. Perfect for day, swing, and algorithmic traders seeking clear visuals and actionable levels . Trade with confidence – see what you trade, trade what you see . "What You See Is What You Get" "What You See Is What You Get" – The ultimate ORB indicator delivering ultra-precise trading range visualization with a smart line-breaking system. Built
FREE
The Round Level Indicator automatically draws psychologically significant price levels directly on your chart.
These round numbers often act as key support and resistance zones across all markets and timeframes.
Round Levels are used in my automated EA: Opal This indicator works best when combined with other tools and strategies, e.g.: Price Action Strategies
Round levels often align with key support/resistance. Use it with candlestick patterns (like pin bars or engulfing bars) to confirm high
FREE
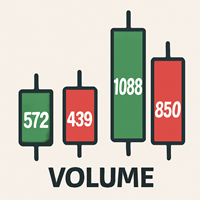
Volume Data on Candles Indicator for MetaTrader 5 Maximize your trading insights with the Volume Data on Candles indicator for MetaTrader 5. This powerful tool provides real-time volume data directly on each candle, allowing you to identify significant shifts in market activity. When the volume of a candle exceeds the average of the last 50 candles, it will be clearly highlighted , ensuring you don't miss out on potential high-volume movements. Key Features: Real-Time Volume Data : Displays volu
FREE

This indicator is the mql version of the Smoothed Heiken Ashi Candles. Find out more here: https://www.mql5.com/en/users/rashedsamir/seller Heikin-Ashi charts resemble candlestick charts , but have a smoother appearance as they track a range of price movements, rather than tracking every price movement as with candlesticks.
Because the Heikin Ashi candlesticks are calculated based on averages, the candlesticks will have smaller shadows than a regular Japanese candlestick. Just like with
FREE
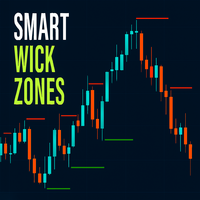
Smart Wick Zones indicator is a powerful tool designed to highlight hidden areas of price rejection and liquidity on your chart. By analyzing candle wicks (also called shadows or tails), the indicator automatically draws horizontal zones where strong buying or selling pressure has previously appeared. These wick zones often mark turning points in the market or areas where price reacts strongly, making them excellent references for support and resistance.
Instead of manually scanning candles for
FREE

SWIFT SNIPER COMBO — Advanced Trading Signal Indicator (Non-Repainting) Short Pitch: A precision entry system that fuses a fast/slow MA crossover with robust swing-pivot confirmation to deliver high-probability signals, clear TP/SL levels, and realtime alerts — built for traders who want clean, non-repainting signals and practical risk management. What It Does (Quick Overview) SWIFT SNIPER COMBO combines a smoothed moving-average crossover engine with a swing-pivot detector. Signals are only gen
FREE

Mahdad Candle Timer é um indicador leve e preciso para MetaTrader 5 que exibe o tempo restante até o fechamento da vela atual, mostrado diretamente ao lado da última barra. Foi desenvolvido para traders que dependem de um timing exato — seja no scalping, no day trade ou aguardando a confirmação de velas em setups de swing. Principais recursos Contagem regressiva precisa – Tempo restante em HH:MM:SS (opcional em milissegundos) Posicionamento dinâmico – Sempre alinhado à última vela, independe
FREE

Zonas de Suporte e Resistência Baseadas em Volume Volume-based Support and Resistance Zones é um indicador poderoso e flexível para MetaTrader 5 que ajuda os traders a identificar níveis-chave do mercado formados por picos de volume em topos e fundos fractais. Esta ferramenta desenha automaticamente as zonas de suporte e resistência onde o preço tem maior probabilidade de reagir, ajudando você a operar com mais confiança e clareza.
Principais Recursos Lógica baseada em volume : as zonas são cri
FREE

If you love this indicator, please leave a positive rating and comment, it will be a source of motivation to help me create more products <3 How to use QQE? Determine trend when RSI MA above 50 indicate a bullish market, while RSI MA below 50 indicate a bearish market and can server as a trend filter. Identify short-term up/down momentum, when the RSI MA crosses up Smoothed signals bullish momentum, and when the RSI MA crosses down Smoothed signals bearish momentum. It is also possible to
FREE

Overview EMA Scalper is a technical indicator designed for the MetaTrader 5 platform. This tool helps traders identify potential trading signals based on the crossover between price and an Exponential Moving Average (EMA), combined with a dynamic price channel. The indicator is suitable for scalpers or day traders and works across various timeframes and financial instruments. How It Works The indicator's logic is based on two main components: EMA Crossover: The core signal is generated when the
FREE

The " YK Find Support And Resistance " indicator is a technical analysis tool used to identify key support and resistance levels on a price chart. Its features and functions are as follows:
1. Displays support and resistance levels using arrow lines and colored bands, with resistance in red and support in green.
2. Can be adjusted to calculate and display results from a specified timeframe using the forced_tf variable. If set to 0, it will use the current timeframe of the chart.
3. Uses th
FREE

Body Ratio Indicator para MT5 – Analisador de Força da Vela e Compressão de Faixa O Body Ratio Indicator é uma ferramenta técnica desenvolvida para analisar a estrutura das velas e identificar as condições do mercado com base na relação entre o corpo da vela (abertura-fechamento) e o seu alcance total (máxima-mínima).
Esse cálculo simples, porém eficaz, ajuda os traders a detectar velas com forte impulso direcional, velas de indecisão e fases de compressão de faixa que frequentemente antecedem
FREE

Em muitas estratégias, é bastante comum usar um ATR dimensionado para ajudar a definir um stop-loss, e não é incomum usá-lo também para metas de lucro. Embora seja possível usar o indicador ATR integrado e calcular manualmente o valor de compensação, ele não é particularmente intuitivo ou eficiente e tem potencial para erros de cálculo.
Recursos Deslocamento ATR configurável Faixa Superior e Inferior. fator de escala ATR configurável período de tempo ATR alternativo (não gráfico) tipos de entr
FREE

Original supertrend indicator in Tradingview platform. Indicator type: Price Action indicator Introduction: The Supertrend Indicator - Enhancing Your Trend Analysis. If you haven't yet found a Supertrend indicator with good graphics on the MQL5 platform, this is the indicator for you. Overview: The Supertrend Indicator is a powerful tool designed to provide traders with valuable insights into the current and historical trends of financial markets. It serves as a valuable addition to any t
FREE

O uso do Oscilador Estocástico com média móvel é uma estratégia simples mas bem eficiente para prever alguma reversão ou continuidade de tendência.
O indicador automaticamente junta os dois indicadores em um só, além de te dar alertas visuais e sonoros.
Ele está pronto para ser utilizado com nosso robô programável, Sandbox, no qual você encontra abaixo: Nosso EA programável: https://www.mql5.com/pt/market/product/76714 Faça bom uso do indicador!
Este é um indicador gratuito, porém levou horas
FREE

Smart Grid MT5 automatically recognizes any symbol, period and scale of the chart and marks it up accordingly. It is possible to mark up the chart by trading sessions. The grid consists of the two main line types.
Vertical lines There are two visualization methods: Standard - the lines are divided into three types, separating: Small time period. Medium time period. Large time period. Trading Session - the lines are divided into groups (a total of ten). Each group has two lines: the first is res
FREE

Fibo Trend Smart MAXIMUS Ritz Fibo Trend Smart MAXIMUS 1 is an advanced trading indicator that integrates various technical analysis tools into one comprehensive display. This indicator is designed to help traders identify trading opportunities with high accuracy, utilizing a combination of Fibonacci, ZigZag, and price action confirmation. Key Features Smart Fibonacci Retracement 11 Customizable Fibonacci Levels (0%, 23.6%, 38.2%, 50%, 61.8%, 100%, 123.6%, 138.2%, 150%, 161.8%, 200%) Different
FREE

This Supertrend strategy will allow you to enter a long or short from a supertrend trend change. Both ATR period and ATR multiplier are adjustable. If you check off "Change ATR Calculation Method" it will base the calculation off the S MA and give you slightly different results, which may work better depending on the asset. Be sure to enter slippage and commission into the properties to give you realistic results. If you want automatic trade with Supertrend indicator, please buy following pr
FREE

ICT Unicorn Hunter – Multi-Timeframe Smart Setup Detector IMPORTANT: This is a Multi-Timeframe Scanner, looking for 'Unicorn' setups. A Unicorn in this definition is a liquidity sweep, market structure shift and creation of a Fair Value Gap overlapping with the last opposite-close candle before the liquidity sweep (breaker). This scanner does NOT provide visualisation of the Unicorn on the chart.
For visualisation, use the Unicorn Tracker indicator, which is designed to work with the Unicorn
FREE

Draw and Sync Objects Multiple Charts 1. Draw objects by key press. ( You must: 1. Press Function key => 2. Click where you want to draw => 3. Draw it => 4. Press ESC to complete). (If you don't want to draw after pressing function key, you must press ESC to cancel). 2. Developing : Sync selected objects to multiple charts by button. 3. Developing: Hide objects that do not belong to the current symbol (Objects drawn with this indicator will belong to the symbol they are plotted on. When your c
FREE

Trade Hunter MT5 - Buy and Sell Indicator
Unlock precise trading opportunities with Trade Hunter MT5! This powerful indicator identifies potential buy and sell signals by analyzing price movements over a customizable period. Blue arrows mark buy opportunities below key lows, while red arrows highlight sell signals above critical highs. With adjustable parameters like bar range, percentage offset, and alert settings, Trade Hunter adapts to your strategy. Optional alerts and notifications ensur
FREE

Pivot Point Super trend it can be used to catch price turning points and can show arrows for buying and selling. calculations are based on price peaks . you can control the price turning points by increasing the Pivot point period input on the indicator the ATR factor is for how far apart do you want the bands to be spread apart price break outs are also spotted in their early stages which will make trading much better
FREE

FourAverage - uma nova palavra na detecção de tendência. Com o desenvolvimento da tecnologia da informação e um grande número de participantes, os mercados financeiros estão se tornando menos passíveis de análise por Indicadores desatualizados. As ferramentas técnicas convencionais de análise, como a média móvel ou o estocástico, são incapazes de determinar a direção ou a reversão de uma tendência. Um indicador pode indicar a direção correta do preço futuro, sem alterar seus parâmetros, em um hi
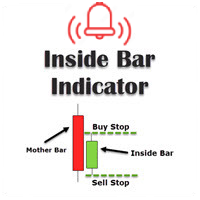
This inside bar indicator MT5 is suitable if you are doing inside bar trading. So what this MT5 inside bar indicator does is identifies inside bars for you as they form on your charts. Inside bar is a famous trading pattern in which the bar carry higher low and lower high compared with the previous bar, also known as mother bar. With, a lesser time frame like the 1 hour chart, daily inside bar chart will sometimes appears to be similar to a triangle pattern.
Inputs Settings for MA; AlertOn
FREE

O KT Volume Profile exibe os dados de acumulação de volume como um histograma no eixo Y, permitindo visualizar a atividade de negociação ao longo de determinados períodos e níveis de preço.
Ponto de Controle (POC) no Perfil de Volume
O POC representa o nível de preço com o maior volume negociado dentro do histograma do perfil de volume. Geralmente, é utilizado como suporte/resistência ou como um nível-chave onde o mercado pode fazer um reteste antes de seguir em uma direção específica.
Recurso

O indicador é uma ferramenta analítica que incorpora 37 variações diferentes de médias móveis desenvolvidas por autores como Patrick Mulloy, Mark Jurik, Chris Satchwell, Alan Hull e outros. Ele fornece a capacidade de testes virtuais históricos. O indicador pode ser usado em vários instrumentos, incluindo ouro, criptomoedas, índices de ações, pares de moedas e outros ativos. Um backtester visual integrado permite que os usuários simulem posições de negociação virtuais, rastreiem resultados e ava
FREE

KT Bollinger Bands Alert é uma versão modificada do clássico indicador Bandas de Bollinger, com alertas ao tocar o preço e etiquetas de preço visíveis para cada banda separadamente.
Eventos de Alerta
Quando o preço atual toca a banda superior de Bollinger. Quando o preço atual toca a banda média de Bollinger. Quando o preço atual toca a banda inferior de Bollinger.
Recursos Eventos de alerta separados para cada banda. Capacidade de definir um intervalo personalizado entre alertas para evitar r

Procurando por um poderoso indicador de negociação forex que possa ajudá-lo a identificar oportunidades de negociação lucrativas com facilidade? Não procure mais do que o Beast Super Signal. Este indicador baseado em tendências fácil de usar monitora continuamente as condições do mercado, procurando por novas tendências em desenvolvimento ou aproveitando as já existentes. O Beast Super Signal dá um sinal de compra ou venda quando todas as estratégias internas se alinham e estão em 100% de conflu

O principal objetivo do indicador é determinar e marcar sinais de negociação no histograma do Accelerator Oscillator, que foram descritos por Bill Williams em seu livro "New Trading Dimensions". A lista de sinais: O sinal de compra quando o histograma do indicador está abaixo da linha zero. O sinal de venda quando o histograma do indicador está abaixo da linha zero. O sinal de venda quando o histograma do indicador está acima da linha de zero. O sinal de compra quando o histograma do indicador e
FREE

Este é o indicador final de RVI. setas de alerta adicionadas ele pode identificar os níveis de resistência em potencial 2 filtros adicionais para melhorar as leituras Além disso, é suavizado para mostrar bons resultados ele foi configurado para prazos curtos de m1 a m30 também não funciona mal em Eu recomendo usar este indicador com um filtro adicional como nas imagens do macd.
FREE

Paranormal Insightment Use with : Ritz MA Ribbon Dynamics (check on my product) Ritz Paranormal Insightment is a precision-engineered analytical indicator that blends momentum intelligence and trend confirmation into a single visual system.
It merges the DeMarker oscillator with a dynamic Moving Average filter , detecting price exhaustion and directional shifts with remarkable clarity. The indicator translates subtle market imbalances into actionable visual and auditory signals, helping trad
FREE

This auxiliary indicator displays time left before closing on the current timeframe with continuous update . It also shows the last trade price and variation from a previous day close in percentage and points. This indicator is pretty handy for daytraders and scalpers who want to precisely monitor closing and opening of candles.
Indicator parameters Show in shifted end - Default: False. Display time and values on screen. If True, Displays only time to close aside last candle. Distance from the
FREE
FULL PRODUCT DESCRIPTION Multi-Timeframe Candle Overlay Pro lets you view higher-timeframe candles directly on your current chart with absolute accuracy. When trading lower timeframes like M1–M15, understanding what the H1–H4 candles are forming is a major advantage: you avoid counter-trend entries, read market context faster, and trade with more confidence.
The indicator supports up to 2 higher timeframes, drawing full OHLC candles with precise positioning—no misalignment, no distortion. C
FREE

Indicador de Sessões de Trading O Indicador de Sessões de Trading visualiza os pontos altos e baixos, bem como os horários de início e fim das sessões de trading da Ásia, Londres e Nova Iorque diretamente no seu gráfico. Funcionalidades: Visualização das principais sessões de trading Destaque dos pontos altos e baixos Exibição dos horários de início e fim de cada sessão Horários das sessões personalizáveis Fácil de usar e eficiente Personalização: Cada sessão de trading (Ásia, Londres, Nova Iorq
FREE

SuperTrend Pro – Advanced Trend Detection Indicator (MT5) SuperTrend Pro is a modern, optimized trend-following indicator for MetaTrader 5 , designed to deliver clear trend direction, precise market structure, and a premium visual trading experience . It is based on an enhanced ATR-powered SuperTrend algorithm , combined with smart visuals, chart styling, and a real-time information panel. -Key Features - Advanced SuperTrend Logic Uses ATR (Average True Range) with adjustable Period and Multipli
FREE

Bem-vindo a uma nova era de trading com o indicador AI Moving Average, um avançado indicador do MetaTrader 5 projetado para fornecer aos traders insights preditivos sobre os movimentos do mercado. Esta ferramenta combina o poder da IA com a confiabilidade de uma média móvel exponencial sem atraso para oferecer previsões precisas e oportunas das tendências futuras dos preços. Modelo Inovador de Regressão Linear O AI Moving Average aproveita um modelo de aprendizado de máquina de regressão linear
FREE

Enjoy the Free Candle Color indicator.
Kijun Sen is an element of Ichimoku Kinko Hyo Indicator, it's far too complicated for many traders hence they tend to be confused. We have simplified it so the Kijun Sen will change colors as it activates without the Tenkan Sen, Senkou Span, Up Kumo and Down Kumo. Customize to your period parameter and colors of your choice. Great for beginners and seasoned traders. Set your period and enjoy
GOOD LUCK and ALL THE BEST IN YOUR TRADING JOURNEY !!!!!
FREE

Supply and Demand indicator does not repaint as it counts the number of tests/retests occurred in the past x number of times. As a trader you need a path to be able to place your buy and sell trades such as: Supply and Demand, Falling & raising channels . Experienced trades will draw the key levels and channels around the timeframes. But, they will not be able to draw them on the small time frames as the price changes too frequent. This indicator is based on Shved supply and demand indicator, b
FREE

For feedback, free connect to signal, PARTNER PROGRAM and detailed information : Facebook Welcome to the "Breakeven Line" indicator, version 1.1, developed by Sergei Ivanov in 2025. Visualize breakeven price levels for your trades with precision and ease. Advisor Description The "Breakeven Line" is a MetaTrader (MQL5) indicator that displays breakeven price levels for open buy and sell positions on the current symbol, factoring in commissions and swaps for accurate risk management. Key
FREE
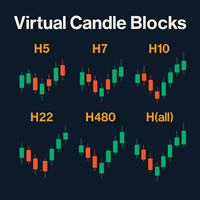
Virtual Candle Blocks – Visualize o mercado sem limites Virtual Candle Blocks é um indicador avançado para MetaTrader 5 que permite criar e visualizar candles de qualquer temporalidade personalizada, mesmo aqueles que não existem nativamente na plataforma. Características Principais: Temporalidades Personalizadas: Agrupe os candles base em blocos da duração que desejar (ex: 5h, 14h, 28h, 72h, etc.) para criar um novo candle virtual. Isso permite que você acesse temporalidades exclusivas de plat
FREE

ATR Based Swing Trader Indicator Description The ATR Based Swing Trader Indicator is a sophisticated technical analysis tool designed for MetaTrader 5 (MT5) to assist swing traders in identifying potential buy and sell signals based on the Average True Range (ATR) and trend direction. Developed by Rahulkumar Kanani, this indicator leverages volatility and price movement to generate actionable trading signals, making it suitable for traders who aim to capture short- to medium-term price swings in
FREE

A useful dashboard that shows the RSI values for multiple symbols and Time-frames. It can be easily hidden/displayed with a simple click on the X top left of the dashboard. You can input upper and lower RSI values and the colours can be set to show when above/below these values. The default values are 70 and 30. You can choose whether the dashboard is displayed on the right or left of the chart. If you want to have 2 dashboards on the same chart you must input a different name for each. The sca
FREE
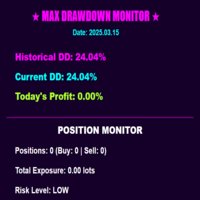
Monitor MaxDD Pro
MaxDD Monitor Pro é uma ferramenta abrangente de monitoramento de drawdown para traders profissionais. Ele rastreia métricas de drawdown baseadas tanto em saldo quanto em depósito em tempo real, ajudando você a gerenciar riscos com eficácia. Os recursos incluem rastreamento histórico máximo de drawdown, análise de drawdown específica por símbolo, monitoramento de posição e cálculo de exposição. Principais características: Monitoramento de drawdown em tempo real com alertas co
FREE

O Solarwind No Repaint é um oscilador técnico que aplica a Transformação de Fisher aos dados de preços normalizados, criando um indicador baseado em histograma que identifica potenciais pontos de virada do mercado. Este indicador converte movimentos de preços em uma distribuição normal gaussiana, tornando padrões cíclicos e mudanças de momentum mais visíveis para os traders. Como Funciona O indicador processa dados de preços através de várias etapas computacionais: Análise Alto-Baixo : Calcula a
FREE

Indicador de Bolhas — Desaceleração do Preço + Pico de Volume Uma ferramenta visual simples que exibe quadrados coloridos no gráfico quando o preço desacelera repentinamente acompanhado por um pico de volume.
(Função de preenchimento com efeito de bolhas concêntricas)
Ajuda a identificar momentos em que o mercado se prepara para um movimento importante. O que o indicador faz: Detecta momentos em que o mercado “hesita” antes de se mover Mostra onde entra grande volume sem alteração significativa

BigPlayerRange — Melhor Indicador para Mini Índice e Mini Dólar | MT5 Descubra o poder do BigPlayerRange , considerado o melhor indicador para mini índice e mini dólar no MetaTrader 5. Esta ferramenta essencial destaca zonas estratégicas de atuação dos grandes players, proporcionando análise técnica institucional com altíssima precisão. Como Funciona na Prática: O BigPlayerRange desenha duas faixas horizontais baseadas em volume institucional: Faixa Verde — Região onde compradores instit

Relative Volume or RVOL is an indicator that averages the volume of X amount of days, making it easy to compare sessions volumes.
The histogram only has 3 colors:
Green - Above average volume
Yellow - Average volume
Red - Below average volume
The default setting is 20 days, which corresponds more or less to a month of trading.
In this version is possible to choose between tick and real volumes (if you are using a broker which offers future contracts)
With the data obtained from this in
FREE

Apresentamos o poderoso indicador NRTR (Nick Rypock Trailing Reverse) - uma ferramenta técnica indispensável para os traders que buscam identificar reversões de tendência e estabelecer níveis efetivos de stop trailing. Desenvolvido por Nick Rypock, este indicador possui um algoritmo único que se adapta às constantes mudanças nas condições do mercado, tornando-se uma adição inestimável para o arsenal de qualquer trader.
Aqui estão as duas formas populares pelas quais os traders utilizam este in
FREE
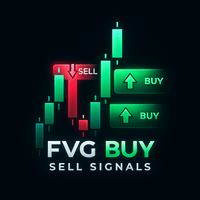
A Smart Price Imbalance Tool with Arrows, Labels, and FVG Zones The Fair Value Gap (FVG) Indicator is designed to automatically detect price imbalance zones on the chart – a widely used concept in Smart Money Concepts (SMC) and Institutional Trading Models (ICT) . These gaps, also known as imbalances or inefficiencies , often highlight areas where price may return to "rebalance" liquidity. Many professional traders consider these levels as high-probability zones for potential reversals, retrace

Volume Weighted Average Price (VWAP) is a trading benchmark commonly used by Big Players that gives the average price a Symbol has traded throughout the day. It is based on both Volume and price. Additionally we put in this indicator the MVWAP (Moving Volume Weighted Average Price). For those who do not know the usage and the importance od this indicator I recommend a great article about this subject at Investopedia ( https://www.investopedia.com/articles/trading/11/trading-with-vwap-mvwap.asp )
FREE
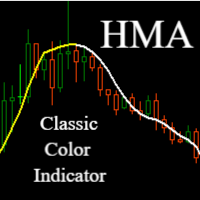
Hull Moving Average (HMA) - Faster and More Precise Trend Tracking
Hull Moving Average represents a revolutionary approach to trend analysis that overcomes the common shortcomings of traditional moving averages. This advanced indicator, developed by Alan Hull, practically eliminates the lag typical for standard moving averages while maintaining exceptional signal smoothness.
Key Benefits:
Significantly faster response to trend changes than traditional moving averages Minimal lag while mainta
FREE

The famous brazilian trader and analyst Didi Aguiar created years ago a study with the crossing of 3 Simple Moving Averages called "Agulhada do Didi", then later was also named Didi Index, as a separate indicator. The period of those SMAs are 3, 8 and 20. As simple as that, this approach and vision bring an easy analysis of market momentum and trend reversal to those traders looking for objective (and visual) information on their charts. Of course, as always, no indicator alone could be used wit
FREE

ATR Plus is an enhanced version of the classic ATR that shows not just volatility itself, but the directional energy of the market .
The indicator converts ATR into a normalized oscillator (0–100), allowing you to clearly see: who dominates the market — buyers or sellers when a trend begins when a trend loses strength when the market shifts into a range where volatility reaches exhaustion zones ATR Plus is perfect for momentum, trend-following, breakout and volatility-based systems. How ATR Plus
FREE
O Mercado MetaTrader é o melhor lugar para vender robôs de negociação e indicadores técnicos.
Você apenas precisa desenvolver um aplicativo para a plataforma MetaTrader com um design atraente e uma boa descrição. Nós vamos explicar como publicar o seu produto no Mercado e oferecer a milhões de usuários MetaTrader.
Você está perdendo oportunidades de negociação:
- Aplicativos de negociação gratuitos
- 8 000+ sinais para cópia
- Notícias econômicas para análise dos mercados financeiros
Registro
Login
Se você não tem uma conta, por favor registre-se
Para login e uso do site MQL5.com, você deve ativar o uso de cookies.
Ative esta opção no seu navegador, caso contrário você não poderá fazer login.