Technische Indikatoren für den MetaTrader 5 - 14
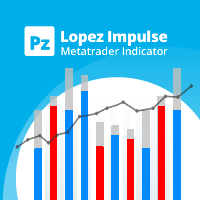
Dieser Indikator bewertet gleichzeitig die Volatilität und die Kursrichtung, wobei die folgenden Ereignisse ermittelt werden. [ Installationsanleitung | Update-Anleitung | Fehlerbehebung | FAQ | Alle Produkte ] Entscheidende und plötzliche Preisbewegungen Große Hämmer / Sternschnuppenmuster Starke Ausbrüche, die von den meisten Marktteilnehmern unterstützt werden Unentschlossene, aber volatile Marktsituationen Es ist ein extrem einfach zu verwendender Indikator ... Das blaue Histogramm repräsen
FREE

Wenn Sie gerne traditionelle gleitende Durchschnitte (wie SMAs und EMAs) verwenden, um Ihre Trades mit dynamischen Unterstützungs- und Widerstandsniveaus zu versehen, werden Sie den Adaptiven Gleitenden Durchschnitt (AMA) lieben. Der Adaptive Moving Average (auch bekannt als KAMA - Kaufman Adaptive Moving Average) wurde 1995 von Perry Kaufman entwickelt und in seinem Buch "Smarter Trading : Improving Performance in Changing Markets " der Weltöffentlichkeit vorgestellt. Er hat sich zum Ziel geset
FREE

ies ist ein benutzerdefinierter Indikator, der auf einer doppelten Durchschnittskreuzung und Pfeilmarkierung basiert.
Erstellen Sie mehrere Listen, wenn die blauen Pfeile nach oben zeigen.
Erstellen Sie eine leere Liste, wenn der rote Pfeil nach unten zeigt.
Wenn die rosa Linie die grüne Linie nach oben kreuzt, ist die rosa Linie oben, die grüne Linie unten, die goldene Gabel erscheint und der blaue Pfeil erscheint.
Wenn die rosafarbene Linie die grüne Linie nach unten kreuzt, ist die rosaf
FREE
ATR Volatility Histogram für MT5 – Technische Volatilitätsanalyse Dieser Indikator berechnet und zeigt die Differenz zwischen einem schnellen ATR und einem langsamen ATR als Histogramm an, um Veränderungen der Marktvolatilität in Echtzeit zu visualisieren. Berechnung
Volatilitätsdifferenz = Schneller ATR - Langsamer ATR Interpretation Positive Werte (grüne Balken) zeigen eine steigende Volatilität und können den Schwung eines Ausbruchs bestätigen. Negative Werte (rote Balken) zeigen eine abneh
FREE

CandleTimeAndSpreadLine - Kerzenzeit und Spread in Echtzeit CandleTimeAndSpreadLine ist ein Indikator, der zwei wichtige Informationen direkt auf dem Chart anzeigt:
(1) die verbleibende Zeit der aktuellen Kerze und
(2) den Spread in Punkten, beide verankert mit dem gewählten Referenzpreis (Ask, Bid oder Mid). Es verwendet die OnTimer-Aktualisierung , die sicherstellt, dass die Zeit auch in Zeiten geringer Marktaktivität weiterläuft.
Die Werte werden in Form von Etiketten angezeigt, die dem Char
FREE

Moving Average Trend Alert ist ein dreifacher MA-Indikator, der Händlern hilft, potenzielle Markttrends auf der Grundlage der Ausrichtung und Überkreuzung von 3 MAs zu erkennen.
Merkmale von Moving Average Trend Alert: Anpassbare kurzfristige, mittelfristige und langfristige MAs. Option zum Filtern von Signalen basierend auf einem Mindestabstand zwischen gleitenden Durchschnitten, um eine vorzeitige Ausrichtung der MAs zu vermeiden. Optionale Filterung von Signalen mit dem RSI-Indikator für übe
FREE

Überblick über den Market Sessions Indicator Der Market Sessions Indicator ist ein Tool, das Händlern helfen soll, die aktiven Handelszeiten der wichtigsten globalen Finanzmärkte zu visualisieren - insbesondere die Sitzungen in Tokio, London und New York. Durch die eindeutige Markierung dieser Zeitzonen auf dem Chart ermöglicht der Indikator den Benutzern, die Aufteilung der wichtigsten Handelssitzungen zu erkennen. Es gibt 3 reguläre Handelssitzungen: - Tokio-Sitzung - Londoner Sitzung - New Yo
FREE

Der Top and Bottom Identifier Pro ist das unverzichtbare Werkzeug für Händler, die technische Analysen und Preisaktionen als Grundlage für ihre Entscheidungen nutzen. Im MetaTrader 5 ist das Verständnis der Marktstruktur - ob der Kurs höhere oder niedrigere Hochs und niedrigere Tiefs erreicht - der erste Schritt zum Erfolg. Dieser Indikator automatisiert diesen Prozess, eliminiert die Subjektivität und ermöglicht es Ihnen, Kursumkehrpunkte mit sofortiger Klarheit zu visualisieren.
FREE
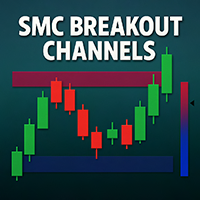
SMC Ausbruchskanäle Antizipieren Sie Marktausbrüche mit Präzision.
SMC Breakout Channels erkennt automatisch Akkumulations- und Distributionsbereiche, in denen professionelle Händler ("smart money") am aktivsten sind. Durch die Kombination von volatilitätsbasierter Bereichserkennung mit Echtzeit-Volumenanalyse hebt dieses Tool die wichtigsten Ausbruchszonen hervor, die oft starken Richtungsbewegungen vorausgehen. Vorteile Klarheit: Kein Durcheinander, nur saubere Ausbruchsboxen mit klarer b
FREE

Hydra Trend Rider ist ein nicht nachzeichnender Trendindikator für mehrere Zeitrahmen, der präzise Kauf-/Verkaufssignale und Echtzeitwarnungen für Handels-Setups mit hoher Wahrscheinlichkeit liefert. Mit seiner farbkodierten Trendlinie, dem anpassbaren Dashboard und den mobilen Benachrichtigungen ist er perfekt für Händler, die Klarheit, Vertrauen und Konsistenz im Trendhandel suchen. Einrichtung & Anleitung: MT4-Version hier herunterladen . Um zu lernen, wie man den Indikator benutzt: Indikator

Dieser Indikator kombiniert TRIX (Triple Exponential Moving Average) mit einem gleitenden Durchschnitt, der einfach, exponentiell, geglättet oder gewichtet sein kann.
Diese Kombination ist sehr nützlich, um den Haupttrend zu identifizieren und um festzustellen, wann er sich in eine neue Richtung entwickelt.
Der Indikator verfügt auch über Signale auf dem Chart, die anzeigen, wenn sich der TRIX mit dem gleitenden Durchschnitt kreuzt, sowie über Pop-up-Warnungen und Push (in der MT5-App).
Viel
FREE

Time Range Separator ist ein nützliches Werkzeug, um einen Trennungszeitraum auf Ihrer Plattform anzuzeigen.
Sie können in den Eigenschaften des Indikators gehen, wählen Sie den gewünschten Bereich und das ist ALLES. Wir glauben, dass es ein nützliches und notwendiges Tool ist, das wir allen unseren Anhängern kostenlos zur Verfügung stellen möchten. Eingabewerte: TimeFrame = Zeitraum-Trennzeichen Separator_Color = Vertikale Farblinie Separator_Style = Vertikale Farbe Stil Separator_Width = Vert
FREE

Wenn Sie die Möglichkeit haben, das Buch "Trend Trading - A Seven-Step Approach to success " von Daryl Guppy zu lesen, werden Sie eine Menge Informationen darüber erhalten, wie man den Markt "liest". In seinem Buch zeigt Daryl unter anderem, wie man mit einem visuellen Werkzeug die Volatilität und den Trend zwischen lang- und kurzfristigen Perioden messen kann: Der GMMA - Guppy Multiple Moving Averages .
Anstatt seine ursprüngliche Idee zu verwenden, 12 exponentielle gleitende Durchschnitte in
FREE

50% Rabatt. Ursprünglicher Preis: $60 Unterstützung und Widerstand Zonen Indikator für MT5 ist ein Multi-Timeframe-Panel und Warnung, die Unterstützung und Widerstand Zonen und Pivot-Punkte für alle Timeframes von MetaTrader 5 findet und gibt Alarm, wenn der Preis hat Interaktion mit ihnen. Demo-Version herunterladen (funktioniert mit den Symbolen GBPUSD, EURJPY und NZDUSD) Lesen Sie die vollständige Beschreibung der Scanner-Parameter auf der Blog-Seite . Viele einzigartige Funktionen in einem

Shaolin Trend Follow v2.1
Optimiert für EURUSD auf MetaTrader 5 Ein leichter, rein signalbasierter Indikator mit strengem Top-Down-Workflow: Zuerst wird die übergeordnete Bewegung auf H4 bestätigt, dann werden auf M15 nur noch volatilitätsangepasste Einstiegssignale abgewartet. Keine automatischen Orders oder Geldmanagement – nur klare / Markierungen, wenn alle Bedingungen erfüllt sind, damit Sie nach eigenem Ermessen handeln können. H4-Trendbestätigung Parabolic SAR + ADX-Filter lassen nur
FREE
CandleStick Patterns Indikator für MT5 - Professioneller Musterscanner Bringen Sie die bewährte Candlestick-Analyse in Ihren Arbeitsablauf. Dieser Indikator scannt automatisch Ihren Chart und hebt hochwertige Umkehr- und Fortsetzungsmuster hervor, damit Sie schneller und mit mehr Vertrauen reagieren können. Besuchen Sie den Abschnitt "Mehr vom Autor" auf der Marktseite, um unser komplettes Indikatorensortiment zu sehen. Was er tut Scannt historische und Live-Kerzen aus einem benutzerdefinierten

Dieser Indikator zeichnet Handelszonen auf der Basis von Fraktalen aus höheren Perioden, was den Handel nach Levels vereinfacht.
Dieser Indikator zeichnet zwei Arten von Handelszonen auf einem Diagramm.
Wenn zum Beispiel die aktuelle Periode H1 ist, werden die Handelszonen anhand der Fraktale von H4 und D1 gesucht.
In den Standardeinstellungen werden die Fraktalzonen von H4 in Gelb und von D1 in Grün dargestellt.
Wenn sich die Zonen überlagern, werden die Farben am Schnittpunkt der Zonen ge
FREE
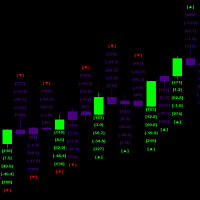
Dieser Indikator hilft, den Beginn signifikanter Marktbewegungen zu erkennen, indem er die Kerzenmuster und ihre relative Preisaktionsstärke analysiert.
Der Indikator führt jede Millisekunde mehrere gleichzeitige Berechnungen durch und führt auch eine dreifache historische Überprüfung durch, um zukünftige Wahrscheinlichkeiten zu berechnen. Die historische Verarbeitung muss abgeschlossen sein, bevor neue Candlesticks als ein Gesamtsatz aus der gesamten verfügbaren Historie ab dem Startdatum und
FREE
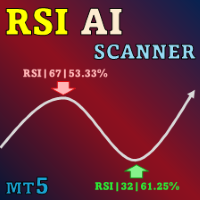
Special offer : ALL TOOLS , just $35 each! New tools will be $30 for the first week or the first 3 purchases ! Trading Tools Channel on MQL5 : Join my MQL5 channel to update the latest news from me Wir stellen den revolutionären RSI Kernel Optimized with Scanner für MT5 vor, ein hochmodernes Tool, das die traditionelle RSI-Analyse durch die Integration des leistungsstarken Kernel-Density-Estimation-Algorithmus (KDE) neu definiert. Dieser fortschrittliche Indikator bietet nicht nur

Wir stellen das Volume Orderflow Profile vor, ein vielseitiges Tool, das Händlern hilft, die Dynamik des Kauf- und Verkaufsdrucks innerhalb eines bestimmten Rückblickzeitraums zu visualisieren und zu verstehen. Perfekt für alle, die einen tieferen Einblick in das volumenbasierte Marktverhalten gewinnen möchten! MT4-Version - https://www.mql5.com/en/market/product/122656/ Der Indikator sammelt Daten zu Höchst- und Tiefstkursen sowie Kauf- und Verkaufsvolumina über einen benutzerdefinierten Zeitra

Entwicklung der vorherigen Version des Indikators ZigZag WaveSize MT4 ZigZag WaveSize - modifizierter Standard-ZigZag-Indikator mit zusätzlichen Informationen über die Wellenlänge in Punkten, Ebenen und verschiedenen Warnungslogiken
Allgemeine Verbesserungen: Code-Anpassung für MetaTrader 5 Optimierte Arbeit mit grafischen Objekten Neuigkeiten: Horizontale Ebenen an Extremwerten Auswahl des Ebenentyps: horizontal/Strahlen/Segmente Filter für liquide Ebenen (nicht vom Preis durchbrochen) Puffer
FREE

Der ATR-Exit-Indikator verwendet den Kerzenschluss + ATR-Wert, um Trailing-Stop-Linien zu ziehen (orange unter Käufen, magenta über Verkäufen), die mit dem Trend vorrücken, bis der Trend seine Richtung ändert. Er verwendet ein Vielfaches der Average True Range (ATR), indem er ihren Wert vom Schlusskurs bei Käufen subtrahiert und ihren Wert zum Schlusskurs bei Verkäufen addiert. Außerdem werden die Trailing-Stop-Linien so generiert, dass sie die Trendrichtung des Auftrags (Long oder Short) unter
FREE

Volume Profile Indicator - Benutzerhandbuch Beschreibung : Der Volume Profile Indicator ist ein leistungsstarkes Tool für MetaTrader 5. Er visualisiert die Marktaktivität anhand der Verteilung des Volumens über die Kursniveaus und zeigt: Histogramm des Volumens in jedem Preisbereich POC (Point of Control) - der Preis mit dem höchsten gehandelten Volumen Value Area - der Bereich, der einen konfigurierbaren Prozentsatz des Volumens abdeckt (z.B. 70%) Unterstützungsebenen: Min, Max, und Pivot Durch
FREE

VTrende Pro - MTF-Indikator für den Trendhandel mit einem Anzeigefeld für MT5 *** Videos können mit Untertiteln in jede Sprache übersetzt werden (Videosprache - Russisch)
Obwohl die Signale des VTrende Pro Indikators als Signale eines vollwertigen Handelssystems verwendet werden können,
wird empfohlen, sie in Verbindung mit dem Bill Williams TS zu verwenden.
VTrende Pro ist eine erweiterte Version des VTrende-Indikators. Unterschied zwischen Pro Version und VTrende:
- Zeitzonen
- Signal V - Sig

John Bollinger schuf diesen Indikator im Jahr 2010 als eine Möglichkeit, den ursprünglichen Indikator (Bollinger Bands) auf eine "technischere" Weise zu lesen, die als Oszillator dargestellt wird. Der typische Bereich der Bollinger Bands %B ist 0 - 0,5 - 1,0, wobei "0" das untere Band, "0,5" das mittlere Band und "1" das obere Band darstellt. Die Linie auf dem Indikator stellt die Schlusskurse dar. So einfach ist das.
EINSTELLUNGEN
Zeitraum der Bollinger-Bänder-Analyse Standardabweichung Multip
FREE

Session Break Out Indicator – Das ultimative Tool für sitzungsbasiertes Trading Der Session Break Out Indicator ist ein hochmodernes Werkzeug, das Tradern hilft, Marktsitzungen zu überwachen und zeitbasierte Handelsstrategien effektiv zu nutzen. Professionelle Trader wissen, dass die Zeit eine entscheidende Rolle am Forex-Markt spielt, da Währungsstärke und Volatilität in den verschiedenen Handelssitzungen variieren. Mit diesem leistungsstarken Indikator können Sie:
Marktsitzungen verfolgen – So
FREE

Phoenix News Countdown Calendar (MT5)
Echtzeit-Countdown-Panel für Wirtschaftsnachrichten für MetaTrader 5. Zeigt bevorstehende Ereignisse mit hoher Auswirkung mit präzisen Countdown-Timern an, um Händlern dabei zu helfen, Risiken im Zusammenhang mit Volatilitätsspitzen zu managen.
Zweck
Wirtschaftsnachrichten führen zu unerwarteter Volatilität, Slippage und Drawdown. Blindes Handeln bei Ereignissen mit hoher Auswirkung kann technische Setups und Risikokontrollen sofort ungültig machen.
Der
FREE

Beschreibung des Produkts Clean, Smart Sessions ist ein professioneller Indikator für Handelssitzungen, der Händlern eine klare, genaue und übersichtliche Darstellung der aktiven Marktsitzungen direkt auf dem Chart bietet. Der Indikator erkennt und zeigt die aktive Handelssitzung (Asien, London und New York) dynamisch und in Echtzeit an, indem er eine saubere Sitzungsbox zeichnet, die kontinuierlich aktualisiert wird, um die wahren Höchst- und Tiefstwerte der Sitzung wiederzugeben. Wenn sich Si
FREE

PUMPING STATION – Ihre persönliche „All-inclusive“-Strategie
Wir präsentieren Ihnen PUMPING STATION – einen revolutionären Forex-Indikator, der Ihr Trading in eine spannende und effektive Erfahrung verwandeln wird. Es handelt sich nicht nur um ein Hilfsmittel, sondern um ein vollwertiges Handelssystem mit leistungsstarken Algorithmen, die Ihnen helfen, stabiler zu traden. Beim Kauf dieses Produkts erhalten Sie KOSTENLOS: Exklusive Set-Dateien: Für automatische Einrichtung und maximale Leistung.

Triangle Pattern Gann v3.1 - Complete Feature Documentation Core Functionality OverviewTriangle Pattern Gann v3.1 ist ein hochentwickelter MetaTrader 5-Indikator, der die geometrischen Handelsprinzipien von W.D. Gann mit fortschrittlicher Dreiecksmustererkennung kombiniert, um umsetzbare Handelssignale zu liefern. Primary Features1. Dreiecksmuster-ErkennungssystemAufsteigendes Dreieck Erkennung
Funktion: Identifiziert automatisch bullische Fortsetzungsmuster Erkennungs-Kriterien:
Flache h
FREE
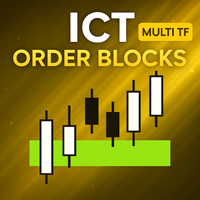
[ MT4 Version ] [ Kill Zones ] [ SMT Divergenzen ] Wie man mit Orderblöcken handelt: Klicken Sie hier Leistung der Benutzeroberfläche : Während der Tests im Strategietester kann es zu Verzögerungen in der Benutzeroberfläche kommen. Seien Sie versichert, dass dieses Problem nur in der Testumgebung auftritt und keinen Einfluss auf die Leistung des Indikators im Live-Handel hat. Verbessern Sie Ihre Handelsstrategie mit dem Order Blocks ICT Multi TF-Indikator, einem hochmodernen Tool, das Ihre Hande
Der Kerzen-Tracker für den höheren Zeitrahmen wird verwendet, um einen Einblick in die Kerze des ausgewählten höheren Zeitrahmens zu erhalten. Er stellt die Kerze nach dem aktuellen Kurs dar. Dies kann für Daytrader und kurzfristige Trader sehr nützlich sein, die sich oft Gedanken darüber machen, wie die aktuelle Kerze im höheren Zeitrahmen aussehen könnte. Sie können den höheren oder niedrigeren Zeitrahmen aus den angebotenen Optionen auswählen: Standardmäßig ist die Farbe für Bären rot und für
FREE
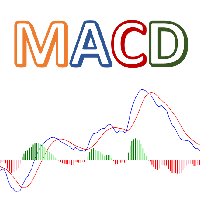
Colorful MACD ist die MT5-Version des Standard-MACD von TradingView. Dieser Indikator hat 4 verschiedene Farben für das MACD-Histogramm, so dass es sehr einfach ist, Schwankungen im Histogramm zu erkennen. Eigenschaften: Bunte Histogramm-Balken Signallinie anzeigen/ausblenden MACD-Linie ein-/ausblenden Flexible Preissteuerung Bitte rufen Sie mich an, wenn Sie weitere Eingabeparameter oder eine modifizierte Version dieses Indikators benötigen.
FREE

Dieser Indikator erstellt eine Heatmap basierend auf der Markttiefe des aktuellen Symbols oder eines anderen Symbols. Ein anderes Symbol ist nützlich, wenn Sie mit Terminkontrakten handeln und ein Kontrakt in "Mini" und "Full" aufgeteilt ist. In Brasilien (B3 - BMF&Bovespa) zum Beispiel sind WDO und DOL Devisenterminkontrakte von BRL/USD (wobei 1 DOL = 5 WDO) und große Banken arbeiten hauptsächlich mit DOL (wo Liquidität wichtig ist). Bitte verwenden Sie den M1-Zeitrahmen , da die Objekte zu kl

Ich empfehle Ihnen, den Blog des Produkts (Handbuch) von Anfang bis Ende zu lesen , damit von Anfang an klar ist, was der Indikator bietet. Dieser Dashboard-Indikator für mehrere Zeitrahmen und Symbole sendet eine Warnung, wenn eine oder zwei verschiedene Divergenzen identifiziert wurden. Er kann mit allen Zeitrahmen von M1 bis MN verwendet werden. Maximal 9 Zeitrahmen können gleichzeitig auf dem Dashboard angezeigt werden. Es ist möglich, den Trendfilter mit gleitendem Durchschnitt, RSI oder B

GEN Sessions Bandprofil Entwickler: Gede Egi GEN Sessions Volume Profile ist ein MT5-Indikator, der die Volumenverteilung für jede Handelssitzung (täglich) in Form eines Volumenprofils anzeigt. Mit diesem Tool können Händler leicht erkennen, auf welchen Kursniveaus die höchste Handelsaktivität während einer Sitzung stattgefunden hat, was es einfacher macht, wichtige Marktbereiche zu identifizieren. Der Indikator stellt automatisch Session Boxes, Point of Control (POC), Value Area High (VAH), Va
FREE
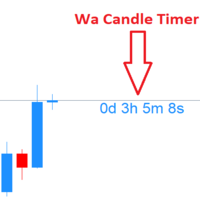
Wa Candle Timer MT5 zeigt im Hauptchart einen Live-Countdown bis zum Schluss der aktuellen Kerze. Gegen Ende des Bars wechselt der Timer die Farbe (Standard: wenn ~95 % der Kerzenzeit verstrichen sind, also ~5 % Restzeit).
Leichtgewichtig, klar und ideal für Trader, die Ein- und Ausstiege am Kerzenschluss ausrichten. Wichtige Funktionen Echtzeit-Countdown bis zum Bar-Close für jedes Symbol und jeden Zeitrahmen. Farbwechsel, wenn die Kerze kurz vor dem Abschluss steht (Standard-Schwelle ≈ 95 %).
FREE

Weil Stil wichtig ist
Ich weiß, wie lästig es ist, jedes Mal auf Eigenschaften zu klicken, um die Farbe der Kerze zu ändern, den Hintergrund hell oder dunkel zu machen und das Gitter einzufügen oder zu entfernen. Hier ist die Lösung mit nur einem Klick: Drei anpassbare Schaltflächen zur Auswahl des Kerzenstils, den Händler wünschen. Eine Schaltfläche zum Umschalten zwischen Tag- und Nachtmodus. Eine Schaltfläche zum Ein- und Ausblenden des Gitters in den Charts. *****In den Einstellungen könn
FREE

RubdFx Perfect Reversal , Der Reversal-Indikator wird verwendet, um Unterstützungs- und Widerstandsbereiche zu bestimmen, indem ein Pfeil mit dem Niveau von Angebot und Nachfrage (ReversalZones ) gezeichnet wird. -Sie fangen mehr Schwankungen ein, wenn Sie die Periode reduzieren, und weniger Schwankungen, wenn Sie die Periode erhöhen . Handy-, Computer- und E-Mail-Warnungen verfügbar . Es ist nicht durch den Preis geschoben, was bedeutet, dass der Pfeil an einem Ort bleiben, geeignet für Scalpin
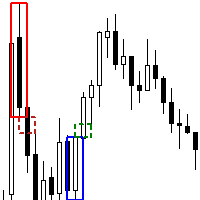
Der Order Block FVG Box-Indikator für MetaTrader 5 ist ein leistungsfähiges Werkzeug für anspruchsvolle Händler, die hochwahrscheinliche Handelsmöglichkeiten identifizieren und nutzen möchten. Dieser Indikator zeichnet sich dadurch aus, dass er gültige Order-Blöcke identifiziert, auf die unmittelbar Fair Value Gaps (FVG) folgen, und so Ihre Handelsstrategie mit präzisen visuellen Hinweisen verbessert. Hauptmerkmale: Orderblock-Identifikation : Erkennt gültige Orderblöcke, d. h. signifikante Bere
FREE

CPR Pivot-Linien Es wird gezeichnet Pivot-Punkt R1,R2,R3 S1, S2, S3 Tc Bc Das Beste daran ist, dass Sie sogar Werte von High, Low, Close manuell hinzufügen können, um alle Levels auf dem Chart zu erhalten, so dass Sie sich nicht mehr auf die Daten Ihres Brokers verlassen müssen, wenn diese nicht korrekt sind. Sie können sogar den Stil aller Linien ändern. Es wird zeigen, Linie in Floting Stil und nicht Continues Mess.
FREE

KT Trend Trading Suite ist ein multifunktionaler Indikator, der eine Trendfolgestrategie mit mehreren Ausbruchspunkten als Einstiegssignale kombiniert.
Sobald ein neuer Trend erkannt wird, bietet der Indikator mehrere Einstiegsmöglichkeiten, um erfolgreich dem Trend zu folgen. Ein Rücklauf-Schwellenwert wird verwendet, um weniger relevante Einstiegspunkte zu vermeiden.
Die MT4-Version ist hier verfügbar https://www.mql5.com/en/market/product/46268
Funktionen
Kombiniert verschiedene Marktdy

Volumen-Druckmesser Analysiert den Tick-Volumenfluss, um den Kauf- und Verkaufsdruck mit Multi-Timeframe-Bestätigung anzuzeigen. Übersicht Dieser Indikator zeigt ein Histogramm mit Farbverläufen an, die die Druckintensität darstellen. Ein Trend-Bias-Label zeigt die vorherrschende Druckrichtung mit einer prozentualen Anzeige für den Druckabfall an. Ein visueller Balken zeigt das Druckverhältnis zwischen Kauf und Verkauf auf einen Blick an. Der Indikator bietet die Möglichkeit zur Analyse mehrerer
FREE
Es ist unser Jahrestag! Um uns zu revanchieren, gibt es für die nächste Woche 60% Rabatt (Originalpreis $239)
Wir haben alle unsere geliebten Indikatoren wie z.B.: Key-Level-Order-Block , Key-Level-Angebot und -Nachfrage , Key-Level-Liquiditätsgrab und Key-Level-Keil in einem einzigen Indikator und Dashboard.
Was ist neu? Dashboard : Es gibt ein leicht zugängliches Dashboard für alle Ihre Bedürfnisse. Multi-Timeframe-Schaltfläche : Es gibt jetzt eine Multi-Timeframe-Option für Order-Blöcke und
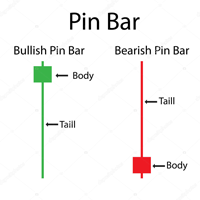
Pin-Bar-Muster sind gekennzeichnet durch einen langen oberen oder unteren Docht mit einem kleinen Körper im Verhältnis zur Größe des Dochts und wenig bis gar keinem unteren oder oberen Schatten. Pin-Bars dürfen nicht isoliert gehandelt werden , sondern müssen im größeren Kontext der Chartanalyse betrachtet werden. Ein Pin-Bar-Einstiegssignal kann in einem Trendmarkt einen sehr wahrscheinlichen Einstieg und ein gutes Risiko-Ertrags-Verhältnis bieten.
Eingaben Multiplikator ; AlertOn - Alarme akt
FREE

INDIKATOR FÜR LIQUIDITÄTSSCHWÜNGE - MT5 Fortgeschrittenes Smart Money Konzept Tool
ÜBERBLICK
Der Liquidity Sweeps Indicator ist ein professionelles MT5-Tool, das entwickelt wurde, um institutionelle Liquiditätseinbrüche und Stop-Hunt-Muster zu erkennen. Basierend ICT (Inner Circle
FREE

FVG Smart Zones – Kostenlose Edition
Fair Value Gap Erkennungsindikator für MetaTrader 5 (MT5) Suchen Sie ein echtes Trading-Werkzeug – nicht nur einen weiteren zufälligen Indikator?
FVG Smart Zones – Kostenlose Edition gibt Ihnen professionelle Markteinblicke, indem automatisch Fair Value Gaps (FVGs) erkannt und hochwahrscheinliche Trading-Zonen direkt auf Ihrem Chart hervorgehoben werden. Erstellt für Trader, die folgen:
Smart Money Concepts (SMC)
ICT Trading Konzepte
Pric
FREE

Engulfing-Kerzen-Detektor
Erkennbare Muster Double Candlestick-Muster Bullish Engulfing
Die erste Kerze ist eine schwarze Kerze. Die zweite Kerze eröffnet mit einer Lücke unter dem realen Körper der schwarzen Kerze, erholt sich aber nach oben und schließt über dem realen Körper der schwarzen Kerze. Mit anderen Worten, der reale Körper der zweiten Kerze verschlingt den realen Körper der ersten Kerze vollständig. Bearish Engulfing
Die erste Kerze ist eine weiße Kerze. Die zweite Kerze eröffnet m
FREE

EINFÜHRUNG IN DEN GPT SPIKES INDICATOR Der GPT Spikes-Indikator ist ein revolutionäres Handelsinstrument, das speziell für die Boom- und Crash-Märkte auf der Deriv-Plattform entwickelt wurde. Er nutzt hochmoderne Algorithmen, um Händlern präzise Markteinblicke zu geben und ihnen zu helfen, Marktspitzen und Umkehrpunkte mit beispielloser Genauigkeit zu erkennen. Egal, ob Sie neu im Handel sind oder ein erfahrener Profi, der GPT Spikes Indicator bietet die Präzision und Anpassungsfähigkeit, die Si
FREE

N/B : Alle unsere Produktkäufe kommen mit unserem kostenlosen ''DAILY SCALPER EA'' - bit .ly/4qlFLNh Whatsapp Developer für Ihren nach erfolgreichem Kauf
DER PERFEKTE EINSTIEGSINDIKATOR
Traden wie ein Profi mit dem Perfect Entry Indicator!
Kein Rätselraten mehr. Just Precision. Double-ZigZag + Fractal Confirmation = Nur die stärksten Buy & Sell Setups.
Haben Sie genug von falschen Signalen, späten Einstiegen und endloser Chart-Verwirrung? Der Perfect Entry Indicator wurde entwickelt, um

Einführung in den Fractal Pattern Scanner Fractal Indicator bezieht sich auf einen technischen Indikator, der die fraktale Geometrie des Finanzmarktes nutzt. Fractal Pattern Scanner ist ein fortschrittlicher Fraktalindikator, der nach umfangreichen Forschungs- und Entwicklungsarbeiten im Bereich der fraktalen Geometrie auf dem Finanzmarkt die neueste Handelstechnologie bietet. Das wichtigste Merkmal von Fractal Pattern Scanner ist die Fähigkeit, die Wahrscheinlichkeit des Wendepunkts sowie die T

Ein Kraftpaket für den Handel: Erkennung von Trends, Umkehrungen und Erschöpfungen
Dieser Indikator ist eine persönliche Implementierung des berühmten Traders Dynamic Index, der RSI, gleitende Durchschnitte und Volatilitätsbänder verwendet, um Trends, Umkehrungen und Preiserschöpfungen zu erkennen. Diese spezielle Implementierung unterstützt jedoch nicht nur den RSI, sondern auch viele andere. Er eignet sich für Scalping, Day-Trading und Swing-Trading und zielt darauf ab, ein vollständiges Bild
FREE
Reverse RSI Signals Indicator
Der Reverse RSI Signals Indikator ist ein vielseitiges technisches Analysetool für den MetaTrader 5 (MT5). Er wandelt traditionelle RSI-Berechnungen in dynamische preisbasierte Bänder um, integriert Supertrend zur Trendidentifikation und beinhaltet Divergenzerkennung für potenzielle Umkehrsignale. Dieser Overlay-Indikator bietet visuelle und auf Warnungen basierende Einblicke, um Händlern dabei zu helfen, überkaufte/überverkaufte Bedingungen, Trendverschiebungen u
FREE

Dieser Indikator bildet einen Kanal basierend auf den Messwerten des ADX-Indikators (Average Directional Movement Index), zeigt den Händler an und informiert ihn über eine Preisumkehr an den Grenzen dieses Kanals. Er kann auch melden, wenn der Preis die Kanalgrenzen berührt. Außerdem werden zusätzliche gepunktete Linien gezeichnet, die von den + DI- und -DI-Werten des ADX-Indikators abhängen. Es besteht auch die Möglichkeit, Signale in Abhängigkeit von den stochastischen Messwerten zu filtern.
FREE

Swing BOS Structure ist ein Marktstrukturindikator für MetaTrader 5.
Der Indikator erkennt automatisch: - Swing Hoch (SH) - Tiefstkurs (SL) - Bruch der Struktur (BOS) - Wechsel des Charakters (CHoCH)
Umschwünge werden erst nach einer bestimmten Anzahl von Kerzen bestätigt, wodurch sichergestellt wird, dass sie sich nicht wiederholen. BOS-Signale zeigen eine Trendfortsetzung an. CHoCH-Signale weisen auf eine potenzielle Veränderung der Marktstruktur hin und können je nach Marktbedingungen und
FREE

Der Indikator zeigt minimierte Charts jedes Symbols aus jedem Zeitrahmen an. Die maximale Anzahl der angezeigten Diagramme beträgt 28. Die Diagramme können sich sowohl im Haupt- als auch im unteren Fenster befinden. Zwei Anzeigemodi: Kerzen und Balken. Die Menge der angezeigten Daten (Balken und Kerzen) und die Diagrammgrößen sind einstellbar. Um mit einem Mini-Chat zu arbeiten, müssen Sie zunächst den/die gewünschten Indikator(en) auf einem regulären Chart platzieren, diesen dann als Vorlage sp
FREE

## Tägliches Hoch Indikator - Danilo Monteiro - MT5
## Beschreibung Der Daily High/Low Labels ist ein angepasster Indikator für MetaTrader 5, der automatisch Tageshöchst- und -tiefststände auf dem Chart anzeigt und so die schnelle Identifizierung wichtiger Kursniveaus erleichtert. Der Indikator markiert die Kurse mit Etiketten und horizontalen Linien und ermöglicht so eine klare Visualisierung der kritischen Niveaus des aktuellen Tages und des Vortages.
## Hauptmerkmale
### 1. Automatische Ke
FREE

Merkmal
Indikator zur Überprüfung des Volumens nach Preis. Funktioniert hauptsächlich für EURUSD, bei anderen Währungspaaren kann es nicht funktionieren oder die Berechnung kann lange dauern. Für reibungslose Verwendung aktivieren Sie die Option "Ende der Diagrammgrenze vom rechten Rand verschieben", wie im Screenshot dargestellt. Wenn eine neue Balken-Daten erscheint, werden die Daten zurückgesetzt.
Variablen COlOR: Einstellung der Farbe des Indikators WIDTH: Einstellung der Breite des Indi
FREE
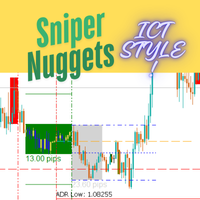
!!!!!!!! Sniper Nuggets !!!!!!!!
Sniper Nuggets ist ein All-in-One-Indikator für viele Dinge im ICT-Stil. Er umfasst die folgenden Funktionalitäten: Benutzerdefinierte Zeiträume : Erlaubt es Ihnen, die Start- und Endzeiten der täglichen Perioden nach Ihrem Geschmack festzulegen. ADR-Marker: zeigt die durchschnittliche tägliche Spanne an. Worktime: Zeichnet die verschiedenen Boxen auf dem Diagramm für die Asien-Range (einschließlich der Höchst-, Tiefst- und Mittelwerte, Standardabweichungsprogn
FREE

Sind Sie es leid, bei jeder Analyse von Charts Trendlinien zu zeichnen? Oder wünschen Sie sich mehr Konsistenz in Ihrer technischen Analyse? Dann ist dies genau das Richtige für Sie. Dieser Indikator zeichnet automatisch Trendlinien, wenn er auf einem Chart abgelegt wird. Wie er funktioniert Funktioniert ähnlich wie der Standardabweichungskanal auf mt4 und mt5. Er hat 2 Parameter: 1. Start-Bar 2. Anzahl der Balken für die Berechnung Der Startbalken ist der Balken, mit dem das Zeichnen der Trendl
FREE

Der Indikator bestimmt die Richtung der Preisbewegung, berechnet die Möglichkeit des Einstiegs in den Markt anhand einer internen Formel und zeigt ein Einstiegssignal für den Ausbruch an. Die Signale des Indikators erscheinen sowohl zu Beginn von Trendbewegungen als auch in der Gegenrichtung, was Ihnen ermöglicht, Aufträge unter allen Marktbedingungen so effizient wie möglich zu öffnen und zu schließen. Version für МТ4: https://www.mql5.com/en/market/product/58349
Vorteile: eine einzigartige Fo
FREE

Der Range Filter Buy and Sell Indikator ist ein trendfolgendes technisches Analysewerkzeug, das entwickelt wurde, um optimale Einstiegs- und Ausstiegspunkte im Markt zu identifizieren. Er filtert Marktgeräusche heraus, indem er dynamische Bänder um die Kursbewegungen herum erstellt und klare Kauf- und Verkaufssignale erzeugt, wenn der Kurs diese Bänder durchbricht. Hauptmerkmale Dynamische Bereichsfilterung : Verwendet einen hochentwickelten Algorithmus zur Berechnung adaptiver Bänder, die sich
FREE
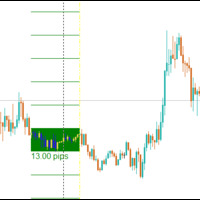
Die Central Bank Dealers Range (CBDR) ist ein wichtiges IKT-Konzept, mit dem auf der Grundlage der Marktbedingungen während eines bestimmten Zeitfensters potenzielle Höchst- und Tiefststände für den Tag prognostiziert werden. Die CBDR wird zur Vorhersage von Kursbewegungen sowohl bei steigenden als auch bei fallenden Marktbedingungen verwendet. Durch die Identifizierung dieses Bereichs können Händler die Kursniveaus, die sich im Laufe des Tages bilden könnten, besser vorhersehen.
CBDR und Stan
FREE
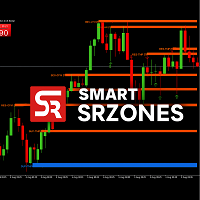
SmartSRZones ist ein MT5-Indikator zur automatischen Erkennung, Anzeige und Verwaltung von Unterstützungs- und Widerstandszonen direkt auf dem Chart.
Er kombiniert die Erkennung von Marktstrukturen mit der Erkennung von Candlestick-Mustern, um Händlern zu helfen, wichtige Kursniveaus ohne manuelle Markierung anzuzeigen. Der Indikator eignet sich für verschiedene Handelsansätze, einschließlich kurzfristiger und langfristiger Analysen. Wichtigste Merkmale Automatische Erkennung von Zonen Identifi
FREE

Der volumengewichtete gleitende Durchschnitt (VWMA) wird auf der Grundlage der Preise und der zugehörigen Volumina berechnet, wobei den Kerzen mit dem größten Volumen Bedeutung beigemessen wird. In Perioden, in denen das Volumen über den beobachteten Zeitraum nahezu gleich verteilt ist (in der Regel in Perioden mit geringem Volumen), ähnelt der VWMA grafisch einem einfachen gleitenden Durchschnitt. Zusammen mit anderen gleitenden Durchschnitten kann ein VWMA als Alarm, Filter oder was auch immer
FREE

Der Indikator " YK Find Support And Resistance " ist ein technisches Analyseinstrument, mit dem Sie wichtige Unterstützungs- und Widerstandsniveaus auf einem Kurschart identifizieren können. Seine Eigenschaften und Funktionen sind wie folgt:
1. Zeigt die Unterstützungs- und Widerstandsniveaus mit Hilfe von Pfeillinien und farbigen Bändern an, wobei der Widerstand in rot und die Unterstützung in grün dargestellt wird.
2. Kann so eingestellt werden, dass die Ergebnisse für einen bestimmten Zeit
FREE

Steigern Sie Ihre Handelspräzision mit dem WH Trading Sessions MT5- Indikator für MetaTrader 5! Dieses leistungsstarke Tool hilft Ihnen, wichtige Marktsitzungen mühelos zu visualisieren und zu verwalten. Basierend auf: WH SMC Indicator MT5
MT4-Version: WH Trading Sessions MT4
Hauptmerkmale: Interaktives GUI-Panel – Einfaches Auswählen und Umschalten zwischen Handelssitzungen in Asien, London und New York .
Anpassbare Warnungen und Einstellungen – Passen Sie den Indikator
FREE

Magic Candles ist ein neues Produkt, das die Identifizierung der aktuellen Marktphase (Aufwärtstrend, Abwärtstrend oder Flat) ermöglicht.
Dieser Indikator malt Balken je nach aktueller Marktlage in verschiedenen Farben und informiert den Benutzer mit Warnungen über Trendänderungen.
Magic Candles eignet sich perfekt für den Handel mit Währungen (einschließlich Kryptowährungen) und binären Optionen.
Vorteile Geeignet für Scalping und Intraday-Handel. Der Indikator wird nicht neu gezeichnet (ne

VJ Sniper - MT5 Buy / Sell Indicator: Dieser Indikator ist so einfach wie Buy in Up Trend & Sell in Down Trend. Es gibt grafische Unterstützungs-/Widerstandsniveaus für die Auswahl der besten Einstiege. Hintergrund: Jeder eingebaute Indikator des MT5 funktioniert nicht als Einzelindikator, wie z.B. Stochastic, CCI oder DeMarker etc. Aber die Kombination von ihnen mit der Trendprojektion funktioniert und liefert die besten Ergebnisse für den Einstieg in den Handel. So ist dieser Indikator gemisch
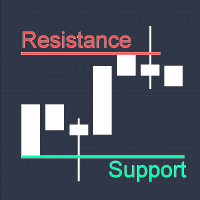
Echter Unterstützungs-Widerstands-Indikator: Ihr ultimatives Werkzeug für präzise Handelsentscheidungen Schnelle Übersicht Ein einfacher Indikator, der Ihre Handelsstrategie aufwertet: Der True Support Resistance Indicator ist ein leistungsstarkes Tool, mit dem Sie wichtige Unterstützungs-/Widerstandsniveaus in Echtzeit identifizieren können. Erleben Sie saubere Grafiken, sofortige Warnungen bei Ausbrüchen und dynamische Aktualisierungen, mit denen Sie den Marktbewegungen immer einen Schritt vor
FREE
Der MetaTrader Market ist eine einzigartige Plattform für den Verkauf von Robotern und technischen Indikatoren.
Das Merkblatt für Nutzer der MQL5.community informiert Sie über weitere Möglichkeiten: nur bei uns können Trader Handelssignale kopieren, Programme bei Freiberuflern bestellen, Zahlungen über das Handelssystem automatisch tätigen sowie das MQL5 Cloud Network nutzen.
Sie verpassen Handelsmöglichkeiten:
- Freie Handelsapplikationen
- Über 8.000 Signale zum Kopieren
- Wirtschaftsnachrichten für die Lage an den Finanzmärkte
Registrierung
Einloggen
Wenn Sie kein Benutzerkonto haben, registrieren Sie sich
Erlauben Sie die Verwendung von Cookies, um sich auf der Website MQL5.com anzumelden.
Bitte aktivieren Sie die notwendige Einstellung in Ihrem Browser, da Sie sich sonst nicht einloggen können.