
Automatisieren von Handelsstrategien in MQL5 (Teil 16): Midnight Range Breakout mit der Preisaktion Break of Structure (BoS)
Einführung
In unserem letzten Artikel (Teil 15) haben wir eine automatisierte Handelsstrategie vorgestellt, die das Cypher Harmonic Pattern nutzt, um Marktumkehrungen zu erfassen. In Teil 16 konzentrieren wir uns nun auf die Automatisierung der Strategie Midnight Range Breakout (Ausbruch aus der Mitternachtsspanne) mit Break of Structure (Bruch der Struktur) in MetaQuotes Language 5 (MQL5) und entwickeln einen Expert Advisor, der die Preisspanne zwischen Mitternacht und 6 Uhr morgens identifiziert, Break of Structure (BoS) erkennt und Handelsgeschäfte ausführt. Wir werden die folgenden Themen behandeln:
- Verständnis der Strategie des Midnight Range Breakout mit Break of Structure
- Implementation in MQL5
- Backtests
- Schlussfolgerung
Am Ende dieses Artikels werden Sie über ein voll funktionsfähiges Programm in MQL5 verfügen, das wichtige Kursniveaus visualisiert, Ausbrüche bestätigt und Handelsgeschäfte mit definierten Risikoparametern ausführt - lasst uns beginnen!
Verständnis der Strategie des Midnight Range Breakout mit Break of Structure
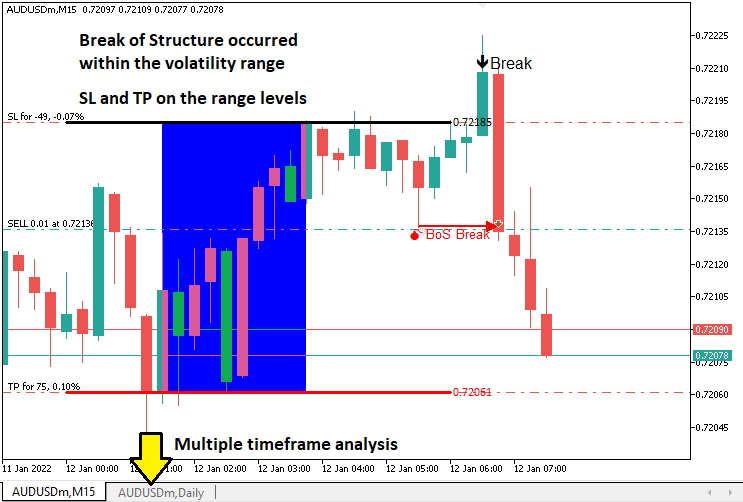
Die Midnight Range Breakout mit Break of Structure-Strategie nutzt eine Preisspanne mit geringer Volatilität, die sich zwischen Mitternacht und 6 Uhr morgens gebildet hat, und verwendet den höchsten und den niedrigsten Kurs als Ausbruchsniveau, während sie zur Validierung der Handelssignale eine Break of Structure-Bestätigung verlangt. Break of Structure identifiziert Trendwechsel, indem es erkennt, wann der Kurs einen hohen Umkehrpunkt übersteigt (bullish) oder ein tiefen Umkehrpunkt unterschreitet (bearish), falsche Ausbrüche herausfiltert und die Handelsgeschäfte auf das Marktmomentum abstimmt. Dieser Ansatz eignet sich für die Märkte an den Übergängen zwischen den Sitzungen, z. B. bei der Eröffnung der Londoner Börse, oder für jeden anderen Zeitpunkt Ihrer Wahl. Es erfordert jedoch eine Anpassung der Zeitzonen und Vorsicht bei Ereignissen mit hohem Nachrichtenwert, damit es nicht zu „Whipsaws“ kommt.
Unser Implementierungsplan sieht die Erstellung eines MQL5 Expert Advisors vor, der die Strategie automatisiert, indem er den Bereich von Mitternacht bis 6 Uhr morgens berechnet, auf Ausbrüche innerhalb eines festgelegten Zeitfensters achtet und diese mit einem Break of Structure in einem bestimmten Zeitrahmen bestätigt, normalerweise 5, 10 oder 15 Minuten, sodass wir dies in der Eingabe haben, damit der Nutzer dynamisch wählen kann. Das System führt Handelsgeschäfte mit Stop-Loss- und Take-Profit-Levels aus, die aus der Handelsspanne abgeleitet werden, visualisiert die wichtigsten Levels auf dem Chart, um Klarheit zu schaffen, und sorgt für ein robustes Risikomanagement, um eine konsistente Performance unter verschiedenen Marktbedingungen zu gewährleisten. Kurz und bündig: Das ist es, was wir meinen.
Implementation in MQL5
Um das Programm in MQL5 zu erstellen, öffnen wir den MetaEditor, gehen zum Navigator, suchen den Ordner der Indikatoren, klicken auf die Registerkarte „Neu“ und folgen Sie den Anweisungen, um die Datei zu erstellen. Sobald das erledigt ist, müssen wir in der Programmierumgebung einige globale Variablen deklarieren, die wir im gesamten Programm verwenden werden.
//+------------------------------------------------------------------+
//|                   Midnight Range Break of Structure Breakout.mq5 |
//|                           Copyright 2025, Allan Munene Mutiiria. |
//|                                   https://t.me/Forex_Algo_Trader |
//+------------------------------------------------------------------+
#property copyright "Copyright 2025, Allan Munene Mutiiria."
#property link      "https://t.me/Forex_Algo_Trader"
#property version   "1.00"

#include <Trade/Trade.mqh> //--- Include the Trade library for handling trade operations
CTrade obj_Trade;          //--- Create an instance of the CTrade class for trade execution

double maximum_price = -DBL_MAX;      //--- Initialize the maximum price variable to negative infinity
double minimum_price = DBL_MAX;       //--- Initialize the minimum price variable to positive infinity
datetime maximum_time, minimum_time;  //--- Declare variables to store the times of maximum and minimum prices
bool isHaveDailyRange_Prices = false; //--- Initialize flag to indicate if daily range prices are calculated
bool isHaveRangeBreak = false;        //--- Initialize flag to indicate if a range breakout has occurred
bool isTakenTrade = false;            //--- Initialize flag to indicate if a trade is taken for the current day

#define RECTANGLE_PREFIX "RANGE RECTANGLE " //--- Define a prefix for rectangle object names
#define UPPER_LINE_PREFIX "UPPER LINE "     //--- Define a prefix for upper line object names
#define LOWER_LINE_PREFIX "LOWER LINE "     //--- Define a prefix for lower line object names

// bos
input ENUM_TIMEFRAMES timeframe_bos = PERIOD_M5; // Input the timeframe for Break of Structure (BoS) analysis
Hier beginnen wir mit der Umsetzung der Strategie, indem wir die grundlegenden Komponenten des Programms einrichten. Wir binden die Bibliothek <Trade/Trade.mqh> ein, um Handelsoperationen zu ermöglichen, und instanziieren die Klasse „CTrade“ als Objekt „obj_Trade“, das die Ausführung von Handelsgeschäften, wie das Eröffnen von Kauf- oder Verkaufspositionen mit bestimmten Parametern, übernimmt.
Wir definieren mehrere globale Variablen, um wichtige Daten für die Strategie zu verfolgen. Die Variablen „maximum_price“ und „minimum_price“, die mit -DBL_MAX bzw. DBL_MAX initialisiert werden, speichern den höchsten und den niedrigsten Preis innerhalb der Spanne von Mitternacht bis 6 Uhr morgens, sodass wir die Grenzen der Spanne ermitteln können. Die Variablen „maximum_time“ und „minimum_time“ vom Typ datetime zeichnen die Zeitpunkte auf, zu denen diese extremen Preise auftreten, was für die Visualisierung der Spanne im Chart wichtig ist. Wir verwenden auch boolesche Flags: „isHaveDailyRange_Prices“, um anzuzeigen, ob die tägliche Spanne berechnet wurde, „isHaveRangeBreak“, um festzustellen, ob ein Ausbruch stattgefunden hat, und „isTakenTrade“, um sicherzustellen, dass nur ein Handel pro Tag getätigt wird, um Overtrading zu verhindern.
Um die Visualisierung von Charts zu erleichtern, werden Konstanten für die Benennung von Objekten definiert: “RECTANGLE_PREFIX“ als „RANGE RECTANGLE“, „UPPER_LINE_PREFIX“ als „UPPER LINE“ und „LOWER_LINE_PREFIX“ als „LOWER LINE“. Diese Präfixe gewährleisten eindeutige Namen für Chartobjekte wie Rechtecke und Linien, die den Bereich und die Ausbruchsniveaus markieren und die Aktionen der Strategie visuell klar machen. Zusätzlich führen wir den Nutzereingabeparameter „timeframe_bos“ ein, der standardmäßig auf PERIOD_M5 eingestellt ist und es Händlern ermöglicht, den Zeitrahmen für die Analyse des Break of Structure festzulegen, z. B. den 5-Minuten-Chart, um hohe und tiefe Umkehrpunkte zu erkennen. Damit sind wir bereit. Es müssen zwei Funktionen definiert werden, die es uns ermöglichen, Handelsinstanzen zwischen neuen Tagen und neuen Balken zu steuern.
//+------------------------------------------------------------------+
//| Function to check for a new bar                                  |
//+------------------------------------------------------------------+
bool isNewBar(){ //--- Define a function to detect a new bar on the current timeframe
   static int prevBars = 0;                //--- Store the previous number of bars
   int currBars = iBars(_Symbol,_Period);  //--- Get the current number of bars
   if (prevBars==currBars) return (false); //--- Return false if no new bar has formed
   prevBars = currBars;                    //--- Update the previous bar count
   return (true);                          //--- Return true if a new bar has formed
}

//+------------------------------------------------------------------+
//| Function to check for a new day                                  |
//+------------------------------------------------------------------+
bool isNewDay(){ //--- Define a function to detect a new trading day
   bool newDay = false;  //--- Initialize the new day flag

   MqlDateTime Str_DateTime;                 //--- Declare a structure to hold date and time information
   TimeToStruct(TimeCurrent(),Str_DateTime); //--- Convert the current time to the structure

   static int prevDay = 0;         //--- Store the previous day's date
   int currDay = Str_DateTime.day; //--- Get the current day's date

   if (prevDay == currDay){ //--- Check if the current day is the same as the previous day
      newDay = false;       //--- Set the flag to false (no new day)
   }
   else if (prevDay != currDay){ //--- Check if a new day has started
      Print("WE HAVE A NEW DAY WITH DATE ",currDay); //--- Log the new day
      prevDay = currDay;                             //--- Update the previous day
      newDay = true;                                 //--- Set the flag to true (new day)
   }

   return (newDay); //--- Return the new day status
}
Hier implementieren wir die Funktionen „isNewBar“ und „isNewDay“, um unseren Midnight Range Breakout mit der Break of Structure Strategie in MQL5 mit Market Timing zu synchronisieren. In „isNewBar“ verfolgen wir die Anzahl der Balken mithilfe eines statischen „prevBars“ und der Funktion iBars mit _Symbol und _Period, die true zurückgibt, wenn sich ein neuer Balken bildet, um Preisaktualisierungen auszulösen. In „isNewDay“ verwenden wir eine Funktion MqlDateTime-Struktur, die TimeToStruct mit TimeCurrent und einen statischen „prevDay“, um neue Tage zu erkennen, die Bereichsberechnungen zurückzusetzen, wenn sich „currDay“ ändert, und über Print zu protokollieren. Mit diesen Funktionen können wir die Logik direkt in OnTick definieren.
//+------------------------------------------------------------------+
//| Expert tick function                                             |
//+------------------------------------------------------------------+
void OnTick(){
   //---
   static datetime midnight = iTime(_Symbol,PERIOD_D1,0);            //--- Store the current day's midnight time
   static datetime sixAM = midnight + 6 * 3600;                      //--- Calculate 6 AM time by adding 6 hours to midnight
   static datetime scanBarTime = sixAM + 1 * PeriodSeconds(_Period); //--- Set the time of the next bar after 6 AM for scanning
   static double midnight_price = iClose(_Symbol,PERIOD_D1,0);       //--- Store the closing price at midnight

   static datetime validBreakTime_start = scanBarTime;               //--- Set the start time for valid breakout detection
   static datetime validBreakTime_end = midnight + (6+5) * 3600;     //--- Set the end time for valid breakouts to 11 AM

   if (isNewDay()){ //--- Check if a new trading day has started
      midnight = iTime(_Symbol,PERIOD_D1,0);                          //--- Update midnight time for the new day
      sixAM = midnight + 6 * 3600;                                    //--- Recalculate 6 AM time for the new day
      scanBarTime = sixAM + 1 * PeriodSeconds(_Period);               //--- Update the scan bar time to the next bar after 6 AM
      midnight_price = iClose(_Symbol,PERIOD_D1,0);                   //--- Update the midnight closing price
      Print("Midnight price = ",midnight_price,", Time = ",midnight); //--- Log the midnight price and time

      validBreakTime_start = scanBarTime;           //--- Reset the start time for valid breakouts
      validBreakTime_end = midnight + (6+5) * 3600; //--- Reset the end time for valid breakouts to 11 AM

      maximum_price = -DBL_MAX; //--- Reset the maximum price to negative infinity
      minimum_price = DBL_MAX;  //--- Reset the minimum price to positive infinity

      isHaveDailyRange_Prices = false; //--- Reset the flag indicating daily range calculation
      isHaveRangeBreak = false;        //--- Reset the flag indicating a range breakout
      isTakenTrade = false;            //--- Reset the flag indicating a trade is taken
   }
}
Hier entwickeln wir die Kernlogik unserer Strategie innerhalb von OnTick, der Hauptereignisbehandlung in unserem Programm, der bei jedem Preis-Tick ausgeführt wird. Wir initialisieren statische Variablen, um kritische Zeitpunkte zu erfassen: „midnight“ speichert die Startzeit des aktuellen Tages unter Verwendung der Funktion iTime mit _Symbol, PERIOD_D1 und Index 0; „sixAM“ wird berechnet, indem 6 Stunden (21.600 Sekunden) zu „midnight“ addiert werden; „scanBarTime“ setzt die Zeit des nächsten Balkens nach 6 Uhr morgens unter Verwendung der Funktion PeriodSeconds mit „_Period“; und „midnight_price“ erfasst den Tagesschlusskurs um Mitternacht über die Funktion iClose. Wir definieren außerdem „validBreakTime_start“ als „scanBarTime“ und „validBreakTime_end“ als 11 AM (Mitternacht plus 11 Stunden), um ein Zeitfenster für gültige Ausbrüche festzulegen.
Wenn ein neuer Handelstag beginnt, der von unserer Funktion „isNewDay“ erkannt wird, aktualisieren wir diese Timing-Variablen, um die Daten des neuen Tages widerzuspiegeln und sicherzustellen, dass unsere Bereichsberechnungen aktuell bleiben. Wir setzen „midnight“, „sixAM“, „scanBarTime“ und „midnight_price“ mit denselben Funktionen iTime und iClose zurück und protokollieren die Mitternachtsdetails mit Print zur Fehlersuche. Wir setzten auch „validBreakTime_start“ und „validBreakTime_end“ für das neue Ausbruchsfenster zurück und initialisierten „maximum_price“ auf „-DBL_MAX“, „minimum_price“ auf „DBL_MAX“ und die Flags „isHaveDailyRange_Prices“, „isHaveRangeBreak“ und „isTakenTrade“ auf „false“ gesetzt, um den EA darauf vorzubereiten, den Bereich von Mitternacht bis 6 Uhr morgens neu zu berechnen und auf neue Ausbrüche zu überwachen. Wir können nun die Berechnung der Zeitspannen überprüfen.
if (isNewBar()){ //--- Check if a new bar has formed on the current timeframe
   datetime currentBarTime = iTime(_Symbol,_Period,0); //--- Get the time of the current bar

   if (currentBarTime == scanBarTime && !isHaveDailyRange_Prices){              //--- Check if it's time to scan for daily range and range is not yet calculated
      Print("WE HAVE ENOUGH BARS DATA FOR DOCUMENTATION. MAKE THE EXTRACTION"); //--- Log that the scan for daily range is starting
      int total_bars = int((sixAM - midnight)/PeriodSeconds(_Period))+1;        //--- Calculate the number of bars from midnight to 6 AM
      Print("Total Bars for scan = ",total_bars);                               //--- Log the total number of bars to scan
      int highest_price_bar_index = -1;                                         //--- Initialize the index of the bar with the highest price
      int lowest_price_bar_index = -1;                                          //--- Initialize the index of the bar with the lowest price

      for (int i=1; i<=total_bars ; i++){ //--- Loop through each bar from midnight to 6 AM
         double open_i = open(i);   //--- Get the open price of the i-th bar
         double close_i = close(i); //--- Get the close price of the i-th bar

         double highest_price_i = (open_i > close_i) ? open_i : close_i; //--- Determine the highest price (open or close) of the bar
         double lowest_price_i = (open_i < close_i) ? open_i : close_i;  //--- Determine the lowest price (open or close) of the bar

         if (highest_price_i > maximum_price){ //--- Check if the bar's highest price exceeds the current maximum
            maximum_price = highest_price_i;   //--- Update the maximum price
            highest_price_bar_index = i;       //--- Store the bar index of the maximum price
            maximum_time = time(i);            //--- Store the time of the maximum price
         }
         if (lowest_price_i < minimum_price){ //--- Check if the bar's lowest price is below the current minimum
            minimum_price = lowest_price_i; //--- Update the minimum price
            lowest_price_bar_index = i;     //--- Store the bar index of the minimum price
            minimum_time = time(i);         //--- Store the time of the minimum price
         }
      }
      Print("Maximum Price = ",maximum_price,", Bar index = ",highest_price_bar_index,", Time = ",maximum_time); //--- Log the maximum price, its bar index, and time
      Print("Minimum Price = ",minimum_price,", Bar index = ",lowest_price_bar_index,", Time = ",minimum_time);  //--- Log the minimum price, its bar index, and time

      isHaveDailyRange_Prices = true; //--- Set the flag to indicate that the daily range is calculated
   }
}
Um die Preisspanne von Mitternacht bis 6 Uhr morgens zu berechnen, wenn sich ein neuer Balken bildet, verwenden wir die Funktion „isNewBar“, um zu prüfen, ob ein neuer Balken vorhanden ist, und rufen dann die Zeit des Balkens mit iTime für _Symbol, _Periode, Index 0 ab und speichern sie in „currentBarTime“. Wenn „currentBarTime“ gleich „scanBarTime“ ist und „isHaveDailyRange_Prices“ falsch ist, protokollieren wir den Bereichsscan beginnend mit Print, berechnen „total_bars“ unter Verwendung von PeriodSeconds für _Period und durchlaufen eine Schleife, um die höchsten und niedrigsten Preise mit den Funktionen „open“ und „close“ zu ermitteln und „maximum_price“, „minimum_price“, „maximum_time“, „minimum_time“ und ihre Indizes zu aktualisieren. Wir protokollieren die Ergebnisse und setzen „isHaveDailyRange_Prices“ auf „true“, um die Überwachung des Ausbruchs zu ermöglichen.
Der Einfachheit halber haben wir vordefinierte Funktionen verwendet, um die Preise zu ermitteln, und zwar folgende.
//+------------------------------------------------------------------+
//| Helper functions for price and time data                         |
//+------------------------------------------------------------------+
double open(int index){return (iOpen(_Symbol,_Period,index));}   //--- Return the open price of the specified bar index on the current timeframe
double high(int index){return (iHigh(_Symbol,_Period,index));}   //--- Return the high price of the specified bar index on the current timeframe
double low(int index){return (iLow(_Symbol,_Period,index));}     //--- Return the low price of the specified bar index on the current timeframe
double close(int index){return (iClose(_Symbol,_Period,index));} //--- Return the close price of the specified bar index on the current timeframe
datetime time(int index){return (iTime(_Symbol,_Period,index));} //--- Return the time of the specified bar index on the current timeframe

double high(int index,ENUM_TIMEFRAMES tf_bos){return (iHigh(_Symbol,tf_bos,index));}   //--- Return the high price of the specified bar index on the BoS timeframe
double low(int index,ENUM_TIMEFRAMES tf_bos){return (iLow(_Symbol,tf_bos,index));}     //--- Return the low price of the specified bar index on the BoS timeframe
datetime time(int index,ENUM_TIMEFRAMES tf_bos){return (iTime(_Symbol,tf_bos,index));} //--- Return the time of the specified bar index on the BoS timeframe
Wir implementieren Hilfsfunktionen zum effizienten Abrufen von Preis- und Zeitdaten, indem wir die Funktionen „open“, „high“, „low“, „close“ und „time“ definieren, die jeweils einen „index“-Parameter benötigen, um Daten für den aktuellen Zeitrahmen mit iOpen, „iHigh“, „iLow“, „iClose“ bzw. iTime mit „_Symbol“ und _Period als Eingaben abzurufen und den entsprechenden Eröffnungskurs, Höchstkurs, Tiefstkurs, Schlusskurs oder Taktzeit für den angegebenen Taktindex zurückzugeben.
Zusätzlich überladen wir die Funktionen „high“, „low“ und „time“, um den Parameter ENUM_TIMEFRAMES „tf_bos“ zu akzeptieren, der es uns ermöglicht, den Höchstpreis, den Tiefstpreis oder die Barzeit für den Break of Structure-Zeitrahmen mit „iHigh“, „iLow“ und „iTime“ mit _Symbol und „tf_bos“ abzurufen. Da wir den Bereich definiert haben, können wir ihn im Chart visualisieren. Zu diesem Zweck müssen wir auch einige zusätzliche Hilfsfunktionen definieren.
//+------------------------------------------------------------------+
//| Function to create a rectangle object                            |
//+------------------------------------------------------------------+
void create_Rectangle(string objName,datetime time1,double price1,
               datetime time2,double price2,color clr){ //--- Define a function to draw a rectangle on the chart
   if (ObjectFind(0,objName) < 0){                                       //--- Check if the rectangle object does not already exist
      ObjectCreate(0,objName,OBJ_RECTANGLE,0,time1,price1,time2,price2); //--- Create a rectangle object with specified coordinates

      ObjectSetInteger(0,objName,OBJPROP_TIME,0,time1);  //--- Set the first time coordinate of the rectangle
      ObjectSetDouble(0,objName,OBJPROP_PRICE,0,price1); //--- Set the first price coordinate of the rectangle
      ObjectSetInteger(0,objName,OBJPROP_TIME,1,time2);  //--- Set the second time coordinate of the rectangle
      ObjectSetDouble(0,objName,OBJPROP_PRICE,1,price2); //--- Set the second price coordinate of the rectangle
      ObjectSetInteger(0,objName,OBJPROP_FILL,true);     //--- Enable filling the rectangle with color
      ObjectSetInteger(0,objName,OBJPROP_COLOR,clr);     //--- Set the color of the rectangle
      ObjectSetInteger(0,objName,OBJPROP_BACK,false);    //--- Ensure the rectangle is drawn in the foreground

      ChartRedraw(0); //--- Redraw the chart to display the rectangle
   }
}

//+------------------------------------------------------------------+
//| Function to create a line object with text                       |
//+------------------------------------------------------------------+
void create_Line(string objName,datetime time1,double price1,
               datetime time2,double price2,int width,color clr,string text){ //--- Define a function to draw a trend line with text
   if (ObjectFind(0,objName) < 0){                                   //--- Check if the line object does not already exist
      ObjectCreate(0,objName,OBJ_TREND,0,time1,price1,time2,price2); //--- Create a trend line object with specified coordinates

      ObjectSetInteger(0,objName,OBJPROP_TIME,0,time1);  //--- Set the first time coordinate of the line
      ObjectSetDouble(0,objName,OBJPROP_PRICE,0,price1); //--- Set the first price coordinate of the line
      ObjectSetInteger(0,objName,OBJPROP_TIME,1,time2);  //--- Set the second time coordinate of the line
      ObjectSetDouble(0,objName,OBJPROP_PRICE,1,price2); //--- Set the second price coordinate of the line
      ObjectSetInteger(0,objName,OBJPROP_WIDTH,width);   //--- Set the width of the line
      ObjectSetInteger(0,objName,OBJPROP_COLOR,clr);     //--- Set the color of the line
      ObjectSetInteger(0,objName,OBJPROP_BACK,false);    //--- Ensure the line is drawn in the foreground

      long scale = 0; //--- Initialize a variable to store the chart scale
      if(!ChartGetInteger(0,CHART_SCALE,0,scale)){                                   //--- Attempt to get the chart scale
         Print("UNABLE TO GET THE CHART SCALE. DEFAULT OF ",scale," IS CONSIDERED"); //--- Log if the chart scale cannot be retrieved
      }

      int fontsize = 11; //--- Set the default font size for the text
      if (scale==0){fontsize=5;} //--- Adjust font size for minimized chart scale
      else if (scale==1){fontsize=6;}  //--- Adjust font size for scale 1
      else if (scale==2){fontsize=7;}  //--- Adjust font size for scale 2
      else if (scale==3){fontsize=9;}  //--- Adjust font size for scale 3
      else if (scale==4){fontsize=11;} //--- Adjust font size for scale 4
      else if (scale==5){fontsize=13;} //--- Adjust font size for maximized chart scale

      string txt = " Right Price";         //--- Define the text suffix for the price label
      string objNameDescr = objName + txt; //--- Create a unique name for the text object
      ObjectCreate(0,objNameDescr,OBJ_TEXT,0,time2,price2);        //--- Create a text object at the line's end
      ObjectSetInteger(0,objNameDescr,OBJPROP_COLOR,clr);          //--- Set the color of the text
      ObjectSetInteger(0,objNameDescr,OBJPROP_FONTSIZE,fontsize);  //--- Set the font size of the text
      ObjectSetInteger(0,objNameDescr,OBJPROP_ANCHOR,ANCHOR_LEFT); //--- Set the text anchor to the left
      ObjectSetString(0,objNameDescr,OBJPROP_TEXT," "+text);       //--- Set the text content (price value)
      ObjectSetString(0,objNameDescr,OBJPROP_FONT,"Calibri");      //--- Set the font type to Calibri

      ChartRedraw(0); //--- Redraw the chart to display the line and text
   }
}
Um den Bereich zu visualisieren, definieren wir zwei Funktionen. In der Funktion „create_Rectangle“ wird ein ausgefülltes Rechteck gezeichnet, um die Preisspanne von Mitternacht bis 6 Uhr morgens darzustellen, wobei die Parameter „objName“, „time1“, „price1“, „time2“, „price2“ und „clr“ zur Anpassung verwendet werden. Zunächst wird mit der Funktion ObjectFind mit der Chart-ID 0 geprüft, ob das Objekt nicht existiert, um Duplikate zu vermeiden.
Falls nicht vorhanden, erstellen wir das Rechteck mit ObjectCreate unter Verwendung von OBJ_RECTANGLE und setzen seine Koordinaten mit ObjectSetInteger für OBJPROP_TIME und ObjectSetDouble für „OBJPROP_PRICE“. Wir aktivieren die Farbfüllung mit „ObjectSetInteger“ für „OBJPROP_FILL“, legen die Farbe des Rechtecks fest und stellen sicher, dass es im Vordergrund erscheint, indem wir „OBJPROP_BACK“ auf false setzen, gefolgt von einem ChartRedraw, um die Chartanzeige zu aktualisieren.
In der Funktion „create_Line“ wird eine Trendlinie mit einer beschreibenden Textbeschriftung zur Markierung der Bereichsgrenzen gezeichnet, wobei die Parameter „objName“, „time1“, „price1“, „time2“, „price2“, „width“, „clr“ und „text“ akzeptiert werden. Wir überprüfen mit „ObjectFind“, ob die Linie vorhanden ist, erstellen sie dann mit „ObjectCreate“ mit OBJ_TREND und konfigurieren Koordinaten, Linienbreite und Farbe mit „ObjectSetInteger“ und „ObjectSetDouble“. Um die Lesbarkeit des Textes zu gewährleisten, wird die Skala des Charts mit „ChartGetInteger“ abgerufen, eventuelle Fehler mit „Print“ protokolliert und die Schriftgröße dynamisch an die Skala angepasst (von 5 bis 13).
Wir erstellen ein Textobjekt mit „ObjectCreate“ unter Verwendung von „OBJ_TEXT“ mit dem Namen „objNameDescr“ und setzen seine Eigenschaften mit „ObjectSetInteger“ für Farbe, Schriftgröße und linken Anker und ObjectSetString für die Schriftart „Calibri“ und den Preistext, bevor wir das Chart mit „ChartRedraw“ neu zeichnen. Mit diesen Funktionen können wir sie aufrufen, wenn wir die Bereiche definieren.
create_Rectangle(RECTANGLE_PREFIX+TimeToString(maximum_time),maximum_time,maximum_price,minimum_time,minimum_price,clrBlue);                       //--- Draw a rectangle to mark the daily range
create_Line(UPPER_LINE_PREFIX+TimeToString(midnight),midnight,maximum_price,sixAM,maximum_price,3,clrBlack,DoubleToString(maximum_price,_Digits)); //--- Draw the upper line for the range
create_Line(LOWER_LINE_PREFIX+TimeToString(midnight),midnight,minimum_price,sixAM,minimum_price,3,clrRed,DoubleToString(minimum_price,_Digits));   //--- Draw the lower line for the range
Wir vervollständigen die Visualisierung der Preisspanne von Mitternacht bis 6 Uhr morgens, indem wir „create_Rectangle“ mit „RECTANGLE_PREFIX+TimeToString(maximum_time)“, „maximum_time“, „maximum_price“, „minimum_time“, „minimum_price“ und „clrBlue“, um ein Rechteck zu zeichnen, das den Bereich markiert. Wir verwenden dann zweimal „create_Line“: zuerst für die obere Zeile mit „UPPER_LINE_PREFIX+TimeToString(midnight)“, „midnight“, „maximum_price“, „sixAM“, width 3, „clrBlack“ und „DoubleToString(maximum_price,_Digits)“; und zweitens für die untere Zeile mit „LOWER_LINE_PREFIX“, „minimum_price“, „clrRed“ und passenden Parametern. Hier ist das aktuelle Ergebnis.
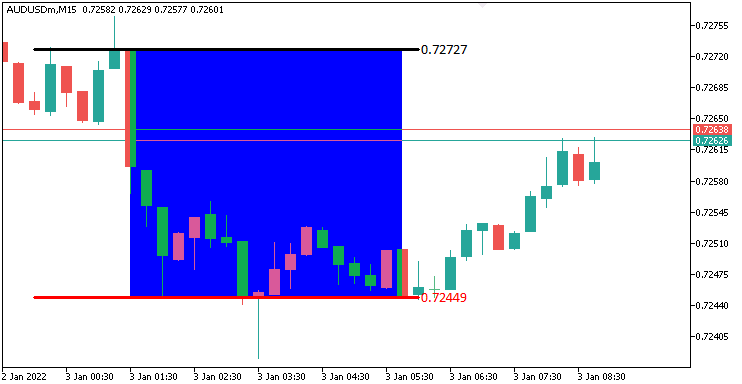
Aus dem Bild ist ersichtlich, dass wir den Bereich genau visualisiert haben. Als Nächstes müssen wir feststellen, dass es innerhalb eines vordefinierten Zeitraums einen Bruch gibt, und diesen auch im Chart darstellen. Wir benötigen eine nutzerdefinierte Funktion, um den Bruch im Chart anzuzeigen.
//+------------------------------------------------------------------+
//| Function to draw a breakpoint marker                             |
//+------------------------------------------------------------------+
void drawBreakPoint(string objName,datetime time,double price,int arrCode,
   color clr,int direction){ //--- Define a function to draw a breakpoint marker
   if (ObjectFind(0,objName) < 0){ //--- Check if the breakpoint object does not already exist
      ObjectCreate(0,objName,OBJ_ARROW,0,time,price);        //--- Create an arrow object at the specified time and price
      ObjectSetInteger(0,objName,OBJPROP_ARROWCODE,arrCode); //--- Set the arrow code for the marker
      ObjectSetInteger(0,objName,OBJPROP_COLOR,clr);         //--- Set the color of the arrow
      ObjectSetInteger(0,objName,OBJPROP_FONTSIZE,12);       //--- Set the font size for the arrow
      if (direction > 0) ObjectSetInteger(0,objName,OBJPROP_ANCHOR,ANCHOR_TOP);    //--- Set the anchor to top for upward breaks
      if (direction < 0) ObjectSetInteger(0,objName,OBJPROP_ANCHOR,ANCHOR_BOTTOM); //--- Set the anchor to bottom for downward breaks

      string txt = " Break"; //--- Define the text suffix for the breakpoint label
      string objNameDescr = objName + txt; //--- Create a unique name for the text object
      ObjectCreate(0,objNameDescr,OBJ_TEXT,0,time,price);   //--- Create a text object at the breakpoint
      ObjectSetInteger(0,objNameDescr,OBJPROP_COLOR,clr);   //--- Set the color of the text
      ObjectSetInteger(0,objNameDescr,OBJPROP_FONTSIZE,12); //--- Set the font size of the text
      if (direction > 0) { //--- Check if the breakout is upward
         ObjectSetInteger(0,objNameDescr,OBJPROP_ANCHOR,ANCHOR_LEFT_UPPER); //--- Set the text anchor to left upper
         ObjectSetString(0,objNameDescr,OBJPROP_TEXT, " " + txt);           //--- Set the text content
      }
      if (direction < 0) { //--- Check if the breakout is downward
         ObjectSetInteger(0,objNameDescr,OBJPROP_ANCHOR,ANCHOR_LEFT_LOWER); //--- Set the text anchor to left lower
         ObjectSetString(0,objNameDescr,OBJPROP_TEXT, " " + txt);           //--- Set the text content
      }
   }
   ChartRedraw(0); //--- Redraw the chart to display the breakpoint
}
Hier definieren wir die Funktion „drawBreakPoint“, um Ausbruchspunkte visuell zu markieren. Mit den Parametern „objName“, „time“, „price“, „arrCode“, „clr“, und „direction“erstellen wir einen Pfeil mit ObjectCreate und OBJ_ARROW, falls er nicht über ObjectFind gefunden wurde, und setzen seinen Stil, seine Farbe und seine Schriftgröße 12 mit „ObjectSetInteger“, und verankern ihn an „ANCHOR_TOP“ oder „ANCHOR_BOTTOM“ je nach „direction“.
Wir fügen mit „ObjectCreate“ und „OBJ_TEXT“ eine Textbeschriftung „Break“ mit dem Namen „objNameDescr“ hinzu und konfigurieren Farbe, Schriftgröße und Anker (ANCHOR_LEFT_UPPER oder ANCHOR_LEFT_LOWER) mit „ObjectSetInteger“ und ObjectSetString. Wir schließen mit „ChartRedraw“ ab, um diese Marker anzuzeigen und eine klare Visualisierung des Ausbruchs zu gewährleisten. Mit dieser Funktion können wir nun die Haltepunkte im Chart visualisieren.
double barClose = close(1); //--- Get the closing price of the previous bar
datetime barTime = time(1); //--- Get the time of the previous bar

if (barClose > maximum_price && isHaveDailyRange_Prices && !isHaveRangeBreak
    && barTime >= validBreakTime_start && barTime <= validBreakTime_end
){ //--- Check for a breakout above the maximum price within the valid time window
   Print("CLOSE Price broke the HIGH range. ",barClose," > ",maximum_price); //--- Log the breakout above the high range
   isHaveRangeBreak = true;                                                //--- Set the flag to indicate a range breakout has occurred
   drawBreakPoint(TimeToString(barTime),barTime,barClose,234,clrBlack,-1); //--- Draw a breakpoint marker for the high breakout
}
else if (barClose < minimum_price && isHaveDailyRange_Prices && !isHaveRangeBreak
         && barTime >= validBreakTime_start && barTime <= validBreakTime_end
){ //--- Check for a breakout below the minimum price within the valid time window
   Print("CLOSE Price broke the LOW range. ",barClose," < ",minimum_price); //--- Log the breakout below the low range
   isHaveRangeBreak = true;                                              //--- Set the flag to indicate a range breakout has occurred
   drawBreakPoint(TimeToString(barTime),barTime,barClose,233,clrBlue,1); //--- Draw a breakpoint marker for the low breakout
}
Um die gültigen Ausbrüche zu erkennen und zu visualisieren, holen wir den Schluss des vorherigen Balkens mit „close(1)“ in „barClose“ und die Zeit mit „time(1)“ in „barTime“. Wenn „barClose“ den „maximum_price“ überschreitet, „isHaveDailyRange_Prices“ wahr ist, „isHaveRangeBreak“ falsch ist und „barTime“ zwischen „validBreakTime_start“ und „validBreakTime_end“ liegtprotokollieren wir den hohen Ausbruch mit „Print“, setzen „isHaveRangeBreak“ auf true und rufen „drawBreakPoint“ mit „TimeToString(barTime)“, „barClose“, Pfeil 234, „clrBlack“ und -1 auf.
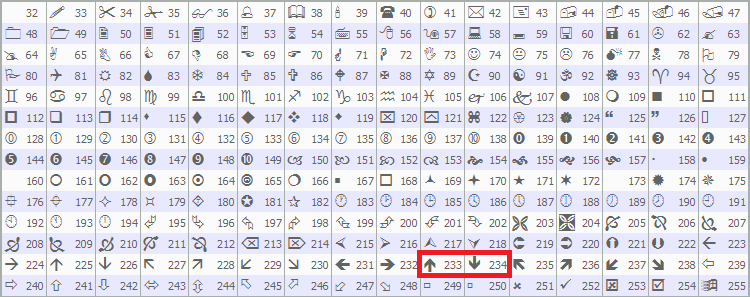
Wenn „barClose“ unter denselben Bedingungen unter „minimum_price“ liegt, protokollieren wir den niedrigen Ausbruch, setzen „isHaveRangeBreak“, und rufen „drawBreakPoint“ mit Pfeil 233, „clrBlue“ und 1 auf. Dies markiert gültige Ausbrüche. Wir haben die vordefinierten Pfeile von MQL5 verwendet, insbesondere 233 und 23, wie Sie unten sehen können, aber Sie können auch jeden anderen Pfeil verwenden, der Ihnen gefällt.
Wenn wir das Programm ausführen, erhalten wir die folgende Ausgabe.
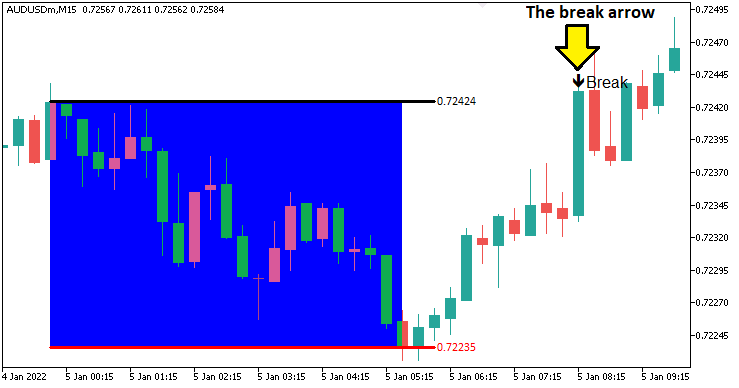
Anhand des Bildes können wir sehen, dass wir das Break genau identifizieren und visualisieren können. Als Nächstes müssen wir die Strukturverschiebung und ihre Unterbrechungslogik definieren. Wir brauchen also eine Funktion, um den ermittelten Schwingungspunkt zu zeichnen.
//+------------------------------------------------------------------+
//| Function to draw a swing point marker                            |
//+------------------------------------------------------------------+
void drawSwingPoint(string objName,datetime time,double price,int arrCode,
   color clr,int direction){ //--- Define a function to draw a swing point marker
   if (ObjectFind(0,objName) < 0){ //--- Check if the swing point object does not already exist
      ObjectCreate(0,objName,OBJ_ARROW,0,time,price);        //--- Create an arrow object at the specified time and price
      ObjectSetInteger(0,objName,OBJPROP_ARROWCODE,arrCode); //--- Set the arrow code for the marker
      ObjectSetInteger(0,objName,OBJPROP_COLOR,clr);         //--- Set the color of the arrow
      ObjectSetInteger(0,objName,OBJPROP_FONTSIZE,10);       //--- Set the font size for the arrow

      if (direction > 0) {ObjectSetInteger(0,objName,OBJPROP_ANCHOR,ANCHOR_TOP);}    //--- Set the anchor to top for swing lows
      if (direction < 0) {ObjectSetInteger(0,objName,OBJPROP_ANCHOR,ANCHOR_BOTTOM);} //--- Set the anchor to bottom for swing highs

      string text = "BoS";                   //--- Define the text label for Break of Structure
      string objName_Descr = objName + text; //--- Create a unique name for the text object
      ObjectCreate(0,objName_Descr,OBJ_TEXT,0,time,price);   //--- Create a text object at the swing point
      ObjectSetInteger(0,objName_Descr,OBJPROP_COLOR,clr);   //--- Set the color of the text
      ObjectSetInteger(0,objName_Descr,OBJPROP_FONTSIZE,10); //--- Set the font size of the text

      if (direction > 0) { //--- Check if the swing is a low
         ObjectSetString(0,objName_Descr,OBJPROP_TEXT,"  "+text);            //--- Set the text content
         ObjectSetInteger(0,objName_Descr,OBJPROP_ANCHOR,ANCHOR_LEFT_UPPER); //--- Set the text anchor to left upper
      }
      if (direction < 0) { //--- Check if the swing is a high
         ObjectSetString(0,objName_Descr,OBJPROP_TEXT,"  "+text);            //--- Set the text content
         ObjectSetInteger(0,objName_Descr,OBJPROP_ANCHOR,ANCHOR_LEFT_LOWER); //--- Set the text anchor to left lower
      }
   }
   ChartRedraw(0); //--- Redraw the chart to display the swing point
}
Wir implementieren die Funktion „drawSwingPoint“, um ermittelte hohen und tiefen Umkehrpunkte zu markieren. Mit den Parametern „objName“, „time“, „price“, „arrCode“, „clr“ und „direction“ überprüfen wir die Abwesenheit mit ObjectFind, erstellen einen Pfeil mit ObjectCreate unter Verwendung von OBJ_ARROW und legen Stil, Farbe und Schriftgröße 10 über ObjectSetInteger fest, wobei wir uns an „ANCHOR_TOP“ für Tiefststände oder „ANCHOR_BOTTOM“ für Höchststände orientieren. Wir fügen mit „ObjectCreate“ unter Verwendung von „OBJ_TEXT“ eine „BoS“-Textbeschriftung hinzu und konfigurieren Farbe, Schriftgröße und Anker (ANCHOR_LEFT_UPPER oder ANCHOR_LEFT_LOWER) über „ObjectSetInteger“ und „ObjectSetString“. Wir rufen ChartRedraw auf, um diese Markierungen anzuzeigen und die wichtigsten Schwungpunkte hervorzuheben. Mit dieser Funktion können wir dann die Logik für die Identifizierung der Schwingungspunkte weiter strukturieren.
// bos logic
if (isHaveDailyRange_Prices){ //--- Proceed with BoS logic only if the daily range is calculated
   static bool isNewBar_bos = false;            //--- Initialize flag to indicate a new bar on the BoS timeframe
   int currBars = iBars(_Symbol,timeframe_bos); //--- Get the current number of bars on the BoS timeframe
   static int prevBars = currBars;              //--- Store the previous number of bars for comparison

   if (prevBars == currBars){isNewBar_bos = false;}                          //--- Set flag to false if no new bar has formed
   else if (prevBars != currBars){isNewBar_bos = true; prevBars = currBars;} //--- Set flag to true and update prevBars if a new bar has formed

   const int length = 4;                         //--- Define the number of bars to check for swing high/low (must be > 2)
   int right_index, left_index;                  //--- Declare variables to store indices for bars to the right and left
   int curr_bar = length;                        //--- Set the current bar index for swing analysis
   bool isSwingHigh = true, isSwingLow = true;   //--- Initialize flags to determine if the current bar is a swing high or low
   static double swing_H = -1.0, swing_L = -1.0; //--- Initialize variables to store the latest swing high and low prices

   if (isNewBar_bos){ //--- Check if a new bar has formed on the BoS timeframe
      for (int a=1; a<=length; a++){ //--- Loop through the specified number of bars to check for swings
         right_index = curr_bar - a; //--- Calculate the right-side bar index
         left_index = curr_bar + a;  //--- Calculate the left-side bar index
         if ( (high(curr_bar,timeframe_bos) <= high(right_index,timeframe_bos)) || (high(curr_bar,timeframe_bos) < high(left_index,timeframe_bos)) ){ //--- Check if the current bar's high is not the highest
            isSwingHigh = false; //--- Set flag to false if the bar is not a swing high
         }
         if ( (low(curr_bar,timeframe_bos) >= low(right_index,timeframe_bos)) || (low(curr_bar,timeframe_bos) > low(left_index,timeframe_bos)) ){ //--- Check if the current bar's low is not the lowest
            isSwingLow = false; //--- Set flag to false if the bar is not a swing low
         }
      }

      if (isSwingHigh){ //--- Check if the current bar is a swing high
         swing_H = high(curr_bar,timeframe_bos); //--- Store the swing high price
         Print("WE DO HAVE A SWING HIGH @ BAR INDEX ",curr_bar," H: ",high(curr_bar,timeframe_bos)); //--- Log the swing high details
         drawSwingPoint(TimeToString(time(curr_bar,timeframe_bos)),time(curr_bar,timeframe_bos),high(curr_bar,timeframe_bos),77,clrBlue,-1); //--- Draw a marker for the swing high
      }
      if (isSwingLow){ //--- Check if the current bar is a swing low
         swing_L = low(curr_bar,timeframe_bos); //--- Store the swing low price
         Print("WE DO HAVE A SWING LOW @ BAR INDEX ",curr_bar," L: ",low(curr_bar,timeframe_bos)); //--- Log the swing low details
         drawSwingPoint(TimeToString(time(curr_bar,timeframe_bos)),time(curr_bar,timeframe_bos),low(curr_bar,timeframe_bos),77,clrRed,+1); //--- Draw a marker for the swing low
      }
   }
}
Wenn wir die täglichen Preise haben, d.h. der tägliche Bereich ist bereits definiert, verfolgen wir neue Balken auf dem Break of Structure-Zeitrahmen mit einem statischen „isNewBar_bos“-Flag, indem wir die aktuelle Balkenanzahl von iBars mit _Symbol und „timeframe_bos“ mit einem statischen „prevBars“ vergleichen und „isNewBar_bos“ auf true und „prevBars“ aktualisieren, wenn sich ein neuer Balken bildet.
Wenn „isNewBar_bos“ wahr ist, wird der Balken bei Index „curr_bar“ (auf „length“ = 4 gesetzt) auf Schwankungen untersucht, wobei die Balken „length“ auf beiden Seiten mit „right_index“ und „left_index“ überprüft werden. Wir verwenden die Funktionen „high“ und „low“ mit „timeframe_bos“, um das Hoch und das Tief des aktuellen Balkens mit den benachbarten Balken zu vergleichen und „isSwingHigh“ oder „isSwingLow“ auf false zu setzen, wenn es sich nicht um den höchsten oder niedrigsten Wert handelt.
Wenn „isSwingHigh“, speichern wir den Preis in „swing_H“, protokollieren ihn mit „Print“, und rufen „drawSwingPoint“ mit „TimeToString“ auf, der Zeit des Balkens, dem Preis, dem Pfeilcode 77, „clrBlue“ und -1; wenn „isSwingLow“, aktualisieren wir „swing_L“, protokollieren und rufen „drawSwingPoint“ mit „clrRed“ und +1 auf. Nach der Kompilierung erhalten wir folgendes Ergebnis.
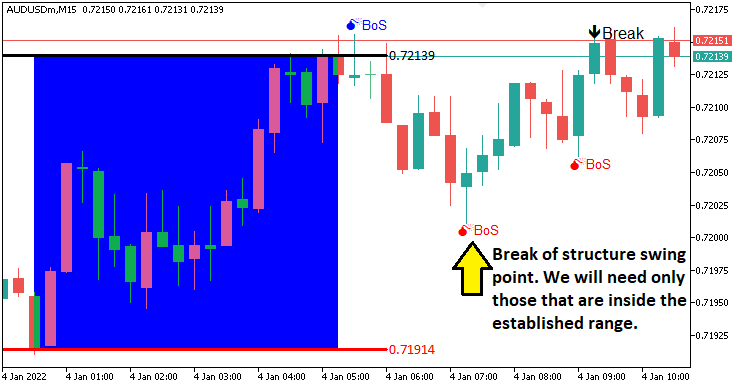
Auf dem Bild können Sie sehen, dass wir die Umkehrpunkte einzeichnen. Als Nächstes müssen wir den Bruch der Umkehrpunkte verfolgen, was eine Strukturverschiebung und somit einen Strukturbruch bedeutet. Um diese wieder zu visualisieren, benötigen wir eine nutzerdefinierte Funktion wie folgt.
//+------------------------------------------------------------------+
//| Function to draw a break level line                              |
//+------------------------------------------------------------------+
void drawBreakLevel(string objName,datetime time1,double price1,
   datetime time2,double price2,color clr,int direction){ //--- Define a function to draw a break level line
   if (ObjectFind(0,objName) < 0){ //--- Check if the break level object does not already exist
      ObjectCreate(0,objName,OBJ_ARROWED_LINE,0,time1,price1,time2,price2); //--- Create an arrowed line object
      ObjectSetInteger(0,objName,OBJPROP_TIME,0,time1);                     //--- Set the first time coordinate of the line
      ObjectSetDouble(0,objName,OBJPROP_PRICE,0,price1);                    //--- Set the first price coordinate of the line
      ObjectSetInteger(0,objName,OBJPROP_TIME,1,time2);                     //--- Set the second time coordinate of the line
      ObjectSetDouble(0,objName,OBJPROP_PRICE,1,price2);                    //--- Set the second price coordinate of the line

      ObjectSetInteger(0,objName,OBJPROP_COLOR,clr); //--- Set the color of the line
      ObjectSetInteger(0,objName,OBJPROP_WIDTH,2);   //--- Set the width of the line

      string text = "Break";                 //--- Define the text label for the break
      string objName_Descr = objName + text; //--- Create a unique name for the text object
      ObjectCreate(0,objName_Descr,OBJ_TEXT,0,time2,price2); //--- Create a text object at the line's end
      ObjectSetInteger(0,objName_Descr,OBJPROP_COLOR,clr);   //--- Set the color of the text
      ObjectSetInteger(0,objName_Descr,OBJPROP_FONTSIZE,10); //--- Set the font size of the text

      if (direction > 0) { //--- Check if the break is upward
         ObjectSetString(0,objName_Descr,OBJPROP_TEXT,text+"  ");             //--- Set the text content
         ObjectSetInteger(0,objName_Descr,OBJPROP_ANCHOR,ANCHOR_RIGHT_UPPER); //--- Set the text anchor to right upper
      }
      if (direction < 0) { //--- Check if the break is downward
         ObjectSetString(0,objName_Descr,OBJPROP_TEXT,text+"  ");             //--- Set the text content
         ObjectSetInteger(0,objName_Descr,OBJPROP_ANCHOR,ANCHOR_RIGHT_LOWER); //--- Set the text anchor to right lower
      }
   }
   ChartRedraw(0); //--- Redraw the chart to display the break level
}
Wir definieren einfach die Funktion „drawBreakLevel“, um den Bruch der Struktur zu visualisieren. Wir verwenden für die Visualisierung eine ähnliche Logik wie bei den vorherigen Visualisierungsfunktionen, sodass wir nicht viel Zeit darauf verwenden werden, zu erklären, was alles passiert. Wir werden diese Funktion verwenden, um die Ebenen zu visualisieren.
double Ask = NormalizeDouble(SymbolInfoDouble(_Symbol,SYMBOL_ASK),_Digits); //--- Get and normalize the current Ask price
double Bid = NormalizeDouble(SymbolInfoDouble(_Symbol,SYMBOL_BID),_Digits); //--- Get and normalize the current Bid price

if (swing_H > 0 && Ask > swing_H){ //--- Check if the Ask price breaks above the swing high
   Print("$$$$$$$$$ BUY SIGNAL NOW. BREAK OF SWING HIGH"); //--- Log a buy signal due to swing high breakout
   int swing_H_index = 0;                //--- Initialize the index of the swing high bar
   for (int i=0; i<=length*2+1000; i++){ //--- Loop through bars to find the swing high
      double high_sel = high(i,timeframe_bos); //--- Get the high price of the i-th bar
      if (high_sel == swing_H){ //--- Check if the high matches the swing high
         swing_H_index = i;     //--- Store the bar index
         Print("BREAK HIGH FOUND @ BAR INDEX ",swing_H_index); //--- Log the swing high bar index
         break;                 //--- Exit the loop once found
      }
   }
   drawBreakLevel(TimeToString(time(0,timeframe_bos)),time(swing_H_index,timeframe_bos),high(swing_H_index,timeframe_bos),
   time(0,timeframe_bos),high(swing_H_index,timeframe_bos),clrBlue,-1); //--- Draw a line to mark the swing high breakout

   if (isTakenTrade == false){                                     //--- Check if no trade is taken yet
      obj_Trade.Buy(0.01,_Symbol,Ask,minimum_price,maximum_price); //--- Execute a buy trade with 0.01 lots, using minimum price as SL and maximum as TP
      isTakenTrade = true;                                         //--- Set the flag to indicate a trade is taken
   }

   swing_H = -1.0; //--- Reset the swing high price
   return;         //--- Exit the OnTick function to avoid further processing
}
if (swing_L > 0 && Bid < swing_L){ //--- Check if the Bid price breaks below the swing low
   Print("$$$$$$$$$ SELL SIGNAL NOW. BREAK OF SWING LOW"); //--- Log a sell signal due to swing low breakout
   int swing_L_index = 0; //--- Initialize the index of the swing low bar
   for (int i=0; i<=length*2+1000; i++){ //--- Loop through bars to find the swing low
      double low_sel = low(i,timeframe_bos); //--- Get the low price of the i-th bar
      if (low_sel == swing_L){ //--- Check if the low matches the swing low
         swing_L_index = i;    //--- Store the bar index
         Print("BREAK LOW FOUND @ BAR INDEX ",swing_L_index); //--- Log the swing low bar index
         break;                //--- Exit the loop once found
      }
   }
   drawBreakLevel(TimeToString(time(0,timeframe_bos)),time(swing_L_index,timeframe_bos),low(swing_L_index,timeframe_bos),
   time(0,timeframe_bos),low(swing_L_index,timeframe_bos),clrRed,+1); //--- Draw a line to mark the swing low breakout

   if (isTakenTrade == false){ //--- Check if no trade is taken yet
      obj_Trade.Sell(0.01,_Symbol,Bid,maximum_price,minimum_price); //--- Execute a sell trade with 0.01 lots, using maximum price as SL and minimum as TP
      isTakenTrade = true;                                          //--- Set the flag to indicate a trade is taken
   }

   swing_L = -1.0; //--- Reset the swing low price
   return;         //--- Exit the OnTick function to avoid further processing
}
Hier implementieren wir eine Handelsausführungslogik, wenn wir einen gültigen Ausbruch haben. Wir erhalten normalisierte „Ask“- und „Bid“-Preise mit SymbolInfoDouble und NormalizeDouble mit _Symbol und _Digits.
Wenn „swing_H“ positiv ist und „Ask“ „swing_H“ übersteigt, protokollieren wir mit „Print“, finden den Index des hohen Umkehrpunkts mit „high“ und „timeframe_bos“, markieren ihn mit „drawBreakLevel“ unter Verwendung von TimeToString und „time“, und rufen „obj_Trade.Buy“ mit 0,01 Lots, „minimum_price“ stop-loss und „maximum_price“ take-profit, wenn „isTakenTrade“ false ist, true setzen und „swing_H“ zurücksetzen.
Wenn „swing_L“ positiv ist und „Bid“ unter „swing_L“ fällt, protokollieren wir, finden den Index des tiefen Umkehrpunkts mit „low“, markieren mit „drawBreakLevel“ und rufen „obj_Trade.Sell“ auf, wobei „swing_L“ zurückgesetzt wird. Wir beenden mit „return“ nach jedem Handelsgeschäft für einen präzisen Handel des Break of Structure. Hier ist das Ergebnis.
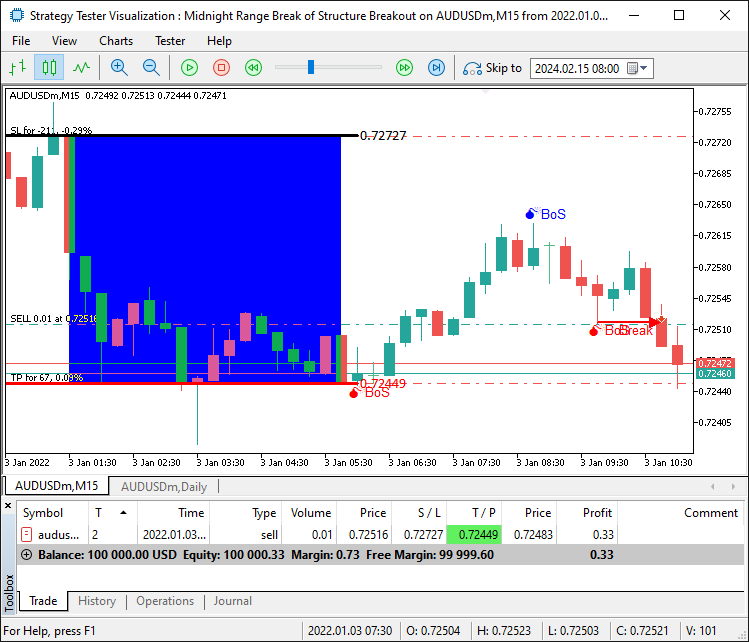
Wir sind nun in der Lage, den Handel für die bestätigten Setups zu eröffnen. Was ist jedoch, wenn es zu einem Ausbruch kommt, der jedoch nicht innerhalb der Spanne liegt? Das heißt, dass der Preis sich von den Bereichsgrenzen nach oben oder unten bewegt. Wir müssen abwarten, bis der Kurs wieder innerhalb der Spanne liegt, damit wir den Bruch als gültig betrachten können. Um dies zu erreichen, müssen wir die Höchst- und Tiefstpreise der Spanne ermitteln und sie für eine strengere Beschränkung hinzufügen, um falsche Signale zu vermeiden.
if (swing_H > 0 && Ask > swing_H && swing_H <= maximum_price && swing_H >= minimum_price){ //--- Check if the Ask price breaks above the swing high within the range
   Print("$$$$$$$$$ BUY SIGNAL NOW. BREAK OF SWING HIGH WITHIN RANGE"); //--- Log a buy signal due to swing high breakout
   int swing_H_index = 0;                                               //--- Initialize the index of the swing high bar
   for (int i=0; i<=length*2+1000; i++){                                //--- Loop through bars to find the swing high
      double high_sel = high(i,timeframe_bos); //--- Get the high price of the i-th bar
      if (high_sel == swing_H){                //--- Check if the high matches the swing high
         swing_H_index = i; //--- Store the bar index
         Print("BREAK HIGH FOUND @ BAR INDEX ",swing_H_index); //--- Log the swing high bar index
         break;             //--- Exit the loop once found
      }
   }
   drawBreakLevel(TimeToString(time(0,timeframe_bos)),time(swing_H_index,timeframe_bos),high(swing_H_index,timeframe_bos),
   time(0,timeframe_bos),high(swing_H_index,timeframe_bos),clrBlue,-1); //--- Draw a line to mark the swing high breakout

   if (isTakenTrade == false){ //--- Check if no trade is taken yet
      obj_Trade.Buy(0.01,_Symbol,Ask,minimum_price,maximum_price); //--- Execute a buy trade with 0.01 lots, using minimum price as SL and maximum as TP
      isTakenTrade = true;                                         //--- Set the flag to indicate a trade is taken
   }

   swing_H = -1.0; //--- Reset the swing high price
   return;         //--- Exit the OnTick function to avoid further processing
}
if (swing_L > 0 && Bid < swing_L && swing_L <= maximum_price && swing_L >= minimum_price){ //--- Check if the Bid price breaks below the swing low within the range
   Print("$$$$$$$$$ SELL SIGNAL NOW. BREAK OF SWING LOW WITHIN RANGE"); //--- Log a sell signal due to swing low breakout
   int swing_L_index = 0;                //--- Initialize the index of the swing low bar
   for (int i=0; i<=length*2+1000; i++){ //--- Loop through bars to find the swing low
      double low_sel = low(i,timeframe_bos); //--- Get the low price of the i-th bar
      if (low_sel == swing_L){ //--- Check if the low matches the swing low
         swing_L_index = i;    //--- Store the bar index
         Print("BREAK LOW FOUND @ BAR INDEX ",swing_L_index); //--- Log the swing low bar index
         break;                //--- Exit the loop once found
      }
   }
   drawBreakLevel(TimeToString(time(0,timeframe_bos)),time(swing_L_index,timeframe_bos),low(swing_L_index,timeframe_bos),
   time(0,timeframe_bos),low(swing_L_index,timeframe_bos),clrRed,+1); //--- Draw a line to mark the swing low breakout

   if (isTakenTrade == false){ //--- Check if no trade is taken yet
      obj_Trade.Sell(0.01,_Symbol,Bid,maximum_price,minimum_price); //--- Execute a sell trade with 0.01 lots, using maximum price as SL and maximum as TP
      isTakenTrade = true;                                          //--- Set the flag to indicate a trade is taken
   }

   swing_L = -1.0; //--- Reset the swing low price
   return;         //--- Exit the OnTick function to avoid further processing
}
Es ist in Ordnung, wenn wir falsche Signale ausschließen, und wir können sehen, dass wir bei einem bestätigten Setup Handelsgeschäfte eröffnen können und somit unser Ziel erreichen, das Strategie-Setup zu identifizieren, zu visualisieren und zu handeln. Bleiben nur noch die Backtests des Programms, und das wird im nächsten Abschnitt behandelt.
Backtests
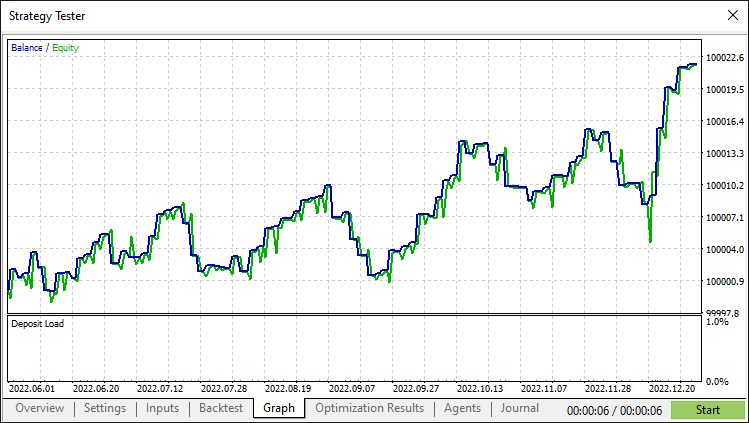
Nach einem gründlichen Backtest haben wir folgende Ergebnisse.
Backtest-Grafik:
Bericht des Backtest:
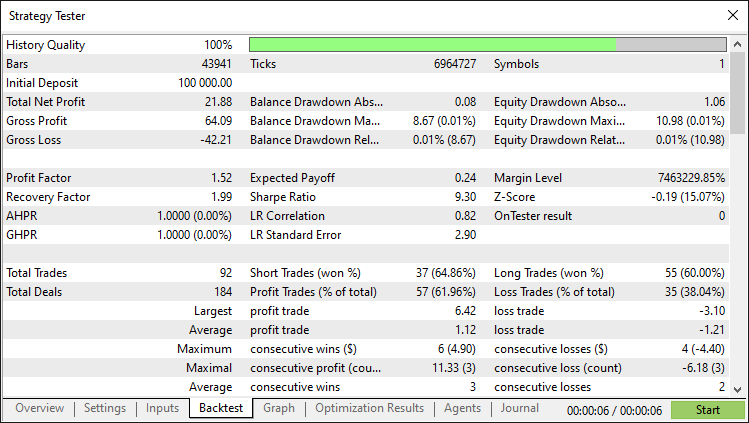
Schlussfolgerung
Abschließend haben wir einen MQL5 Expert Advisor entwickelt, der den Midnight Range Breakout mit der Strategie Break of Structure automatisiert und Ausbrüche innerhalb der Midnight Range handelt, die durch die Umkehrpunkte des aktuellen Tages bestätigt werden. Mit der präzisen Bereichserkennung und Visualisierung können Sie das System weiter ausbauen und weitere Strategien definieren, um es robuster zu machen und auf Ihren Handelsstil abzustimmen.
Haftungsausschluss: Dieser Artikel ist nur für Bildungszwecke gedacht. Der Handel ist mit erheblichen finanziellen Risiken verbunden, und die Volatilität der Märkte kann zu Verlusten führen. Umfassende Backtests und ein umsichtiges Risikomanagement sind unabdingbar, bevor Sie diesen Expert Advisor an den Live-Märkten einsetzen.
Wenn Sie diese Techniken beherrschen, können Sie Ihre Fähigkeiten im algorithmischen Handel verbessern und die Märkte mit größerem Vertrauen angehen. Viel Glück auf Ihrer Handelsreise!
Übersetzt aus dem Englischen von MetaQuotes Ltd.
Originalartikel: https://www.mql5.com/en/articles/17876
Warnung: Alle Rechte sind von MetaQuotes Ltd. vorbehalten. Kopieren oder Vervielfältigen untersagt.
Dieser Artikel wurde von einem Nutzer der Website verfasst und gibt dessen persönliche Meinung wieder. MetaQuotes Ltd übernimmt keine Verantwortung für die Richtigkeit der dargestellten Informationen oder für Folgen, die sich aus der Anwendung der beschriebenen Lösungen, Strategien oder Empfehlungen ergeben.
 Dekodierung von Intraday-Handelsstrategien des Opening Range Breakout
 Erstellen eines Handelsadministrator-Panels in MQL5 (Teil X): Externe, ressourcenbasierte Schnittstelle
 Erstellen von dynamischen MQL5-Grafikschnittstellen durch ressourcengesteuerte Bildskalierung mit bikubischer Interpolation auf Handelscharts
 Integration des AI-Modells in eine bereits bestehende MQL5-Handelsstrategie
- Freie Handelsapplikationen
- Über 8.000 Signale zum Kopieren
- Wirtschaftsnachrichten für die Lage an den Finanzmärkte
Sie stimmen der Website-Richtlinie und den Nutzungsbedingungen zu.
Hallo Allan.
Ich werde Ihr System herunterladen und mit dem Testen beginnen. Interessanterweise gibt der Bericht des Strategietesters weder das Handelspaar noch den Zeitrahmen an. Da Sie den AUUSD M15 illustriert haben, nehme ich an, dass Sie diesen verwendet haben und ich mit dem Testen beginnen werde. Haben Sie ein Gefühl für die Verwendung anderer Paare oder Zeitrahmen. Ich vermute, dass dieses Ea besser auf asiatischen Handelspaaren funktionieren könnte, liege ich richtig?
Vielen Dank, CapeCoddah
Die Tests waren ein Reinfall: Ich habe AUDUSD, AUDJPY und USDJPY ausprobiert und alle haben Verluste mit Sharpe Ratios von -3,00 bis -5,00 produziert. Alle außer USDJPY fielen sofort ins Minus und erholten sich nie wieder. USDJPY hatte 2 Perioden mit positiven Gewinnen, drehte aber schließlich ins Minus und kam nie wieder zurück.
Adios
Ausgezeichnete Arbeit. Danke, Allan!
Sicher. Willkommen. Danke für das freundliche Feedback.
Danke, Allan! Du bist der Beste