
Automating Trading Strategies in MQL5 (Part 16): Midnight Range Breakout with Break of Structure (BoS) Price Action
Introduction
In our previous article (Part 15), we automated a trading strategy leveraging the Cypher harmonic pattern to capture market reversals. Now, in Part 16, we focus on automating the Midnight Range Breakout with Break of Structure strategy in MetaQuotes Language 5 (MQL5), developing an Expert Advisor that identifies the midnight to 6 AM price range, detects Break of Structure (BoS), and executes trades. We will cover the following topics:
- Understanding the Midnight Range Breakout with Break of Structure Strategy
- Implementation in MQL5
- Backtesting
- Conclusion
By the end of this article, you will have a fully functional MQL5 program that visualizes key price levels, confirms breakouts, and executes trades with defined risk parameters—let us begin!
Understanding the Midnight Range Breakout with Break of Structure Strategy
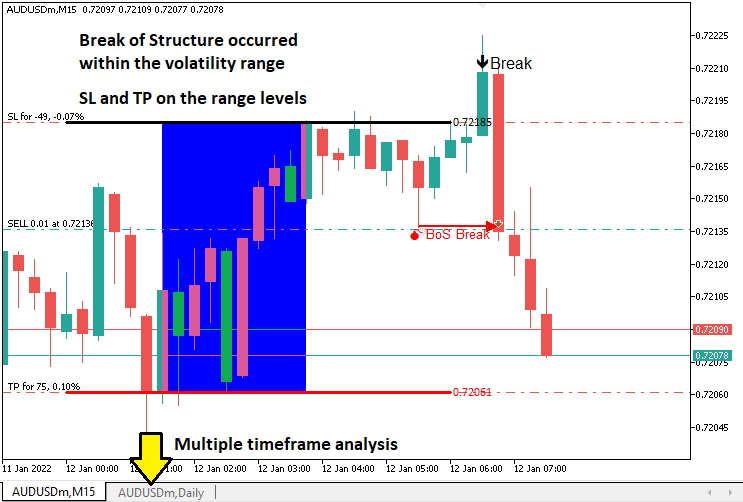
The Midnight Range Breakout with Break of Structure strategy capitalizes on the low-volatility price range formed between midnight and 6 AM, using the highest and lowest prices as breakout levels, while requiring Break of Structure confirmation to validate trade signals. Break of Structure identifies trend shifts by detecting when the price surpasses a swing high (bullish) or falls below a swing low (bearish), filtering out false breakouts and aligning trades with market momentum. This approach suits markets during session transitions, such as London’s opening, or any other of your liking. Still, it requires timezone alignment and caution during high-impact news events to avoid whipsaws.
Our implementation plan will involve creating an MQL5 Expert Advisor to automate the strategy by calculating the midnight to 6 AM range, monitoring for breakouts within a set time window, and confirming them with Break of Structure on a specified timeframe, usually 5, 10, or 15 minutes, so we will have this in input so the user can choose dynamically. The system will execute trades with stop-loss and take-profit levels derived from the range, visualize key levels on the chart for clarity, and ensure robust risk management to maintain consistent performance across market conditions. In a nutshell, this is what we mean.
Implementation in MQL5
To create the program in MQL5, open the MetaEditor, go to the Navigator, locate the Indicators folder, click on the "New" tab, and follow the prompts to create the file. Once it is made, in the coding environment, we will need to declare some global variables that we will use throughout the program.
//+------------------------------------------------------------------+
//|                   Midnight Range Break of Structure Breakout.mq5 |
//|                           Copyright 2025, Allan Munene Mutiiria. |
//|                                   https://t.me/Forex_Algo_Trader |
//+------------------------------------------------------------------+
#property copyright "Copyright 2025, Allan Munene Mutiiria."
#property link      "https://t.me/Forex_Algo_Trader"
#property version   "1.00"

#include <Trade/Trade.mqh> //--- Include the Trade library for handling trade operations
CTrade obj_Trade;          //--- Create an instance of the CTrade class for trade execution

double maximum_price = -DBL_MAX;      //--- Initialize the maximum price variable to negative infinity
double minimum_price = DBL_MAX;       //--- Initialize the minimum price variable to positive infinity
datetime maximum_time, minimum_time;  //--- Declare variables to store the times of maximum and minimum prices
bool isHaveDailyRange_Prices = false; //--- Initialize flag to indicate if daily range prices are calculated
bool isHaveRangeBreak = false;        //--- Initialize flag to indicate if a range breakout has occurred
bool isTakenTrade = false;            //--- Initialize flag to indicate if a trade is taken for the current day

#define RECTANGLE_PREFIX "RANGE RECTANGLE " //--- Define a prefix for rectangle object names
#define UPPER_LINE_PREFIX "UPPER LINE "     //--- Define a prefix for upper line object names
#define LOWER_LINE_PREFIX "LOWER LINE "     //--- Define a prefix for lower line object names

// bos
input ENUM_TIMEFRAMES timeframe_bos = PERIOD_M5; // Input the timeframe for Break of Structure (BoS) analysis
Here, we begin implementing the strategy by setting up the foundational components of the program. We include the <Trade/Trade.mqh> library to enable trade operations and instantiate the "CTrade" class as the "obj_Trade" object, which will handle trade execution, such as opening buy or sell positions with specified parameters.
We define several global variables to track critical data for the strategy. The "maximum_price" and "minimum_price" variables, initialized to -DBL_MAX and DBL_MAX respectively, store the highest and lowest prices within the midnight to 6 AM range, allowing us to identify the range boundaries. The "maximum_time" and "minimum_time" variables, of type datetime, record the times when these extreme prices occur, which is essential for visualizing the range on the chart. We also use boolean flags: "isHaveDailyRange_Prices" to indicate whether the daily range has been calculated, "isHaveRangeBreak" to track if a breakout has occurred, and "isTakenTrade" to ensure only one trade is taken per day, preventing overtrading.
To facilitate chart visualization, we define constants for object naming: "RECTANGLE_PREFIX" as "RANGE RECTANGLE ", "UPPER_LINE_PREFIX" as "UPPER LINE ", and "LOWER_LINE_PREFIX" as "LOWER LINE ". These prefixes ensure unique names for chart objects like rectangles and lines, which will mark the range and breakout levels, making the strategy’s actions visually clear. Additionally, we introduce a user input parameter, "timeframe_bos", set to PERIOD_M5 by default, allowing traders to specify the timeframe for Break of Structure analysis, such as the 5-minute chart, to detect swing highs and lows. With that, we are all set. What need to do is define two functions to enable us to control trading instances between new days and new bars.
//+------------------------------------------------------------------+
//| Function to check for a new bar                                  |
//+------------------------------------------------------------------+
bool isNewBar(){ //--- Define a function to detect a new bar on the current timeframe
   static int prevBars = 0;                //--- Store the previous number of bars
   int currBars = iBars(_Symbol,_Period);  //--- Get the current number of bars
   if (prevBars==currBars) return (false); //--- Return false if no new bar has formed
   prevBars = currBars;                    //--- Update the previous bar count
   return (true);                          //--- Return true if a new bar has formed
}

//+------------------------------------------------------------------+
//| Function to check for a new day                                  |
//+------------------------------------------------------------------+
bool isNewDay(){ //--- Define a function to detect a new trading day
   bool newDay = false;  //--- Initialize the new day flag

   MqlDateTime Str_DateTime;                 //--- Declare a structure to hold date and time information
   TimeToStruct(TimeCurrent(),Str_DateTime); //--- Convert the current time to the structure

   static int prevDay = 0;         //--- Store the previous day's date
   int currDay = Str_DateTime.day; //--- Get the current day's date

   if (prevDay == currDay){ //--- Check if the current day is the same as the previous day
      newDay = false;       //--- Set the flag to false (no new day)
   }
   else if (prevDay != currDay){ //--- Check if a new day has started
      Print("WE HAVE A NEW DAY WITH DATE ",currDay); //--- Log the new day
      prevDay = currDay;                             //--- Update the previous day
      newDay = true;                                 //--- Set the flag to true (new day)
   }

   return (newDay); //--- Return the new day status
}
Here, we implement the "isNewBar" and "isNewDay" functions to synchronize our Midnight Range Breakout with the Break of Structure strategy in MQL5 with market timing. In "isNewBar", we track bar counts using a static "prevBars" and the iBars function with _Symbol and _Period, returning true when a new bar forms to trigger price updates. In "isNewDay", we use a MqlDateTime structure, the TimeToStruct function with TimeCurrent, and a static "prevDay" to detect new days, resetting range calculations when "currDay" changes, logging via Print. Armed with these functions, we can define the logic directly in the OnTick event handler.
//+------------------------------------------------------------------+
//| Expert tick function                                             |
//+------------------------------------------------------------------+
void OnTick(){
   //---
   static datetime midnight = iTime(_Symbol,PERIOD_D1,0);            //--- Store the current day's midnight time
   static datetime sixAM = midnight + 6 * 3600;                      //--- Calculate 6 AM time by adding 6 hours to midnight
   static datetime scanBarTime = sixAM + 1 * PeriodSeconds(_Period); //--- Set the time of the next bar after 6 AM for scanning
   static double midnight_price = iClose(_Symbol,PERIOD_D1,0);       //--- Store the closing price at midnight

   static datetime validBreakTime_start = scanBarTime;               //--- Set the start time for valid breakout detection
   static datetime validBreakTime_end = midnight + (6+5) * 3600;     //--- Set the end time for valid breakouts to 11 AM

   if (isNewDay()){ //--- Check if a new trading day has started
      midnight = iTime(_Symbol,PERIOD_D1,0);                          //--- Update midnight time for the new day
      sixAM = midnight + 6 * 3600;                                    //--- Recalculate 6 AM time for the new day
      scanBarTime = sixAM + 1 * PeriodSeconds(_Period);               //--- Update the scan bar time to the next bar after 6 AM
      midnight_price = iClose(_Symbol,PERIOD_D1,0);                   //--- Update the midnight closing price
      Print("Midnight price = ",midnight_price,", Time = ",midnight); //--- Log the midnight price and time

      validBreakTime_start = scanBarTime;           //--- Reset the start time for valid breakouts
      validBreakTime_end = midnight + (6+5) * 3600; //--- Reset the end time for valid breakouts to 11 AM

      maximum_price = -DBL_MAX; //--- Reset the maximum price to negative infinity
      minimum_price = DBL_MAX;  //--- Reset the minimum price to positive infinity

      isHaveDailyRange_Prices = false; //--- Reset the flag indicating daily range calculation
      isHaveRangeBreak = false;        //--- Reset the flag indicating a range breakout
      isTakenTrade = false;            //--- Reset the flag indicating a trade is taken
   }
}
Here, we develop the core logic of our strategy within the OnTick function, the main event handler in our program that executes on every price tick. We initialize static variables to track critical timings: "midnight" stores the current day’s start time using the iTime function with _Symbol, PERIOD_D1, and index 0; "sixAM" is calculated by adding 6 hours (21,600 seconds) to "midnight"; "scanBarTime" sets the time of the next bar after 6 AM using the PeriodSeconds function with "_Period"; and "midnight_price" captures the day’s closing price at midnight via the iClose function. We also define "validBreakTime_start" as "scanBarTime" and "validBreakTime_end" as 11 AM (midnight plus 11 hours) to establish a time window for valid breakouts.
When a new trading day begins, detected by our "isNewDay" function, we update these timing variables to reflect the new day’s data, ensuring our range calculations remain current. We reset "midnight", "sixAM", "scanBarTime", and "midnight_price" using the same iTime and iClose functions, and log the midnight details with the Print function for debugging. We also reset "validBreakTime_start" and "validBreakTime_end" for the new breakout window, and reinitialized "maximum_price" to "-DBL_MAX", "minimum_price" to "DBL_MAX", and the flags "isHaveDailyRange_Prices", "isHaveRangeBreak", and "isTakenTrade" to false, preparing the EA to calculate fresh midnight to 6 AM range and monitor for new breakouts. We can now check the calculation of the time ranges.
if (isNewBar()){ //--- Check if a new bar has formed on the current timeframe
   datetime currentBarTime = iTime(_Symbol,_Period,0); //--- Get the time of the current bar

   if (currentBarTime == scanBarTime && !isHaveDailyRange_Prices){              //--- Check if it's time to scan for daily range and range is not yet calculated
      Print("WE HAVE ENOUGH BARS DATA FOR DOCUMENTATION. MAKE THE EXTRACTION"); //--- Log that the scan for daily range is starting
      int total_bars = int((sixAM - midnight)/PeriodSeconds(_Period))+1;        //--- Calculate the number of bars from midnight to 6 AM
      Print("Total Bars for scan = ",total_bars);                               //--- Log the total number of bars to scan
      int highest_price_bar_index = -1;                                         //--- Initialize the index of the bar with the highest price
      int lowest_price_bar_index = -1;                                          //--- Initialize the index of the bar with the lowest price

      for (int i=1; i<=total_bars ; i++){ //--- Loop through each bar from midnight to 6 AM
         double open_i = open(i);   //--- Get the open price of the i-th bar
         double close_i = close(i); //--- Get the close price of the i-th bar

         double highest_price_i = (open_i > close_i) ? open_i : close_i; //--- Determine the highest price (open or close) of the bar
         double lowest_price_i = (open_i < close_i) ? open_i : close_i;  //--- Determine the lowest price (open or close) of the bar

         if (highest_price_i > maximum_price){ //--- Check if the bar's highest price exceeds the current maximum
            maximum_price = highest_price_i;   //--- Update the maximum price
            highest_price_bar_index = i;       //--- Store the bar index of the maximum price
            maximum_time = time(i);            //--- Store the time of the maximum price
         }
         if (lowest_price_i < minimum_price){ //--- Check if the bar's lowest price is below the current minimum
            minimum_price = lowest_price_i; //--- Update the minimum price
            lowest_price_bar_index = i;     //--- Store the bar index of the minimum price
            minimum_time = time(i);         //--- Store the time of the minimum price
         }
      }
      Print("Maximum Price = ",maximum_price,", Bar index = ",highest_price_bar_index,", Time = ",maximum_time); //--- Log the maximum price, its bar index, and time
      Print("Minimum Price = ",minimum_price,", Bar index = ",lowest_price_bar_index,", Time = ",minimum_time);  //--- Log the minimum price, its bar index, and time

      isHaveDailyRange_Prices = true; //--- Set the flag to indicate that the daily range is calculated
   }
}
To calculate the midnight to 6 AM price range when a new bar forms, we use the "isNewBar" function to check for a new bar, then retrieve the bar’s time with iTime for _Symbol, _Period, index 0, storing it in "currentBarTime". If "currentBarTime" equals "scanBarTime" and "isHaveDailyRange_Prices" is false, we log the range scan starting with Print, compute "total_bars" using PeriodSeconds for _Period, and loop through bars to find the highest and lowest prices with "open" and "close" functions, updating "maximum_price", "minimum_price", "maximum_time", "minimum_time", and their indices. We log results and set "isHaveDailyRange_Prices" to true, enabling breakout monitoring.
For simplicity, we used predefined functions to get the prices and they are as follows.
//+------------------------------------------------------------------+
//| Helper functions for price and time data                         |
//+------------------------------------------------------------------+
double open(int index){return (iOpen(_Symbol,_Period,index));}   //--- Return the open price of the specified bar index on the current timeframe
double high(int index){return (iHigh(_Symbol,_Period,index));}   //--- Return the high price of the specified bar index on the current timeframe
double low(int index){return (iLow(_Symbol,_Period,index));}     //--- Return the low price of the specified bar index on the current timeframe
double close(int index){return (iClose(_Symbol,_Period,index));} //--- Return the close price of the specified bar index on the current timeframe
datetime time(int index){return (iTime(_Symbol,_Period,index));} //--- Return the time of the specified bar index on the current timeframe

double high(int index,ENUM_TIMEFRAMES tf_bos){return (iHigh(_Symbol,tf_bos,index));}   //--- Return the high price of the specified bar index on the BoS timeframe
double low(int index,ENUM_TIMEFRAMES tf_bos){return (iLow(_Symbol,tf_bos,index));}     //--- Return the low price of the specified bar index on the BoS timeframe
datetime time(int index,ENUM_TIMEFRAMES tf_bos){return (iTime(_Symbol,tf_bos,index));} //--- Return the time of the specified bar index on the BoS timeframe
We implement helper functions to efficiently retrieve price and time data by defining the "open", "high", "low", "close", and "time" functions, each taking an "index" parameter, to fetch data for the current timeframe using iOpen, "iHigh", "iLow", "iClose", and iTime respectively, with "_Symbol" and _Period as inputs, returning the corresponding open price, high price, low price, close price, or bar time for the specified bar index.
Additionally, we overload the "high", "low", and "time" functions to accept an ENUM_TIMEFRAMES "tf_bos" parameter, enabling us to retrieve the high price, low price, or bar time for the Break of Structure timeframe using "iHigh", "iLow", and "iTime" with _Symbol and "tf_bos". Since we did define the range, let us visualize it on the chart. For that, we will need to define some extra helper functions too.
//+------------------------------------------------------------------+
//| Function to create a rectangle object                            |
//+------------------------------------------------------------------+
void create_Rectangle(string objName,datetime time1,double price1,
               datetime time2,double price2,color clr){ //--- Define a function to draw a rectangle on the chart
   if (ObjectFind(0,objName) < 0){                                       //--- Check if the rectangle object does not already exist
      ObjectCreate(0,objName,OBJ_RECTANGLE,0,time1,price1,time2,price2); //--- Create a rectangle object with specified coordinates

      ObjectSetInteger(0,objName,OBJPROP_TIME,0,time1);  //--- Set the first time coordinate of the rectangle
      ObjectSetDouble(0,objName,OBJPROP_PRICE,0,price1); //--- Set the first price coordinate of the rectangle
      ObjectSetInteger(0,objName,OBJPROP_TIME,1,time2);  //--- Set the second time coordinate of the rectangle
      ObjectSetDouble(0,objName,OBJPROP_PRICE,1,price2); //--- Set the second price coordinate of the rectangle
      ObjectSetInteger(0,objName,OBJPROP_FILL,true);     //--- Enable filling the rectangle with color
      ObjectSetInteger(0,objName,OBJPROP_COLOR,clr);     //--- Set the color of the rectangle
      ObjectSetInteger(0,objName,OBJPROP_BACK,false);    //--- Ensure the rectangle is drawn in the foreground

      ChartRedraw(0); //--- Redraw the chart to display the rectangle
   }
}

//+------------------------------------------------------------------+
//| Function to create a line object with text                       |
//+------------------------------------------------------------------+
void create_Line(string objName,datetime time1,double price1,
               datetime time2,double price2,int width,color clr,string text){ //--- Define a function to draw a trend line with text
   if (ObjectFind(0,objName) < 0){                                   //--- Check if the line object does not already exist
      ObjectCreate(0,objName,OBJ_TREND,0,time1,price1,time2,price2); //--- Create a trend line object with specified coordinates

      ObjectSetInteger(0,objName,OBJPROP_TIME,0,time1);  //--- Set the first time coordinate of the line
      ObjectSetDouble(0,objName,OBJPROP_PRICE,0,price1); //--- Set the first price coordinate of the line
      ObjectSetInteger(0,objName,OBJPROP_TIME,1,time2);  //--- Set the second time coordinate of the line
      ObjectSetDouble(0,objName,OBJPROP_PRICE,1,price2); //--- Set the second price coordinate of the line
      ObjectSetInteger(0,objName,OBJPROP_WIDTH,width);   //--- Set the width of the line
      ObjectSetInteger(0,objName,OBJPROP_COLOR,clr);     //--- Set the color of the line
      ObjectSetInteger(0,objName,OBJPROP_BACK,false);    //--- Ensure the line is drawn in the foreground

      long scale = 0; //--- Initialize a variable to store the chart scale
      if(!ChartGetInteger(0,CHART_SCALE,0,scale)){                                   //--- Attempt to get the chart scale
         Print("UNABLE TO GET THE CHART SCALE. DEFAULT OF ",scale," IS CONSIDERED"); //--- Log if the chart scale cannot be retrieved
      }

      int fontsize = 11; //--- Set the default font size for the text
      if (scale==0){fontsize=5;} //--- Adjust font size for minimized chart scale
      else if (scale==1){fontsize=6;}  //--- Adjust font size for scale 1
      else if (scale==2){fontsize=7;}  //--- Adjust font size for scale 2
      else if (scale==3){fontsize=9;}  //--- Adjust font size for scale 3
      else if (scale==4){fontsize=11;} //--- Adjust font size for scale 4
      else if (scale==5){fontsize=13;} //--- Adjust font size for maximized chart scale

      string txt = " Right Price";         //--- Define the text suffix for the price label
      string objNameDescr = objName + txt; //--- Create a unique name for the text object
      ObjectCreate(0,objNameDescr,OBJ_TEXT,0,time2,price2);        //--- Create a text object at the line's end
      ObjectSetInteger(0,objNameDescr,OBJPROP_COLOR,clr);          //--- Set the color of the text
      ObjectSetInteger(0,objNameDescr,OBJPROP_FONTSIZE,fontsize);  //--- Set the font size of the text
      ObjectSetInteger(0,objNameDescr,OBJPROP_ANCHOR,ANCHOR_LEFT); //--- Set the text anchor to the left
      ObjectSetString(0,objNameDescr,OBJPROP_TEXT," "+text);       //--- Set the text content (price value)
      ObjectSetString(0,objNameDescr,OBJPROP_FONT,"Calibri");      //--- Set the font type to Calibri

      ChartRedraw(0); //--- Redraw the chart to display the line and text
   }
}
To visualize the range, we define two functions. In the "create_Rectangle" function, we draw a filled rectangle to represent the midnight to 6 AM price range, using parameters "objName", "time1", "price1", "time2", "price2", and "clr" for customization. We first check if the object doesn’t exist using the ObjectFind function with chart ID 0, ensuring we avoid duplicates.
If absent, we create the rectangle with ObjectCreate using OBJ_RECTANGLE, setting its coordinates with ObjectSetInteger for OBJPROP_TIME and ObjectSetDouble for "OBJPROP_PRICE". We enable color filling with "ObjectSetInteger" for "OBJPROP_FILL", set the rectangle’s color, and ensure it appears in the foreground by setting "OBJPROP_BACK" to false, followed by a ChartRedraw to update the chart display.
In the "create_Line" function, we draw a trend line with a descriptive text label to mark range boundaries, accepting parameters "objName", "time1", "price1", "time2", "price2", "width", "clr", and "text". We verify the line’s absence with "ObjectFind", then create it using "ObjectCreate" with OBJ_TREND, configuring coordinates, line width, and color via "ObjectSetInteger" and "ObjectSetDouble". To ensure readable text, we retrieve the chart scale with "ChartGetInteger", logging any failures with "Print", and adjust the font size dynamically based on the scale (from 5 to 13).
We create a text object with "ObjectCreate" using "OBJ_TEXT", named "objNameDescr", and set its properties with "ObjectSetInteger" for color, font size, and left anchor, and ObjectSetString for the "Calibri" font and price text, before redrawing the chart with "ChartRedraw". With these functions, we can call them when we define the ranges.
create_Rectangle(RECTANGLE_PREFIX+TimeToString(maximum_time),maximum_time,maximum_price,minimum_time,minimum_price,clrBlue);                       //--- Draw a rectangle to mark the daily range
create_Line(UPPER_LINE_PREFIX+TimeToString(midnight),midnight,maximum_price,sixAM,maximum_price,3,clrBlack,DoubleToString(maximum_price,_Digits)); //--- Draw the upper line for the range
create_Line(LOWER_LINE_PREFIX+TimeToString(midnight),midnight,minimum_price,sixAM,minimum_price,3,clrRed,DoubleToString(minimum_price,_Digits));   //--- Draw the lower line for the range
We complete the visualization of the midnight to 6 AM price range by calling "create_Rectangle" with "RECTANGLE_PREFIX+TimeToString(maximum_time)", "maximum_time", "maximum_price", "minimum_time", "minimum_price", and "clrBlue" to draw a rectangle marking the range. We then use "create_Line" twice: first for the upper line with "UPPER_LINE_PREFIX+TimeToString(midnight)", "midnight", "maximum_price", "sixAM", width 3, "clrBlack", and "DoubleToString(maximum_price,_Digits)"; and second for the lower line with "LOWER_LINE_PREFIX", "minimum_price", "clrRed", and matching parameters. Here is the current outcome.
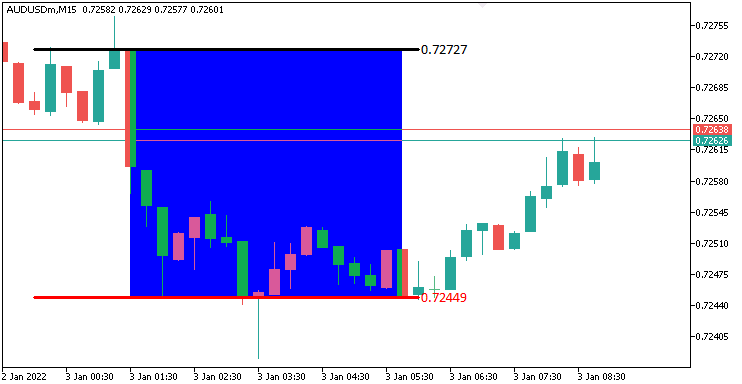
From the image, we can see that we have accurately visualized the range. The next thing that we need to do is track that there is a break within a predefined time range and visualize it on the chart too. We will need a custom function to show the break on the chart.
//+------------------------------------------------------------------+
//| Function to draw a breakpoint marker                             |
//+------------------------------------------------------------------+
void drawBreakPoint(string objName,datetime time,double price,int arrCode,
   color clr,int direction){ //--- Define a function to draw a breakpoint marker
   if (ObjectFind(0,objName) < 0){ //--- Check if the breakpoint object does not already exist
      ObjectCreate(0,objName,OBJ_ARROW,0,time,price);        //--- Create an arrow object at the specified time and price
      ObjectSetInteger(0,objName,OBJPROP_ARROWCODE,arrCode); //--- Set the arrow code for the marker
      ObjectSetInteger(0,objName,OBJPROP_COLOR,clr);         //--- Set the color of the arrow
      ObjectSetInteger(0,objName,OBJPROP_FONTSIZE,12);       //--- Set the font size for the arrow
      if (direction > 0) ObjectSetInteger(0,objName,OBJPROP_ANCHOR,ANCHOR_TOP);    //--- Set the anchor to top for upward breaks
      if (direction < 0) ObjectSetInteger(0,objName,OBJPROP_ANCHOR,ANCHOR_BOTTOM); //--- Set the anchor to bottom for downward breaks

      string txt = " Break"; //--- Define the text suffix for the breakpoint label
      string objNameDescr = objName + txt; //--- Create a unique name for the text object
      ObjectCreate(0,objNameDescr,OBJ_TEXT,0,time,price);   //--- Create a text object at the breakpoint
      ObjectSetInteger(0,objNameDescr,OBJPROP_COLOR,clr);   //--- Set the color of the text
      ObjectSetInteger(0,objNameDescr,OBJPROP_FONTSIZE,12); //--- Set the font size of the text
      if (direction > 0) { //--- Check if the breakout is upward
         ObjectSetInteger(0,objNameDescr,OBJPROP_ANCHOR,ANCHOR_LEFT_UPPER); //--- Set the text anchor to left upper
         ObjectSetString(0,objNameDescr,OBJPROP_TEXT, " " + txt);           //--- Set the text content
      }
      if (direction < 0) { //--- Check if the breakout is downward
         ObjectSetInteger(0,objNameDescr,OBJPROP_ANCHOR,ANCHOR_LEFT_LOWER); //--- Set the text anchor to left lower
         ObjectSetString(0,objNameDescr,OBJPROP_TEXT, " " + txt);           //--- Set the text content
      }
   }
   ChartRedraw(0); //--- Redraw the chart to display the breakpoint
}
Here, we define the "drawBreakPoint" function to visually mark breakout points. Using parameters "objName", "time", "price", "arrCode", "clr", and "direction", we create an arrow with ObjectCreate and OBJ_ARROW if absent via ObjectFind, setting its style, color, and font size 12 with "ObjectSetInteger", anchoring to "ANCHOR_TOP" or "ANCHOR_BOTTOM" based on "direction".
We add a text label " Break" with "ObjectCreate" and "OBJ_TEXT", named "objNameDescr", configuring color, font size, and anchor (ANCHOR_LEFT_UPPER or ANCHOR_LEFT_LOWER) using "ObjectSetInteger" and ObjectSetString. We finalize with "ChartRedraw" to display these markers, ensuring clear breakout visualization. We can now use this function to visualize the breakpoints on the chart.
double barClose = close(1); //--- Get the closing price of the previous bar
datetime barTime = time(1); //--- Get the time of the previous bar

if (barClose > maximum_price && isHaveDailyRange_Prices && !isHaveRangeBreak
    && barTime >= validBreakTime_start && barTime <= validBreakTime_end
){ //--- Check for a breakout above the maximum price within the valid time window
   Print("CLOSE Price broke the HIGH range. ",barClose," > ",maximum_price); //--- Log the breakout above the high range
   isHaveRangeBreak = true;                                                //--- Set the flag to indicate a range breakout has occurred
   drawBreakPoint(TimeToString(barTime),barTime,barClose,234,clrBlack,-1); //--- Draw a breakpoint marker for the high breakout
}
else if (barClose < minimum_price && isHaveDailyRange_Prices && !isHaveRangeBreak
         && barTime >= validBreakTime_start && barTime <= validBreakTime_end
){ //--- Check for a breakout below the minimum price within the valid time window
   Print("CLOSE Price broke the LOW range. ",barClose," < ",minimum_price); //--- Log the breakout below the low range
   isHaveRangeBreak = true;                                              //--- Set the flag to indicate a range breakout has occurred
   drawBreakPoint(TimeToString(barTime),barTime,barClose,233,clrBlue,1); //--- Draw a breakpoint marker for the low breakout
}
To detect and visualize the valid breakouts, we fetch the previous bar’s close with "close(1)" into "barClose" and time with "time(1)" into "barTime". If "barClose" exceeds "maximum_price", "isHaveDailyRange_Prices" is true, "isHaveRangeBreak" is false, and "barTime" is within "validBreakTime_start" to "validBreakTime_end", we log the high breakout with "Print", set "isHaveRangeBreak" to true, and call "drawBreakPoint" with "TimeToString(barTime)", "barClose", arrow 234, "clrBlack", and -1.
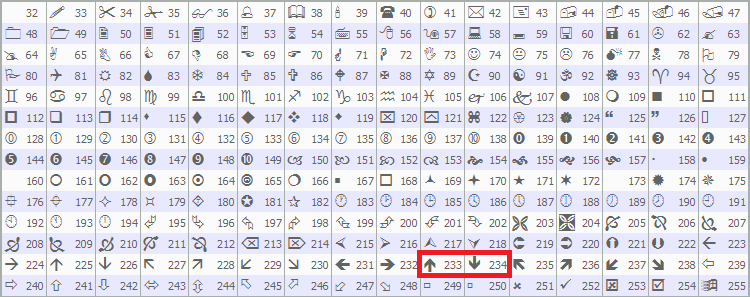
If "barClose" is below "minimum_price" under the same conditions, we log the low breakout, set "isHaveRangeBreak", and call "drawBreakPoint" with arrow 233, "clrBlue", and 1. This marks valid breakouts. We used the MQL5 predefined arrows, specifically 233 and 23 as you can see below, but you can use any of your liking.
When we run the program, we have the following output.
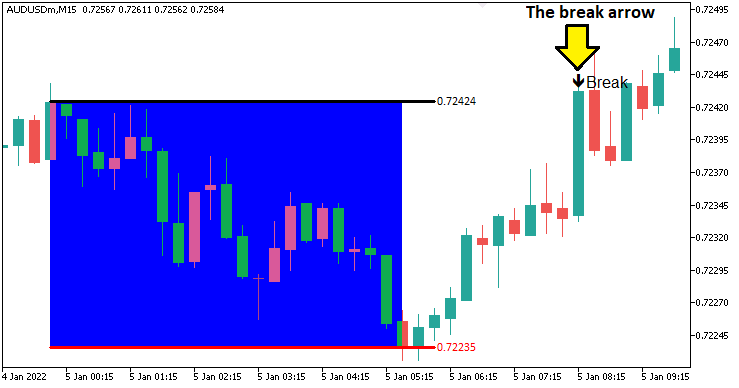
From the image, we can see that we can accurately identify and visualize the break. What we need to do next is define the structure shift and its break logic. We will thus need a function to draw the identified swing point.
//+------------------------------------------------------------------+
//| Function to draw a swing point marker                            |
//+------------------------------------------------------------------+
void drawSwingPoint(string objName,datetime time,double price,int arrCode,
   color clr,int direction){ //--- Define a function to draw a swing point marker
   if (ObjectFind(0,objName) < 0){ //--- Check if the swing point object does not already exist
      ObjectCreate(0,objName,OBJ_ARROW,0,time,price);        //--- Create an arrow object at the specified time and price
      ObjectSetInteger(0,objName,OBJPROP_ARROWCODE,arrCode); //--- Set the arrow code for the marker
      ObjectSetInteger(0,objName,OBJPROP_COLOR,clr);         //--- Set the color of the arrow
      ObjectSetInteger(0,objName,OBJPROP_FONTSIZE,10);       //--- Set the font size for the arrow

      if (direction > 0) {ObjectSetInteger(0,objName,OBJPROP_ANCHOR,ANCHOR_TOP);}    //--- Set the anchor to top for swing lows
      if (direction < 0) {ObjectSetInteger(0,objName,OBJPROP_ANCHOR,ANCHOR_BOTTOM);} //--- Set the anchor to bottom for swing highs

      string text = "BoS";                   //--- Define the text label for Break of Structure
      string objName_Descr = objName + text; //--- Create a unique name for the text object
      ObjectCreate(0,objName_Descr,OBJ_TEXT,0,time,price);   //--- Create a text object at the swing point
      ObjectSetInteger(0,objName_Descr,OBJPROP_COLOR,clr);   //--- Set the color of the text
      ObjectSetInteger(0,objName_Descr,OBJPROP_FONTSIZE,10); //--- Set the font size of the text

      if (direction > 0) { //--- Check if the swing is a low
         ObjectSetString(0,objName_Descr,OBJPROP_TEXT,"  "+text);            //--- Set the text content
         ObjectSetInteger(0,objName_Descr,OBJPROP_ANCHOR,ANCHOR_LEFT_UPPER); //--- Set the text anchor to left upper
      }
      if (direction < 0) { //--- Check if the swing is a high
         ObjectSetString(0,objName_Descr,OBJPROP_TEXT,"  "+text);            //--- Set the text content
         ObjectSetInteger(0,objName_Descr,OBJPROP_ANCHOR,ANCHOR_LEFT_LOWER); //--- Set the text anchor to left lower
      }
   }
   ChartRedraw(0); //--- Redraw the chart to display the swing point
}
We implement the "drawSwingPoint" function to mark swing highs and lows that have been identified. Using parameters "objName", "time", "price", "arrCode", "clr", and "direction", we verify absence with ObjectFind, create an arrow with ObjectCreate using OBJ_ARROW, and set style, color, and font size 10 via ObjectSetInteger, anchoring to "ANCHOR_TOP" for lows or "ANCHOR_BOTTOM" for highs. We add a "BoS" text label with "ObjectCreate" using "OBJ_TEXT", configuring color, font size, and anchor (ANCHOR_LEFT_UPPER or ANCHOR_LEFT_LOWER) via "ObjectSetInteger" and "ObjectSetString". We call ChartRedraw to display these markers, highlighting key swing points. With this function, we then continue to structure the logic for swing point identification.
// bos logic
if (isHaveDailyRange_Prices){ //--- Proceed with BoS logic only if the daily range is calculated
   static bool isNewBar_bos = false;            //--- Initialize flag to indicate a new bar on the BoS timeframe
   int currBars = iBars(_Symbol,timeframe_bos); //--- Get the current number of bars on the BoS timeframe
   static int prevBars = currBars;              //--- Store the previous number of bars for comparison

   if (prevBars == currBars){isNewBar_bos = false;}                          //--- Set flag to false if no new bar has formed
   else if (prevBars != currBars){isNewBar_bos = true; prevBars = currBars;} //--- Set flag to true and update prevBars if a new bar has formed

   const int length = 4;                         //--- Define the number of bars to check for swing high/low (must be > 2)
   int right_index, left_index;                  //--- Declare variables to store indices for bars to the right and left
   int curr_bar = length;                        //--- Set the current bar index for swing analysis
   bool isSwingHigh = true, isSwingLow = true;   //--- Initialize flags to determine if the current bar is a swing high or low
   static double swing_H = -1.0, swing_L = -1.0; //--- Initialize variables to store the latest swing high and low prices

   if (isNewBar_bos){ //--- Check if a new bar has formed on the BoS timeframe
      for (int a=1; a<=length; a++){ //--- Loop through the specified number of bars to check for swings
         right_index = curr_bar - a; //--- Calculate the right-side bar index
         left_index = curr_bar + a;  //--- Calculate the left-side bar index
         if ( (high(curr_bar,timeframe_bos) <= high(right_index,timeframe_bos)) || (high(curr_bar,timeframe_bos) < high(left_index,timeframe_bos)) ){ //--- Check if the current bar's high is not the highest
            isSwingHigh = false; //--- Set flag to false if the bar is not a swing high
         }
         if ( (low(curr_bar,timeframe_bos) >= low(right_index,timeframe_bos)) || (low(curr_bar,timeframe_bos) > low(left_index,timeframe_bos)) ){ //--- Check if the current bar's low is not the lowest
            isSwingLow = false; //--- Set flag to false if the bar is not a swing low
         }
      }

      if (isSwingHigh){ //--- Check if the current bar is a swing high
         swing_H = high(curr_bar,timeframe_bos); //--- Store the swing high price
         Print("WE DO HAVE A SWING HIGH @ BAR INDEX ",curr_bar," H: ",high(curr_bar,timeframe_bos)); //--- Log the swing high details
         drawSwingPoint(TimeToString(time(curr_bar,timeframe_bos)),time(curr_bar,timeframe_bos),high(curr_bar,timeframe_bos),77,clrBlue,-1); //--- Draw a marker for the swing high
      }
      if (isSwingLow){ //--- Check if the current bar is a swing low
         swing_L = low(curr_bar,timeframe_bos); //--- Store the swing low price
         Print("WE DO HAVE A SWING LOW @ BAR INDEX ",curr_bar," L: ",low(curr_bar,timeframe_bos)); //--- Log the swing low details
         drawSwingPoint(TimeToString(time(curr_bar,timeframe_bos)),time(curr_bar,timeframe_bos),low(curr_bar,timeframe_bos),77,clrRed,+1); //--- Draw a marker for the swing low
      }
   }
}
If we have the daily prices, meaning we have the daily range already defined, we track new bars on the Break of Structure timeframe using a static "isNewBar_bos" flag, comparing the current bar count from iBars with _Symbol and "timeframe_bos" against a static "prevBars", updating "isNewBar_bos" to true and "prevBars" when a new bar forms.
When "isNewBar_bos" is true, we analyze the bar at index "curr_bar" (set to "length" = 4) for swings, checking "length" bars on either side using "right_index" and "left_index". We use "high" and "low" functions with "timeframe_bos" to compare the current bar’s high and low against neighboring bars, setting "isSwingHigh" or "isSwingLow" to false if not the highest or lowest.
If "isSwingHigh", we store the price in "swing_H", log it with "Print", and call "drawSwingPoint" with "TimeToString", the bar’s time, price, arrow code 77, "clrBlue", and -1; if "isSwingLow", we update "swing_L", log, and call "drawSwingPoint" with "clrRed" and +1. Upon compilation, we have the following outcome.
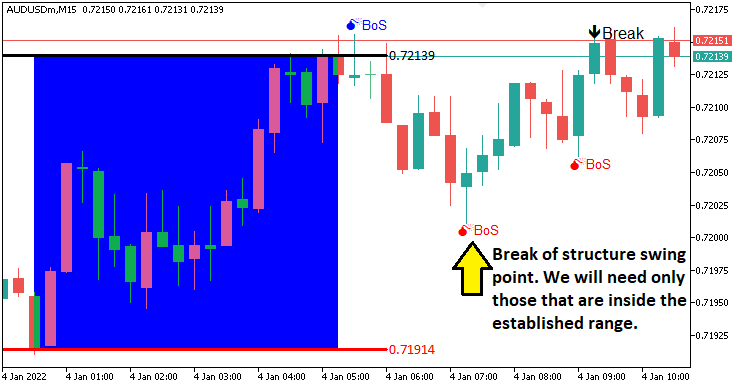
From the image, you can see that we draw the swing points. The next thing that we need to do is track the break of the swing points meaning a structure shift and so a break of structure. To visualize these again, we will need a custom function as follows.
//+------------------------------------------------------------------+
//| Function to draw a break level line                              |
//+------------------------------------------------------------------+
void drawBreakLevel(string objName,datetime time1,double price1,
   datetime time2,double price2,color clr,int direction){ //--- Define a function to draw a break level line
   if (ObjectFind(0,objName) < 0){ //--- Check if the break level object does not already exist
      ObjectCreate(0,objName,OBJ_ARROWED_LINE,0,time1,price1,time2,price2); //--- Create an arrowed line object
      ObjectSetInteger(0,objName,OBJPROP_TIME,0,time1);                     //--- Set the first time coordinate of the line
      ObjectSetDouble(0,objName,OBJPROP_PRICE,0,price1);                    //--- Set the first price coordinate of the line
      ObjectSetInteger(0,objName,OBJPROP_TIME,1,time2);                     //--- Set the second time coordinate of the line
      ObjectSetDouble(0,objName,OBJPROP_PRICE,1,price2);                    //--- Set the second price coordinate of the line

      ObjectSetInteger(0,objName,OBJPROP_COLOR,clr); //--- Set the color of the line
      ObjectSetInteger(0,objName,OBJPROP_WIDTH,2);   //--- Set the width of the line

      string text = "Break";                 //--- Define the text label for the break
      string objName_Descr = objName + text; //--- Create a unique name for the text object
      ObjectCreate(0,objName_Descr,OBJ_TEXT,0,time2,price2); //--- Create a text object at the line's end
      ObjectSetInteger(0,objName_Descr,OBJPROP_COLOR,clr);   //--- Set the color of the text
      ObjectSetInteger(0,objName_Descr,OBJPROP_FONTSIZE,10); //--- Set the font size of the text

      if (direction > 0) { //--- Check if the break is upward
         ObjectSetString(0,objName_Descr,OBJPROP_TEXT,text+"  ");             //--- Set the text content
         ObjectSetInteger(0,objName_Descr,OBJPROP_ANCHOR,ANCHOR_RIGHT_UPPER); //--- Set the text anchor to right upper
      }
      if (direction < 0) { //--- Check if the break is downward
         ObjectSetString(0,objName_Descr,OBJPROP_TEXT,text+"  ");             //--- Set the text content
         ObjectSetInteger(0,objName_Descr,OBJPROP_ANCHOR,ANCHOR_RIGHT_LOWER); //--- Set the text anchor to right lower
      }
   }
   ChartRedraw(0); //--- Redraw the chart to display the break level
}
We just define the "drawBreakLevel" function to visualize the break of the structure. We use a similar logic for the visualization just as we did with the prior visualization functions, so we wont invest much time explaining what everything does. We will use this function to visualize the levels.
double Ask = NormalizeDouble(SymbolInfoDouble(_Symbol,SYMBOL_ASK),_Digits); //--- Get and normalize the current Ask price
double Bid = NormalizeDouble(SymbolInfoDouble(_Symbol,SYMBOL_BID),_Digits); //--- Get and normalize the current Bid price

if (swing_H > 0 && Ask > swing_H){ //--- Check if the Ask price breaks above the swing high
   Print("$$$$$$$$$ BUY SIGNAL NOW. BREAK OF SWING HIGH"); //--- Log a buy signal due to swing high breakout
   int swing_H_index = 0;                //--- Initialize the index of the swing high bar
   for (int i=0; i<=length*2+1000; i++){ //--- Loop through bars to find the swing high
      double high_sel = high(i,timeframe_bos); //--- Get the high price of the i-th bar
      if (high_sel == swing_H){ //--- Check if the high matches the swing high
         swing_H_index = i;     //--- Store the bar index
         Print("BREAK HIGH FOUND @ BAR INDEX ",swing_H_index); //--- Log the swing high bar index
         break;                 //--- Exit the loop once found
      }
   }
   drawBreakLevel(TimeToString(time(0,timeframe_bos)),time(swing_H_index,timeframe_bos),high(swing_H_index,timeframe_bos),
   time(0,timeframe_bos),high(swing_H_index,timeframe_bos),clrBlue,-1); //--- Draw a line to mark the swing high breakout

   if (isTakenTrade == false){                                     //--- Check if no trade is taken yet
      obj_Trade.Buy(0.01,_Symbol,Ask,minimum_price,maximum_price); //--- Execute a buy trade with 0.01 lots, using minimum price as SL and maximum as TP
      isTakenTrade = true;                                         //--- Set the flag to indicate a trade is taken
   }

   swing_H = -1.0; //--- Reset the swing high price
   return;         //--- Exit the OnTick function to avoid further processing
}
if (swing_L > 0 && Bid < swing_L){ //--- Check if the Bid price breaks below the swing low
   Print("$$$$$$$$$ SELL SIGNAL NOW. BREAK OF SWING LOW"); //--- Log a sell signal due to swing low breakout
   int swing_L_index = 0; //--- Initialize the index of the swing low bar
   for (int i=0; i<=length*2+1000; i++){ //--- Loop through bars to find the swing low
      double low_sel = low(i,timeframe_bos); //--- Get the low price of the i-th bar
      if (low_sel == swing_L){ //--- Check if the low matches the swing low
         swing_L_index = i;    //--- Store the bar index
         Print("BREAK LOW FOUND @ BAR INDEX ",swing_L_index); //--- Log the swing low bar index
         break;                //--- Exit the loop once found
      }
   }
   drawBreakLevel(TimeToString(time(0,timeframe_bos)),time(swing_L_index,timeframe_bos),low(swing_L_index,timeframe_bos),
   time(0,timeframe_bos),low(swing_L_index,timeframe_bos),clrRed,+1); //--- Draw a line to mark the swing low breakout

   if (isTakenTrade == false){ //--- Check if no trade is taken yet
      obj_Trade.Sell(0.01,_Symbol,Bid,maximum_price,minimum_price); //--- Execute a sell trade with 0.01 lots, using maximum price as SL and minimum as TP
      isTakenTrade = true;                                          //--- Set the flag to indicate a trade is taken
   }

   swing_L = -1.0; //--- Reset the swing low price
   return;         //--- Exit the OnTick function to avoid further processing
}
Here, we implement trade execution logic when we have a valid breakout. We get normalized "Ask" and "Bid" prices using SymbolInfoDouble and NormalizeDouble with _Symbol and _Digits.
If "swing_H" is positive and "Ask" exceeds "swing_H", we log with "Print", find the swing high index with "high" and "timeframe_bos", mark it with "drawBreakLevel" using TimeToString and "time", and call "obj_Trade.Buy" with 0.01 lots, "minimum_price" stop-loss, and "maximum_price" take-profit if "isTakenTrade" is false, setting it true and resetting "swing_H".
If "swing_L" is positive and "Bid" falls below "swing_L", we log, find the swing low index with "low", mark with "drawBreakLevel", and call "obj_Trade.Sell", resetting "swing_L". We exit with "return" after each trade for precise Break of Structure trading. Here is the outcome.
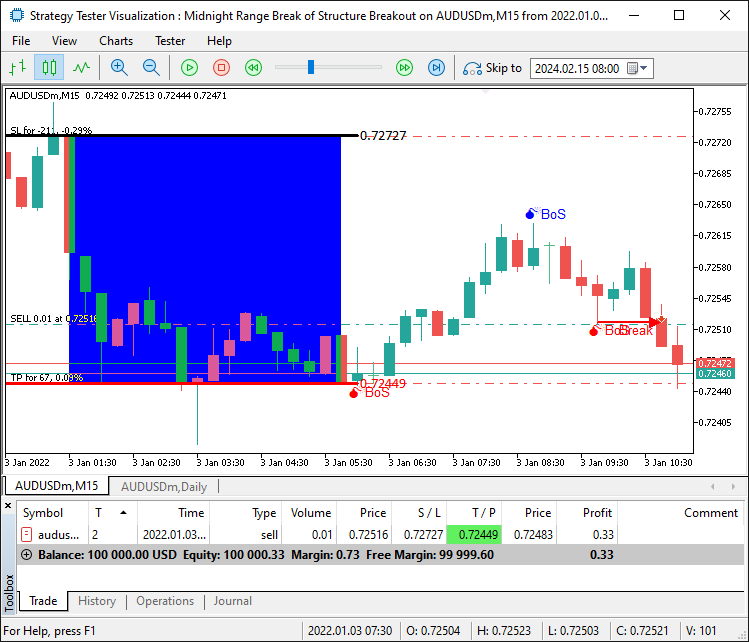
We are now able to open trades for the confirmed setups. However, what about when there is a breakout that happens but it is not within the range. That is price pushes higher or lower from the range boundaries. We need to wait till the price comes back within the range for us to consider the break as valid. To achieve that, we will need to get the maximum and minimum range prices and add them for a firmer restriction to avoid false signals.
if (swing_H > 0 && Ask > swing_H && swing_H <= maximum_price && swing_H >= minimum_price){ //--- Check if the Ask price breaks above the swing high within the range
   Print("$$$$$$$$$ BUY SIGNAL NOW. BREAK OF SWING HIGH WITHIN RANGE"); //--- Log a buy signal due to swing high breakout
   int swing_H_index = 0;                                               //--- Initialize the index of the swing high bar
   for (int i=0; i<=length*2+1000; i++){                                //--- Loop through bars to find the swing high
      double high_sel = high(i,timeframe_bos); //--- Get the high price of the i-th bar
      if (high_sel == swing_H){                //--- Check if the high matches the swing high
         swing_H_index = i; //--- Store the bar index
         Print("BREAK HIGH FOUND @ BAR INDEX ",swing_H_index); //--- Log the swing high bar index
         break;             //--- Exit the loop once found
      }
   }
   drawBreakLevel(TimeToString(time(0,timeframe_bos)),time(swing_H_index,timeframe_bos),high(swing_H_index,timeframe_bos),
   time(0,timeframe_bos),high(swing_H_index,timeframe_bos),clrBlue,-1); //--- Draw a line to mark the swing high breakout

   if (isTakenTrade == false){ //--- Check if no trade is taken yet
      obj_Trade.Buy(0.01,_Symbol,Ask,minimum_price,maximum_price); //--- Execute a buy trade with 0.01 lots, using minimum price as SL and maximum as TP
      isTakenTrade = true;                                         //--- Set the flag to indicate a trade is taken
   }

   swing_H = -1.0; //--- Reset the swing high price
   return;         //--- Exit the OnTick function to avoid further processing
}
if (swing_L > 0 && Bid < swing_L && swing_L <= maximum_price && swing_L >= minimum_price){ //--- Check if the Bid price breaks below the swing low within the range
   Print("$$$$$$$$$ SELL SIGNAL NOW. BREAK OF SWING LOW WITHIN RANGE"); //--- Log a sell signal due to swing low breakout
   int swing_L_index = 0;                //--- Initialize the index of the swing low bar
   for (int i=0; i<=length*2+1000; i++){ //--- Loop through bars to find the swing low
      double low_sel = low(i,timeframe_bos); //--- Get the low price of the i-th bar
      if (low_sel == swing_L){ //--- Check if the low matches the swing low
         swing_L_index = i;    //--- Store the bar index
         Print("BREAK LOW FOUND @ BAR INDEX ",swing_L_index); //--- Log the swing low bar index
         break;                //--- Exit the loop once found
      }
   }
   drawBreakLevel(TimeToString(time(0,timeframe_bos)),time(swing_L_index,timeframe_bos),low(swing_L_index,timeframe_bos),
   time(0,timeframe_bos),low(swing_L_index,timeframe_bos),clrRed,+1); //--- Draw a line to mark the swing low breakout

   if (isTakenTrade == false){ //--- Check if no trade is taken yet
      obj_Trade.Sell(0.01,_Symbol,Bid,maximum_price,minimum_price); //--- Execute a sell trade with 0.01 lots, using maximum price as SL and maximum as TP
      isTakenTrade = true;                                          //--- Set the flag to indicate a trade is taken
   }

   swing_L = -1.0; //--- Reset the swing low price
   return;         //--- Exit the OnTick function to avoid further processing
}
We are okay by discarding false signals and we can see that we can open trades for a confirmed setup, hence achieving our objective of identifying, visualizing, and trading the strategy setup. The thing that remains is backtesting the program, and that is handled in the next section.
Backtesting
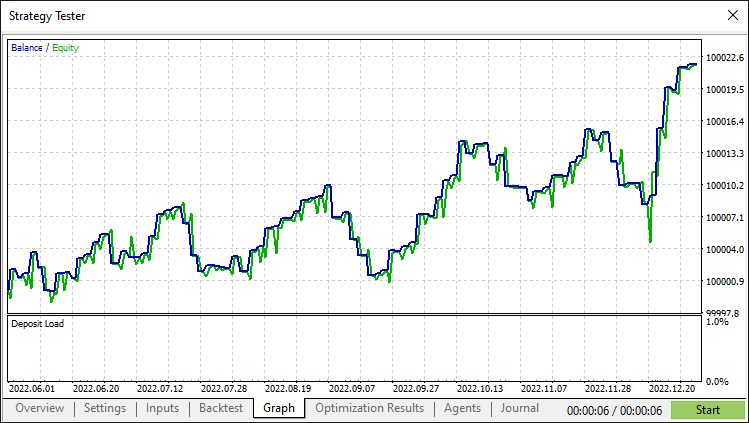
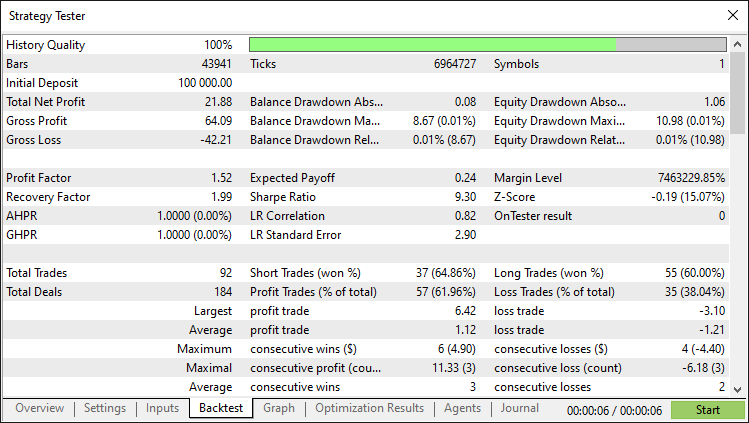
After thorough backtesting, we have the following results.
Backtest graph:
Backtest report:
Conclusion
In conclusion, we have built a MQL5 Expert Advisor that automates the Midnight Range Breakout with Break of Structure strategy, trading breakouts within the midnight range confirmed by current-day swing points. With precise range detection and visualization, you can advance it more and define some more strategies to make it robust and geared towards your trading style.
Disclaimer: This article is for educational purposes only. Trading involves substantial financial risks, and market volatility can lead to losses. Comprehensive backtesting and prudent risk management are essential before using this Expert Advisor in live markets.
By mastering these techniques, you can advance your algorithmic trading skills and approach markets with greater confidence. Best of luck in your trading journey!
Warning: All rights to these materials are reserved by MetaQuotes Ltd. Copying or reprinting of these materials in whole or in part is prohibited.
This article was written by a user of the site and reflects their personal views. MetaQuotes Ltd is not responsible for the accuracy of the information presented, nor for any consequences resulting from the use of the solutions, strategies or recommendations described.
 MQL5 Wizard Techniques you should know (Part 62): Using Patterns of ADX and CCI with Reinforcement-Learning TRPO
 Creating Dynamic MQL5 Graphical Interfaces through Resource-Driven Image Scaling with Bicubic Interpolation on Trading Charts
 Developing a Replay System (Part 66): Playing the service (VII)
 DoEasy. Service functions (Part 3): Outside Bar pattern
- Free trading apps
- Over 8,000 signals for copying
- Economic news for exploring financial markets
You agree to website policy and terms of use
Hi Allan.
I'm going to download your system and begin testing. Interestingly the strategy testers report does not identify either the trading pair nor the time frame. As you illustrated the AUUSD M15, I am assuming it is what you used and I will begin testing with. Do you have any feeling for using other pairs or time frames. I suspect that this ea may work better on Asian trading pairs, am I correct?
Cheers, CapeCoddah
The testing was a bust. I tried AUDUSD, AUDJPY, & USDJPY and all produced losses with the Sharpe Ratios of -3.00 to -5.00. All except USDJPY went negative immediately and never recovered. USDJPY had 2 periods of positive gains but eventually turned negative and never returned.
Adios
Excellent work. Thank you Allan!
Sure. Welcome. Thanks for the kind feedback.
Thank You Allan!. you are the best