
Farbpuffer in Multi-Symbol-Multi-Perioden-Indikatoren

Inhalt
- Einführung
- Grundlegende Prinzipien
- Erweiterung der Klassen
- Tests
- Accumulation/Distribution
- Accelerator Oszillator
- Alligator
- Average Directional Movement Index
- Average Directional Movement Index Wilder
- Average True Range
- Awesome Oszillator
- Bears Power
- Bollinger Bands
- Bulls Power
- Chaikin Oscillator
- Commodity Channel Index
- DeMarker
- Envelopes
- Force Index
- MACD
- MA des Oszillators
- Market Facilitation Index
- Momentum
- Money Flow Index
- Gleitende Durchschnitte
- On Balance Volumen
- Einstellung des Parabolic SAR
- RSI (Relative Strength Index)
- Relative Vigor Index
- Standard Deviation
- Stochastik Oszillator
- Triple Exponential Average
- Volumes
- Williams Percent Range
- Schlussfolgerung
Einführung
Wir setzen die Entwicklung von Multi-Symbol- und Multi-Perioden-Indikatoren fort, die wir im letzten Artikel begonnen haben.
Ein einfarbiger Indikatorpuffer ist ein reguläres Double-Array, das bei der Berechnung des Indikators mit Daten gefüllt wird. Wir können Daten aus diesem Array abrufen und sie mit dem Befehl CopyBuffer() in einem Chart anzeigen, vorausgesetzt, das empfangende Array ist ein Double-Array, das als Plot-Puffer für einen Indikator festgelegt wurde (SetIndexBuffer()). Beim Kopieren von Daten aus dem Puffer des berechneten Teils des Indikators in den Puffer seines Teils, der gezeichnet wird, werden die Daten im Chart in einer Farbe angezeigt, die für das Puffer-Array des Zeichenteils festgelegt ist. Bei mehrfarbigen Puffern ist die Situation ein wenig anders. Neben dem Datenfeld verfügt der Farbpuffer auch über ein Feld mit Farbindizes.
Für eine gezeichnete farbige Indikatorlinie können wir nicht mehr als 64 verschiedene Farben für ihre Darstellung einstellen. Sie können die Farben für die Zeile z.B. mit der Compilerdirektive indicator_colorN festlegen:
#property indicator_color1 clrGreen,clrRed
oder durch die Funktion PlotIndexSetInteger():
PlotIndexSetInteger(0,PLOT_COLOR_INDEXES,2);
PlotIndexSetInteger(0,PLOT_LINE_COLOR,0,clrGreen);
PlotIndexSetInteger(0,PLOT_LINE_COLOR,1,clrRed);
In beiden Fällen werden hier zwei Farben für die erste gezeichnete Linie des Indikators festgelegt: grün und rot. Der grüne Farbindex ist 0, und der rote Farbindex ist 1. Diese Farbindizes werden in einem speziellen Array von Farbindizes im Farbpuffer des Indikators gespeichert. Für jeden Balken in der vom Indikator berechneten Zeitreihe können Sie eine eigene Farbe festlegen. In diesem Fall wird für jeden Balken ein eigener Farbindex festgelegt. In diesem Fall ist es entweder 0 oder 1. Die Indikatorlinie wird mit der diesem Index zugewiesenen Farbe gezeichnet.
In den obigen Beispielen scheint die erste Methode übersichtlicher zu sein. Das stimmt, aber um die Farbe der Indikatorlinie dynamisch ändern zu können, müssen Sie die zweite Methode anwenden: Sie müssen die Anzahl der Farben zuweisen und sie dann dynamisch in beliebige andere Farben ändern, je nach der vom Indikator angezeigten Situation.
Für jeden Farbpuffer müssen wir ein Array mit Farbindizes zuweisen, und das Array mit den Farbindizes muss einen Index haben, der um 1 größer ist als der Index des zu zeichnenden Arrays. Bei Zeichenstilen, die mehr als ein Array erfordern, ist der Index des Farbarrays immer um 1 größer als der Index des letzten Arrays, das für die Darstellung der Linie zugewiesen wurde.
Grundlegende Prinzipien
Ausgehend von den obigen Ausführungen gehen wir davon aus, dass
- der Indikatorzeichnungspuffer (plot buffer) kann je nach Zeichenstil ein oder mehrere Arrays zum Plotten verwenden.
- für jedes Farbfeld wird ein zusätzliches Feld verwendet, das ein Feld mit Farbindizes des Zeichnungspuffers ist, dessen Index um 1 größer ist als der Index des letzten dem Zeichnungspuffer zugewiesenen Feldes.
Zum besseren Verständnis erstellen wir einen neuen Indikator, in dem wir mehrere Puffer für die Darstellung angeben, darunter einfache und farbige, die mehrere Arrays für die Konstruktion verwenden:
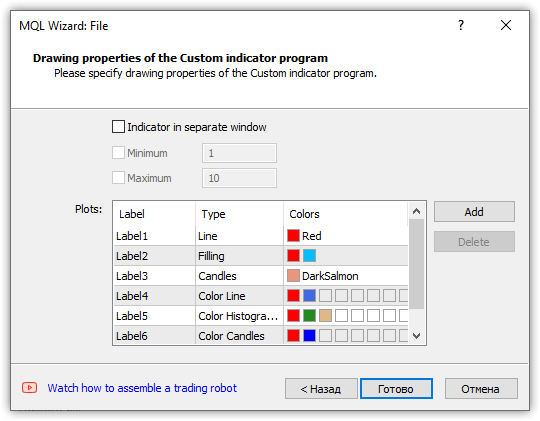
Wir haben die folgende Indikatorvorlage:
//+------------------------------------------------------------------+
//|                                                         Test.mq5 |
//|                                  Copyright 2023, MetaQuotes Ltd. |
//|                                             https://www.mql5.com |
//+------------------------------------------------------------------+
#property copyright "Copyright 2023, MetaQuotes Ltd."
#property link      "https://www.mql5.com"
#property version   "1.00"
#property indicator_chart_window
#property indicator_buffers 17                     // 17 arrays for indicator calculations in total
#property indicator_plots   6                      // Out of 17  arrays, 6 graphic series are plotting buffers
//--- plot Label1
#property indicator_label1  "Label1"
#property indicator_type1   DRAW_LINE              // Plot buffer with index 0 is a simple line, requires one array to plot
#property indicator_color1  clrRed                 // Color line: Red
#property indicator_style1  STYLE_SOLID
#property indicator_width1  1
//--- plot Label2
#property indicator_label2  "Label2"
#property indicator_type2   DRAW_FILLING           // Plot buffer with index 1 is a colored area drawn between two indicator lines, requires two arrays to plot
#property indicator_color2  clrRed,clrDeepSkyBlue  // Area color: wither Red or DeepSkyBlue depending on which line is higher
#property indicator_style2  STYLE_SOLID
#property indicator_width2  1
//--- plot Label3
#property indicator_label3  "Label3"
#property indicator_type3   DRAW_CANDLES           // Plot buffer with index 2, display as single-color candlesticks, requires 4 arrays of OHLC data to plot
#property indicator_color3  clrDarkSalmon          // Color: DarkSalmon
#property indicator_style3  STYLE_SOLID
#property indicator_width3  1
//--- plot Label4
#property indicator_label4  "Label4"
#property indicator_type4   DRAW_COLOR_LINE        // Plot buffer with index 3, color line, requires two arrays to plot: data array + color index array
#property indicator_color4  clrRed,clrRoyalBlue    // Two colors: Red and RoyalBlue. Can have up to 64 colors
#property indicator_style4  STYLE_SOLID
#property indicator_width4  1
//--- plot Label5
#property indicator_label5  "Label5"
#property indicator_type5   DRAW_COLOR_HISTOGRAM2  // Plot buffer with index 4, color histogram between two lines, requires three arrays: 2 data arrays + color index array
#property indicator_color5  clrRed,clrForestGreen,clrBurlyWood // Three colors: Red, ForestGreen and BurlyWood. Can have up to 64 colors
#property indicator_style5  STYLE_SOLID
#property indicator_width5  1
//--- plot Label6
#property indicator_label6  "Label6"               // Plot buffer with index 5, color histogram between two lines, requires 5 arrays: 4 OHLC data arrays + color index array
#property indicator_type6   DRAW_COLOR_CANDLES     // Three colors: Red, Blue and Gray. Can have up to 64 colors
#property indicator_color6  clrRed,clrBlue,clrGray
#property indicator_style6  STYLE_SOLID
#property indicator_width6  1
//--- input variables
input uchar    InpHidePlotIndex  =  0;             // Hide Plot Index
//--- indicator buffers
double         Label1Buffer[];                     // Plot buffer with index 0
double         Label2Buffer1[];                    // Plot buffer with index 1, array 1
double         Label2Buffer2[];                    // Plot buffer with index 1, array 2
double         Label3Buffer1[];                    // Plot buffer with index 2, array 1
double         Label3Buffer2[];                    // Plot buffer with index 2, array 2
double         Label3Buffer3[];                    // Plot buffer with index 2, array 3
double         Label3Buffer4[];                    // Plot buffer with index 2, array 4
double         Label4Buffer[];                     // Plot buffer with index 3
double         Label4Colors[];                     // Color index array for plot buffer with index 3
double         Label5Buffer1[];                    // Plot buffer with index 4, array 1
double         Label5Buffer2[];                    // Plot buffer with index 4, array 2
double         Label5Colors[];                     // Color index array for plot buffer with index 4
double         Label6Buffer1[];                    // Plot buffer with index 5, array 1
double         Label6Buffer2[];                    // Plot buffer with index 5, array 2
double         Label6Buffer3[];                    // Plot buffer with index 5, array 3
double         Label6Buffer4[];                    // Plot buffer with index 5, array 4
double         Label6Colors[];                     // Color index array for plot buffer with index 5

//+------------------------------------------------------------------+
//| Custom indicator initialization function                         |
//+------------------------------------------------------------------+
int OnInit()
  {
//--- indicator buffers mapping
//--- Plot buffer 0. One array to plot
   SetIndexBuffer(0,Label1Buffer,INDICATOR_DATA);        // Data buffer

//--- Plot buffer 1. Two arrays for construction
   SetIndexBuffer(1,Label2Buffer1,INDICATOR_DATA);       // Line 1 data buffer
   SetIndexBuffer(2,Label2Buffer2,INDICATOR_DATA);       // Line 2 data buffer

//--- Plot buffer 2. Four arrays for construction
   SetIndexBuffer(3,Label3Buffer1,INDICATOR_DATA);       // Data buffer for line 1 Open
   SetIndexBuffer(4,Label3Buffer2,INDICATOR_DATA);       // Data buffer for line 2 High
   SetIndexBuffer(5,Label3Buffer3,INDICATOR_DATA);       // Data buffer for line 3 Low
   SetIndexBuffer(6,Label3Buffer4,INDICATOR_DATA);       // Data buffer for line 4 Close

//--- Plot buffer 3. Two arrays for construction
   SetIndexBuffer(7,Label4Buffer,INDICATOR_DATA);        // Data buffer
   SetIndexBuffer(8,Label4Colors,INDICATOR_COLOR_INDEX); // Buffer of color indexes

//--- Plot buffer 4. Three arrays for construction
   SetIndexBuffer(9,Label5Buffer1,INDICATOR_DATA);       // Data buffer for line 1
   SetIndexBuffer(10,Label5Buffer2,INDICATOR_DATA);      // Data buffer for line 2
   SetIndexBuffer(11,Label5Colors,INDICATOR_COLOR_INDEX);// Buffer of color indexes

//--- Plot buffer 5. Five arrays for construction
   SetIndexBuffer(12,Label6Buffer1,INDICATOR_DATA);      // Data buffer for line 1 Open
   SetIndexBuffer(13,Label6Buffer2,INDICATOR_DATA);      // Data buffer for line 2 High
   SetIndexBuffer(14,Label6Buffer3,INDICATOR_DATA);      // Data buffer for line 3 Low
   SetIndexBuffer(15,Label6Buffer4,INDICATOR_DATA);      // Data buffer for line 4 Close
   SetIndexBuffer(16,Label6Colors,INDICATOR_COLOR_INDEX);// Buffer of color indexes
  }
//+------------------------------------------------------------------+
//| Custom indicator iteration function                              |
//+------------------------------------------------------------------+
int OnCalculate(const int rates_total,
                const int prev_calculated,
                const datetime &time[],
                const double &open[],
                const double &high[],
                const double &low[],
                const double &close[],
                const long &tick_volume[],
                const long &volume[],
                const int &spread[])
  {

//--- return value of prev_calculated for the next call
   return(rates_total);
  }
//+------------------------------------------------------------------+
Die Kommentare beschreiben, welche Felder bestimmten Grafikreihen zugeordnet sind. Wenn Sie einen Indikator erstellen, ohne die Standardnamen der Grafikzeitreihen zu ändern, erstellt der Assistent recht logische und verständliche Namen für die Indikatorpuffer, wobei „LabelX“ der Name des Puffers ist, der mit der Nummer X gezeichnet wird, und „Buffer“ die Nummer des Arrays (eines oder mehrere) ist, um eine Grafikzeitreihe zu konstruieren.
Zum Beispiel,
- Label5Buffer1 ist das erste Array des fünften Zeichnungspuffers (sein Index ist eigentlich 4, da er bei Null beginnt), um ein Farbhistogramm zwischen zwei Linien zu erstellen.
- Label5Buffer2 ist das zweite Array des fünften Zeichnungspuffers für die Erstellung eines Farbhistogramms, das zwischen zwei Linien gezeichnet wird.
- Label5Colors ist ein Array von Farbindizes des fünften Zeichnungspuffers zur Erstellung eines Farbhistogramms zwischen zwei Linien.
Für das oben beschriebene Beispiel ist der Index der Grafikzeitreihe dem Zeichnungspuffer (plot buffer) 4, obwohl ihr Arrays mit den Indizes 9, 10 und 11 zugewiesen sind. Um dieser Grafikzeitreihe eine Eigenschaft zuzuweisen, müssen wir sie daher nicht über die Indizes der Arrays festlegen, die zur Konstruktion der Grafikzeitreihe zugewiesen wurden, sondern über den Index des Zeichnungspuffers, der in diesem Beispiel insgesamt sechs ist - von 0 bis 5.
Um visuell zu beobachten, wie Eigenschaften grafischen Reihen zugewiesen werden, können Sie eine Eingangsvariable hinzufügen, darin den Index des Zeichnungspuffers angeben, der im Datenfenster nicht angezeigt werden soll, und den angegebenen Zeichnungspuffer auf den Wert false setzen:
//+------------------------------------------------------------------+
//|                                                         Test.mq5 |
//|                                  Copyright 2023, MetaQuotes Ltd. |
//|                                             https://www.mql5.com |
//+------------------------------------------------------------------+
#property copyright "Copyright 2023, MetaQuotes Ltd."
#property link      "https://www.mql5.com"
#property version   "1.00"
#property indicator_chart_window
#property indicator_buffers 17                     // 17 arrays for indicator calculations in total
#property indicator_plots   6                      // Out of 17  arrays, 6 graphic series are plotting buffers
//--- plot Label1
#property indicator_label1  "Label1"
#property indicator_type1   DRAW_LINE              // Plot buffer with index 0 is a simple line, requires one array to plot
#property indicator_color1  clrRed                 // Color line: Red
#property indicator_style1  STYLE_SOLID
#property indicator_width1  1
//--- plot Label2
#property indicator_label2  "Label2"
#property indicator_type2   DRAW_FILLING           // Plot buffer with index 1 is a colored area drawn between two indicator lines, requires two arrays to plot
#property indicator_color2  clrRed,clrDeepSkyBlue  // Area color: wither Red or DeepSkyBlue depending on which line is higher
#property indicator_style2  STYLE_SOLID
#property indicator_width2  1
//--- plot Label3
#property indicator_label3  "Label3"
#property indicator_type3   DRAW_CANDLES           // Plot buffer with index 2, display as single-color candlesticks, requires 4 arrays of OHLC data to plot
#property indicator_color3  clrDarkSalmon          // Color: DarkSalmon
#property indicator_style3  STYLE_SOLID
#property indicator_width3  1
//--- plot Label4
#property indicator_label4  "Label4"
#property indicator_type4   DRAW_COLOR_LINE        // Plot buffer with index 3, color line, requires two arrays to plot: data array + color index array
#property indicator_color4  clrRed,clrRoyalBlue    // Two colors: Red and RoyalBlue. Can have up to 64 colors
#property indicator_style4  STYLE_SOLID
#property indicator_width4  1
//--- plot Label5
#property indicator_label5  "Label5"
#property indicator_type5   DRAW_COLOR_HISTOGRAM2  // Plot buffer with index 4, color histogram between two lines, requires three arrays: 2 data arrays + color index array
#property indicator_color5  clrRed,clrForestGreen,clrBurlyWood // Three colors: Red, ForestGreen and BurlyWood. Can have up to 64 colors
#property indicator_style5  STYLE_SOLID
#property indicator_width5  1
//--- plot Label6
#property indicator_label6  "Label6"               // Plot buffer with index 5, color histogram between two lines, requires 5 arrays: 4 OHLC data arrays + color index array
#property indicator_type6   DRAW_COLOR_CANDLES     // Three colors: Red, Blue and Gray. Can have up to 64 colors
#property indicator_color6  clrRed,clrBlue,clrGray
#property indicator_style6  STYLE_SOLID
#property indicator_width6  1
//--- input variables
input uchar    InpHidePlotIndex  =  0;             // Hide Plot Index
//--- indicator buffers
double         Label1Buffer[];                     // Plot buffer with index 0
double         Label2Buffer1[];                    // Plot buffer with index 1, array 1
double         Label2Buffer2[];                    // Plot buffer with index 1, array 2
double         Label3Buffer1[];                    // Plot buffer with index 2, array 1
double         Label3Buffer2[];                    // Plot buffer with index 2, array 2
double         Label3Buffer3[];                    // Plot buffer with index 2, array 3
double         Label3Buffer4[];                    // Plot buffer with index 2, array 4
double         Label4Buffer[];                     // Plot buffer with index 3
double         Label4Colors[];                     // Color index array for plot buffer with index 3
double         Label5Buffer1[];                    // Plot buffer with index 4, array 1
double         Label5Buffer2[];                    // Plot buffer with index 4, array 2
double         Label5Colors[];                     // Color index array for plot buffer with index 4
double         Label6Buffer1[];                    // Plot buffer with index 5, array 1
double         Label6Buffer2[];                    // Plot buffer with index 5, array 2
double         Label6Buffer3[];                    // Plot buffer with index 5, array 3
double         Label6Buffer4[];                    // Plot buffer with index 5, array 4
double         Label6Colors[];                     // Color index array for plot buffer with index 5
//--- global variables
int   hide_index=(InpHidePlotIndex>5 ? 5 : InpHidePlotIndex);
//+------------------------------------------------------------------+
//| Custom indicator initialization function                         |
//+------------------------------------------------------------------+
int OnInit()
  {
//--- indicator buffers mapping
//--- Plot buffer 0. One array to plot
   SetIndexBuffer(0,Label1Buffer,INDICATOR_DATA);        // Data buffer

//--- Plot buffer 1. Two arrays for construction
   SetIndexBuffer(1,Label2Buffer1,INDICATOR_DATA);       // Line 1 data buffer
   SetIndexBuffer(2,Label2Buffer2,INDICATOR_DATA);       // Line 2 data buffer

//--- Plot buffer 2. Four arrays for construction
   SetIndexBuffer(3,Label3Buffer1,INDICATOR_DATA);       // Data buffer for line 1 Open
   SetIndexBuffer(4,Label3Buffer2,INDICATOR_DATA);       // Data buffer for line 2 High
   SetIndexBuffer(5,Label3Buffer3,INDICATOR_DATA);       // Data buffer for line 3 Low
   SetIndexBuffer(6,Label3Buffer4,INDICATOR_DATA);       // Data buffer for line 4 Close

//--- Plot buffer 3. Two arrays for construction
   SetIndexBuffer(7,Label4Buffer,INDICATOR_DATA);        // Data buffer
   SetIndexBuffer(8,Label4Colors,INDICATOR_COLOR_INDEX); // Buffer of color indexes

//--- Plot buffer 4. Three arrays for construction
   SetIndexBuffer(9,Label5Buffer1,INDICATOR_DATA);       // Data buffer for line 1
   SetIndexBuffer(10,Label5Buffer2,INDICATOR_DATA);      // Data buffer for line 2
   SetIndexBuffer(11,Label5Colors,INDICATOR_COLOR_INDEX);// Buffer of color indexes

//--- Plot buffer 5. Five arrays for construction
   SetIndexBuffer(12,Label6Buffer1,INDICATOR_DATA);      // Data buffer for line 1 Open
   SetIndexBuffer(13,Label6Buffer2,INDICATOR_DATA);      // Data buffer for line 2 High
   SetIndexBuffer(14,Label6Buffer3,INDICATOR_DATA);      // Data buffer for line 3 Low
   SetIndexBuffer(15,Label6Buffer4,INDICATOR_DATA);      // Data buffer for line 4 Close
   SetIndexBuffer(16,Label6Colors,INDICATOR_COLOR_INDEX);// Buffer of color indexes

//--- Hode  the specified plot buffer in the data window
   PlotIndexSetInteger(0,PLOT_SHOW_DATA,true);
   PlotIndexSetInteger(1,PLOT_SHOW_DATA,true);
   PlotIndexSetInteger(2,PLOT_SHOW_DATA,true);
   PlotIndexSetInteger(3,PLOT_SHOW_DATA,true);
   PlotIndexSetInteger(4,PLOT_SHOW_DATA,true);
   PlotIndexSetInteger(5,PLOT_SHOW_DATA,true);
   PlotIndexSetInteger(hide_index,PLOT_SHOW_DATA,false);
   return(INIT_SUCCEEDED);
  }
//+------------------------------------------------------------------+
//| Custom indicator iteration function                              |
//+------------------------------------------------------------------+
int OnCalculate(const int rates_total,
                const int prev_calculated,
                const datetime &time[],
                const double &open[],
                const double &high[],
                const double &low[],
                const double &close[],
                const long &tick_volume[],
                const long &volume[],
                const int &spread[])
  {

//--- return value of prev_calculated for the next call
   return(rates_total);
  }
//+------------------------------------------------------------------+
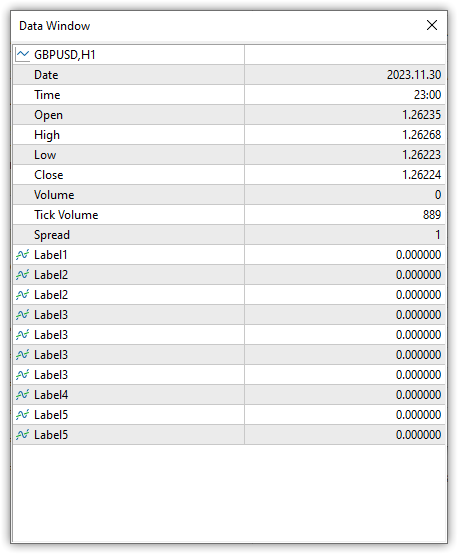
Wenn wir in den Einstellungen den Puffer 0 einstellen, der einer Grafikzeitreihe mit dem Namen Label1 entspricht, wird dieser Puffer im Datenfenster nicht angezeigt:
Wir können sehen, dass die Datenliste mit einem Puffer namens Label2 beginnt.
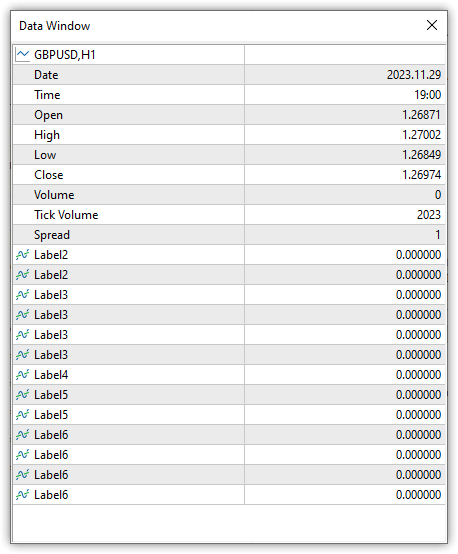
Wenn wir in den Indikatoreinstellungen 5 eingeben, wird der Puffer mit dem Namen Label6 aus dem Datenfenster ausgeblendet:
Unabhängig davon, wie viele Arrays im Indikator für die Erstellung von Grafikreihen zugewiesen werden, müssen wir daher die folgenden Faktoren berücksichtigen:
- Um die Eigenschaften von Grafikzeitreihen gezielt zu ändern, müssen wir auf den Index des gewünschten Zeichnungspuffers zugreifen und nicht auf den Index der Arrays, die zur Konstruktion dieser Serien zugewiesen wurden.
- Um Puffer mit verschiedenen Zeichenstilen zu erstellen, benötigen wir ein bis fünf Arrays, die als Indikatorpuffer festgelegt werden.
- Alle zu einem Zeichnungspuffer gehörenden Arrays müssen in strikter Reihenfolge nacheinander erscheinen. Sie dürfen nicht mit anderen Arrays gemischt werden, die für die Erstellung anderer Grafikzeitreihen festgelegt wurden.
- Das Array mit den Farbindizes in der Liste der Arrays, die einem Zeichnungspuffer zugeordnet sind, ist das letzte Array.
Auf der Grundlage der obigen Ausführungen verstehen wir, dass die Struktur der Puffer von Multi-Symbol-Multi-Perioden-Indikatoren verbessert werden muss. Jetzt werden wir fünf Arrays in der Struktur deklarieren: vier Arrays zum Speichern von Pufferdaten und ein fünftes zum Speichern von Farbindizes. Verschiedene Arten der Zeichnung von Indikatorlinien können die Verwendung von einem bis fünf Doppelarrays erfordern. Alle diese Arrays werden in der Pufferstruktur deklariert, und nur die für einen bestimmten Indikator benötigten Arrays werden verwendet. Dementsprechend müssen Sie beim Zugriff auf Pufferdaten neben dem Index dieses Puffers auch die Nummer (Index) des gewünschten Arrays angeben. Es ist nicht sehr bequem, ständig den Index des gewünschten Puffers und den Index des gewünschten Arrays anzugeben, da die meisten Indikator-Konstruktionen in Standard-Indikatoren auf einem Single-Array-Puffer basieren und man immer Null als zweiten Index angeben müsste. Aber später, nachdem wir alle Indikatoren in mehreren Versionen erstellt und getestet haben, werden wir den Klassen der einzelnen Indikatoren Methoden hinzufügen, um die erforderlichen Daten aus dem erforderlichen Puffer und Array zu erhalten. Dies wird zu einem späteren Zeitpunkt geschehen. Fahren wir zunächst mit der Struktur der Indikatorpuffer fort.
Erweiterung der Klassen
Um zu vermeiden, dass man den Überblick darüber behalten muss, wie viele Arrays der Zeichnungspuffer des Indikators für seinen Aufbau benötigt, werden wir den Empfang von Daten aus der grafischen Reihe so implementieren, dass nur auf den Index des Zeichnungspuffers und auf den Index des gewünschten Arrays zugegriffen wird. Das heißt, wenn der Puffer 0 auf zwei Daten-Arrays und ein Array mit Farbindizes gezeichnet wird, dann müssen wir, um Daten aus dem ersten Array anzufordern, einfach den Index des Zeichnungspuffers und den Index des gewünschten Arrays angeben, zum Beispiel 0 und 0. Wenn wir Daten aus dem zweiten Array benötigen, geben wir 0 und 1 an. Um Daten aus dem Farbpuffer abzufragen, erstellen wir die entsprechenden Methoden und geben nur den Index des Zeichnungspuffers (0) an.
Auf diese Weise müssen wir uns die Indizes der den Indikatorpuffern zugewiesenen Arrays nicht merken. Sie werden in der Klasse gespeichert und geben Daten zurück, die auf dem Index der Grafikreihe und dem erforderlichen Array basieren. Es wird also wahrscheinlich etwas einfacher sein, Daten zu erhalten, indem man sie nur auf der Grundlage der Indizes von Zeichnungspuffern abfragt. Etwas später werden wir für jede Klasse jedes Standardindikators Methoden erstellen, die Daten aus dem gewünschten Array zurückgeben. Dadurch wird es noch einfacher, Daten von Multi-Indikator-Puffern zu erhalten und ihre Linien in das Chart einzuzeichnen.
Alle Änderungen werden in der Bibliotheksdatei \MQL5\Include\IndMSTF\IndMSTF.mqh vorgenommen.
Auch die Struktur des Indikatorpuffers wird in der Bibliotheksdatei umgestaltet. Wir werden einige Funktionen in einen privaten Bereich verschieben, da der Zugriff auf sie von außen nicht erforderlich ist. Zuvor haben wir nur ein Array initialisiert und dessen Größe geändert, jetzt werden es fünf sein. Daher verarbeiten die Initialisierungs- und Größenänderungsfunktionen nun alle fünf Arrays. Die erforderliche Anzahl von Feldern wird entsprechend dem für den Puffer eingestellten Zeichenstil ausgewählt, da der Stil die erforderliche Anzahl von Feldern für den Aufbau einer Grafikreihe bestimmt. Der Zeichenstil wird bei der Erstellung des Indikators auf die Pufferstruktur gesetzt. Wir werden auch den Index des Quellarrays des Indikators in die Pufferstruktur schreiben, sodass wir anhand dieses Indexes genau wissen, aus welchem Puffer des Quellindikators die Daten kopiert werden.
//--- struct struct SBuffer // Structure of the indicator buffer { private: double init_value; // Initializing value uchar init_color_idx; // Initializing value of the color index int shift; // Horizontal shift of the buffer uint source; // Buffer number of the source indicator bool colored; // Flag of the color buffer ENUM_DRAW_TYPE draw_type; // Buffer drawing style //--- Changes the size of all arrays bool ResizeArrays(const int new_size) { bool res=true; switch(draw_type) { //--- One buffer case DRAW_LINE : case DRAW_HISTOGRAM : case DRAW_ARROW : case DRAW_SECTION : return ArrayResize(array0,new_size)==new_size; //--- Two buffers case DRAW_HISTOGRAM2 : case DRAW_ZIGZAG : case DRAW_FILLING : res =(ArrayResize(array0,new_size)==new_size); res &=(ArrayResize(array1,new_size)==new_size); return res; //--- Four buffers case DRAW_BARS : case DRAW_CANDLES : res =(ArrayResize(array0,new_size)==new_size); res &=(ArrayResize(array1,new_size)==new_size); res &=(ArrayResize(array2,new_size)==new_size); res &=(ArrayResize(array3,new_size)==new_size); return res; //--- One buffer + color buffer case DRAW_COLOR_LINE : case DRAW_COLOR_HISTOGRAM : case DRAW_COLOR_ARROW : case DRAW_COLOR_SECTION : res =(ArrayResize(array0,new_size)==new_size); res &=(ArrayResize(color_indexes,new_size)==new_size); return res; //--- Two buffers + color buffer case DRAW_COLOR_HISTOGRAM2 : case DRAW_COLOR_ZIGZAG : res =(ArrayResize(array0,new_size)==new_size); res &=(ArrayResize(array1,new_size)==new_size); res &=(ArrayResize(color_indexes,new_size)==new_size); return res; //--- Four buffers + color buffer case DRAW_COLOR_BARS : case DRAW_COLOR_CANDLES : res =(ArrayResize(array0,new_size)==new_size); res &=(ArrayResize(array1,new_size)==new_size); res &=(ArrayResize(array2,new_size)==new_size); res &=(ArrayResize(array3,new_size)==new_size); res &=(ArrayResize(color_indexes,new_size)==new_size); return res; //---DRAW_NONE default: break; } return false; } //--- Initializes all arrays int InitArrays(void) { bool res=0; switch(draw_type) { //--- One buffer case DRAW_LINE : case DRAW_HISTOGRAM : case DRAW_ARROW : case DRAW_SECTION : return ArrayInitialize(array0,init_value); //--- Two buffers case DRAW_HISTOGRAM2 : case DRAW_ZIGZAG : case DRAW_FILLING : res+=ArrayInitialize(array0,init_value); res+=ArrayInitialize(array1,init_value); return res/2; //--- Four buffers case DRAW_BARS : case DRAW_CANDLES : res+=ArrayInitialize(array0,init_value); res+=ArrayInitialize(array1,init_value); res+=ArrayInitialize(array2,init_value); res+=ArrayInitialize(array3,init_value); return res/4; //--- One buffer + color buffer case DRAW_COLOR_LINE : case DRAW_COLOR_HISTOGRAM : case DRAW_COLOR_ARROW : case DRAW_COLOR_SECTION : res+=ArrayInitialize(array0,init_value); res+=ArrayInitialize(color_indexes,init_color_idx); return res/2; //--- Two buffers + color buffer case DRAW_COLOR_HISTOGRAM2 : case DRAW_COLOR_ZIGZAG : res+=ArrayInitialize(array0,init_value); res+=ArrayInitialize(array1,init_value); res+=ArrayInitialize(color_indexes,init_color_idx); return res/3; //--- Four buffers + color buffer case DRAW_COLOR_BARS : case DRAW_COLOR_CANDLES : res+=ArrayInitialize(array0,init_value); res+=ArrayInitialize(array1,init_value); res+=ArrayInitialize(array2,init_value); res+=ArrayInitialize(array3,init_value); res+=ArrayInitialize(color_indexes,init_color_idx); return res/5; //---DRAW_NONE default: break; } return false; } public: double array0[]; // Indicator's buffer-array0 double array1[]; // Indicator's buffer-array1 (2nd array for calculation) double array2[]; // Indicator's buffer-array2 (3rd array for calculation) double array3[]; // Indicator's buffer-array3 (4th array for calculation) double color_indexes[]; // Buffer array of indicator color indexes color clrs[]; // Array of colors assigned to the buffer string descript; // Buffer description //--- Returns the color buffer flag bool IsColoredBuffer(void) { return colored; } //--- (1) Sets, (2) returns the buffer drawing style, (3) the number of the corresponding buffer of the source indicator void SetBufferDrawType(const ENUM_DRAW_TYPE type,const uint buff_source) { draw_type=type; source=buff_source; switch(draw_type) { case DRAW_COLOR_LINE : case DRAW_COLOR_SECTION : case DRAW_COLOR_HISTOGRAM : case DRAW_COLOR_HISTOGRAM2 : case DRAW_COLOR_ARROW : case DRAW_COLOR_ZIGZAG : case DRAW_COLOR_BARS : case DRAW_COLOR_CANDLES : colored=true; break; default : colored=false; break; } } ENUM_DRAW_TYPE DrawType(void) { return draw_type; } uint BufferFrom(void) { return source; } //--- (1) Sets, (2) returns the initializing value void SetInitValue(const double value) { init_value=value; } double InitValue(void) { return init_value; } //--- (1) Sets, (2) returns the initializing value of the color index void SetInitColorIdx(const uchar idx) { init_color_idx=idx; } uchar InitColorIdx(void) { return init_color_idx; } //--- (1) Sets, (2) returns the buffer offset void SetShift(const int value) { shift=value; } int Shift(void) { return shift; } //--- (1) Returns the size of the buffer array, (2) changes the size of the buffer array, //--- (3) initializes the array with the set "empty" value uint BufferSize(void) { return array0.Size(); } bool BuffResize(const int new_size) { return ResizeArrays(new_size); } int InitBuffer(void) { return InitArrays(); } //--- (1) Returns the size of the color index buffer array, uint BufferColorIdxSize(void) { return color_indexes.Size(); } //--- (1) Sets, (2) returns the color value by index void SetColorToIdx(const uchar idx,const color clr) { if(idx>(int)clrs.Size()-1) { ResetLastError(); if(ArrayResize(clrs,idx+1)!=idx+1) { PrintFormat("%s: ArrayResize 'clrs' failed. Error %lu",__FUNCTION__,GetLastError()); return; } } clrs[idx]=clr; } color ColorByIdx(const uchar idx){ return(idx<clrs.Size() ? clrs[idx] : clrNONE); } };
Zuvor wurden Arrays in der Indikatorberechnungsmethode Calculate() kopiert. Da nun mehr als ein Array kopiert werden muss, wurden neue Methoden geschaffen, die das Ergebnis des Kopierens aller für die Berechnung verwendeten Arrays zurückgeben. In der Multi-Indikator-Klasse deklarieren wir neue Methoden und fügen den Index des gewünschten Arrays zu den Datenabrufmethoden hinzu.
//+------------------------------------------------------------------+
//| Base class of the multi-symbol multi-period indicator            |
//+------------------------------------------------------------------+
class CIndMSTF : public CObject
  {
private:
   ENUM_PROGRAM_TYPE m_program;           // Program type
   ENUM_INDICATOR    m_type;              // Indicator type
   ENUM_TIMEFRAMES   m_timeframe;         // Chart timeframe
   string            m_symbol;            // Chart symbol
   int               m_handle;            // Indicator handle
   int               m_id;                // Identifier
   bool              m_success;           // Successful calculation flag
   ENUM_ERR_TYPE     m_type_err;          // Calculation error type
   string            m_description;       // Custom description of the indicator
   string            m_name;              // Indicator name
   string            m_parameters;        // Description of indicator parameters

protected:
   ENUM_IND_CATEGORY m_category;          // Indicator category
   MqlParam          m_param[];           // Array of indicator parameters
   string            m_title;             // Title (indicator name + description of parameters)
   SBuffer           m_buffers[];         // Indicator buffers
   int               m_digits;            // Digits in indicator values
   int               m_limit;             // Number of bars required to calculate the indicator on the current tick
   int               m_rates_total;       // Number of available bars for indicator calculation
   int               m_prev_calculated;   // Number of calculated bars on the previous indicator call

//--- (1) Sets indicator name, (2) description of parameters
   void              SetName(const string name)                      { this.m_name=name;           }
   void              SetParameters(const string str)                 { this.m_parameters=str;      }

//--- Resizes the (1) specified, (2) all indicator buffers
   bool              BufferResize(const uint buffer_num,const int new_buff_size);
   bool              BuffersResize(const int new_buff_size);
//--- Initializes the (1) specified, (2) all indicator buffers
   bool              BufferInitialize(const uint buffer_num,const int new_buff_size);
   bool              BuffersInitialize(const int new_buff_size);

//--- Returns the flag indicating equality of the structure of one parameter of two objects
   bool              IsEqualParameters(const MqlParam &this_param,const MqlParam &compared_param) const
                       {
                        if(this_param.type==compared_param.type                     &&
                           this_param.integer_value==compared_param.integer_value   &&
                           this_param.string_value==compared_param.string_value     &&
                           ::NormalizeDouble(this_param.double_value-compared_param.double_value,8)==0
                          ) return true;
                        return false;
                       }
//--- Return the result of comparison on one parameter of two objects
   int               CompareParams(const MqlParam &this_param,const MqlParam &compared_param)
                       {
                        if(this.IsEqualParameters(this_param,compared_param))
                           return 0;
                        else if(this_param.type>compared_param.type                 ||
                           this_param.integer_value>compared_param.integer_value    ||
                           this_param.string_value>compared_param.string_value      ||
                           this_param.double_value>compared_param.double_value
                          ) return 1;
                        else if(this_param.type<compared_param.type                 ||
                           this_param.integer_value<compared_param.integer_value    ||
                           this_param.string_value<compared_param.string_value      ||
                           this_param.double_value<compared_param.double_value
                          ) return -1;
                        else
                           return -1;
                       }
//--- Copies data of the specified array of the specified buffer
   bool              CopyArray(const uint buff_num,const uint array_num,const int to_copy,double &array[]);
//--- Copies data of all arrays of the specified buffer
   bool              CopyArrays(const uint buff_num,const int to_copy);

public:
//--- Creates the calculation part of the indicator, returns the handle
   int               CreateIndicator(void);
//--- (1) Calculates the indicator, fills the passed (2) plot buffer array, (3) buffer array of color indexes (taking into account the symbol-period of the chart) with data from the buffer of the calculation part of the indicator of this class
   bool              Calculate(void);
   bool              DataToBuffer(const string symbol_to,const ENUM_TIMEFRAMES timeframe_to,const uint buffer_num,const uint array_num,const int limit,double &buffer[]);
   bool              DataToColorBuffer(const string symbol_to,const ENUM_TIMEFRAMES timeframe_to,const uint buffer_num,const uint array_num,const int limit,double &plot_buffer[],double &color_buffer[]);

//--- (1) Sets (2) returns the initializing value for the specified buffer
   void              SetBufferInitValue(const uint buffer_num,const double value);
   double            BufferInitValue(const uint buffer_num) const;
//--- (1) Sets (2) returns the initializing value of the color index for the specified buffer
   void              SetBufferInitColorIndex(const uint buffer_num,const uchar index);
   uchar             BufferInitColorIndex(const uint buffer_num) const;
//--- (1) Sets, (2) returns the color value by index for the specified buffer
   void              SetBufferColorToIndex(const uint buffer_num,const uchar color_idx,const color clr);
   color             BufferColorByIndex(const uint buffer_num,const uchar color_idx);
   //--- Returns the color buffer flag
   bool              IsColoredBuffer(const uint buffer_num) const;

//--- (1) Sets (2) returns the offset value for the specified buffer
   void              SetBufferShift(const uint buffer_num,const int value);
   double            BufferShift(const uint buffer_num) const;

   //--- (1) Sets, (2) returns the drawing style of the specified buffer, (3) the number of the corresponding buffer of the source indicator
   void              SetBufferDrawType(const uint buffer_num,const ENUM_DRAW_TYPE type,const uint buff_source);
   ENUM_DRAW_TYPE    BufferDrawType(const uint buffer_num);
   uint              BufferFrom(const uint buffer_num);

//--- Returns data of the specified buffer and array (1) as is, (2) relative to the specified symbol/timeframe,
//--- data of the specified color buffer (3) as is, (4) relative to the specified symbol/timeframe,
//--- (5) amount of data in the specified buffer, (6) number of colors set for the buffer, (7) the state of the indicator line as it is in the calculation part buffer,
//--- (8) state of the indicator line for the chart symbol/period, description of the line state (9) as is in the buffer (10) for the specific chart symbol/period
   double            GetData(const uint buffer_num,const uint array_num,const int index)  const;
   double            GetDataTo(const string symbol_to,const ENUM_TIMEFRAMES timeframe_to,const uint buffer_num,const uint array_num,const int index) const;
   double            GetColorData(const uint buffer_num,const int index)      const;
   double            GetColorDataTo(const string symbol_to,const ENUM_TIMEFRAMES timeframe_to,const uint buffer_num,const int index) const;
   uint              DataTotal(const uint buffer_num,const uint array_num)    const;
   uint              ColorsTotal(const uint buffer_num)                       const;
   ENUM_LINE_STATE   BufferLineState(const uint buffer_num,const uint array_num,const int index)   const;
   ENUM_LINE_STATE   BufferLineState(const string symbol_from,const ENUM_TIMEFRAMES timeframes_from,const uint buffer_num,const uint array_num,const int index) const;
   ENUM_LINE_STATE   BufferLineStateRelative(const int buffer_num,const uint array_num,const int index,const double level0,const double level1=EMPTY_VALUE);
   ENUM_LINE_STATE   BufferLineStateRelative(const string symbol_from,const ENUM_TIMEFRAMES timeframes_from,const int buffer_num,const uint array_num,const int index,const double level0,const double level1=EMPTY_VALUE);

//--- Returns (1) success flag, (2) calculation error type
   bool              IsSuccess(void)                           const { return this.m_success;               }
   ENUM_ERR_TYPE     TypeError(void)                           const { return this.m_type_err;              }

//--- Sets (1) identifier, (2) Digits, (3) custom description, (4) description of the specified buffer
   void              SetID(const int id)                             { this.m_id=id;                        }
   void              SetDigits(const uint digits)                    { this.m_digits=(int)digits;           }
   void              SetDescription(const string descr)              { this.m_description=descr;            }
   void              SetBufferDescription(const uint buffer_num,const string descr);

//--- Sets the indexing of buffer arrays of the calculation part not as in the timeseries
   void              SetAsSeriesOff(void);
//--- Returns flag of whether the buffer is set as series, (2) historical data for symbol/period is synchronized
   bool              IsSeries(const uint buffer_num,const uint array_num) const;
   bool              IsSynchronized(void) const
                       {
                        return (bool)::SeriesInfoInteger(this.m_symbol,this.m_timeframe,SERIES_SYNCHRONIZED);
                       }

//--- Returns (1) timeframe, (2) symbol, (3) name, (4) list of parameters, (5) handle, (6) Digits
//--- number of (7) buffers, (8) bars, (9) identifier, (10) description, (11) title, (12) category,
//--- (13) number of parameters, (14) program type, description of (15) category, (16) indicator buffer
   ENUM_TIMEFRAMES   Timeframe(void)                           const { return this.m_timeframe;             }
   string            Symbol(void)                              const { return this.m_symbol;                }
   string            Name(void)                                const { return this.m_name;                  }
   string            Parameters(void)                          const { return this.m_parameters;            }
   int               Handle(void)                              const { return this.m_handle;                }
   int               Digits(void)                              const { return this.m_digits;                }
   uint              BuffersTotal(void)                        const { return this.m_buffers.Size();        }
   uint              RatesTotal(void)                          const { return this.m_rates_total;           }
   int               ID(void)                                  const { return this.m_id;                    }
   string            Description(void)                         const { return this.m_description;           }
   string            Title(void)                               const { return this.m_title;                 }
   ENUM_IND_CATEGORY Category(void)                            const { return this.m_category;              }
   uint              ParamsTotal(void)                         const { return this.m_param.Size();          }
   ENUM_PROGRAM_TYPE Program(void)                             const { return this.m_program;               }
   string            CategoryDescription(void);
   string            BufferDescription(const uint buffer_num);

//--- Returns (1) structure of parameters by index from array, (2) flag of indicator program, (3) timeframe description
   MqlParam          GetMqlParam(const int index)              const { return this.m_param[index];          }
   bool              IsIndicator()                 const { return(this.Program()==PROGRAM_INDICATOR);       }
   string            TimeframeDescription(void)    const
                       {
                        return ::StringSubstr(::EnumToString(this.m_timeframe),7);
                       }
//--- Returns amount of calculated data
   int               Calculated(void)                          const { return ::BarsCalculated(this.m_handle); }

//--- Virtual method returning the type of object (indicator)
   virtual int       Type(void)                                const { return this.m_type;                  }
//--- Virtual method for comparing two objects
   virtual int       Compare(const CObject *node,const int mode=0) const
                       {
                        const CIndMSTF *compared=node;
                        switch(mode)
                          {
                           case COMPARE_MODE_ID          : return(this.ID()>compared.ID()                   ? 1 : this.ID()<compared.ID()                   ? -1 : 0);
                           case COMPARE_MODE_HANDLE      : return(this.Handle()>compared.Handle()           ? 1 : this.Handle()<compared.Handle()           ? -1 : 0);
                           case COMPARE_MODE_CATEGORY    : return(this.Category()>compared.Category()       ? 1 : this.Category()<compared.Category()       ? -1 : 0);
                           case COMPARE_MODE_SYMBOL      : return(this.Symbol()>compared.Symbol()           ? 1 : this.Symbol()<compared.Symbol()           ? -1 : 0);
                           case COMPARE_MODE_TIMEFRAME   : return(this.Timeframe()>compared.Timeframe()     ? 1 : this.Timeframe()<compared.Timeframe()     ? -1 : 0);
                           case COMPARE_MODE_DESCRIPTION : return(this.Description()>compared.Description() ? 1 : this.Description()<compared.Description() ? -1 : 0);
                           //--- Equality of all object parameters
                           default                       : return(this.IsEqualIndicators(compared) ? 0 : -1);
                          }
                       }
//--- Returns the flag of equality of parameters of two indicator objects
   bool              IsEqualIndicators(const CIndMSTF *compared) const
                       {
                        if(this.Type()!=compared.Type() || this.ParamsTotal()!=compared.ParamsTotal())
                           return false;
                        bool res=true;
                        int total=(int)this.ParamsTotal();
                        for(int i=0;i<total;i++)
                           res &=this.IsEqualParameters(this.m_param[i],compared.GetMqlParam(i));
                        res &=(this.Timeframe()==compared.Timeframe());
                        res &=(this.Symbol()==compared.Symbol());
                        return res;
                       }
//--- Timer
   void OnTimer(void);

//--- Constructor/destructor
                     CIndMSTF(){}
                     CIndMSTF(const ENUM_INDICATOR type,const uint buffers,const string symbol,const ENUM_TIMEFRAMES timeframe);
                    ~CIndMSTF();
  };
Im Destruktor der Klasse geben wir den Speicher aller Arrays der Indikatorpuffern frei:
//+------------------------------------------------------------------+
//| Destructor                                                       |
//+------------------------------------------------------------------+
CIndMSTF::~CIndMSTF()
  {
//--- Delete timer
   ::EventKillTimer();
//--- Release handle of the indicator
   ::ResetLastError();
   if(this.m_handle!=INVALID_HANDLE && !::IndicatorRelease(this.m_handle))
      ::PrintFormat("%s: %s, handle %ld IndicatorRelease failed. Error %ld",__FUNCTION__,this.Title(),m_handle,::GetLastError());
//--- Free up the memory of buffer arrays
   for(int i=0;i<(int)this.BuffersTotal();i++)
     {
      ::ArrayFree(this.m_buffers[i].array0);
      ::ArrayFree(this.m_buffers[i].array1);
      ::ArrayFree(this.m_buffers[i].array2);
      ::ArrayFree(this.m_buffers[i].array3);
      ::ArrayFree(this.m_buffers[i].color_indexes);
     }
  }
Implementierung der neu deklarierten Methoden:
//+------------------------------------------------------------------+
//| Set the initializing value of the color index                    |
//| for the specified buffer                                         |
//+------------------------------------------------------------------+
void CIndMSTF::SetBufferInitColorIndex(const uint buffer_num,const uchar index)
  {
//--- Validate the buffer number passed to the method and, if the number is incorrect, print a message to the log and exit
   if(buffer_num>this.BuffersTotal()-1)
     {
      string buff_limit=(this.BuffersTotal()==1 ? "0" : "0 - "+string(this.BuffersTotal()-1));
      ::PrintFormat("%s: Invalid buffer number passed (%lu). Value must be %s",__FUNCTION__,buffer_num,buff_limit);
      return;
     }
//--- Set a new initializing color index value for the specified buffer
   this.m_buffers[buffer_num].SetInitColorIdx(index);
  }
//+------------------------------------------------------------------+
//| Return the initializing value of the color index                 |
//| for the specified buffer                                         |
//+------------------------------------------------------------------+
uchar CIndMSTF::BufferInitColorIndex(const uint buffer_num) const
  {
//--- Validate the buffer number passed to the method and, if the number is incorrect, print a message to log
   if(buffer_num>this.BuffersTotal()-1)
     {
      string buff_limit=(this.BuffersTotal()==1 ? "0" : "0 - "+string(this.BuffersTotal()-1));
      ::PrintFormat("%s: Invalid buffer number passed (%lu). Value must be %s",__FUNCTION__,buffer_num,buff_limit);
      //--- If the indicator has buffers, return the initializing value of the color index of the very first one, otherwise 0
      return uchar(this.BuffersTotal()>0 ? this.m_buffers[0].InitColorIdx() : 0);
     }
//--- Return the initializing value of the color index of the requested buffer
   return this.m_buffers[buffer_num].InitColorIdx();
  }
//+------------------------------------------------------------------+
//| Set the color value by index for the specified buffer            |
//+------------------------------------------------------------------+
void CIndMSTF::SetBufferColorToIndex(const uint buffer_num,const uchar color_idx,const color clr)
  {
//--- Validate the buffer number passed to the method and, if the number is incorrect, print a message to the log and exit
   if(buffer_num>this.BuffersTotal()-1)
     {
      string buff_limit=(this.BuffersTotal()==1 ? "0" : "0 - "+string(this.BuffersTotal()-1));
      ::PrintFormat("%s: Invalid buffer number passed (%lu). Value must be %s",__FUNCTION__,buffer_num,buff_limit);
      return;
     }
//--- Set a new color value by index for the specified buffer
   this.m_buffers[buffer_num].SetColorToIdx(color_idx,clr);
  }
//+------------------------------------------------------------------+
//| Return the color value by index for the specified buffer         |
//+------------------------------------------------------------------+
color CIndMSTF::BufferColorByIndex(const uint buffer_num,const uchar color_idx)
  {
//--- Validate the buffer number passed to the method and, if the number is incorrect, print a message to log
   if(buffer_num>this.BuffersTotal()-1)
     {
      string buff_limit=(this.BuffersTotal()==1 ? "0" : "0 - "+string(this.BuffersTotal()-1));
      ::PrintFormat("%s: Invalid buffer number passed (%lu). Value must be %s",__FUNCTION__,buffer_num,buff_limit);
      //--- If the indicator has buffers, return the initializing value of the color index of the very first one, otherwise 0
      return clrNONE;
     }
//--- Return the color value by index for the requested buffer
   return this.m_buffers[buffer_num].ColorByIdx(color_idx);
  }
//+------------------------------------------------------------------+
//| Return the color buffer flag                                     |
//+------------------------------------------------------------------+
bool CIndMSTF::IsColoredBuffer(const uint buffer_num) const
  {
//--- Validate the buffer number passed to the method and, if the number is incorrect, print a message to log
   if(buffer_num>this.BuffersTotal()-1)
     {
      string buff_limit=(this.BuffersTotal()==1 ? "0" : "0 - "+string(this.BuffersTotal()-1));
      ::PrintFormat("%s: Invalid buffer number passed (%lu). Value must be %s",__FUNCTION__,buffer_num,buff_limit);
      //--- Return false
      return false;
     }
//--- Return the color flag for the specified buffer
   return this.m_buffers[buffer_num].IsColoredBuffer();
  }

//+------------------------------------------------------------------+
//| Set the drawing style for the specified buffer                   |
//+------------------------------------------------------------------+
void CIndMSTF::SetBufferDrawType(const uint buffer_num,const ENUM_DRAW_TYPE type,const uint buff_source)
  {
//--- Validate the buffer number passed to the method and, if the number is incorrect, print a message to the log and exit
   if(buffer_num>this.BuffersTotal()-1)
     {
      string buff_limit=(this.BuffersTotal()==1 ? "0" : "0 - "+string(this.BuffersTotal()-1));
      ::PrintFormat("%s: Invalid buffer number passed (%lu). Value must be %s",__FUNCTION__,buffer_num,buff_limit);
      return;
     }
//--- Set the drawing style for the buffer
   this.m_buffers[buffer_num].SetBufferDrawType(type,buff_source);
  }
//+------------------------------------------------------------------+
//| Return the drawing style for the specified buffer                |
//+------------------------------------------------------------------+
ENUM_DRAW_TYPE CIndMSTF::BufferDrawType(const uint buffer_num)
  {
//--- Validate the buffer number passed to the method and, if the number is incorrect, print a message to log
   if(buffer_num>this.BuffersTotal()-1)
     {
      string buff_limit=(this.BuffersTotal()==1 ? "0" : "0 - "+string(this.BuffersTotal()-1));
      ::PrintFormat("%s: Invalid buffer number passed (%lu). Value must be %s",__FUNCTION__,buffer_num,buff_limit);
      //--- If the indicator has buffers, return the shift value of the very first one, otherwise 0
      return(this.BuffersTotal()>0 ? this.m_buffers[0].DrawType() : DRAW_NONE);
     }
//--- Return the drawing style of the requested buffer
   return this.m_buffers[buffer_num].DrawType();
  }
//+------------------------------------------------------------------+
//| Return number of corresponding buffer of the source indicator    |
//+------------------------------------------------------------------+
uint CIndMSTF::BufferFrom(const uint buffer_num)
  {
//--- Validate the buffer number passed to the method and, if the number is incorrect, print a message to log
   if(buffer_num>this.BuffersTotal()-1)
     {
      string buff_limit=(this.BuffersTotal()==1 ? "0" : "0 - "+string(this.BuffersTotal()-1));
      ::PrintFormat("%s: Invalid buffer number passed (%lu). Value must be %s",__FUNCTION__,buffer_num,buff_limit);
      //--- If the indicator has buffers, return the shift value of the very first one, otherwise 0
      return(this.BuffersTotal()>0 ? this.m_buffers[0].Shift() : 0);
     }
//--- Return the number of the corresponding buffer of the source indicator for the requested buffer
   return this.m_buffers[buffer_num].BufferFrom();
  }
//+------------------------------------------------------------------+
//| Copy data of the specified array of the specified buffer         |
//+------------------------------------------------------------------+
bool CIndMSTF::CopyArray(const uint buff_num,const uint array_num,const int to_copy,double &array[])
  {
   ::ResetLastError();
//--- Copy either the last two bars to 'array' or all available historical data from indicator's calculation part array to buffer array of indicator object
   int copied=0;
   if(to_copy==2)
     {
      switch(array_num)
        {
         case 0   :  case 1 : case 2 :
         case 3   :  copied=::CopyBuffer(this.m_handle,this.m_buffers[buff_num].BufferFrom(),  -this.m_buffers[buff_num].Shift(),to_copy,array);   break;
         case 4   :  copied=::CopyBuffer(this.m_handle,this.m_buffers[buff_num].BufferFrom()+1,-this.m_buffers[buff_num].Shift(),to_copy,array);   break;
         default  :  break;
        }
     }
   else
     {
      switch(array_num)
        {
         case 0   :  copied=::CopyBuffer(this.m_handle,this.m_buffers[buff_num].BufferFrom(),  -this.m_buffers[buff_num].Shift(),to_copy,this.m_buffers[buff_num].array0);          break;
         case 1   :  copied=::CopyBuffer(this.m_handle,this.m_buffers[buff_num].BufferFrom(),  -this.m_buffers[buff_num].Shift(),to_copy,this.m_buffers[buff_num].array1);          break;
         case 2   :  copied=::CopyBuffer(this.m_handle,this.m_buffers[buff_num].BufferFrom(),  -this.m_buffers[buff_num].Shift(),to_copy,this.m_buffers[buff_num].array2);          break;
         case 3   :  copied=::CopyBuffer(this.m_handle,this.m_buffers[buff_num].BufferFrom(),  -this.m_buffers[buff_num].Shift(),to_copy,this.m_buffers[buff_num].array3);          break;
         case 4   :  copied=::CopyBuffer(this.m_handle,this.m_buffers[buff_num].BufferFrom()+1,-this.m_buffers[buff_num].Shift(),to_copy,this.m_buffers[buff_num].color_indexes);   break;
         default  :  break;
        }
     }
//--- If copied successfully
   if(copied>0)
      return true;
//--- If not all data is copied
//--- If CopyBuffer returned -1, this means the start of historical data downloading
//--- print a message about this to the log
   if(copied==WRONG_VALUE)
      ::PrintFormat("%s::%s: Start downloading data by %s/%s. Waiting for the next tick...",__FUNCTION__,this.Title(),this.m_symbol,this.TimeframeDescription());
//--- In any other case, not all data has been copied yet
//--- print a message about this to the log
   else
      ::PrintFormat("%s::%s: Not all data was copied. Data available: %lu, total copied: %ld",__FUNCTION__,this.Title(),this.m_rates_total,copied);
   return false;
  }
//+------------------------------------------------------------------+
//| Copy data of all arrays of the specified buffer                  |
//+------------------------------------------------------------------+
bool CIndMSTF::CopyArrays(const uint buff_num,const int to_copy)
  {
   bool res=true;
   double array[2];
   if(to_copy==2)
     {
      switch(this.BufferDrawType(buff_num))
        {
         //--- One buffer
         case DRAW_LINE             :
         case DRAW_HISTOGRAM        :
         case DRAW_ARROW            :
         case DRAW_SECTION          :
            res=this.CopyArray(buff_num,0,to_copy,array);
            if(res)
              {
               this.m_buffers[buff_num].array0[this.DataTotal(buff_num,0)-1]=array[1];
               this.m_buffers[buff_num].array0[this.DataTotal(buff_num,0)-2]=array[0];
              }
            return res;
         //--- Two buffers
         case DRAW_HISTOGRAM2       :
         case DRAW_ZIGZAG           :
         case DRAW_FILLING          :
            res=this.CopyArray(buff_num,0,to_copy,array);
            if(res)
              {
               this.m_buffers[buff_num].array0[this.DataTotal(buff_num,0)-1]=array[1];
               this.m_buffers[buff_num].array0[this.DataTotal(buff_num,0)-2]=array[0];
              }
            res &=this.CopyArray(buff_num,1,to_copy,array);
            if(res)
              {
               this.m_buffers[buff_num].array1[this.DataTotal(buff_num,1)-1]=array[1];
               this.m_buffers[buff_num].array1[this.DataTotal(buff_num,1)-2]=array[0];
              }
            return res;
         //--- Four buffers
         case DRAW_BARS             :
         case DRAW_CANDLES          :
            res=this.CopyArray(buff_num,0,to_copy,array);
            if(res)
              {
               this.m_buffers[buff_num].array0[this.DataTotal(buff_num,0)-1]=array[1];
               this.m_buffers[buff_num].array0[this.DataTotal(buff_num,0)-2]=array[0];
              }
            res &=this.CopyArray(buff_num,1,to_copy,array);
            if(res)
              {
               this.m_buffers[buff_num].array1[this.DataTotal(buff_num,1)-1]=array[1];
               this.m_buffers[buff_num].array1[this.DataTotal(buff_num,1)-2]=array[0];
              }
            res &=this.CopyArray(buff_num,2,to_copy,array);
            if(res)
              {
               this.m_buffers[buff_num].array2[this.DataTotal(buff_num,2)-1]=array[1];
               this.m_buffers[buff_num].array2[this.DataTotal(buff_num,2)-2]=array[0];
              }
            res &=this.CopyArray(buff_num,3,to_copy,array);
            if(res)
              {
               this.m_buffers[buff_num].array3[this.DataTotal(buff_num,3)-1]=array[1];
               this.m_buffers[buff_num].array3[this.DataTotal(buff_num,3)-2]=array[0];
              }
            return res;
         //--- One buffer + color buffer
         case DRAW_COLOR_LINE       :
         case DRAW_COLOR_HISTOGRAM  :
         case DRAW_COLOR_ARROW      :
         case DRAW_COLOR_SECTION    :
            res=this.CopyArray(buff_num,0,to_copy,array);
            if(res)
              {
               this.m_buffers[buff_num].array0[this.DataTotal(buff_num,0)-1]=array[1];
               this.m_buffers[buff_num].array0[this.DataTotal(buff_num,0)-2]=array[0];
              }
            res &=this.CopyArray(buff_num,4,to_copy,array);
            if(res)
              {
               this.m_buffers[buff_num].color_indexes[this.DataTotal(buff_num,4)-1]=array[1];
               this.m_buffers[buff_num].color_indexes[this.DataTotal(buff_num,4)-2]=array[0];
              }
            return res;
         //--- Two buffers + color buffer
         case DRAW_COLOR_HISTOGRAM2 :
         case DRAW_COLOR_ZIGZAG     :
            res=this.CopyArray(buff_num,0,to_copy,array);
            if(res)
              {
               this.m_buffers[buff_num].array0[this.DataTotal(buff_num,0)-1]=array[1];
               this.m_buffers[buff_num].array0[this.DataTotal(buff_num,0)-2]=array[0];
              }
            res &=this.CopyArray(buff_num,1,to_copy,array);
            if(res)
              {
               this.m_buffers[buff_num].array1[this.DataTotal(buff_num,1)-1]=array[1];
               this.m_buffers[buff_num].array1[this.DataTotal(buff_num,1)-2]=array[0];
              }
            res &=this.CopyArray(buff_num,4,to_copy,array);
            if(res)
              {
               this.m_buffers[buff_num].color_indexes[this.DataTotal(buff_num,4)-1]=array[1];
               this.m_buffers[buff_num].color_indexes[this.DataTotal(buff_num,4)-2]=array[0];
              }
            return res;
         //--- Four buffers + color buffer
         case DRAW_COLOR_BARS       :
         case DRAW_COLOR_CANDLES    :
            res=this.CopyArray(buff_num,0,to_copy,array);
            if(res)
              {
               this.m_buffers[buff_num].array0[this.DataTotal(buff_num,0)-1]=array[1];
               this.m_buffers[buff_num].array0[this.DataTotal(buff_num,0)-2]=array[0];
              }
            res &=this.CopyArray(buff_num,1,to_copy,array);
            if(res)
              {
               this.m_buffers[buff_num].array1[this.DataTotal(buff_num,1)-1]=array[1];
               this.m_buffers[buff_num].array1[this.DataTotal(buff_num,1)-2]=array[0];
              }
            res &=this.CopyArray(buff_num,2,to_copy,array);
            if(res)
              {
               this.m_buffers[buff_num].array2[this.DataTotal(buff_num,2)-1]=array[1];
               this.m_buffers[buff_num].array2[this.DataTotal(buff_num,2)-2]=array[0];
              }
            res &=this.CopyArray(buff_num,3,to_copy,array);
            if(res)
              {
               this.m_buffers[buff_num].array3[this.DataTotal(buff_num,3)-1]=array[1];
               this.m_buffers[buff_num].array3[this.DataTotal(buff_num,3)-2]=array[0];
              }
            res &=this.CopyArray(buff_num,4,to_copy,array);
            if(res)
              {
               this.m_buffers[buff_num].color_indexes[this.DataTotal(buff_num,4)-1]=array[1];
               this.m_buffers[buff_num].color_indexes[this.DataTotal(buff_num,4)-2]=array[0];
              }
            return res;
         //---DRAW_NONE
         default:
           break;
        }
     }
   else
     {
      switch(this.BufferDrawType(buff_num))
        {
         //--- One buffer
         case DRAW_LINE             :
         case DRAW_HISTOGRAM        :
         case DRAW_ARROW            :
         case DRAW_SECTION          :
            return this.CopyArray(buff_num,0,to_copy,array);
         //--- Two buffers
         case DRAW_HISTOGRAM2       :
         case DRAW_ZIGZAG           :
         case DRAW_FILLING          :
            res  =this.CopyArray(buff_num,0,to_copy,array);
            res &=this.CopyArray(buff_num,1,to_copy,array);
            return res;
         //--- Four buffers
         case DRAW_BARS             :
         case DRAW_CANDLES          :
            res  =this.CopyArray(buff_num,0,to_copy,array);
            res &=this.CopyArray(buff_num,1,to_copy,array);
            res &=this.CopyArray(buff_num,2,to_copy,array);
            res &=this.CopyArray(buff_num,3,to_copy,array);
            return res;
         //--- One buffer + color buffer
         case DRAW_COLOR_LINE       :
         case DRAW_COLOR_HISTOGRAM  :
         case DRAW_COLOR_ARROW      :
         case DRAW_COLOR_SECTION    :
            res  =this.CopyArray(buff_num,0,to_copy,array);
            res &=this.CopyArray(buff_num,4,to_copy,array);
            return res;
         //--- Two buffers + color buffer
         case DRAW_COLOR_HISTOGRAM2 :
         case DRAW_COLOR_ZIGZAG     :
            res  =this.CopyArray(buff_num,0,to_copy,array);
            res &=this.CopyArray(buff_num,1,to_copy,array);
            res &=this.CopyArray(buff_num,4,to_copy,array);
            return res;
         //--- Four buffers + color buffer
         case DRAW_COLOR_BARS       :
         case DRAW_COLOR_CANDLES    :
            res  =this.CopyArray(buff_num,0,to_copy,array);
            res &=this.CopyArray(buff_num,1,to_copy,array);
            res &=this.CopyArray(buff_num,2,to_copy,array);
            res &=this.CopyArray(buff_num,3,to_copy,array);
            res &=this.CopyArray(buff_num,4,to_copy,array);
            return res;
         //---DRAW_NONE
         default:
           break;
        }
     }
   return false;
  }
In der Indikatorberechnungsmethode wird nun statt des Kopierens von Arrays eine Methode aufgerufen, die alle Arrays von Indikatorpuffern kopiert, und nach dem Versuch, alle Arrays zu kopieren, wird ein Fehler zurückgegeben:
//+------------------------------------------------------------------+
//| Fill object buffers with data from the calculation part buffer   |
//+------------------------------------------------------------------+
bool CIndMSTF::Calculate(void)
  {
//--- Set the success flag to true, and the error type to no error
   this.m_success=true;
   this.m_type_err=ERR_TYPE_NO_ERROR;
//--- If the data is not yet synchronized with the trade server,
   if(!this.IsSynchronized())
     {
      //--- Log a message about non-synchronized data,
      ::PrintFormat("%s::%s: Waiting for data to sync...",__FUNCTION__,this.Title());
      //--- set the error type, add 'false' to the error flag and return 'false'
      this.m_type_err=ERR_TYPE_NO_SYNC;
      this.m_success=false;
      return false;
     }
//--- If the Calculated method returned -1, this means the start of data downloading
   if(this.Calculated()==WRONG_VALUE)
     {
      //--- Log a message about the start of data downloading,
      ::PrintFormat("%s::%s: Start downloading data by %s/%s. Waiting for the next tick...",__FUNCTION__,this.Title(),this.m_symbol,this.TimeframeDescription());
      //--- set the error type, add 'false' to the error flag and return 'false'
      this.m_type_err=ERR_TYPE_NO_DATA;
      this.m_success=false;
      return false;
     }
//--- If the Calculated method returned 0, this means that the indicator has not yet been calculated
   if(this.Calculated()==0)
     {
      //--- Log a message about waiting for the indicator to be calculated,
      ::PrintFormat("%s::%s: Waiting for a new tick and when the indicator will be calculated...",__FUNCTION__,this.Title());
      //--- set the error type, add 'false' to the error flag and return 'false'
      this.m_type_err=ERR_TYPE_NO_CALC;
      this.m_success=false;
      return false;
     }
//--- Get the number of data bars for the indicator symbol/period
   int bars=::Bars(this.m_symbol,this.m_timeframe);
//--- If the Bars function returned a zero value, which often happens on weekends, calculate the available number of bars
   if(bars==0)
     {
      //--- Get the date of the very first available bar in history for the symbol/period
      datetime firstdate=(datetime)::SeriesInfoInteger(this.m_symbol,this.m_timeframe,SERIES_FIRSTDATE);
      //--- Get the date of the last (current) bar in history for the symbol/period
      datetime lastdate=(datetime)::SeriesInfoInteger(this.m_symbol,this.m_timeframe,SERIES_LASTBAR_DATE);
      //--- Calculate the number of bars between the first and last dates of history
      int sec=::PeriodSeconds(this.m_timeframe);
      ulong date_bars=(((ulong)lastdate-(ulong)firstdate)/(sec>0 ? sec : 1))+1;
      //--- Write to the 'bars' variable the smaller value of the calculated number of bars and the maximum number of bars available in the terminal
      bars=(int)fmin(date_bars,::TerminalInfoInteger(TERMINAL_MAXBARS));
     }
//--- Write the resulting number of available bars to m_rates_total
   if(this.m_rates_total!=bars)
      this.m_rates_total=bars;
//--- If the number of available bars is received, and it is 2 or less,
   if(this.m_rates_total>=0 && this.m_rates_total<3)
     {
      //--- Log a message about the number of available bars being too small
      ::PrintFormat("%s::%s: Not enough data for calculation: %ld bars. Waiting for the next tick...",__FUNCTION__,this.Title(),this.m_rates_total);
      //--- set the error type, add 'false' to the error flag and return 'false'
      this.m_type_err=ERR_TYPE_NO_DATA;
      this.m_success=false;
      return false;
     }

//--- Calculate the number of bars required to calculate the indicator
//--- Either the entire available history, or 1 when a new bar opens, or 0 on the current tick
   this.m_limit=this.m_rates_total-this.m_prev_calculated;
   this.m_prev_calculated=this.Calculated();

//--- Declare an array of size 2 to receive data into it from the indicator's calculation part buffer
//--- We always get two bars: previous and current
   double array[2];
//--- Get the number of indicator buffers
   int total=(int)this.BuffersTotal();
//--- If the calculated m_limit is greater than 1, it means either the first launch or changes in historical data
//--- In this case, a complete recalculation of the indicator is necessary
   if(this.m_limit>1)
     {
      //--- In a loop over the number of indicator buffers
      for(int i=0;i<total;i++)
        {
         //--- resize the indicator buffer array and initialize it to the "empty" value set for this buffer
         this.BufferInitialize(i,this.m_rates_total);
         //--- Determine the amount of data to copy
         int to_copy=(this.m_prev_calculated>this.m_rates_total ? this.m_rates_total : this.m_prev_calculated);

         //--- If not all arrays were successfully copied, write false to m_success
         if(!this.CopyArrays(i,to_copy))
            this.m_success &=false;
        }
      //--- If there are errors after the error, return false
      if(!this.m_success)
        {
         this.m_type_err=ERR_TYPE_NO_DATA;
         return false;
        }
      //--- Everything is successful - return true
      this.m_type_err=ERR_TYPE_NO_ERROR;
      this.m_success=true;
      return true;
     }
//--- If calculated m_limit is less than or equal to 1, this means either opening of a new bar (m_limit==1) or current tick (m_limit==0)
//--- In this case, it is necessary to calculate two bars - the first and the current
   if(this.m_limit<=1)
     {
      //--- In a loop over the number of indicator buffers
      for(int i=0;i<total;i++)
        {
         //--- If this is the opening of a new bar and resizing the indicator buffer failed,
         if(this.m_limit==1 && !this.BufferResize(i,this.m_rates_total))
           {
            //--- add 'false' to the m_success variable and return 'false'
            //--- Here, an error message will be printed to log from the BufferResize method
            this.m_success=false;
            return false;
           }
         //--- If failed to copy two bars from the indicator's calculation part buffer,
         ::ResetLastError();
         if(!this.CopyArrays(i,2))
           {
            //--- report this via the log, add 'false' to the m_success variable and return 'false'
            ::PrintFormat("%s::%s: CopyBuffer(%lu) failed. Error %lu",__FUNCTION__,this.Title(),i,::GetLastError());
            this.m_success &=false;
           }
        }
      //--- If there are errors after the error, return false
      if(!this.m_success)
        {
         this.m_type_err=ERR_TYPE_NO_DATA;
         return false;
        }
      //--- Success
      this.m_type_err=ERR_TYPE_NO_ERROR;
      this.m_success=true;
      return true;
     }
//--- Undefined 'limit' option - return 'false'
   return false;
  }
Um Farbpufferdaten aus dem Berechnungsteil des Indikators in den Puffer des Zeichnungsteils zu kopieren, verwenden wir eine Methode, die der Methode zum Kopieren eines einfarbigen Puffers ähnelt:
//+------------------------------------------------------------------+
//| Fill the plot array and the color index array                    |
//|  passed to the method with data from the class buffer            |
//+------------------------------------------------------------------+
bool CIndMSTF::DataToColorBuffer(const string symbol_to,const ENUM_TIMEFRAMES timeframe_to,const uint buffer_num,const uint array_num,const int limit,double &plot_buffer[],double &color_buffer[])
  {
//--- Set the success flag
   this.m_success=true;
//--- Get the indexing direction of the buffer array passed to the method and,
//--- if non-timeseries indexing, set timeseries indexing
   bool as_series_plot=::ArrayGetAsSeries(plot_buffer);
   if(!as_series_plot)
      ::ArraySetAsSeries(plot_buffer,true);
   bool as_series_color=::ArrayGetAsSeries(color_buffer);
   if(!as_series_color)
      ::ArraySetAsSeries(color_buffer,true);
//--- Set the symbol name and timeframe value passed to the method
   string symbol=(symbol_to=="" || symbol_to==NULL ? ::Symbol() : symbol_to);
   ENUM_TIMEFRAMES timeframe=(timeframe_to==PERIOD_CURRENT ? ::Period() : timeframe_to);
   datetime array[2];
//--- If this is the first launch or history changes, initialize the buffer array passed to the method
   if(limit>1 && this.m_limit>1)
     {
      ::PrintFormat("%s::%s First start, or historical data has been changed. Initialize Buffer(%lu)",__FUNCTION__,this.Title(),buffer_num);
      ::ArrayInitialize(plot_buffer,this.BufferInitValue(buffer_num));
      ::ArrayInitialize(color_buffer,this.BufferInitColorIndex(buffer_num));
     }
//--- Set the value of the loop counter (no more than the maximum number of bars in the terminal on the chart)
   int count=(limit<=1 ? 2 : ::fmin(::TerminalInfoInteger(TERMINAL_MAXBARS),limit));
//--- In a loop from the zero bar to the value of the loop counter
   for(int i=0;i<count;i++)
     {
      //--- If the chart timeframe matches the class object timeframe, fill the buffer directly from the class object array
      if(timeframe==::Period() && this.m_timeframe==::Period())
        {
         plot_buffer[i]=this.GetData(buffer_num,array_num,i);
         color_buffer[i]=this.GetColorData(buffer_num,i);
        }
      //--- Otherwise, if the chart timeframe is not equal to the timeframe of the class object
      else
        {
         //--- Find out which time of this class the bar of the current chart timeframe, corresponding to the loop index, belongs to
         ::ResetLastError();
         if(::CopyTime(symbol,timeframe,i,2,array)!=2)
           {
            //--- If there is no data in the terminal, move on
            if(::GetLastError()==4401)
               continue;
            //--- Error in obtaining existing data - return false
            this.m_success &=false;
            return false;
           }
         //--- Using time of bar of current chart timeframe, find corresponding index of bar of class object's chart period
         ::ResetLastError();
         int bar=::iBarShift(this.m_symbol,this.m_timeframe,array[0]);
         if(bar==WRONG_VALUE)
           {
            this.m_success &=false;
            continue;
           }
         //--- If this is historical data (not the first or zero bar) -
         //--- in the indicator buffer at the loop index, write the value obtained from the calculation part buffer
         if(i>1)
           {
            plot_buffer[i]=this.GetData(buffer_num,array_num,bar);
            color_buffer[i]=this.GetColorData(buffer_num,bar);
           }
         //--- If this is the current (zero) or previous (first) bar
         else
           {
            //--- Get the time of bars 0 and 1 by symbol/timeframe of the class object
            if(::CopyTime(this.m_symbol,this.m_timeframe,0,2,array)!=2)
              {
               this.m_success &=false;
               return false;
              }
            //--- Using time, get indexes of current and previous bars on the chart whose symbol/period was passed to method
            int bar0=::iBarShift(symbol,timeframe,array[1]);
            int bar1=::iBarShift(symbol,timeframe,array[0]);
            if(bar0==WRONG_VALUE || bar1==WRONG_VALUE)
              {
               this.m_success &=false;
               return false;
              }
            //--- If the chart timeframe is lower than the timeframe of the class object,
            if(timeframe<this.m_timeframe)
              {
               //--- in a loop from bar with smaller time to current chart bar, fill the buffer with data from the last 2 cells of the indicator buffer array
               for(int j=bar1;j>=0;j--)
                 {
                  plot_buffer[j]=this.GetData(buffer_num,array_num,(j>bar0 ? 1 : 0));
                  color_buffer[j]=this.GetColorData(buffer_num,(j>bar0 ? 1 : 0));
                 }
              }
            //--- If the chart timeframe is higher than the timeframe of the class object,
            else
              {
               //--- Get the time of the current and previous bars by symbol/timeframe of the current chart
               if(::CopyTime(symbol,timeframe,0,2,array)!=2)
                 {
                  this.m_success &=false;
                  return false;
                 }
               //--- Using time, get indexes of bars in indicator's calculation part buffer, corresponding to time of current and previous bars on the chart
               int bar0=::iBarShift(this.m_symbol,this.m_timeframe,array[1]);
               int bar1=::iBarShift(this.m_symbol,this.m_timeframe,array[0]);
               //--- Write into indicator buffer, at indexes 1 and 0, values from corresponding indexes of calculation part buffer
               plot_buffer[1]=this.GetData(buffer_num,array_num,bar1);
               plot_buffer[0]=this.GetData(buffer_num,array_num,bar0);
               color_buffer[1]=this.GetColorData(buffer_num,bar1);
               color_buffer[0]=this.GetColorData(buffer_num,bar0);
              }
           }
        }
     }
//--- Set initial indexing of the buffer array passed to the method
   ::ArraySetAsSeries(plot_buffer,as_series_plot);
   ::ArraySetAsSeries(color_buffer,as_series_color);
//--- Successful
   return true;
  }
Hier ist alles genauso wie bei der Methode zum Kopieren von Daten aus einem einfarbigen Puffer, nur dass zusätzlich ein Array mit Farbindizes des Plotteils an die Methode übergeben wird, in das wir die Daten des entsprechenden Arrays des berechneten Teils des Indikators kopieren sollen. Außerdem wird das Kopieren für zwei Arrays implementiert: Daten-Array und Farb-Array.
In allen Methoden, die Eigenschaften oder Daten des angegebenen Puffers zurückgeben, wird nun zusätzlich der Index des benötigten Arrays angegeben.
//+------------------------------------------------------------------+
//| Fills the passed plot array with data from the class buffer      |
//+------------------------------------------------------------------+
bool CIndMSTF::DataToBuffer(const string symbol_to,const ENUM_TIMEFRAMES timeframe_to,const uint buffer_num,const uint array_num,const int limit,double &buffer[])
  {
//--- Set the success flag
   this.m_success=true;
//--- Get the indexing direction of the buffer array passed to the method and,
//--- if non-timeseries indexing, set timeseries indexing
   bool as_series=::ArrayGetAsSeries(buffer);
   if(!as_series)
      ::ArraySetAsSeries(buffer,true);
//--- Set the symbol name and timeframe value passed to the method
   string symbol=(symbol_to=="" || symbol_to==NULL ? ::Symbol() : symbol_to);
   ENUM_TIMEFRAMES timeframe=(timeframe_to==PERIOD_CURRENT ? ::Period() : timeframe_to);
   datetime array[2];
//--- If this is the first launch or history changes, initialize the buffer array passed to the method
   if(limit>1 && this.m_limit>1)
     {
      ::PrintFormat("%s::%s First start, or historical data has been changed. Initialize Buffer(%lu)",__FUNCTION__,this.Title(),buffer_num);
      ::ArrayInitialize(buffer,this.BufferInitValue(buffer_num));
     }
//--- Set the value of the loop counter (no more than the maximum number of bars in the terminal on the chart)
   int count=(limit<=1 ? 2 : ::fmin(::TerminalInfoInteger(TERMINAL_MAXBARS),limit));
//--- In a loop from the zero bar to the value of the loop counter
   for(int i=0;i<count;i++)
     {
      //--- If the chart timeframe matches the class object timeframe, fill the buffer directly from the class object array
      if(timeframe==::Period() && this.m_timeframe==::Period())
         buffer[i]=this.GetData(buffer_num,array_num,i);
      //--- Otherwise, if the chart timeframe is not equal to the timeframe of the class object
      else
        {
         //--- Find out which time of this class the bar of the current chart timeframe, corresponding to the loop index, belongs to
         ::ResetLastError();
         if(::CopyTime(symbol,timeframe,i,2,array)!=2)
           {
            //--- If there is no data in the terminal, move on
            if(::GetLastError()==4401)
               continue;
            //--- Error in obtaining existing data - return false
            this.m_success &=false;
            return false;
           }
         //--- Using time of bar of current chart timeframe, find corresponding index of bar of class object's chart period
         ::ResetLastError();
         int bar=::iBarShift(this.m_symbol,this.m_timeframe,array[0]);
         if(bar==WRONG_VALUE)
           {
            this.m_success &=false;
            continue;
           }
         //--- If this is historical data (not the first or zero bar) -
         //--- in the indicator buffer at the loop index, write the value obtained from the calculation part buffer
         if(i>1)
            buffer[i]=this.GetData(buffer_num,array_num,bar);
         //--- If this is the current (zero) or previous (first) bar
         else
           {
            //--- Get the time of bars 0 and 1 by symbol/timeframe of the class object
            if(::CopyTime(this.m_symbol,this.m_timeframe,0,2,array)!=2)
              {
               this.m_success &=false;
               return false;
              }
            //--- Using time, get indexes of current and previous bars on the chart whose symbol/period was passed to method
            int bar0=::iBarShift(symbol,timeframe,array[1]);
            int bar1=::iBarShift(symbol,timeframe,array[0]);
            if(bar0==WRONG_VALUE || bar1==WRONG_VALUE)
              {
               this.m_success &=false;
               return false;
              }
            //--- If the chart timeframe is lower than the timeframe of the class object,
            if(timeframe<this.m_timeframe)
              {
               //--- in a loop from bar with smaller time to current chart bar, fill the buffer with data from the last 2 cells of the indicator buffer array
               for(int j=bar1;j>=0;j--)
                  buffer[j]=this.GetData(buffer_num,array_num,(j>bar0 ? 1 : 0));
              }
            //--- If the chart timeframe is higher than the timeframe of the class object,
            else
              {
               //--- Get the time of the current and previous bars by symbol/timeframe of the current chart
               if(::CopyTime(symbol,timeframe,0,2,array)!=2)
                 {
                  this.m_success &=false;
                  return false;
                 }
               //--- Using time, get indexes of bars in indicator's calculation part buffer, corresponding to time of current and previous bars on the chart
               int bar0=::iBarShift(this.m_symbol,this.m_timeframe,array[1]);
               int bar1=::iBarShift(this.m_symbol,this.m_timeframe,array[0]);
               //--- Write into indicator buffer, at indexes 1 and 0, values from corresponding indexes of calculation part buffer
               buffer[1]=this.GetData(buffer_num,array_num,bar1);
               buffer[0]=this.GetData(buffer_num,array_num,bar0);
              }
           }
        }
     }
//--- Set initial indexing of the buffer array passed to the method
   ::ArraySetAsSeries(buffer,as_series);
//--- Successful
   return true;
  }

//+------------------------------------------------------------------+
//| Return the data of the specified buffer as is                    |
//+------------------------------------------------------------------+
double CIndMSTF::GetData(const uint buffer_num,const uint array_num,const int index) const
  {
//--- Validate the buffer number passed to the method and, if the number is incorrect, print a message to log
   if(buffer_num>this.BuffersTotal()-1)
     {
      string buff_limit=(this.BuffersTotal()==1 ? "0" : "0 - "+string(this.BuffersTotal()-1));
      ::PrintFormat("%s: Invalid buffer number passed (%lu). Value must be %s",__FUNCTION__,buffer_num,buff_limit);
      //--- If the indicator has buffers, return "empty" value of the first one, otherwise EMPTY_VALUE
      return(this.BuffersTotal()>0 ? this.BufferInitValue(0) : EMPTY_VALUE);
     }
//--- If an incorrect index is specified, return the "empty" value of the specified buffer
   if(index<0 || index>(int)this.DataTotal(buffer_num,array_num)-1)
      return this.BufferInitValue(buffer_num);
//--- Calculate the real index in the buffer array and return the value at this index
   int n=int(this.DataTotal(buffer_num,array_num)-1-index);
   switch(array_num)
     {
      case 0 : return this.m_buffers[buffer_num].array0[n];
      case 1 : return this.m_buffers[buffer_num].array1[n];
      case 2 : return this.m_buffers[buffer_num].array2[n];
      case 3 : return this.m_buffers[buffer_num].array3[n];
      case 4 : return this.m_buffers[buffer_num].color_indexes[n];
      default: break;
     }
   return EMPTY_VALUE;
  }
//+-------------------------------------------------------------------+
//| Returns data from specified buffer for specified symbol/timeframe |
//+-------------------------------------------------------------------+
double CIndMSTF::GetDataTo(const string symbol_to,const ENUM_TIMEFRAMES timeframe_to,const uint buffer_num,const uint array_num,const int index) const
  {
//--- If current symbol/period of the chart is specified
   if(timeframe_to==::Period() && this.m_timeframe==::Period() && symbol_to==::Symbol() && this.m_symbol==::Symbol())
      return this.GetData(buffer_num,array_num,index);
//--- Validate the buffer number passed to the method and, if the number is incorrect, print a message to log
   if(buffer_num>this.BuffersTotal()-1)
     {
      string buff_limit=(this.BuffersTotal()==1 ? "0" : "0 - "+string(this.BuffersTotal()-1));
      ::PrintFormat("%s: Invalid buffer number passed (%lu). Value must be %s",__FUNCTION__,buffer_num,buff_limit);
      //--- If the indicator has buffers, return "empty" value of the first one, otherwise EMPTY_VALUE
      return(this.BuffersTotal()>0 ? this.BufferInitValue(0) : EMPTY_VALUE);
     }
//--- Find out which time of this class the current chart timeframe's bar, corresponding to the loop index, belongs to
   datetime array[];
   if(::CopyTime(symbol_to,timeframe_to,index,1,array)!=1)
      return this.BufferInitValue(buffer_num);
//--- Using time of bar of current chart timeframe, find corresponding bar index of bar this class chart period
   int bar=iBarShift(this.m_symbol,this.m_timeframe,array[0]);
//--- If the bar is not found, return the "empty" value set for the buffer
   if(bar==WRONG_VALUE)
      return this.BufferInitValue(buffer_num);
//--- Return value from the indicator object buffer at the found index
   return this.GetData(buffer_num,array_num,bar);
  }

//+------------------------------------------------------------------+
//| Return the state of the indicator line as is                     |
//+------------------------------------------------------------------+
ENUM_LINE_STATE CIndMSTF::BufferLineState(const uint buffer_num,const uint array_num,const int index) const
  {
//--- Get the values of the indicator line with the shift (0,1,2) relative to the passed index
   const double value0=this.GetData(buffer_num,array_num,index);
   const double value1=this.GetData(buffer_num,array_num,index+1);
   const double value2=this.GetData(buffer_num,array_num,index+2);
//--- If at least one of the values could not be obtained, return an undefined value
   if(value0==EMPTY_VALUE || value1==EMPTY_VALUE || value2==EMPTY_VALUE)
      return LINE_STATE_NONE;
//--- Line upward reversal (value2>value1 && value0>value1)
   if(::NormalizeDouble(value2-value1,this.m_digits)>0 && ::NormalizeDouble(value0-value1,this.m_digits)>0)
      return LINE_STATE_TURN_UP;
//--- Line upward direction (value2<=value1 && value0>value1)
   else if(::NormalizeDouble(value2-value1,this.m_digits)<=0 && ::NormalizeDouble(value0-value1,this.m_digits)>0)
      return LINE_STATE_UP;
//--- Line upward stop (value2<=value1 && value0==value1)
   else if(::NormalizeDouble(value2-value1,this.m_digits)<=0 && ::NormalizeDouble(value0-value1,this.m_digits)==0)
      return LINE_STATE_STOP_UP;
//--- Line downward reversal (value2<value1 && value0<value1)
   if(::NormalizeDouble(value2-value1,this.m_digits)<0 && ::NormalizeDouble(value0-value1,this.m_digits)<0)
      return LINE_STATE_TURN_DOWN;
//--- Line downward direction (value2>=value1 && value0<value1)
   else if(::NormalizeDouble(value2-value1,this.m_digits)>=0 && ::NormalizeDouble(value0-value1,this.m_digits)<0)
      return LINE_STATE_DOWN;
//--- Line downward stop (value2>=value1 && value0==value1)
   else if(::NormalizeDouble(value2-value1,this.m_digits)>=0 && ::NormalizeDouble(value0-value1,this.m_digits)==0)
      return LINE_STATE_STOP_DOWN;
//--- Undefined state
   return LINE_STATE_NONE;
  }
//+------------------------------------------------------------------+
//| Return indicator line state for the specific symbol/period       |
//+------------------------------------------------------------------+
ENUM_LINE_STATE CIndMSTF::BufferLineState(const string symbol_from,const ENUM_TIMEFRAMES timeframes_from,const uint buffer_num,const uint array_num,const int index) const
  {
//--- Determine the chart symbol/period passed to the method
   string symbol=(symbol_from=="" || symbol_from==NULL ? ::Symbol() : symbol_from);
   ENUM_TIMEFRAMES timeframe=(timeframes_from==PERIOD_CURRENT ? ::Period() : timeframes_from);
//--- If we get data from symbol/period equal to current chart, return state from the buffer "as is"
   if(symbol==::Symbol() && symbol==this.m_symbol && timeframe==::Period() && timeframe==this.m_timeframe)
      return this.BufferLineState(buffer_num,array_num,index);
//--- Declare variables to search for the required bars on the current chart
   datetime array[1];
   int      bar0=WRONG_VALUE;
   int      bar1=WRONG_VALUE;
   int      bar2=WRONG_VALUE;

//--- Get the time of the first bar on the chart
   ::ResetLastError();
   if(::CopyTime(symbol,timeframe,index,1,array)!=1)
     {
      ::PrintFormat("%s: CopyTime for %s/%s, bar %ld failed. Error %lu",__FUNCTION__,symbol,::StringSubstr(::EnumToString(timeframe),7),index,::GetLastError());
      return LINE_STATE_NONE;
     }
//--- Get index of the first bar in indicator object buffer based on bar opening time on the chart
   bar0=::iBarShift(this.m_symbol,this.m_timeframe,array[0]);
   if(bar0==WRONG_VALUE)
     {
      ::PrintFormat("%s: iBarShift for %s/%s, time %s failed. Error %lu",__FUNCTION__,this.m_symbol,this.TimeframeDescription(),string(array[0]),::GetLastError());
      return LINE_STATE_NONE;
     }
//--- Get the time of the second bar on the chart
   ::ResetLastError();
   if(::CopyTime(symbol,timeframe,index+1,1,array)!=1)
     {
      ::PrintFormat("%s: CopyTime for %s/%s, bar %ld failed. Error %lu",__FUNCTION__,symbol,::StringSubstr(::EnumToString(timeframe),7),index+1,::GetLastError());
      return LINE_STATE_NONE;
     }
//--- Get index of the second bar in indicator object buffer based on bar opening time on the chart
   bar1=::iBarShift(this.m_symbol,this.m_timeframe,array[0]);
   if(bar1==WRONG_VALUE)
     {
      ::PrintFormat("%s: iBarShift for %s/%s, time %s failed. Error %lu",__FUNCTION__,this.m_symbol,this.TimeframeDescription(),string(array[0]),::GetLastError());
      return LINE_STATE_NONE;
     }
//--- Get the time of the third bar on the chart
   ::ResetLastError();
   if(::CopyTime(symbol,timeframe,index+2,1,array)!=1)
     {
      ::PrintFormat("%s: CopyTime for %s/%s, bar %ld failed. Error %lu",__FUNCTION__,symbol,::StringSubstr(::EnumToString(timeframe),7),index+2,::GetLastError());
      return LINE_STATE_NONE;
     }
//--- Get index of the third bar in indicator object buffer based on bar opening time on the chart
   bar2=::iBarShift(this.m_symbol,this.m_timeframe,array[0]);
   if(bar2==WRONG_VALUE)
     {
      ::PrintFormat("%s: iBarShift for %s/%s, time %s failed. Error %lu",__FUNCTION__,this.m_symbol,this.TimeframeDescription(),string(array[0]),::GetLastError());
      return LINE_STATE_NONE;
     }

//--- Get the values of the indicator line with the shift (0,1,2) relative to the passed index
   const double value0=this.GetData(buffer_num,array_num,bar0);
   const double value1=this.GetData(buffer_num,array_num,bar1);
   const double value2=this.GetData(buffer_num,array_num,bar2);
//--- If at least one of the values could not be obtained, return an undefined value
   if(value0==EMPTY_VALUE || value1==EMPTY_VALUE || value2==EMPTY_VALUE)
      return LINE_STATE_NONE;
//--- Line upward reversal (value2>value1 && value0>value1)
   if(::NormalizeDouble(value2-value1,this.m_digits)>0 && ::NormalizeDouble(value0-value1,this.m_digits)>0)
      return LINE_STATE_TURN_UP;
//--- Line upward direction (value2<=value1 && value0>value1)
   else if(::NormalizeDouble(value2-value1,this.m_digits)<=0 && ::NormalizeDouble(value0-value1,this.m_digits)>0)
      return LINE_STATE_UP;
//--- Line upward stop (value2<=value1 && value0==value1)
   else if(::NormalizeDouble(value2-value1,this.m_digits)<=0 && ::NormalizeDouble(value0-value1,this.m_digits)==0)
      return LINE_STATE_STOP_UP;
//--- Line downward reversal (value2<value1 && value0<value1)
   if(::NormalizeDouble(value2-value1,this.m_digits)<0 && ::NormalizeDouble(value0-value1,this.m_digits)<0)
      return LINE_STATE_TURN_DOWN;
//--- Line downward direction (value2>=value1 && value0<value1)
   else if(::NormalizeDouble(value2-value1,this.m_digits)>=0 && ::NormalizeDouble(value0-value1,this.m_digits)<0)
      return LINE_STATE_DOWN;
//--- Line downward stop (value2>=value1 && value0==value1)
   else if(::NormalizeDouble(value2-value1,this.m_digits)>=0 && ::NormalizeDouble(value0-value1,this.m_digits)==0)
      return LINE_STATE_STOP_DOWN;
//--- Undefined state
   return LINE_STATE_NONE;
  }
//+------------------------------------------------------------------+
//| Return the state of the line relative to the specified level     |
//+------------------------------------------------------------------+
ENUM_LINE_STATE CIndMSTF::BufferLineStateRelative(const int buffer_num,const uint array_num,const int index,const double level0,const double level1=EMPTY_VALUE)
  {
//--- Get the values of the indicator line with the shift (0,1) relative to the passed index
   const double value0=this.GetData(buffer_num,array_num,index);
   const double value1=this.GetData(buffer_num,array_num,index+1);
//--- If at least one of the values could not be obtained, return an undefined value
   if(value0==EMPTY_VALUE || value1==EMPTY_VALUE)
      return LINE_STATE_NONE;
//--- Define the second level to compare
   double level=(level1==EMPTY_VALUE ? level0 : level1);
//--- The line is below the level (value1<level && value0<level0)
   if(::NormalizeDouble(value1-level,this.m_digits)<0 && ::NormalizeDouble(value0-level0,this.m_digits)<0)
      return LINE_STATE_BELOW;
//--- The line is above the level (value1>level && value0>level0)
   if(::NormalizeDouble(value1-level,this.m_digits)>0 && ::NormalizeDouble(value0-level0,this.m_digits)>0)
      return LINE_STATE_ABOVE;
//--- The line crossed the level upwards (value1<=level && value0>level0)
   if(::NormalizeDouble(value1-level,this.m_digits)<=0 && ::NormalizeDouble(value0-level0,this.m_digits)>0)
      return LINE_STATE_CROSS_UP;
//--- The line crossed the level downwards (value1>=level && value0<level0)
   if(::NormalizeDouble(value1-level,this.m_digits)>=0 && ::NormalizeDouble(value0-level0,this.m_digits)<0)
      return LINE_STATE_CROSS_DOWN;
//--- The line touched the level from below (value1<level0 && value0==level0)
   if(::NormalizeDouble(value1-level,this.m_digits)<0 && ::NormalizeDouble(value0-level0,this.m_digits)==0)
      return LINE_STATE_TOUCH_BELOW;
//--- The line touched the level from above (value1>level0 && value0==level0)
   if(::NormalizeDouble(value1-level,this.m_digits)>0 && ::NormalizeDouble(value0-level0,this.m_digits)==0)
      return LINE_STATE_TOUCH_BELOW;
//--- Line is equal to the level value (value1==level0 && value0==level0)
   if(::NormalizeDouble(value1-level,this.m_digits)==0 && ::NormalizeDouble(value0-level0,this.m_digits)==0)
      return LINE_STATE_EQUALS;
//--- Undefined state
   return LINE_STATE_NONE;
  }
//+------------------------------------------------------------------+
//| Return the state of the line relative to the specified level     |
//| on the specified chart symbol/period                             |
//+------------------------------------------------------------------+
ENUM_LINE_STATE CIndMSTF::BufferLineStateRelative(const string symbol_from,const ENUM_TIMEFRAMES timeframes_from,const int buffer_num,const uint array_num,const int index,const double level0,const double level1=EMPTY_VALUE)
  {
//--- Determine the chart symbol/period passed to the method
   string symbol=(symbol_from=="" || symbol_from==NULL ? ::Symbol() : symbol_from);
   ENUM_TIMEFRAMES timeframe=(timeframes_from==PERIOD_CURRENT ? ::Period() : timeframes_from);
//--- Get the values of the indicator line with the shift (0,1) relative to the passed index
   const double value0=this.GetDataTo(symbol,timeframe,buffer_num,array_num,index);
   const double value1=this.GetDataTo(symbol,timeframe,buffer_num,array_num,index+1);
//--- If at least one of the values could not be obtained, return an undefined value
   if(value0==EMPTY_VALUE || value1==EMPTY_VALUE)
      return LINE_STATE_NONE;
//--- Define the second level to compare
   double level=(level1==EMPTY_VALUE ? level0 : level1);
//--- The line is below the level (value1<level && value0<level0)
   if(::NormalizeDouble(value1-level,this.m_digits)<0 && ::NormalizeDouble(value0-level0,this.m_digits)<0)
      return LINE_STATE_BELOW;
//--- The line is above the level (value1>level && value0>level0)
   if(::NormalizeDouble(value1-level,this.m_digits)>0 && ::NormalizeDouble(value0-level0,this.m_digits)>0)
      return LINE_STATE_ABOVE;
//--- The line crossed the level upwards (value1<=level && value0>level0)
   if(::NormalizeDouble(value1-level,this.m_digits)<=0 && ::NormalizeDouble(value0-level0,this.m_digits)>0)
      return LINE_STATE_CROSS_UP;
//--- The line crossed the level downwards (value1>=level && value0<level0)
   if(::NormalizeDouble(value1-level,this.m_digits)>=0 && ::NormalizeDouble(value0-level0,this.m_digits)<0)
      return LINE_STATE_CROSS_DOWN;
//--- The line touched the level from below (value1<level0 && value0==level0)
   if(::NormalizeDouble(value1-level,this.m_digits)<0 && ::NormalizeDouble(value0-level0,this.m_digits)==0)
      return LINE_STATE_TOUCH_BELOW;
//--- The line touched the level from above (value1>level0 && value0==level0)
   if(::NormalizeDouble(value1-level,this.m_digits)>0 && ::NormalizeDouble(value0-level0,this.m_digits)==0)
      return LINE_STATE_TOUCH_BELOW;
//--- Line is equal to the level value (value1==level0 && value0==level0)
   if(::NormalizeDouble(value1-level,this.m_digits)==0 && ::NormalizeDouble(value0-level0,this.m_digits)==0)
      return LINE_STATE_EQUALS;
//--- Undefined state
   return LINE_STATE_NONE;
  }
Methoden, die Farbpufferdaten aus einem Array von Farbindizes zurückgeben:
//+------------------------------------------------------------------+
//| Return data of the specified buffer of color indexes as is       |
//+------------------------------------------------------------------+
double CIndMSTF::GetColorData(const uint buffer_num,const int index) const
  {
//--- Validate the buffer number passed to method and, if number is incorrect, print a message to log and return 0
   if(buffer_num>this.BuffersTotal()-1)
     {
      string buff_limit=(this.BuffersTotal()==1 ? "0" : "0 - "+string(this.BuffersTotal()-1));
      ::PrintFormat("%s: Invalid buffer number passed (%lu). Value must be %s",__FUNCTION__,buffer_num,buff_limit);
      return 0;
     }
//--- If this is not a color buffer, report this to the log and return 0
   if(!this.IsColoredBuffer(buffer_num))
     {
      ::PrintFormat("%s: Buffer %lu is not a color buffer",__FUNCTION__,buffer_num);
      return 0;
     }
//--- If an incorrect index is specified, return "empty" value of the specified color buffer
   if(index<0 || index>(int)this.DataTotal(buffer_num,4)-1)
      return this.BufferInitColorIndex(buffer_num);
//--- Calculate the real index in the color buffer array and return the value at this index
   int n=int(this.DataTotal(buffer_num,4)-1-index);
   return this.m_buffers[buffer_num].color_indexes[n];
  }
//+------------------------------------------------------------------+
//| Return data of the specified color index buffer                  |
//| for the specified symbol/timeframe                               |
//+------------------------------------------------------------------+
double CIndMSTF::GetColorDataTo(const string symbol_to,const ENUM_TIMEFRAMES timeframe_to,const uint buffer_num,const int index) const
  {
//--- If current symbol/period of the chart is specified
   if(timeframe_to==::Period() && this.m_timeframe==::Period() && symbol_to==::Symbol() && this.m_symbol==::Symbol())
      return this.GetColorData(buffer_num,index);
//--- Validate the buffer number passed to method and, if number is incorrect, print a message to log and return 0
   if(buffer_num>this.BuffersTotal()-1)
     {
      string buff_limit=(this.BuffersTotal()==1 ? "0" : "0 - "+string(this.BuffersTotal()-1));
      ::PrintFormat("%s: Invalid buffer number passed (%lu). Value must be %s",__FUNCTION__,buffer_num,buff_limit);
      return 0;
     }
//--- If this is not a color buffer, report this to the log and return 0
   if(!this.IsColoredBuffer(buffer_num))
     {
      ::PrintFormat("%s: Buffer %lu is not a color buffer",__FUNCTION__,buffer_num);
      return 0;
     }
//--- Find out which time of this class the current chart timeframe's bar, corresponding to the loop index, belongs to
   datetime array[];
   if(::CopyTime(symbol_to,timeframe_to,index,1,array)!=1)
      return this.BufferInitColorIndex(buffer_num);
//--- Using time of bar of current chart timeframe, find corresponding bar index of bar this class chart period
   int bar=iBarShift(this.m_symbol,this.m_timeframe,array[0]);
//--- If the bar is not found, return "empty" value set for the color buffer
   if(bar==WRONG_VALUE)
      return this.BufferInitColorIndex(buffer_num);
//--- Return a value from the color buffer of the indicator object at the found index
   return this.GetColorData(buffer_num,bar);
//--- Calculate the real index in the color buffer array and return the value at this index
   int n=int(this.DataTotal(buffer_num,4)-1-bar);
   return this.m_buffers[buffer_num].color_indexes[n];
  }
Methoden, die auf beliebige Pufferdaten zugreifen, tun dies nun durch die Angabe eines Arrays des gewünschten Puffers:
//+------------------------------------------------------------------+
//| Disable timeseries indexing of buffer arrays                     |
//+------------------------------------------------------------------+
void CIndMSTF::SetAsSeriesOff(void)
  {
//--- In a loop through all indicator buffers, disable the array as timeseries flag
   for(int i=0;i<(int)this.BuffersTotal();i++)
     {
      ::ArraySetAsSeries(this.m_buffers[i].array0,false);
      ::ArraySetAsSeries(this.m_buffers[i].array1,false);
      ::ArraySetAsSeries(this.m_buffers[i].array2,false);
      ::ArraySetAsSeries(this.m_buffers[i].array3,false);
      ::ArraySetAsSeries(this.m_buffers[i].color_indexes,false);
     }
  }
//+------------------------------------------------------------------+
//| Returns the timeseries flag of the given buffer                  |
//+------------------------------------------------------------------+
bool CIndMSTF::IsSeries(const uint buffer_num,const uint array_num) const
  {
//--- Validate the buffer number passed to the method and, if the number is incorrect, print a message to the log and return 'false'
   if(buffer_num>this.BuffersTotal()-1)
     {
      string buff_limit=(this.BuffersTotal()==1 ? "0" : "0 - "+string(this.BuffersTotal()-1));
      ::PrintFormat("%s: Invalid buffer number passed (%lu). Value must be %s",__FUNCTION__,buffer_num,buff_limit);
      return false;
     }
//--- Return the timeseries flag of the array of the specified buffer
   switch(array_num)
     {
      case 0 : return (bool)::ArrayGetAsSeries(this.m_buffers[buffer_num].array0);
      case 1 : return (bool)::ArrayGetAsSeries(this.m_buffers[buffer_num].array1);
      case 2 : return (bool)::ArrayGetAsSeries(this.m_buffers[buffer_num].array2);
      case 3 : return (bool)::ArrayGetAsSeries(this.m_buffers[buffer_num].array3);
      case 4 : return (bool)::ArrayGetAsSeries(this.m_buffers[buffer_num].color_indexes);
      default: break;
     }
   return false;
  }
//+------------------------------------------------------------------+
//| Returns the amount of data in the specified buffer               |
//+------------------------------------------------------------------+
uint CIndMSTF::DataTotal(const uint buffer_num,const uint array_num) const
  {
//--- Validate the buffer number passed to method and, if number is incorrect, print a message to log and return zero
   if(buffer_num>this.BuffersTotal()-1)
     {
      string buff_limit=(this.BuffersTotal()==1 ? "0" : "0 - "+string(this.BuffersTotal()-1));
      ::PrintFormat("%s: Invalid buffer number passed (%lu). Value must be %s",__FUNCTION__,buffer_num,buff_limit);
      return 0;
     }
//--- Return the array size of the specified buffer
   switch(array_num)
     {
      case 0 : return this.m_buffers[buffer_num].array0.Size();
      case 1 : return this.m_buffers[buffer_num].array1.Size();
      case 2 : return this.m_buffers[buffer_num].array2.Size();
      case 3 : return this.m_buffers[buffer_num].array3.Size();
      case 4 : return this.m_buffers[buffer_num].color_indexes.Size();
      default: break;
     }
   return 0;
  }
Methode, die die Anzahl der im Puffer eingestellten Farben zurückgibt:
//+------------------------------------------------------------------+
//| Return the number of colors set for the buffer                   |
//+------------------------------------------------------------------+
uint CIndMSTF::ColorsTotal(const uint buffer_num) const
  {
//--- Validate the buffer number passed to method and, if number is incorrect, print a message to log and return zero
   if(buffer_num>this.BuffersTotal()-1)
     {
      string buff_limit=(this.BuffersTotal()==1 ? "0" : "0 - "+string(this.BuffersTotal()-1));
      ::PrintFormat("%s: Invalid buffer number passed (%lu). Value must be %s",__FUNCTION__,buffer_num,buff_limit);
      return 0;
     }
//--- Return the size of the color array of the specified buffer
   return this.m_buffers[buffer_num].clrs.Size();
  }
Die Klassen der technischen Standardindikatoren wurden ebenfalls erweitert. Jetzt gibt der Klassenkonstruktor die Zeichenstile jedes Indikatorpuffers und den Index des Quellarrays an, auf dem der Indikatorklassenpuffer aufgebaut ist:
//+------------------------------------------------------------------+
//| Accelerator Oscillator indicator class                           |
//+------------------------------------------------------------------+
class CIndAC : public CIndMSTF
  {
public:
//--- Constructor
   CIndAC(const string symbol,const ENUM_TIMEFRAMES timeframe) : CIndMSTF(IND_AC,1,symbol,timeframe)
     {
      //--- Create description of parameters
      //--- If non-current chart symbol or period, their descriptions are added to parameters
      bool current=(this.Symbol()==::Symbol() && this.Timeframe()==::Period());
      string symbol_period=(current ? "" : ::StringFormat("%s,%s",this.Symbol(),this.TimeframeDescription()));
      string param=(current ? "" : StringFormat("(%s)",symbol_period));
      //--- Write description of parameters, indicator name, its description, title and category
      this.SetParameters(param);
      this.SetName("AC");
      this.SetDescription("Accelerator Oscillator");
      this.m_title=this.Name()+this.Parameters();
      this.m_category=IND_CATEGORY_WILLIAMS;
      this.m_digits=::Digits()+2;
      //--- Write description of line buffers
      this.SetBufferDescription(0,this.m_title);
      //--- Set drawing style for buffer 0 and number of the calculation part data buffer
      this.SetBufferDrawType(0,DRAW_COLOR_HISTOGRAM,0);
      //--- Set two default colors for the color buffer 0
      this.SetBufferColorToIndex(0,0,clrGreen);
      this.SetBufferColorToIndex(0,1,clrRed);
      //--- Set the default initializing color index
      this.SetBufferInitColorIndex(0,0);
     }
  };
Für Farbpuffer setzen wir auch Standardlinienfarben wie im entsprechenden Standardindikator und den Index der Farbe, mit der der Puffer initialisiert wird.
Auflistung der Klassen anderer Standardindikatoren (einige Indikatorklassen sind noch nicht endgültig festgelegt):
//+------------------------------------------------------------------+ //| Accumulation/Distribution indicator class | //+------------------------------------------------------------------+ class CIndAD : public CIndMSTF { public: //--- Constructor CIndAD(const string symbol,const ENUM_TIMEFRAMES timeframe, const ENUM_APPLIED_VOLUME applied_volume // used volume ) : CIndMSTF(IND_AD,1,symbol,timeframe) { //--- Set the size of the parameter array and fill it ::ResetLastError(); if(::ArrayResize(this.m_param,1)==1) { ::ZeroMemory(this.m_param); this.m_param[0].type=TYPE_UINT; this.m_param[0].integer_value=applied_volume; } else ::PrintFormat("%s: ArrayResize failed. Error %ld",__FUNCTION__,::GetLastError()); //--- Create description of parameters //--- If non-current chart symbol or period, their descriptions are added to parameters bool current=(this.Symbol()==::Symbol() && this.Timeframe()==::Period()); string symbol_period=(current ? "" : ::StringFormat("%s,%s",this.Symbol(),this.TimeframeDescription())); string param=(current ? "" : StringFormat("(%s)",symbol_period)); //--- Write description of parameters, indicator name, its description, title, category and Digits this.SetParameters(param); this.SetName("A/D"); this.SetDescription("Accumulation/Distribution"); this.m_title=this.Name()+this.Parameters(); this.m_category=IND_CATEGORY_VOLUME; this.m_digits=0; //--- Write description of line buffers this.SetBufferDescription(0,this.m_title); //--- Set drawing style for buffer 0 and the data buffer number of the calculation part this.SetBufferDrawType(0,DRAW_LINE,0); //--- Set the default color for buffer 0 this.SetBufferColorToIndex(0,0,clrLightSeaGreen); } }; //+------------------------------------------------------------------+ //| Average Directional Movement Index indicator class | //+------------------------------------------------------------------+ class CIndADX : public CIndMSTF { public: //--- Constructor CIndADX(const string symbol,const ENUM_TIMEFRAMES timeframe, const int adx_period // averaging period ) : CIndMSTF(IND_ADX,3,symbol,timeframe) { // Buffer numbers: 0 - MAIN_LINE, 1 - PLUSDI_LINE, 2 - MINUSDI_LINE //--- Set the size of the parameter array and fill it ::ResetLastError(); if(::ArrayResize(this.m_param,1)==1) { ::ZeroMemory(this.m_param); this.m_param[0].type=TYPE_UINT; this.m_param[0].integer_value=(adx_period<1 ? 14 : adx_period); } else ::PrintFormat("%s: ArrayResize failed. Error %ld",__FUNCTION__,::GetLastError()); //--- Create description of parameters //--- If non-current chart symbol or period, their descriptions are added to parameters bool current=(this.Symbol()==::Symbol() && this.Timeframe()==::Period()); string symbol_period=(current ? "" : ::StringFormat("%s,%s",this.Symbol(),this.TimeframeDescription())); string param=StringFormat("(%s%s%lu)",symbol_period,(current ? "" : ":"),adx_period); //--- Write description of parameters, indicator name, its description, title, category and Digits this.SetParameters(param); this.SetName("ADX"); this.SetDescription("Average Directional Movement Index"); this.m_title=this.Name()+this.Parameters(); this.m_category=IND_CATEGORY_TREND; this.m_digits=2; //--- write descriptions of MAIN_LINE, PLUSDI_LINE and MINUSDI_LINE line buffers this.SetBufferDescription(MAIN_LINE,this.m_title); this.SetBufferDescription(PLUSDI_LINE,"+DI"); this.SetBufferDescription(MINUSDI_LINE,"-DI"); //--- Set drawing style for buffers 0, 1, 2 and the numbers of calculation part data buffers this.SetBufferDrawType(0,DRAW_LINE,MAIN_LINE); this.SetBufferDrawType(1,DRAW_LINE,PLUSDI_LINE); this.SetBufferDrawType(2,DRAW_LINE,MINUSDI_LINE); //--- Set default colors for buffers 0, 1 and 2 this.SetBufferColorToIndex(MAIN_LINE,0,clrLightSeaGreen); this.SetBufferColorToIndex(PLUSDI_LINE,0,clrYellowGreen); this.SetBufferColorToIndex(MINUSDI_LINE,0,clrWheat); } }; //+------------------------------------------------------------------+ //| Average Directional Movement Index Wilder indicator class | //+------------------------------------------------------------------+ class CIndADXW : public CIndMSTF { public: //--- Constructor CIndADXW(const string symbol,const ENUM_TIMEFRAMES timeframe, const int adx_period // averaging period ) : CIndMSTF(IND_ADXW,3,symbol,timeframe) { // Buffer numbers: 0 - MAIN_LINE, 1 - PLUSDI_LINE, 2 - MINUSDI_LINE //--- Set the size of the parameter array and fill it ::ResetLastError(); if(::ArrayResize(this.m_param,1)==1) { ::ZeroMemory(this.m_param); this.m_param[0].type=TYPE_UINT; this.m_param[0].integer_value=(adx_period<1 ? 14 : adx_period); } else ::PrintFormat("%s: ArrayResize failed. Error %ld",__FUNCTION__,::GetLastError()); //--- Create description of parameters //--- If non-current chart symbol or period, their descriptions are added to parameters bool current=(this.Symbol()==::Symbol() && this.Timeframe()==::Period()); string symbol_period=(current ? "" : ::StringFormat("%s,%s",this.Symbol(),this.TimeframeDescription())); string param=StringFormat("(%s%s%lu)",symbol_period,(current ? "" : ":"),adx_period); //--- Write description of parameters, indicator name, its description, title, category and Digits this.SetParameters(param); this.SetName("ADX Wilder"); this.SetDescription("Average Directional Movement Index Wilder"); this.m_title=this.Name()+this.Parameters(); this.m_category=IND_CATEGORY_TREND; this.m_digits=2; //--- write descriptions of MAIN_LINE, PLUSDI_LINE and MINUSDI_LINE line buffers this.SetBufferDescription(MAIN_LINE,this.m_title); this.SetBufferDescription(PLUSDI_LINE,"+DI"); this.SetBufferDescription(MINUSDI_LINE,"-DI"); //--- Set drawing style for buffers 0, 1, 2 and the numbers of calculation part data buffers this.SetBufferDrawType(0,DRAW_LINE,MAIN_LINE); this.SetBufferDrawType(1,DRAW_LINE,PLUSDI_LINE); this.SetBufferDrawType(2,DRAW_LINE,MINUSDI_LINE); //--- Set default colors for buffers 0, 1 and 2 this.SetBufferColorToIndex(MAIN_LINE,0,clrLightSeaGreen); this.SetBufferColorToIndex(PLUSDI_LINE,0,clrYellowGreen); this.SetBufferColorToIndex(MINUSDI_LINE,0,clrWheat); } }; //+------------------------------------------------------------------+ //| Alligator indicator class | //+------------------------------------------------------------------+ class CIndAlligator : public CIndMSTF { public: //--- Constructor CIndAlligator(const string symbol,const ENUM_TIMEFRAMES timeframe, const int jaw_period, // period for calculating jaws const int jaw_shift, // horizontal shift of jaws const int teeth_period, // period for calculating teeth const int teeth_shift, // horizontal shift of teeth const int lips_period, // period for calculating lips const int lips_shift, // horizontal shift of lips const ENUM_MA_METHOD ma_method, // smoothing type const ENUM_APPLIED_PRICE applied_price // price type or handle ) : CIndMSTF(IND_ALLIGATOR,3,symbol,timeframe) { // Buffer indexes: 0 - GATORJAW_LINE, 1 - GATORTEETH_LINE, 2 - GATORLIPS_LINE //--- Set the size of the parameter array and fill it ::ResetLastError(); if(::ArrayResize(this.m_param,8)==8) { ::ZeroMemory(this.m_param); //--- period for jaw line calculation this.m_param[0].type=TYPE_UINT; this.m_param[0].integer_value=(jaw_period<1 ? 13 : jaw_period); //--- horizontal shift of the jaw line this.m_param[1].type=TYPE_INT; this.m_param[1].integer_value=jaw_shift; //--- period for teeth line calculation this.m_param[2].type=TYPE_UINT; this.m_param[2].integer_value=(teeth_period<1 ? 8 : teeth_period); //--- horizontal shift of teeth line this.m_param[3].type=TYPE_INT; this.m_param[3].integer_value=teeth_shift; //--- period for lip line calculation this.m_param[4].type=TYPE_UINT; this.m_param[4].integer_value=(lips_period<1 ? 5 : lips_period); //--- horizontal shift of lips line this.m_param[5].type=TYPE_INT; this.m_param[5].integer_value=lips_shift; //--- smoothing type this.m_param[6].type=TYPE_UINT; this.m_param[6].integer_value=ma_method; //--- price type or handle this.m_param[7].type=TYPE_UINT; this.m_param[7].integer_value=applied_price; } else ::PrintFormat("%s: ArrayResize failed. Error %ld",__FUNCTION__,::GetLastError()); //--- Create description of parameters //--- If non-current chart symbol or period, their descriptions are added to parameters bool current=(this.Symbol()==::Symbol() && this.Timeframe()==::Period()); string symbol_period=(current ? "" : ::StringFormat("%s,%s",this.Symbol(),this.TimeframeDescription())); string param=StringFormat("(%s%s%lu,%lu,%lu)",symbol_period,(current ? "" : ":"),jaw_period,teeth_period,lips_period); //--- Write description of parameters, indicator name, its description, title and category this.SetParameters(param); this.SetName("Alligator"); this.SetDescription("Alligator"); this.m_title=this.Name()+this.Parameters(); this.m_category=IND_CATEGORY_WILLIAMS; //--- Write descriptions of GATORJAW_LINE, GATORTEETH_LINE and GATORLIPS_LINE line buffers this.SetBufferDescription(GATORJAW_LINE,::StringFormat("Jaws(%s%lu)", (current ? "" : symbol_period+":"),jaw_period)); this.SetBufferDescription(GATORTEETH_LINE,::StringFormat("Teeth(%s%lu)",(current ? "" : symbol_period+":"),teeth_period)); this.SetBufferDescription(GATORLIPS_LINE,::StringFormat("Lips(%s%lu)", (current ? "" : symbol_period+":"),lips_period)); //--- Write offsets to buffers GATORJAW_LINE, GATORTEETH_LINE and GATORLIPS_LINE this.SetBufferShift(GATORJAW_LINE,jaw_shift); this.SetBufferShift(GATORTEETH_LINE,teeth_shift); this.SetBufferShift(GATORLIPS_LINE,lips_shift); //--- Set drawing style for buffers 0, 1, 2 and the numbers of calculation part data buffers this.SetBufferDrawType(0,DRAW_LINE,GATORJAW_LINE); this.SetBufferDrawType(1,DRAW_LINE,GATORTEETH_LINE); this.SetBufferDrawType(2,DRAW_LINE,GATORLIPS_LINE); //--- Set default colors for buffers 0, 1 and 2 this.SetBufferColorToIndex(GATORJAW_LINE,0,clrBlue); this.SetBufferColorToIndex(GATORTEETH_LINE,0,clrRed); this.SetBufferColorToIndex(GATORLIPS_LINE,0,clrLime); } }; //+------------------------------------------------------------------+ //| Adaptive Moving Average indicator class | //+------------------------------------------------------------------+ class CIndAMA : public CIndMSTF { public: //--- Constructor CIndAMA(const string symbol,const ENUM_TIMEFRAMES timeframe, const int ama_period, // AMA period const int fast_ma_period, // fast MA period const int slow_ma_period, // slow MA period const int ama_shift, // horizontal shift of the indicator const ENUM_APPLIED_PRICE applied_price // price type or handle ) : CIndMSTF(IND_AMA,1,symbol,timeframe) { //--- Set the size of the parameter array and fill it ::ResetLastError(); if(::ArrayResize(this.m_param,5)==5) { ::ZeroMemory(this.m_param); //--- AMA period this.m_param[0].type=TYPE_UINT; this.m_param[0].integer_value=(ama_period<1 ? 9 : ama_period); //--- fast MA period this.m_param[1].type=TYPE_UINT; this.m_param[1].integer_value=(fast_ma_period<1 ? 2 : fast_ma_period); //--- slow MA period this.m_param[2].type=TYPE_UINT; this.m_param[2].integer_value=(slow_ma_period<1 ? 30 : slow_ma_period); //--- horizontal shift of the indicator this.m_param[3].type=TYPE_INT; this.m_param[3].integer_value=ama_shift; //--- price type or handle this.m_param[4].type=TYPE_UINT; this.m_param[4].integer_value=applied_price; } else ::PrintFormat("%s: ArrayResize failed. Error %ld",__FUNCTION__,::GetLastError()); //--- Create description of parameters //--- If non-current chart symbol or period, their descriptions are added to parameters bool current=(this.Symbol()==::Symbol() && this.Timeframe()==::Period()); string symbol_period=(current ? "" : ::StringFormat("%s,%s",this.Symbol(),this.TimeframeDescription())); string param=StringFormat("(%s%s%lu,%lu,%lu)",symbol_period,(current ? "" : ":"),ama_period,fast_ma_period,slow_ma_period); //--- Write description of parameters, indicator name, its description, title, category and Digits this.SetParameters(param); this.SetName("AMA"); this.SetDescription("Adaptive Moving Average"); this.m_title=this.Name()+this.Parameters(); this.m_category=IND_CATEGORY_TREND; this.m_digits=::Digits()+1; //--- Write description of line buffers this.SetBufferDescription(0,this.m_title); //--- Write shift to buffer 0 this.SetBufferShift(0,ama_shift); //--- Set drawing style for buffer 0 and the data buffer number of the calculation part this.SetBufferDrawType(0,DRAW_LINE,0); //--- Set the default color for buffer 0 this.SetBufferColorToIndex(0,0,clrRed); } }; //+------------------------------------------------------------------+ //| Awesome Oscillator indicator class | //+------------------------------------------------------------------+ class CIndAO : public CIndMSTF { public: //--- Constructor CIndAO(const string symbol,const ENUM_TIMEFRAMES timeframe) : CIndMSTF(IND_AO,1,symbol,timeframe) { //--- Create description of parameters //--- If non-current chart symbol or period, their descriptions are added to parameters bool current=(this.Symbol()==::Symbol() && this.Timeframe()==::Period()); string symbol_period=(current ? "" : ::StringFormat("%s,%s",this.Symbol(),this.TimeframeDescription())); string param=(current ? "" : StringFormat("(%s)",symbol_period)); //--- Write description of parameters, indicator name, its description, title, category and Digits this.SetParameters(param); this.SetName("AO"); this.SetDescription("Awesome Oscillator"); this.m_title=this.Name()+this.Parameters(); this.m_category=IND_CATEGORY_WILLIAMS; this.m_digits=::Digits()+1; //--- Write description of line buffers this.SetBufferDescription(0,this.m_title); //--- Set drawing style for buffer 0 and the data buffer number of the calculation part this.SetBufferDrawType(0,DRAW_COLOR_HISTOGRAM,0); //--- Set two default colors for the color buffer 0 this.SetBufferColorToIndex(0,0,clrGreen); this.SetBufferColorToIndex(0,1,clrRed); //--- Set the default initializing color index this.SetBufferInitColorIndex(0,0); } }; //+------------------------------------------------------------------+ //| Average True Range indicator class | //+------------------------------------------------------------------+ class CIndATR : public CIndMSTF { public: //--- Constructor CIndATR(const string symbol,const ENUM_TIMEFRAMES timeframe, const int ma_period // averaging period ) : CIndMSTF(IND_ATR,1,symbol,timeframe) { //--- Set the size of the parameter array and fill it ::ResetLastError(); if(::ArrayResize(this.m_param,1)==1) { ::ZeroMemory(this.m_param); this.m_param[0].type=TYPE_UINT; this.m_param[0].integer_value=(ma_period<1 ? 14 : ma_period); } else ::PrintFormat("%s: ArrayResize failed. Error %ld",__FUNCTION__,::GetLastError()); //--- Create description of parameters //--- If non-current chart symbol or period, their descriptions are added to parameters bool current=(this.Symbol()==::Symbol() && this.Timeframe()==::Period()); string symbol_period=(current ? "" : ::StringFormat("%s,%s",this.Symbol(),this.TimeframeDescription())); string param=StringFormat("(%s%s%lu)",symbol_period,(current ? "" : ":"),ma_period); //--- Write description of parameters, indicator name, its description, title and category this.SetParameters(param); this.SetName("ATR"); this.SetDescription("Average True Range"); this.m_title=this.Name()+this.Parameters(); this.m_category=IND_CATEGORY_OSCILLATOR; //--- Write description of line buffers this.SetBufferDescription(0,this.m_title); //--- Set drawing style for buffer 0 and the data buffer number of the calculation part this.SetBufferDrawType(0,DRAW_LINE,0); //--- Set the default color for buffer 0 this.SetBufferColorToIndex(0,0,clrLightSeaGreen); } }; //+------------------------------------------------------------------+ //| Bears Power indicator class | //+------------------------------------------------------------------+ class CIndBears : public CIndMSTF { public: //--- Constructor CIndBears(const string symbol,const ENUM_TIMEFRAMES timeframe, const int ma_period // averaging period ) : CIndMSTF(IND_BEARS,1,symbol,timeframe) { //--- Set the size of the parameter array and fill it ::ResetLastError(); if(::ArrayResize(this.m_param,1)==1) { ::ZeroMemory(this.m_param); this.m_param[0].type=TYPE_UINT; this.m_param[0].integer_value=(ma_period<1 ? 13 : ma_period); } else ::PrintFormat("%s: ArrayResize failed. Error %ld",__FUNCTION__,::GetLastError()); //--- Create description of parameters //--- If non-current chart symbol or period, their descriptions are added to parameters bool current=(this.Symbol()==::Symbol() && this.Timeframe()==::Period()); string symbol_period=(current ? "" : ::StringFormat("%s,%s",this.Symbol(),this.TimeframeDescription())); string param=StringFormat("(%s%s%lu)",symbol_period,(current ? "" : ":"),ma_period); //--- Write description of parameters, indicator name, its description, title, category and Digits this.SetParameters(param); this.SetName("Bears"); this.SetDescription("Bears Power"); this.m_title=this.Name()+this.Parameters(); this.m_category=IND_CATEGORY_OSCILLATOR; this.m_digits=::Digits()+1; //--- Write description of line buffers this.SetBufferDescription(0,this.m_title); //--- Set drawing style for buffer 0 and the data buffer number of the calculation part this.SetBufferDrawType(0,DRAW_HISTOGRAM,0); //--- Set the default color for buffer 0 this.SetBufferColorToIndex(0,0,clrSilver); } }; //+------------------------------------------------------------------+ //| Bulls Power indicator class | //+------------------------------------------------------------------+ class CIndBulls : public CIndMSTF { public: //--- Constructor CIndBulls(const string symbol,const ENUM_TIMEFRAMES timeframe, const int ma_period // averaging period ) : CIndMSTF(IND_BULLS,1,symbol,timeframe) { //--- Set the size of the parameter array and fill it ::ResetLastError(); if(::ArrayResize(this.m_param,1)==1) { ::ZeroMemory(this.m_param); this.m_param[0].type=TYPE_UINT; this.m_param[0].integer_value=(ma_period<1 ? 13 : ma_period); } else ::PrintFormat("%s: ArrayResize failed. Error %ld",__FUNCTION__,::GetLastError()); //--- Create description of parameters //--- If non-current chart symbol or period, their descriptions are added to parameters bool current=(this.Symbol()==::Symbol() && this.Timeframe()==::Period()); string symbol_period=(current ? "" : ::StringFormat("%s,%s",this.Symbol(),this.TimeframeDescription())); string param=StringFormat("(%s%s%lu)",symbol_period,(current ? "" : ":"),ma_period); //--- Write description of parameters, indicator name, its description, title, category and Digits this.SetParameters(param); this.SetName("Bulls"); this.SetDescription("Bulls Power"); this.m_title=this.Name()+this.Parameters(); this.m_category=IND_CATEGORY_OSCILLATOR; this.m_digits=::Digits()+1; //--- Write description of line buffers this.SetBufferDescription(0,this.m_title); //--- Set drawing style for buffer 0 and the data buffer number of the calculation part this.SetBufferDrawType(0,DRAW_HISTOGRAM,0); //--- Set the default color for buffer 0 this.SetBufferColorToIndex(0,0,clrSilver); } }; //+------------------------------------------------------------------+ //| Bollinger Bands® indicator class | //+------------------------------------------------------------------+ class CIndBands : public CIndMSTF { public: //--- Constructor CIndBands(const string symbol,const ENUM_TIMEFRAMES timeframe, const int bands_period, // central line calculation period const int bands_shift, // horizontal shift of the indicator const double deviation, // number of standard deviations const ENUM_APPLIED_PRICE applied_price // price type or handle ) : CIndMSTF(IND_BANDS,3,symbol,timeframe) { // Buffer indexes: 0 - BASE_LINE, 1 - UPPER_BAND, 2 - LOWER_BAND //--- Set the size of the parameter array and fill it ::ResetLastError(); if(::ArrayResize(this.m_param,4)==4) { ::ZeroMemory(this.m_param); //--- central line calculation period this.m_param[0].type=TYPE_UINT; this.m_param[0].integer_value=(bands_period<1 ? 20 : bands_period); //--- horizontal shift of the indicator this.m_param[1].type=TYPE_INT; this.m_param[1].integer_value=bands_shift; //--- number of standard deviations this.m_param[2].type=TYPE_DOUBLE; this.m_param[2].double_value=deviation; //--- price type or handle this.m_param[3].type=TYPE_UINT; this.m_param[3].integer_value=applied_price; } else ::PrintFormat("%s: ArrayResize failed. Error %ld",__FUNCTION__,::GetLastError()); //--- Create description of parameters //--- If non-current chart symbol or period, their descriptions are added to parameters bool current=(this.Symbol()==::Symbol() && this.Timeframe()==::Period()); string symbol_period=(current ? "" : ::StringFormat("%s,%s",this.Symbol(),this.TimeframeDescription())); string param=StringFormat("(%s%s%lu)",symbol_period,(current ? "" : ":"),bands_period); //--- Write description of parameters, indicator name, its description, title, category and Digits this.SetParameters(param); this.SetName("Bands"); this.SetDescription("Bollinger Bands"); this.m_title=this.Name()+this.Parameters(); this.m_category=IND_CATEGORY_TREND; this.m_digits=::Digits()+1; //--- Description of line buffers BASE_LINE, UPPER_BAND and LOWER_BAND this.SetBufferDescription(BASE_LINE,this.m_title+" Middle"); this.SetBufferDescription(UPPER_BAND,this.m_title+" Upper"); this.SetBufferDescription(LOWER_BAND,this.m_title+" Lower"); //--- Write offsets to the BASE_LINE, UPPER_BAND and LOWER_BAND buffers this.SetBufferShift(BASE_LINE,bands_shift); this.SetBufferShift(UPPER_BAND,bands_shift); this.SetBufferShift(LOWER_BAND,bands_shift); //--- Set drawing style for buffers 0, 1, 2 and the numbers of calculation part data buffers this.SetBufferDrawType(0,DRAW_LINE,BASE_LINE); this.SetBufferDrawType(1,DRAW_LINE,UPPER_BAND); this.SetBufferDrawType(2,DRAW_LINE,LOWER_BAND); //--- Set default colors for buffers 0, 1 and 2 this.SetBufferColorToIndex(BASE_LINE,0,clrMediumSeaGreen); this.SetBufferColorToIndex(UPPER_BAND,0,clrMediumSeaGreen); this.SetBufferColorToIndex(LOWER_BAND,0,clrMediumSeaGreen); } }; //+------------------------------------------------------------------+ //| Commodity Channel Index indicator class | //+------------------------------------------------------------------+ class CIndCCI : public CIndMSTF { public: //--- Constructor CIndCCI(const string symbol,const ENUM_TIMEFRAMES timeframe, const int ma_period, // averaging period const ENUM_APPLIED_PRICE applied_price // price type or handle ) : CIndMSTF(IND_CCI,1,symbol,timeframe) { //--- Set the size of the parameter array and fill it ::ResetLastError(); if(::ArrayResize(this.m_param,2)==2) { ::ZeroMemory(this.m_param); //--- averaging period this.m_param[0].type=TYPE_UINT; this.m_param[0].integer_value=(ma_period<1 ? 14 : ma_period<2 ? 2 : ma_period); //--- price type or handle this.m_param[1].type=TYPE_UINT; this.m_param[1].integer_value=applied_price; } else ::PrintFormat("%s: ArrayResize failed. Error %ld",__FUNCTION__,::GetLastError()); //--- Create description of parameters //--- If non-current chart symbol or period, their descriptions are added to parameters bool current=(this.Symbol()==::Symbol() && this.Timeframe()==::Period()); string symbol_period=(current ? "" : ::StringFormat("%s,%s",this.Symbol(),this.TimeframeDescription())); string param=StringFormat("(%s%s%lu)",symbol_period,(current ? "" : ":"),ma_period); //--- Write description of parameters, indicator name, its description, title, category and Digits this.SetParameters(param); this.SetName("CCI"); this.SetDescription("Commodity Channel Index"); this.m_title=this.Name()+this.Parameters(); this.m_category=IND_CATEGORY_OSCILLATOR; this.m_digits=2; //--- Write description of line buffers this.SetBufferDescription(0,this.m_title); //--- Set drawing style for buffer 0 and the data buffer number of the calculation part this.SetBufferDrawType(0,DRAW_LINE,0); //--- Set the default color for buffer 0 this.SetBufferColorToIndex(0,0,clrLightSeaGreen); } }; //+------------------------------------------------------------------+ //| Chaikin Oscillator indicator class | //+------------------------------------------------------------------+ class CIndCHO : public CIndMSTF { public: //--- Constructor CIndCHO(const string symbol,const ENUM_TIMEFRAMES timeframe, const int fast_ma_period, // fast period const int slow_ma_period, // slow period const ENUM_MA_METHOD ma_method, // smoothing type const ENUM_APPLIED_VOLUME applied_volume // used volume ) : CIndMSTF(IND_CHAIKIN,1,symbol,timeframe) { //--- Set the size of the parameter array and fill it ::ResetLastError(); if(::ArrayResize(this.m_param,4)==4) { ::ZeroMemory(this.m_param); //--- fast period this.m_param[0].type=TYPE_UINT; this.m_param[0].integer_value=(fast_ma_period<1 ? 3 : fast_ma_period); //--- slow period this.m_param[1].type=TYPE_UINT; this.m_param[1].integer_value=(slow_ma_period<1 ? 10 : slow_ma_period); //--- smoothing type this.m_param[2].type=TYPE_UINT; this.m_param[2].integer_value=ma_method; //--- used volume this.m_param[3].type=TYPE_UINT; this.m_param[3].integer_value=applied_volume; } else ::PrintFormat("%s: ArrayResize failed. Error %ld",__FUNCTION__,::GetLastError()); //--- Create description of parameters //--- If non-current chart symbol or period, their descriptions are added to parameters bool current=(this.Symbol()==::Symbol() && this.Timeframe()==::Period()); string symbol_period=(current ? "" : ::StringFormat("%s,%s",this.Symbol(),this.TimeframeDescription())); string param=StringFormat("(%s%s%lu,%lu)",symbol_period,(current ? "" : ":"),slow_ma_period,fast_ma_period); //--- Write description of parameters, indicator name, its description, title, category and Digits this.SetParameters(param); this.SetName("CHO"); this.SetDescription("Chaikin Oscillator"); this.m_title=this.Name()+this.Parameters(); this.m_category=IND_CATEGORY_OSCILLATOR; this.m_digits=0; //--- Write description of line buffers this.SetBufferDescription(0,this.m_title); //--- Set drawing style for buffer 0 and the data buffer number of the calculation part this.SetBufferDrawType(0,DRAW_LINE,0); //--- Set the default color for buffer 0 this.SetBufferColorToIndex(0,0,clrLightSeaGreen); } }; //+------------------------------------------------------------------+ //| Double Exponential Moving Average indicator class | //+------------------------------------------------------------------+ class CIndDEMA : public CIndMSTF { public: //--- Constructor CIndDEMA(const string symbol,const ENUM_TIMEFRAMES timeframe, const int ma_period, // averaging period const int ma_shift, // horizontal indicator shift const ENUM_APPLIED_PRICE applied_price // price type or handle ) : CIndMSTF(IND_DEMA,1,symbol,timeframe) { //--- Set the size of the parameter array and fill it ::ResetLastError(); if(::ArrayResize(this.m_param,3)==3) { ::ZeroMemory(this.m_param); //--- averaging period this.m_param[0].type=TYPE_UINT; this.m_param[0].integer_value=(ma_period<1 ? 14 : ma_period); //--- horizontal shift of the indicator this.m_param[1].type=TYPE_INT; this.m_param[1].integer_value=ma_shift; //--- price type or handle this.m_param[2].type=TYPE_UINT; this.m_param[2].integer_value=applied_price; } else ::PrintFormat("%s: ArrayResize failed. Error %ld",__FUNCTION__,::GetLastError()); //--- Create description of parameters //--- If non-current chart symbol or period, their descriptions are added to parameters bool current=(this.Symbol()==::Symbol() && this.Timeframe()==::Period()); string symbol_period=(current ? "" : ::StringFormat("%s,%s",this.Symbol(),this.TimeframeDescription())); string param=StringFormat("(%s%s%lu)",symbol_period,(current ? "" : ":"),ma_period); //--- Write description of parameters, indicator name, its description, title, category and Digits this.SetParameters(param); this.SetName("DEMA"); this.SetDescription("Double Exponential Moving Average"); this.m_title=this.Name()+this.Parameters(); this.m_category=IND_CATEGORY_TREND; this.m_digits=::Digits()+1; //--- Write description of line buffers this.SetBufferDescription(0,this.m_title); //--- Write shift to buffer 0 this.SetBufferShift(0,ma_shift); //--- Set drawing style for buffer 0 and the data buffer number of the calculation part this.SetBufferDrawType(0,DRAW_LINE,0); //--- Set the default color for buffer 0 this.SetBufferColorToIndex(0,0,clrRed); } }; //+------------------------------------------------------------------+ //| DeMarker indicator class | //+------------------------------------------------------------------+ class CIndDeM : public CIndMSTF { public: //--- Constructor CIndDeM(const string symbol,const ENUM_TIMEFRAMES timeframe, const int ma_period // averaging period ) : CIndMSTF(IND_DEMARKER,1,symbol,timeframe) { //--- Set the size of the parameter array and fill it ::ResetLastError(); if(::ArrayResize(this.m_param,1)==1) { ::ZeroMemory(this.m_param); //--- averaging period this.m_param[0].type=TYPE_UINT; this.m_param[0].integer_value=(ma_period<1 ? 14 : ma_period); } else ::PrintFormat("%s: ArrayResize failed. Error %ld",__FUNCTION__,::GetLastError()); //--- Create description of parameters //--- If non-current chart symbol or period, their descriptions are added to parameters bool current=(this.Symbol()==::Symbol() && this.Timeframe()==::Period()); string symbol_period=(current ? "" : ::StringFormat("%s,%s",this.Symbol(),this.TimeframeDescription())); string param=StringFormat("(%s%s%lu)",symbol_period,(current ? "" : ":"),ma_period); //--- Write description of parameters, indicator name, its description, title, category and Digits this.SetParameters(param); this.SetName("DeM"); this.SetDescription("DeMarker"); this.m_title=this.Name()+this.Parameters(); this.m_category=IND_CATEGORY_OSCILLATOR; this.m_digits=3; //--- Write description of line buffers this.SetBufferDescription(0,this.m_title); //--- Set drawing style for buffer 0 and the data buffer number of the calculation part this.SetBufferDrawType(0,DRAW_LINE,0); //--- Set the default color for buffer 0 this.SetBufferColorToIndex(0,0,clrLightSeaGreen); } }; //+------------------------------------------------------------------+ //| Envelopes indicator class | //+------------------------------------------------------------------+ class CIndEnvelopes : public CIndMSTF { public: //--- Constructor CIndEnvelopes(const string symbol,const ENUM_TIMEFRAMES timeframe, const int ma_period, // middle line calculation period const int ma_shift, // horizontal shift of the indicator const ENUM_MA_METHOD ma_method, // smoothing type const ENUM_APPLIED_PRICE applied_price, // price type or handle const double deviation // deviation of envelope borders from the middle line ) : CIndMSTF(IND_ENVELOPES,2,symbol,timeframe) { // Buffer indexes: 0 - UPPER_LINE, 1 - LOWER_LINE //--- Set the size of the parameter array and fill it ::ResetLastError(); if(::ArrayResize(this.m_param,5)==5) { ::ZeroMemory(this.m_param); //--- central line calculation period this.m_param[0].type=TYPE_UINT; this.m_param[0].integer_value=(ma_period<1 ? 14 : ma_period); //--- horizontal shift of the indicator this.m_param[1].type=TYPE_INT; this.m_param[1].integer_value=ma_shift; //--- smoothing type this.m_param[2].type=TYPE_UINT; this.m_param[2].integer_value=ma_method; //--- price type or handle this.m_param[3].type=TYPE_UINT; this.m_param[3].integer_value=applied_price; //--- deviation of envelope borders from the muddle line this.m_param[4].type=TYPE_DOUBLE; this.m_param[4].double_value=deviation; } else ::PrintFormat("%s: ArrayResize failed. Error %ld",__FUNCTION__,::GetLastError()); //--- Create description of parameters //--- If non-current chart symbol or period, their descriptions are added to parameters bool current=(this.Symbol()==::Symbol() && this.Timeframe()==::Period()); string symbol_period=(current ? "" : ::StringFormat("%s,%s",this.Symbol(),this.TimeframeDescription())); string param=StringFormat("(%s%s%lu)",symbol_period,(current ? "" : ":"),ma_period); //--- Write description of parameters, indicator name, its description, title, category and Digits this.SetParameters(param); this.SetName("Envelopes"); this.SetDescription("Envelopes"); this.m_title=this.Name()+this.Parameters(); this.m_category=IND_CATEGORY_TREND; this.m_digits=::Digits()+1; //--- Description of UPPER_LINE and LOWER_LINE line buffers this.SetBufferDescription(UPPER_LINE,this.m_title+" Upper"); this.SetBufferDescription(LOWER_LINE,this.m_title+" Lower"); //--- Write shift to buffers this.SetBufferShift(0,ma_shift); this.SetBufferShift(1,ma_shift); //--- Set drawing style for buffers 0 and 1 and the numbers of calculation part data buffers this.SetBufferDrawType(0,DRAW_LINE,UPPER_LINE); this.SetBufferDrawType(1,DRAW_LINE,LOWER_LINE); //--- Set default colors for buffers 0 and 1 this.SetBufferColorToIndex(UPPER_LINE,0,clrBlue); this.SetBufferColorToIndex(LOWER_LINE,0,clrRed); } }; //+------------------------------------------------------------------+ //| Force Index indicator class | //+------------------------------------------------------------------+ class CIndForce : public CIndMSTF { public: //--- Constructor CIndForce(const string symbol,const ENUM_TIMEFRAMES timeframe, const int ma_period, // averaging period const ENUM_MA_METHOD ma_method, // smoothing type const ENUM_APPLIED_VOLUME applied_volume // volume type for calculation ) : CIndMSTF(IND_FORCE,1,symbol,timeframe) { //--- Set the size of the parameter array and fill it ::ResetLastError(); if(::ArrayResize(this.m_param,3)==3) { ::ZeroMemory(this.m_param); //--- averaging period this.m_param[0].type=TYPE_UINT; this.m_param[0].integer_value=(ma_period<1 ? 13 : ma_period); //--- smoothing type this.m_param[1].type=TYPE_UINT; this.m_param[1].integer_value=ma_method; //--- volume type for calculation this.m_param[2].type=TYPE_UINT; this.m_param[2].integer_value=applied_volume; } else ::PrintFormat("%s: ArrayResize failed. Error %ld",__FUNCTION__,::GetLastError()); //--- Create description of parameters //--- If non-current chart symbol or period, their descriptions are added to parameters bool current=(this.Symbol()==::Symbol() && this.Timeframe()==::Period()); string symbol_period=(current ? "" : ::StringFormat("%s,%s",this.Symbol(),this.TimeframeDescription())); string param=StringFormat("(%s%s%lu)",symbol_period,(current ? "" : ":"),ma_period); //--- Write description of parameters, indicator name, its description, title, category and Digits this.SetParameters(param); this.SetName("Force"); this.SetDescription("Force Index"); this.m_title=this.Name()+this.Parameters(); this.m_category=IND_CATEGORY_OSCILLATOR; this.m_digits=::Digits()+1; //--- Write description of line buffers this.SetBufferDescription(0,this.m_title); //--- Set drawing style for buffer 0 and the data buffer number of the calculation part this.SetBufferDrawType(0,DRAW_LINE,0); //--- Set the default color for buffer 0 this.SetBufferColorToIndex(0,0,clrLightSeaGreen); } }; //+------------------------------------------------------------------+ //| Fractals indicator class | //+------------------------------------------------------------------+ class CIndFractals : public CIndMSTF { public: //--- Constructor CIndFractals(const string symbol,const ENUM_TIMEFRAMES timeframe) : CIndMSTF(IND_FRACTALS,2,symbol,timeframe) { // Buffer indexes: 0 - UPPER_LINE, 1 - LOWER_LINE //--- Create description of parameters //--- If non-current chart symbol or period, their descriptions are added to parameters bool current=(this.Symbol()==::Symbol() && this.Timeframe()==::Period()); string symbol_period=(current ? "" : ::StringFormat("%s,%s",this.Symbol(),this.TimeframeDescription())); string param=(current ? "" : StringFormat("(%s)",symbol_period)); //--- Write description of parameters, indicator name, its description, title and category this.SetParameters(param); this.SetName("Fractals"); this.SetDescription("Fractals"); this.m_title=this.Name()+this.Parameters(); this.m_category=IND_CATEGORY_WILLIAMS; //--- Description of UPPER_LINE and LOWER_LINE line buffers this.SetBufferDescription(UPPER_LINE,this.m_title+" Up"); this.SetBufferDescription(LOWER_LINE,this.m_title+" Down"); //--- Set drawing style for buffers 0 and 1 and the numbers of calculation part data buffers this.SetBufferDrawType(0,DRAW_ARROW,UPPER_LINE); this.SetBufferDrawType(1,DRAW_ARROW,LOWER_LINE); //--- Set default colors for buffers 0 and 1 this.SetBufferColorToIndex(UPPER_LINE,0,clrGray); this.SetBufferColorToIndex(LOWER_LINE,0,clrGray); } }; //+------------------------------------------------------------------+ //| Fractal Adaptive Moving Average indicator class | //+------------------------------------------------------------------+ class CIndFrAMA : public CIndMSTF { public: //--- Constructor CIndFrAMA(const string symbol,const ENUM_TIMEFRAMES timeframe, const int ma_period, // averaging period const int ma_shift, // horizontal shift of the indicator const ENUM_APPLIED_PRICE applied_price // price type or handle ) : CIndMSTF(IND_FRAMA,1,symbol,timeframe) { //--- Set the size of the parameter array and fill it ::ResetLastError(); if(::ArrayResize(this.m_param,3)==3) { ::ZeroMemory(this.m_param); //--- averaging period this.m_param[0].type=TYPE_UINT; this.m_param[0].integer_value=(ma_period<1 ? 14 : ma_period); //--- horizontal shift of the indicator this.m_param[1].type=TYPE_INT; this.m_param[1].integer_value=ma_shift; //--- price type or handle this.m_param[2].type=TYPE_UINT; this.m_param[2].integer_value=applied_price; } else ::PrintFormat("%s: ArrayResize failed. Error %ld",__FUNCTION__,::GetLastError()); //--- Create description of parameters //--- If non-current chart symbol or period, their descriptions are added to parameters bool current=(this.Symbol()==::Symbol() && this.Timeframe()==::Period()); string symbol_period=(current ? "" : ::StringFormat("%s,%s",this.Symbol(),this.TimeframeDescription())); string param=StringFormat("(%s%s%lu)",symbol_period,(current ? "" : ":"),ma_period); //--- Write description of parameters, indicator name, its description, title, category and Digits this.SetParameters(param); this.SetName("FRAMA"); this.SetDescription("Fractal Adaptive Moving Average"); this.m_title=this.Name()+this.Parameters(); this.m_category=IND_CATEGORY_TREND; this.m_digits=::Digits()+1; //--- Write description of line buffers this.SetBufferDescription(0,this.m_title); //--- Write shift to buffer 0 this.SetBufferShift(0,ma_shift); //--- Set drawing style for buffer 0 and the data buffer number of the calculation part this.SetBufferDrawType(0,DRAW_LINE,0); //--- Set the default color for buffer 0 this.SetBufferColorToIndex(0,0,clrBlue); } }; //+------------------------------------------------------------------+ //| Gator Oscillator indicator class | //+------------------------------------------------------------------+ class CIndGator : public CIndMSTF { public: //--- Constructor CIndGator(const string symbol,const ENUM_TIMEFRAMES timeframe, const int jaw_period, // period for jaw line calculation const int jaw_shift, // horizontal shift of jaw line const int teeth_period, // period for calculating teeth line const int teeth_shift, // horizontal shift of teeth line const int lips_period, // period for calculating lip line const int lips_shift, // horizontal shift of lip line const ENUM_MA_METHOD ma_method, // smoothing type const ENUM_APPLIED_PRICE applied_price // price type or handle ) : CIndMSTF(IND_GATOR,2,symbol,timeframe) { // Buffer indexes: 0 - UPPER_HISTOGRAM, 1 - color buffer of the upper histogram, 2 - LOWER_HISTOGRAM, 3 - color buffer of the lower histogram //--- Set the size of the parameter array and fill it ::ResetLastError(); if(::ArrayResize(this.m_param,8)==8) { ::ZeroMemory(this.m_param); //--- period for jaw line calculation this.m_param[0].type=TYPE_UINT; this.m_param[0].integer_value=(jaw_period<1 ? 13 : jaw_period); //--- horizontal shift of the jaw line this.m_param[1].type=TYPE_INT; this.m_param[1].integer_value=jaw_shift; //--- period for teeth line calculation this.m_param[2].type=TYPE_UINT; this.m_param[2].integer_value=(teeth_period<1 ? 8 : teeth_period); //--- horizontal shift of teeth line this.m_param[3].type=TYPE_INT; this.m_param[3].integer_value=teeth_shift; //--- period for lip line calculation this.m_param[4].type=TYPE_UINT; this.m_param[4].integer_value=(lips_period<1 ? 5 : lips_period); //--- horizontal shift of lips line this.m_param[5].type=TYPE_INT; this.m_param[5].integer_value=lips_shift; //--- smoothing type this.m_param[6].type=TYPE_UINT; this.m_param[6].integer_value=ma_method; //--- price type or handle this.m_param[7].type=TYPE_UINT; this.m_param[7].integer_value=applied_price; } else ::PrintFormat("%s: ArrayResize failed. Error %ld",__FUNCTION__,::GetLastError()); //--- Create description of parameters //--- If non-current chart symbol or period, their descriptions are added to parameters bool current=(this.Symbol()==::Symbol() && this.Timeframe()==::Period()); string symbol_period=(current ? "" : ::StringFormat("%s,%s",this.Symbol(),this.TimeframeDescription())); string param=StringFormat("(%s%s%lu,%lu,%lu)",symbol_period,(current ? "" : ":"),jaw_period,teeth_period,lips_period); //--- Write description of parameters, indicator name, its description, title, category and Digits this.SetParameters(param); this.SetName("Gator"); this.SetDescription("Gator Oscillator"); this.m_title=this.Name()+this.Parameters(); this.m_category=IND_CATEGORY_WILLIAMS; this.m_digits=::Digits()+1; //--- Description of line buffers UPPER_HISTOGRAM, upper histogram color buffer, LOWER_HISTOGRAM and lower histogram color buffer this.SetBufferDescription(0,this.m_title+" Up"); this.SetBufferDescription(1,this.m_title+" Down"); //--- Write shift to buffers UPPER_HISTOGRAM, 1, LOWER_HISTOGRAM and 2 this.SetBufferShift(0,teeth_shift); this.SetBufferShift(1,lips_shift); //--- Set drawing style for buffers 0 and 1 and the numbers of calculation part data buffers this.SetBufferDrawType(0,DRAW_COLOR_HISTOGRAM,UPPER_HISTOGRAM); this.SetBufferDrawType(1,DRAW_COLOR_HISTOGRAM,LOWER_HISTOGRAM); //--- Set default colors for color buffers this.SetBufferColorToIndex(0,0,clrGreen); this.SetBufferColorToIndex(0,1,clrRed); this.SetBufferColorToIndex(1,0,clrGreen); this.SetBufferColorToIndex(1,1,clrRed); //--- Set the default initializing color index this.SetBufferInitColorIndex(0,0); this.SetBufferInitColorIndex(1,0); } }; //+------------------------------------------------------------------+ //| Ichimoku Kinko Hyo indicator class | //+------------------------------------------------------------------+ class CIndIchimoku : public CIndMSTF { public: //--- Constructor CIndIchimoku(const string symbol,const ENUM_TIMEFRAMES timeframe, const int tenkan_sen, // period of Tenkan-sen const int kijun_sen, // period of Kijun-sen const int senkou_span_b // period of Senkou Span B ) : CIndMSTF(IND_ICHIMOKU,5,symbol,timeframe) { // Buffer indexes: 0 - TENKANSEN_LINE, 1 - KIJUNSEN_LINE, 2 - SENKOUSPANA_LINE, 3 - SENKOUSPANB_LINE, 4 - CHIKOUSPAN_LINE //--- Set the size of the parameter array and fill it ::ResetLastError(); if(::ArrayResize(this.m_param,3)==3) { ::ZeroMemory(this.m_param); //--- period of Tenkan-sen this.m_param[0].type=TYPE_UINT; this.m_param[0].integer_value=(tenkan_sen<1 ? 9 : tenkan_sen); //--- period of Kijun-sen this.m_param[1].type=TYPE_UINT; this.m_param[1].integer_value=(kijun_sen<1 ? 26 : kijun_sen); //--- period of Senkou Span B this.m_param[2].type=TYPE_UINT; this.m_param[2].integer_value=(senkou_span_b<1 ? 52 : senkou_span_b); } else ::PrintFormat("%s: ArrayResize failed. Error %ld",__FUNCTION__,::GetLastError()); //--- Create description of parameters //--- If non-current chart symbol or period, their descriptions are added to parameters bool current=(this.Symbol()==::Symbol() && this.Timeframe()==::Period()); string symbol_period=(current ? "" : ::StringFormat("%s,%s",this.Symbol(),this.TimeframeDescription())); string param=StringFormat("(%s%s%lu,%lu,%lu)",symbol_period,(current ? "" : ":"),tenkan_sen,kijun_sen,senkou_span_b); //--- Write description of parameters, indicator name, its description, title, category and Digits this.SetParameters(param); this.SetName("Ichimoku"); this.SetDescription("Ichimoku Kinko Hyo"); this.m_title=this.Name()+this.Parameters(); this.m_category=IND_CATEGORY_TREND; this.m_digits=::Digits()+1; //--- Description of line buffers TENKANSEN_LINE, KIJUNSEN_LINE, SENKOUSPANA_LINE, SENKOUSPANB_LINE and CHIKOUSPAN_LINE this.SetBufferDescription(TENKANSEN_LINE,::StringFormat("Tenkan-sen(%lu)",tenkan_sen)); this.SetBufferDescription(KIJUNSEN_LINE,::StringFormat("Kijun-sen(%lu)",kijun_sen)); this.SetBufferDescription(SENKOUSPANA_LINE,"Senkou Span A"); this.SetBufferDescription(SENKOUSPANB_LINE,::StringFormat("Senkou Span B(%lu)",senkou_span_b)); this.SetBufferDescription(CHIKOUSPAN_LINE,"Chikou Span"); //--- Write shifts to buffers SENKOUSPANA_LINE, SENKOUSPANB_LINE and CHIKOUSPAN_LINE //this.SetBufferShift(SENKOUSPANA_LINE,kijun_sen); //this.SetBufferShift(SENKOUSPANB_LINE,kijun_sen); //this.SetBufferShift(CHIKOUSPAN_LINE,kijun_sen-senkou_span_b); } }; //+------------------------------------------------------------------+ //| Market Facilitation Index indicator class | //+------------------------------------------------------------------+ class CIndBWMFI : public CIndMSTF { public: //--- Constructor CIndBWMFI(const string symbol,const ENUM_TIMEFRAMES timeframe, const ENUM_APPLIED_VOLUME applied_volume // volume type for calculation ) : CIndMSTF(IND_BWMFI,1,symbol,timeframe) { //--- Set the size of the parameter array and fill it ::ResetLastError(); if(::ArrayResize(this.m_param,1)==1) { ::ZeroMemory(this.m_param); //--- volume type for calculation this.m_param[0].type=TYPE_UINT; this.m_param[0].integer_value=applied_volume; } else ::PrintFormat("%s: ArrayResize failed. Error %ld",__FUNCTION__,::GetLastError()); //--- Create description of parameters //--- If non-current chart symbol or period, their descriptions are added to parameters bool current=(this.Symbol()==::Symbol() && this.Timeframe()==::Period()); string symbol_period=(current ? "" : ::StringFormat("%s,%s",this.Symbol(),this.TimeframeDescription())); string param=(current ? "" : StringFormat("(%s)",symbol_period)); //--- Write description of parameters, indicator name, its description, title and category this.SetParameters(param); this.SetName("BW MFI"); this.SetDescription("Market Facilitation Index"); this.m_title=this.Name()+this.Parameters(); this.m_category=IND_CATEGORY_WILLIAMS; //--- Write description of line buffers this.SetBufferDescription(0,this.m_title); //--- Set drawing style for buffer 0 and the data buffer number of the calculation part this.SetBufferDrawType(0,DRAW_COLOR_HISTOGRAM,0); //--- Set four default colors for the color buffer 0 this.SetBufferColorToIndex(0,0,clrLime); this.SetBufferColorToIndex(0,1,clrSaddleBrown); this.SetBufferColorToIndex(0,2,clrBlue); this.SetBufferColorToIndex(0,3,clrPink); //--- Set the default initializing color index this.SetBufferInitColorIndex(0,0); } }; //+------------------------------------------------------------------+ //| Momentum indicator class | //+------------------------------------------------------------------+ class CIndMomentum : public CIndMSTF { public: //--- Constructor CIndMomentum(const string symbol,const ENUM_TIMEFRAMES timeframe, const int mom_period, // averaging period const ENUM_APPLIED_PRICE applied_price // price type or handle ) : CIndMSTF(IND_MOMENTUM,1,symbol,timeframe) { //--- Set the size of the parameter array and fill it ::ResetLastError(); if(::ArrayResize(this.m_param,2)==2) { ::ZeroMemory(this.m_param); //--- averaging period this.m_param[0].type=TYPE_UINT; this.m_param[0].integer_value=(mom_period<1 ? 14 : mom_period); //--- price type or handle this.m_param[1].type=TYPE_UINT; this.m_param[1].integer_value=applied_price; } else ::PrintFormat("%s: ArrayResize failed. Error %ld",__FUNCTION__,::GetLastError()); //--- Create description of parameters //--- If non-current chart symbol or period, their descriptions are added to parameters bool current=(this.Symbol()==::Symbol() && this.Timeframe()==::Period()); string symbol_period=(current ? "" : ::StringFormat("%s,%s",this.Symbol(),this.TimeframeDescription())); string param=StringFormat("(%s%s%lu)",symbol_period,(current ? "" : ":"),mom_period); //--- Write description of parameters, indicator name, its description, title, category and Digits this.SetParameters(param); this.SetName("Momentum"); this.SetDescription("Momentum"); this.m_title=this.Name()+this.Parameters(); this.m_category=IND_CATEGORY_OSCILLATOR; this.m_digits=2; //--- Write description of line buffers this.SetBufferDescription(0,this.m_title); //--- Set drawing style for buffer 0 and the data buffer number of the calculation part this.SetBufferDrawType(0,DRAW_LINE,0); //--- Set the default color for buffer 0 this.SetBufferColorToIndex(0,0,clrDodgerBlue); } }; //+------------------------------------------------------------------+ //| Money Flow Index indicator class | //+------------------------------------------------------------------+ class CIndMFI : public CIndMSTF { public: //--- Constructor CIndMFI(const string symbol,const ENUM_TIMEFRAMES timeframe, const int ma_period, // averaging period const ENUM_APPLIED_VOLUME applied_volume // volume type for calculation ) : CIndMSTF(IND_MFI,1,symbol,timeframe) { //--- Set the size of the parameter array and fill it ::ResetLastError(); if(::ArrayResize(this.m_param,2)==2) { ::ZeroMemory(this.m_param); //--- averaging period this.m_param[0].type=TYPE_UINT; this.m_param[0].integer_value=(ma_period<1 ? 14 : ma_period); //--- volume type for calculation this.m_param[1].type=TYPE_UINT; this.m_param[1].integer_value=applied_volume; } else ::PrintFormat("%s: ArrayResize failed. Error %ld",__FUNCTION__,::GetLastError()); //--- Create description of parameters //--- If non-current chart symbol or period, their descriptions are added to parameters bool current=(this.Symbol()==::Symbol() && this.Timeframe()==::Period()); string symbol_period=(current ? "" : ::StringFormat("%s,%s",this.Symbol(),this.TimeframeDescription())); string param=StringFormat("(%s%s%lu)",symbol_period,(current ? "" : ":"),ma_period); //--- Write description of parameters, indicator name, its description, title and category this.SetParameters(param); this.SetName("MFI"); this.SetDescription("Money Flow Index"); this.m_title=this.Name()+this.Parameters(); this.m_category=IND_CATEGORY_VOLUME; //--- Write description of line buffers this.SetBufferDescription(0,this.m_title); //--- Set drawing style for buffer 0 and the data buffer number of the calculation part this.SetBufferDrawType(0,DRAW_LINE,0); //--- Set the default color for buffer 0 this.SetBufferColorToIndex(0,0,clrDodgerBlue); } }; //+------------------------------------------------------------------+ //| Moving Average indicator class | //+------------------------------------------------------------------+ class CIndMA : public CIndMSTF { public: //--- Constructor CIndMA(const string symbol,const ENUM_TIMEFRAMES timeframe, const int ma_period, // averaging period const int ma_shift, // horizontal shift of the indicator const ENUM_MA_METHOD ma_method, // smoothing type const ENUM_APPLIED_PRICE applied_price // price type or handle ) : CIndMSTF(IND_MA,1,symbol,timeframe) { //--- Set the size of the parameter array and fill it ::ResetLastError(); if(::ArrayResize(this.m_param,4)==4) { ::ZeroMemory(this.m_param); //--- averaging period this.m_param[0].type=TYPE_UINT; this.m_param[0].integer_value=(ma_period<1 ? 10 : ma_period); //--- horizontal shift of the indicator this.m_param[1].type=TYPE_INT; this.m_param[1].integer_value=ma_shift; //--- smoothing type this.m_param[2].type=TYPE_UINT; this.m_param[2].integer_value=ma_method; //--- price type or handle this.m_param[3].type=TYPE_UINT; this.m_param[3].integer_value=applied_price; } else ::PrintFormat("%s: ArrayResize failed. Error %ld",__FUNCTION__,::GetLastError()); //--- Create description of parameters //--- If non-current chart symbol or period, their descriptions are added to parameters bool current=(this.Symbol()==::Symbol() && this.Timeframe()==::Period()); string symbol_period=(current ? "" : ::StringFormat("%s,%s",this.Symbol(),this.TimeframeDescription())); string param=StringFormat("(%s%s%lu)",symbol_period,(current ? "" : ":"),ma_period); //--- Write description of parameters, indicator name, its description, title, category and Digits this.SetParameters(param); this.SetName("MA"); this.SetDescription("Moving Average"); this.m_title=this.Name()+this.Parameters(); this.m_category=IND_CATEGORY_TREND; this.m_digits=::Digits()+1; //--- Write description of line buffers this.SetBufferDescription(0,this.m_title); //--- Write shift to buffer 0 this.SetBufferShift(0,ma_shift); //--- Set drawing style for buffer 0 and the data buffer number of the calculation part this.SetBufferDrawType(0,DRAW_LINE,0); //--- Set the default color for buffer 0 this.SetBufferColorToIndex(0,0,clrRed); } }; //+------------------------------------------------------------------+ //| Moving Average of Oscillator indicator class | //+------------------------------------------------------------------+ class CIndOsMA : public CIndMSTF { public: //--- Constructor CIndOsMA(const string symbol,const ENUM_TIMEFRAMES timeframe, const int fast_ema_period, // fast MA period const int slow_ema_period, // slow MA period const int signal_period, // difference averaging period const ENUM_APPLIED_PRICE applied_price // price type or handle ) : CIndMSTF(IND_OSMA,1,symbol,timeframe) { //--- Set the size of the parameter array and fill it ::ResetLastError(); if(::ArrayResize(this.m_param,4)==4) { ::ZeroMemory(this.m_param); //--- fast MA period this.m_param[0].type=TYPE_UINT; this.m_param[0].integer_value=(fast_ema_period<1 ? 12 : fast_ema_period); //--- slow MA period this.m_param[1].type=TYPE_UINT; this.m_param[1].integer_value=(slow_ema_period<1 ? 26 : slow_ema_period); //--- difference averaging period this.m_param[2].type=TYPE_UINT; this.m_param[2].integer_value=(signal_period<1 ? 9 : signal_period<2 ? 2 : signal_period); //--- price type or handle this.m_param[3].type=TYPE_UINT; this.m_param[3].integer_value=applied_price; } else ::PrintFormat("%s: ArrayResize failed. Error %ld",__FUNCTION__,::GetLastError()); //--- Create description of parameters //--- If non-current chart symbol or period, their descriptions are added to parameters bool current=(this.Symbol()==::Symbol() && this.Timeframe()==::Period()); string symbol_period=(current ? "" : ::StringFormat("%s,%s",this.Symbol(),this.TimeframeDescription())); string param=StringFormat("(%s%s%lu,%lu,%lu)",symbol_period,(current ? "" : ":"),fast_ema_period,slow_ema_period,signal_period); //--- Write description of parameters, indicator name, its description, title, category and Digits this.SetParameters(param); this.SetName("OsMA"); this.SetDescription("Moving Average of Oscillator"); this.m_title=this.Name()+this.Parameters(); this.m_category=IND_CATEGORY_OSCILLATOR; this.m_digits=::Digits()+2; //--- Write description of line buffers this.SetBufferDescription(0,this.m_title); //--- Set drawing style for buffer 0 and the data buffer number of the calculation part this.SetBufferDrawType(0,DRAW_HISTOGRAM,0); //--- Set the default color for buffer 0 this.SetBufferColorToIndex(0,0,clrSilver); } }; //+------------------------------------------------------------------+ //| Moving Averages Convergence/Divergence indicator class | //+------------------------------------------------------------------+ class CIndMACD : public CIndMSTF { public: //--- Constructor CIndMACD(const string symbol,const ENUM_TIMEFRAMES timeframe, const int fast_ema_period, // fast MA period const int slow_ema_period, // slow MA period const int signal_period, // difference averaging period const ENUM_APPLIED_PRICE applied_price // price type or handle ) : CIndMSTF(IND_MACD,2,symbol,timeframe) { // Buffer indexes: 0 - MAIN_LINE, 1 - SIGNAL_LINE //--- Set the size of the parameter array and fill it ::ResetLastError(); if(::ArrayResize(this.m_param,4)==4) { ::ZeroMemory(this.m_param); //--- fast MA period this.m_param[0].type=TYPE_UINT; this.m_param[0].integer_value=(fast_ema_period<1 ? 12 : fast_ema_period); //--- slow MA period this.m_param[1].type=TYPE_UINT; this.m_param[1].integer_value=(slow_ema_period<1 ? 26 : slow_ema_period); //--- difference averaging period this.m_param[2].type=TYPE_UINT; this.m_param[2].integer_value=(signal_period<1 ? 9 : signal_period); //--- price type or handle this.m_param[3].type=TYPE_UINT; this.m_param[3].integer_value=applied_price; } else ::PrintFormat("%s: ArrayResize failed. Error %ld",__FUNCTION__,::GetLastError()); //--- Create description of parameters //--- If non-current chart symbol or period, their descriptions are added to parameters bool current=(this.Symbol()==::Symbol() && this.Timeframe()==::Period()); string symbol_period=(current ? "" : ::StringFormat("%s,%s",this.Symbol(),this.TimeframeDescription())); string param=StringFormat("(%s%s%lu,%lu,%lu)",symbol_period,(current ? "" : ":"),fast_ema_period,slow_ema_period,signal_period); //--- Write description of parameters, indicator name, its description, title, category and Digits this.SetParameters(param); this.SetName("MACD"); this.SetDescription("Moving Averages Convergence/Divergence"); this.m_title=this.Name()+this.Parameters(); this.m_category=IND_CATEGORY_OSCILLATOR; this.m_digits=::Digits()+1; //--- Description of MAIN_LINE and SIGNAL_LINE line buffers this.SetBufferDescription(MAIN_LINE,this.m_title); this.SetBufferDescription(SIGNAL_LINE,"Signal"); //--- Set drawing style for buffers 0 and 1 and the numbers of calculation part data buffers this.SetBufferDrawType(0,DRAW_HISTOGRAM,MAIN_LINE); this.SetBufferDrawType(1,DRAW_LINE,SIGNAL_LINE); //--- Set default colors for buffers 0 and 1 this.SetBufferColorToIndex(MAIN_LINE,0,clrSilver); this.SetBufferColorToIndex(SIGNAL_LINE,0,clrRed); } }; //+------------------------------------------------------------------+ //| On Balance Volume indicator class | //+------------------------------------------------------------------+ class CIndOBV : public CIndMSTF { public: //--- Constructor CIndOBV(const string symbol,const ENUM_TIMEFRAMES timeframe, const ENUM_APPLIED_VOLUME applied_volume // volume type for calculation ) : CIndMSTF(IND_OBV,1,symbol,timeframe) { //--- Set the size of the parameter array and fill it ::ResetLastError(); if(::ArrayResize(this.m_param,1)==1) { ::ZeroMemory(this.m_param); //--- volume type for calculation this.m_param[0].type=TYPE_UINT; this.m_param[0].integer_value=applied_volume; } else ::PrintFormat("%s: ArrayResize failed. Error %ld",__FUNCTION__,::GetLastError()); //--- Create description of parameters //--- If non-current chart symbol or period, their descriptions are added to parameters bool current=(this.Symbol()==::Symbol() && this.Timeframe()==::Period()); string symbol_period=(current ? "" : ::StringFormat("%s,%s",this.Symbol(),this.TimeframeDescription())); string param=(current ? "" : StringFormat("(%s)",symbol_period)); //--- Write description of parameters, indicator name, its description, title, category and Digits this.SetParameters(param); this.SetName("OBV"); this.SetDescription("On Balance Volume"); this.m_title=this.Name()+this.Parameters(); this.m_category=IND_CATEGORY_VOLUME; this.m_digits=0; //--- Write description of line buffers this.SetBufferDescription(0,this.m_title); //--- Set drawing style for buffer 0 and the data buffer number of the calculation part this.SetBufferDrawType(0,DRAW_LINE,0); //--- Set the default color for buffer 0 this.SetBufferColorToIndex(0,0,clrLightSeaGreen); } }; //+------------------------------------------------------------------+ //| Parabolic Stop and Reverse system indicator class | //+------------------------------------------------------------------+ class CIndSAR : public CIndMSTF { public: //--- Constructor CIndSAR(const string symbol,const ENUM_TIMEFRAMES timeframe, const double step, // price change step — acceleration factor const double maximum // maximum step ) : CIndMSTF(IND_SAR,1,symbol,timeframe) { //--- Set the size of the parameter array and fill it ::ResetLastError(); if(::ArrayResize(this.m_param,2)==2) { ::ZeroMemory(this.m_param); //--- price change step — acceleration factor this.m_param[0].type=TYPE_DOUBLE; this.m_param[0].double_value=step; //--- maximum step this.m_param[1].type=TYPE_DOUBLE; this.m_param[1].double_value=maximum; } else ::PrintFormat("%s: ArrayResize failed. Error %ld",__FUNCTION__,::GetLastError()); //--- Create description of parameters //--- If non-current chart symbol or period, their descriptions are added to parameters bool current=(this.Symbol()==::Symbol() && this.Timeframe()==::Period()); string symbol_period=(current ? "" : ::StringFormat("%s,%s",this.Symbol(),this.TimeframeDescription())); string param=StringFormat("(%s%s%.2f,%.2f)",symbol_period,(current ? "" : ":"),step,maximum); //--- Write description of parameters, indicator name, its description, title and category this.SetParameters(param); this.SetName("SAR"); this.SetDescription("Parabolic SAR"); this.m_title=this.Name()+this.Parameters(); this.m_category=IND_CATEGORY_TREND; //--- Write description of line buffers this.SetBufferDescription(0,this.m_title); //--- Set drawing style for buffer 0 and the data buffer number of the calculation part this.SetBufferDrawType(0,DRAW_ARROW,0); //--- Set the default color for buffer 0 this.SetBufferColorToIndex(0,0,clrLime); } }; //+------------------------------------------------------------------+ //| Relative Strength Index indicator class | //+------------------------------------------------------------------+ class CIndRSI : public CIndMSTF { public: //--- Constructor CIndRSI(const string symbol,const ENUM_TIMEFRAMES timeframe, const int ma_period, // averaging period const ENUM_APPLIED_PRICE applied_price // price type or handle ) : CIndMSTF(IND_RSI,1,symbol,timeframe) { //--- Set the size of the parameter array and fill it ::ResetLastError(); if(::ArrayResize(this.m_param,2)==2) { ::ZeroMemory(this.m_param); //--- averaging period this.m_param[0].type=TYPE_UINT; this.m_param[0].integer_value=(ma_period<1 ? 14 : ma_period<2 ? 2 : ma_period); //--- price type or handle this.m_param[1].type=TYPE_UINT; this.m_param[1].integer_value=applied_price; } else ::PrintFormat("%s: ArrayResize failed. Error %ld",__FUNCTION__,::GetLastError()); //--- Create description of parameters //--- If non-current chart symbol or period, their descriptions are added to parameters bool current=(this.Symbol()==::Symbol() && this.Timeframe()==::Period()); string symbol_period=(current ? "" : ::StringFormat("%s,%s",this.Symbol(),this.TimeframeDescription())); string param=StringFormat("(%s%s%lu)",symbol_period,(current ? "" : ":"),ma_period); //--- Write description of parameters, indicator name, its description, title, category and Digits this.SetParameters(param); this.SetName("RSI"); this.SetDescription("Relative Strength Index"); this.m_title=this.Name()+this.Parameters(); this.m_category=IND_CATEGORY_OSCILLATOR; this.m_digits=2; //--- Write description of line buffers this.SetBufferDescription(0,this.m_title); //--- Set drawing style for buffer 0 and the data buffer number of the calculation part this.SetBufferDrawType(0,DRAW_LINE,0); //--- Set the default color for buffer 0 this.SetBufferColorToIndex(0,0,clrDodgerBlue); } }; //+------------------------------------------------------------------+ //| Relative Vigor Index indicator class | //+------------------------------------------------------------------+ class CIndRVI : public CIndMSTF { public: //--- Constructor CIndRVI(const string symbol,const ENUM_TIMEFRAMES timeframe, const int ma_period // averaging period ) : CIndMSTF(IND_RVI,2,symbol,timeframe) { // Buffer indexes: 0 - MAIN_LINE, 1 - SIGNAL_LINE //--- Set the size of the parameter array and fill it ::ResetLastError(); if(::ArrayResize(this.m_param,1)==1) { ::ZeroMemory(this.m_param); //--- averaging period this.m_param[0].type=TYPE_UINT; this.m_param[0].integer_value=(ma_period<1 ? 10 : ma_period); } else ::PrintFormat("%s: ArrayResize failed. Error %ld",__FUNCTION__,::GetLastError()); //--- Create description of parameters //--- If non-current chart symbol or period, their descriptions are added to parameters bool current=(this.Symbol()==::Symbol() && this.Timeframe()==::Period()); string symbol_period=(current ? "" : ::StringFormat("%s,%s",this.Symbol(),this.TimeframeDescription())); string param=StringFormat("(%s%s%lu)",symbol_period,(current ? "" : ":"),ma_period); //--- Write description of parameters, indicator name, its description, title, category and Digits this.SetParameters(param); this.SetName("RVI"); this.SetDescription("Relative Vigor Index"); this.m_title=this.Name()+this.Parameters(); this.m_category=IND_CATEGORY_OSCILLATOR; this.m_digits=3; //--- Description of MAIN_LINE and SIGNAL_LINE line buffers this.SetBufferDescription(MAIN_LINE,this.m_title); this.SetBufferDescription(SIGNAL_LINE,"Signal"); //--- Set drawing style for buffers 0 and 1 and the numbers of calculation part data buffers this.SetBufferDrawType(0,DRAW_LINE,MAIN_LINE); this.SetBufferDrawType(1,DRAW_LINE,SIGNAL_LINE); //--- Set default colors for buffers 0 and 1 this.SetBufferColorToIndex(MAIN_LINE,0,clrGreen); this.SetBufferColorToIndex(SIGNAL_LINE,0,clrRed); } }; //+------------------------------------------------------------------+ //| Standard Deviation indicator class | //+------------------------------------------------------------------+ class CIndStdDev : public CIndMSTF { public: //--- Constructor CIndStdDev(const string symbol,const ENUM_TIMEFRAMES timeframe, const int ma_period, // averaging period const int ma_shift, // horizontal shift of the indicator const ENUM_MA_METHOD ma_method, // smoothing type const ENUM_APPLIED_PRICE applied_price // price type or handle ) : CIndMSTF(IND_STDDEV,1,symbol,timeframe) { //--- Set the size of the parameter array and fill it ::ResetLastError(); if(::ArrayResize(this.m_param,4)==4) { ::ZeroMemory(this.m_param); //--- averaging period this.m_param[0].type=TYPE_UINT; this.m_param[0].integer_value=(ma_period<1 ? 20 : ma_period<2 ? 2 : ma_period); //--- horizontal shift of the indicator this.m_param[1].type=TYPE_INT; this.m_param[1].integer_value=ma_shift; //--- smoothing type this.m_param[2].type=TYPE_UINT; this.m_param[2].integer_value=ma_method; //--- price type or handle this.m_param[3].type=TYPE_UINT; this.m_param[3].integer_value=applied_price; } else ::PrintFormat("%s: ArrayResize failed. Error %ld",__FUNCTION__,::GetLastError()); //--- Create description of parameters //--- If non-current chart symbol or period, their descriptions are added to parameters bool current=(this.Symbol()==::Symbol() && this.Timeframe()==::Period()); string symbol_period=(current ? "" : ::StringFormat("%s,%s",this.Symbol(),this.TimeframeDescription())); string param=StringFormat("(%s%s%lu)",symbol_period,(current ? "" : ":"),ma_period); //--- Write description of parameters, indicator name, its description, title, category and Digits this.SetParameters(param); this.SetName("StdDev"); this.SetDescription("Standard Deviation"); this.m_title=this.Name()+this.Parameters(); this.m_category=IND_CATEGORY_TREND; this.m_digits=::Digits()+1; //--- Write description of line buffers this.SetBufferDescription(0,this.m_title); //--- Write shift to buffer 0 this.SetBufferShift(0,ma_shift); //--- Set drawing style for buffer 0 and the data buffer number of the calculation part this.SetBufferDrawType(0,DRAW_LINE,0); //--- Set the default color for buffer 0 this.SetBufferColorToIndex(0,0,clrMediumSeaGreen); } }; //+------------------------------------------------------------------+ //| Stochastic Oscillator indicator class | //+------------------------------------------------------------------+ class CIndStoch : public CIndMSTF { public: //--- Constructor CIndStoch(const string symbol,const ENUM_TIMEFRAMES timeframe, const int Kperiod, // K-period (number of bars for calculations) const int Dperiod, // D-period (primary smoothing period) const int slowing, // final smoothing const ENUM_MA_METHOD ma_method, // smoothing type const ENUM_STO_PRICE price_field // Stochastic calculation method ) : CIndMSTF(IND_STOCHASTIC,2,symbol,timeframe) { // Buffer indexes: 0 - MAIN_LINE, 1 - SIGNAL_LINE //--- Set the size of the parameter array and fill it ::ResetLastError(); if(::ArrayResize(this.m_param,5)==5) { ::ZeroMemory(this.m_param); //--- K period (number of bars for calculation) this.m_param[0].type=TYPE_UINT; this.m_param[0].integer_value=(Kperiod<1 ? 5 : Kperiod); //--- D period (primary smoothing period) this.m_param[1].type=TYPE_UINT; this.m_param[1].integer_value=(Dperiod<1 ? 3 : Dperiod); //--- final smoothing this.m_param[2].type=TYPE_UINT; this.m_param[2].integer_value=(slowing<1 ? 3 : slowing); //--- smoothing type this.m_param[3].type=TYPE_UINT; this.m_param[3].integer_value=ma_method; //--- Stochastic calculation method this.m_param[4].type=TYPE_UINT; this.m_param[4].integer_value=price_field; } else ::PrintFormat("%s: ArrayResize failed. Error %ld",__FUNCTION__,::GetLastError()); //--- Create description of parameters //--- If non-current chart symbol or period, their descriptions are added to parameters bool current=(this.Symbol()==::Symbol() && this.Timeframe()==::Period()); string symbol_period=(current ? "" : ::StringFormat("%s,%s",this.Symbol(),this.TimeframeDescription())); string param=StringFormat("(%s%s%lu,%lu,%lu)",symbol_period,(current ? "" : ":"),Kperiod,Dperiod,slowing); //--- Write description of parameters, indicator name, its description, title, category and Digits this.SetParameters(param); this.SetName("Stoch"); this.SetDescription("Stochastic Oscillator"); this.m_title=this.Name()+this.Parameters(); this.m_category=IND_CATEGORY_OSCILLATOR; this.m_digits=2; //--- Description of MAIN_LINE and SIGNAL_LINE line buffers this.SetBufferDescription(MAIN_LINE,this.m_title); this.SetBufferDescription(SIGNAL_LINE,"Signal"); //--- Set drawing style for buffers 0 and 1 and the numbers of calculation part data buffers this.SetBufferDrawType(0,DRAW_LINE,MAIN_LINE); this.SetBufferDrawType(1,DRAW_LINE,SIGNAL_LINE); //--- Set default colors for buffers 0 and 1 this.SetBufferColorToIndex(MAIN_LINE,0,clrLightSeaGreen); this.SetBufferColorToIndex(SIGNAL_LINE,0,clrRed); } }; //+------------------------------------------------------------------+ //| Triple Exponential Moving Average indicator class | //+------------------------------------------------------------------+ class CIndTEMA : public CIndMSTF { public: //--- Constructor CIndTEMA(const string symbol,const ENUM_TIMEFRAMES timeframe, const int ma_period, // averaging period const int ma_shift, // horizontal shift of the indicator const ENUM_APPLIED_PRICE applied_price // price type or handle ) : CIndMSTF(IND_TEMA,1,symbol,timeframe) { //--- Set the size of the parameter array and fill it ::ResetLastError(); if(::ArrayResize(this.m_param,3)==3) { ::ZeroMemory(this.m_param); //--- averaging period this.m_param[0].type=TYPE_UINT; this.m_param[0].integer_value=(ma_period<1 ? 14 : ma_period); //--- horizontal shift of the indicator this.m_param[1].type=TYPE_INT; this.m_param[1].integer_value=ma_shift; //--- price type or handle this.m_param[2].type=TYPE_UINT; this.m_param[2].integer_value=applied_price; } else ::PrintFormat("%s: ArrayResize failed. Error %ld",__FUNCTION__,::GetLastError()); //--- Create description of parameters //--- If non-current chart symbol or period, their descriptions are added to parameters bool current=(this.Symbol()==::Symbol() && this.Timeframe()==::Period()); string symbol_period=(current ? "" : ::StringFormat("%s,%s",this.Symbol(),this.TimeframeDescription())); string param=StringFormat("(%s%s%lu)",symbol_period,(current ? "" : ":"),ma_period); //--- Write description of parameters, indicator name, its description, title, category and Digits this.SetParameters(param); this.SetName("TEMA"); this.SetDescription("Triple Exponential Moving Average"); this.m_title=this.Name()+this.Parameters(); this.m_category=IND_CATEGORY_TREND; this.m_digits=::Digits()+1; //--- Write description of line buffers this.SetBufferDescription(0,this.m_title); //--- Write shift to buffer 0 this.SetBufferShift(0,ma_shift); //--- Set drawing style for buffer 0 and the data buffer number of the calculation part this.SetBufferDrawType(0,DRAW_LINE,0); //--- Set the default color for buffer 0 this.SetBufferColorToIndex(0,0,clrRed); } }; //+------------------------------------------------------------------+ //| Triple Exponential Moving Averages Oscillator indicator class | //+------------------------------------------------------------------+ class CIndTriX : public CIndMSTF { public: //--- Constructor CIndTriX(const string symbol,const ENUM_TIMEFRAMES timeframe, const int ma_period, // averaging period const ENUM_APPLIED_PRICE applied_price // price type or handle ) : CIndMSTF(IND_TRIX,1,symbol,timeframe) { //--- Set the size of the parameter array and fill it ::ResetLastError(); if(::ArrayResize(this.m_param,2)==2) { ::ZeroMemory(this.m_param); //--- averaging period this.m_param[0].type=TYPE_UINT; this.m_param[0].integer_value=(ma_period<1 ? 14 : ma_period<2 ? 2 : ma_period); //--- price type or handle this.m_param[1].type=TYPE_UINT; this.m_param[1].integer_value=applied_price; } else ::PrintFormat("%s: ArrayResize failed. Error %ld",__FUNCTION__,::GetLastError()); //--- Create description of parameters //--- If non-current chart symbol or period, their descriptions are added to parameters bool current=(this.Symbol()==::Symbol() && this.Timeframe()==::Period()); string symbol_period=(current ? "" : ::StringFormat("%s,%s",this.Symbol(),this.TimeframeDescription())); string param=StringFormat("(%s%s%lu)",symbol_period,(current ? "" : ":"),ma_period); //--- Write description of parameters, indicator name, its description, title and category this.SetParameters(param); this.SetName("TRIX"); this.SetDescription("Triple Exponential Average"); this.m_title=this.Name()+this.Parameters(); this.m_category=IND_CATEGORY_OSCILLATOR; //--- Write description of line buffers this.SetBufferDescription(0,this.m_title); //--- Set drawing style for buffer 0 and the data buffer number of the calculation part this.SetBufferDrawType(0,DRAW_LINE,0); //--- Set the default color for buffer 0 this.SetBufferColorToIndex(0,0,clrRed); } }; //+------------------------------------------------------------------+ //| Larry Williams' Percent Range indicator class | //+------------------------------------------------------------------+ class CIndWPR : public CIndMSTF { public: //--- Constructor CIndWPR(const string symbol,const ENUM_TIMEFRAMES timeframe, const int calc_period // averaging period ) : CIndMSTF(IND_WPR,1,symbol,timeframe) { //--- Set the size of the parameter array and fill it ::ResetLastError(); if(::ArrayResize(this.m_param,1)==1) { ::ZeroMemory(this.m_param); //--- averaging period this.m_param[0].type=TYPE_UINT; this.m_param[0].integer_value=(calc_period<1 ? 14 : calc_period); } else ::PrintFormat("%s: ArrayResize failed. Error %ld",__FUNCTION__,::GetLastError()); //--- Create description of parameters //--- If non-current chart symbol or period, their descriptions are added to parameters bool current=(this.Symbol()==::Symbol() && this.Timeframe()==::Period()); string symbol_period=(current ? "" : ::StringFormat("%s,%s",this.Symbol(),this.TimeframeDescription())); string param=StringFormat("(%s%s%lu)",symbol_period,(current ? "" : ":"),calc_period); //--- Write description of parameters, indicator name, its description, title, category and Digits this.SetParameters(param); this.SetName("%R"); this.SetDescription("Williams' Percent Range"); this.m_title=this.Name()+this.Parameters(); this.m_category=IND_CATEGORY_OSCILLATOR; this.m_digits=2; //--- Write description of line buffers this.SetBufferDescription(0,this.m_title); //--- Set drawing style for buffer 0 and the data buffer number of the calculation part this.SetBufferDrawType(0,DRAW_LINE,0); //--- Set the default color for buffer 0 this.SetBufferColorToIndex(0,0,clrAqua); } }; //+------------------------------------------------------------------+ //| Variable Index Dynamic Average indicator class | //+------------------------------------------------------------------+ class CIndVIDyA : public CIndMSTF { public: //--- Constructor CIndVIDyA(const string symbol,const ENUM_TIMEFRAMES timeframe, const int cmo_period, // the Chande Momentum period const int ema_period, // period of the smoothing factor const int ma_shift, // horizontal shift of the indicator const ENUM_APPLIED_PRICE applied_price // price type or handle ) : CIndMSTF(IND_VIDYA,1,symbol,timeframe) { //--- Set the size of the parameter array and fill it ::ResetLastError(); if(::ArrayResize(this.m_param,4)==4) { ::ZeroMemory(this.m_param); //--- Chande Momentum period this.m_param[0].type=TYPE_UINT; this.m_param[0].integer_value=(cmo_period<1 ? 9 : cmo_period); //--- smoothing factor period this.m_param[1].type=TYPE_UINT; this.m_param[1].integer_value=(ema_period<1 ? 12 : ema_period); //--- horizontal shift of the indicator this.m_param[2].type=TYPE_INT; this.m_param[2].integer_value=ma_shift; //--- price type or handle this.m_param[3].type=TYPE_UINT; this.m_param[3].integer_value=applied_price; } else ::PrintFormat("%s: ArrayResize failed. Error %ld",__FUNCTION__,::GetLastError()); //--- Create description of parameters //--- If non-current chart symbol or period, their descriptions are added to parameters bool current=(this.Symbol()==::Symbol() && this.Timeframe()==::Period()); string symbol_period=(current ? "" : ::StringFormat("%s,%s",this.Symbol(),this.TimeframeDescription())); string param=StringFormat("(%s%s%lu,%lu)",symbol_period,(current ? "" : ":"),cmo_period,ema_period); //--- Write description of parameters, indicator name, its description, title, category and Digits this.SetParameters(param); this.SetName("VIDYA"); this.SetDescription("Variable Index Dynamic Average"); this.m_title=this.Name()+this.Parameters(); this.m_category=IND_CATEGORY_TREND; this.m_digits=::Digits()+1; //--- Write description of line buffers this.SetBufferDescription(0,this.m_title); //--- Write shift to buffer 0 this.SetBufferShift(0,ma_shift); //--- Set drawing style for buffer 0 and the data buffer number of the calculation part this.SetBufferDrawType(0,DRAW_LINE,0); //--- Set the default color for buffer 0 this.SetBufferColorToIndex(0,0,clrRed); } }; //+------------------------------------------------------------------+ //| Volumes indicator class | //+------------------------------------------------------------------+ class CIndVolumes : public CIndMSTF { public: //--- Constructor CIndVolumes(const string symbol,const ENUM_TIMEFRAMES timeframe, const ENUM_APPLIED_VOLUME applied_volume // volume type ) : CIndMSTF(IND_VOLUMES,1,symbol,timeframe) { //--- Set the size of the parameter array and fill it ::ResetLastError(); if(::ArrayResize(this.m_param,1)==1) { ::ZeroMemory(this.m_param); //--- volume type this.m_param[0].type=TYPE_UINT; this.m_param[0].integer_value=applied_volume; } else ::PrintFormat("%s: ArrayResize failed. Error %ld",__FUNCTION__,::GetLastError()); //--- Create description of parameters //--- If non-current chart symbol or period, their descriptions are added to parameters bool current=(this.Symbol()==::Symbol() && this.Timeframe()==::Period()); string symbol_period=(current ? "" : ::StringFormat("%s,%s",this.Symbol(),this.TimeframeDescription())); string param=(current ? "" : StringFormat("(%s)",symbol_period)); //--- Write description of parameters, indicator name, its description, title, category and Digits this.SetParameters(param); this.SetName("Volumes"); this.SetDescription("Volumes"); this.m_title=this.Name()+this.Parameters(); this.m_category=IND_CATEGORY_VOLUME; this.m_digits=0; //--- Write description of line buffers this.SetBufferDescription(0,this.m_title); //--- Set drawing style for buffer 0 and the data buffer number of the calculation part this.SetBufferDrawType(0,DRAW_COLOR_HISTOGRAM,0); //--- Set two default colors for the color buffer 0 this.SetBufferColorToIndex(0,0,clrGreen); this.SetBufferColorToIndex(0,1,clrRed); //--- Set the default initializing color index this.SetBufferInitColorIndex(0,0); } }; //+------------------------------------------------------------------+ //| Custom indicator class | //+------------------------------------------------------------------+ class CIndCustom : public CIndMSTF { public: //--- Constructor CIndCustom(const string symbol,const ENUM_TIMEFRAMES timeframe, const string path, // path to the indicator (for example, "Examples\\MACD.ex5") const string name, // name of the custom indicator const uint buffers, // number of indicator buffers const MqlParam ¶m[] // array of custom indicator parameters ) : CIndMSTF(IND_CUSTOM,buffers,symbol,timeframe) { //--- If an empty array of parameters is passed, print this to log int total=(int)param.Size(); if(total==0) ::PrintFormat("%s Error. Passed an empty array",__FUNCTION__); //--- If the array is not empty and its size is increased by 1 (the first string parameter must contain the indicator name) ResetLastError(); if(total>0 && ::ArrayResize(this.m_param,total+1)==total+1) { //--- Reset data in the array and enter name (path to file and name of .ex5 file) ::ZeroMemory(this.m_param); //--- name of the custom indicator this.m_param[0].type=TYPE_STRING; this.m_param[0].string_value=path; //--- fill the array of indicator parameters for(int i=0;i<total;i++) { this.m_param[i+1].type=param[i].type; this.m_param[i+1].double_value=param[i].double_value; this.m_param[i+1].integer_value=param[i].integer_value; this.m_param[i+1].string_value=param[i].string_value; } //--- Create description of parameters //--- If non-current chart symbol or period, their descriptions are added to parameters bool current=(this.Symbol()==::Symbol() && this.Timeframe()==::Period()); string symbol_period=(current ? "" : ::StringFormat("%s,%s",this.Symbol(),this.TimeframeDescription())); string param=(current ? "" : StringFormat("(%s)",symbol_period)); //--- Write description of parameters, indicator name, its description, title and category this.SetParameters(param); this.SetName(name); this.SetDescription(name); this.m_title=this.Name()+this.Parameters(); this.m_category=IND_CATEGORY_CUSTOM; //--- Write a description of the first line buffer this.SetBufferDescription(0,this.m_title); } } };
Anhand des für den Puffer festgelegten Zeichenstils können wir feststellen, ob der Puffer farbig ist oder nicht, und dementsprechend bestimmte Methoden zum Zeichnen des Puffers verwenden. Da wir den Pufferindex des Berechnungsteils angeben und in den Puffer der Indikatorklasse schreiben, lässt sich leicht feststellen, aus welchem Puffer des Berechnungsteils die Daten kopiert werden sollen. Wenn es sich um einen Farbpuffer handelt, können wir, da der Farbpuffer immer neben dem Datenpuffer des Berechnungsteils liegt, genau wissen, aus welchem Puffer wir die Daten für die Linienfarbe erhalten sollen - indem wir einfach eine Eins zum Index des Puffers des Berechnungsteils hinzufügen, erhalten wir die gewünschten Indexfarben. Alle diese Daten werden bereits in den Puffer der Indikatorklasse geschrieben, was sehr praktisch ist.
In der Klasse der Indikatorenkollektion müssen wir auch bestehende Methoden erweitern und neue hinzufügen.
//+------------------------------------------------------------------+
//| Indicator collection class                                       |
//+------------------------------------------------------------------+
#include <Arrays\ArrayObj.mqh>
class CMSTFIndicators
  {
private:
   CArrayObj         m_list;
//--- Creates an indicator for the passed object
   bool              CreateIndicator(CIndMSTF *ind_obj);
//--- Adds the specified indicator to the collection
   int               AddNewIndicator(CIndMSTF *ind_obj,const string source);

public:
//--- Returns (1) indicator object by handle, (2) number of indicators in the collection
   CIndMSTF         *GetIndicatorObj(const int ind_handle,const string source) const;
   uint              IndicatorsTotal(void)                  const { return this.m_list.Total(); }

//--- Populates buffers of (1) the indicator by handle, (2) all indicators in the collection
   bool              Calculate(const int ind_handle);
   bool              Calculate(void);
//--- Sets (1) the specified, (2) default description, (3) color of the indicator buffer line
   void              SetPlotLabel(const uint plot_index,const string descript);
   void              SetPlotLabelFromBuffer(const uint plot_index,const int ind_handle,const uint buffer_num);
   void              SetPlotColorsFromBuffer(const uint plot_index,const int ind_handle,const uint buffer_num);
//--- Sets the shift to the specified plotting buffer
   void              SetPlotShift(const uint plot_index,const int shift);
//--- (1) Sets (2) returns the initializing value of the given buffer specified by the indicator handle
   void              SetBufferInitValue(const int ind_handle,const uint buffer_num,const double value);
   double            BufferInitValue(const int ind_handle,const uint buffer_num) const;

//--- (1) Sets (2) returns the initializing value of the color index for the specified buffer
   void              SetBufferInitColorIndex(const int ind_handle,const uint buffer_num,const uchar index);
   uchar             BufferInitColorIndex(const int ind_handle,const uint buffer_num) const;
//--- (1) Sets, (2) returns the color value by index for the specified buffer
   void              SetBufferColorToIndex(const int ind_handle,const uint buffer_num,const uchar color_idx,const color clr);
   color             BufferColorByIndex(const int ind_handle,const uint buffer_num,const uchar color_idx) const;
   //--- Returns the color buffer flag
   bool              IsColoredBuffer(const int ind_handle,const uint buffer_num) const;

//--- Returns indicator data by handle from the specified buffer at index (1) as is, (2) for the specified symbol/timeframe
   double            GetData(const int ind_handle,const uint buffer_num,const uint array_num,const uint index);
   double            GetDataTo(const string symbol_to,const ENUM_TIMEFRAMES timeframe_to,const int ind_handle,const uint buffer_num,const uint array_num,const uint index);
//--- Returns indicator color index data by handle from the specified buffer at index (1) as is, (2) for the specified symbol/timeframe
   double            GetColorData(const int ind_handle,const uint buffer_num,const uint index);
   double            GetColorDataTo(const string symbol_to,const ENUM_TIMEFRAMES timeframe_to,const int ind_handle,const uint buffer_num,const uint index);

//--- (1) Copies data of the specified calculation part buffer of the indicator by handle into the indicator buffer, taking into account chart symbol/period,
//--- (2) Copies the data of the specified color buffer of the indicator calculation part by handle into the color buffer of the indicator, taking into account the chart symbol/period,
//--- (2) returns the amount of data in the specified buffer of the indicator by handle
   bool              DataToBuffer(const string symbol_to,const ENUM_TIMEFRAMES timeframe_to,const int ind_handle,const uint buffer_num,const uint array_num,const int limit,double &buffer[]);
   bool              DataToColorBuffer(const string symbol_to,const ENUM_TIMEFRAMES timeframe_to,const int ind_handle,const uint buffer_num,const uint array_num,const int limit,double &plot_buffer[],double &color_buffer[]);
   uint              DataTotal(const int ind_handle,const uint buffer_num) const;

   //--- Returns (1) buffer description, (2) state of the line data of given buffer of indicator specified by handle on the specified bar
   //--- (3) indicator line state for the specific chart symbol/period, (4) indicator line state relation to the specified level,
   //--- (5)  state of relation of indicator line with specified level for certain chart symbol/period, (6) indicator category description
   string            BufferDescription(const int ind_handle,const uint buffer_num);
   ENUM_LINE_STATE   BufferLineState(const int ind_handle,const uint buffer_num,const uint array_num,const int index);
   ENUM_LINE_STATE   BufferLineState(const string symbol,const ENUM_TIMEFRAMES timeframe,const int ind_handle,const uint buffer_num,const uint array_num,const int index);
   ENUM_LINE_STATE   BufferLineStateRelative(const int ind_handle,const int buffer_num,const uint array_num,const int index,const double level0,const double level1=EMPTY_VALUE);
   ENUM_LINE_STATE   BufferLineStateRelative(const string symbol,const ENUM_TIMEFRAMES timeframe,const int ind_handle,const int buffer_num,const uint array_num,const int index,const double level0,const double level1=EMPTY_VALUE);
   string            CategoryDescription(const int ind_handle);

//--- Sets (1) identifier, (2) Digits, (3) user description, (4) buffer description
   void              SetID(const int ind_handle,const int id);
   void              SetDigits(const int ind_handle,const int digits);
   void              SetDescription(const int ind_handle,const string descr);
   void              SetBufferDescription(const int ind_handle,const uint buffer_num,const string descr);

//--- Returns flag of whether the buffer is set as series, (2) historical data for symbol/period is synchronized
   bool              IsSeries(const int ind_handle,const uint buffer_num,const uint array_num) const;
   bool              IsSynchronized(const int ind_handle) const;

//--- ...
//--- ...
//--- ...

//--- Timer
   void OnTimer(void)
     {
      //--- In a loop through all indicators form the collection
      int total=this.m_list.Total();
      for(int i=0;i<total;i++)
        {
         //--- get a pointer to the next indicator object
         //--- and call its timer
         CIndMSTF *obj=this.m_list.At(i);
         if(obj!=NULL)
            obj.OnTimer();
        }
     }
//--- Constructor/destructor
                     CMSTFIndicators(void){ this.m_list.Clear(); }
                    ~CMSTFIndicators(void){;}
  };
Alle Methoden, die die Angabe des Array-Indexes erfordern, haben bereits die erforderlichen Änderungen:
//+------------------------------------------------------------------+
//| Returns data of the indicator at the handle                      |
//| from the specified buffers by index as is                        |
//+------------------------------------------------------------------+
double CMSTFIndicators::GetData(const int ind_handle,const uint buffer_num,const uint array_num,const uint index)
  {
//--- Get a pointer to the indicator object using the handle passed to the method
   CIndMSTF *obj=this.GetIndicatorObj(ind_handle,__FUNCTION__);
   if(obj==NULL)
     {
      ::PrintFormat("%s: Failed to get indicator object",__FUNCTION__);
      return EMPTY_VALUE;
     }
//--- Return data from the specified indicator buffer at the index passed to the method
   return obj.GetData(buffer_num,array_num,index);
  }
Implementierung der neu deklarierten Methoden:
//+------------------------------------------------------------------+
//| Return color index data of the indicator by handle               |
//| from the specified buffers by index as is                        |
//+------------------------------------------------------------------+
double CMSTFIndicators::GetColorData(const int ind_handle,const uint buffer_num,const uint index)
  {
//--- Get a pointer to the indicator object using the handle passed to the method
   CIndMSTF *obj=this.GetIndicatorObj(ind_handle,__FUNCTION__);
   if(obj==NULL)
     {
      ::PrintFormat("%s: Failed to get indicator object",__FUNCTION__);
      return EMPTY_VALUE;
     }
//--- Return color index data from the specified indicator buffer at the index passed to the method
   return obj.GetColorData(buffer_num,index);
  }
//+------------------------------------------------------------------+
//| Return color index data of the indicator by handle               |
//| from the specified buffer at index for this symbol/timeframe     |
//+------------------------------------------------------------------+
double CMSTFIndicators::GetColorDataTo(const string symbol_to,const ENUM_TIMEFRAMES timeframe_to,const int ind_handle,const uint buffer_num,const uint index)
  {
//--- Get a pointer to the indicator object using the handle passed to the method
   CIndMSTF *obj=this.GetIndicatorObj(ind_handle,__FUNCTION__);
   if(obj==NULL)
     {
      ::PrintFormat("%s: Failed to get indicator object",__FUNCTION__);
      return EMPTY_VALUE;
     }
//--- Return color index data from the specified indicator buffer at the index passed to the method
   return obj.GetColorDataTo(symbol_to,timeframe_to,buffer_num,index);
  }

//+------------------------------------------------------------------+
//| Fill the passed color buffer of the indicator with data          |
//+------------------------------------------------------------------+
bool CMSTFIndicators::DataToColorBuffer(const string symbol_to,const ENUM_TIMEFRAMES timeframe_to,const int ind_handle,const uint buffer_num,const uint array_num,const int limit,double &plot_buffer[],double &color_buffer[])
  {
//--- Get a pointer to the indicator object using the handle passed to the method
   CIndMSTF *obj=this.GetIndicatorObj(ind_handle,__FUNCTION__);
   if(obj==NULL)
     {
      ::PrintFormat("%s: Failed to get indicator object",__FUNCTION__);
      return false;
     }
//--- Fill the color array-buffer passed to the method from the specified color buffer of the indicator
   return obj.DataToColorBuffer(symbol_to,timeframe_to,buffer_num,array_num,limit,plot_buffer,color_buffer);
  }

//+------------------------------------------------------------------+
//| Set the line color for the indicator buffer                      |
//+------------------------------------------------------------------+
void CMSTFIndicators::SetPlotColorsFromBuffer(const uint plot_index,const int ind_handle,const uint buffer_num)
  {
//--- Get a pointer to the indicator object using the handle passed to the method
   CIndMSTF *obj=this.GetIndicatorObj(ind_handle,__FUNCTION__);
   if(obj==NULL)
     {
      ::PrintFormat("%s: Failed to get indicator object",__FUNCTION__);
      return;
     }
//--- Set colors from the specified indicator color buffer for the specified plot buffer
   uint colors=obj.ColorsTotal(buffer_num);
   if(colors==0)
      return;
   ::PlotIndexSetInteger(plot_index,PLOT_COLOR_INDEXES,colors);
   for(int i=0;i<(int)colors;i++)
      ::PlotIndexSetInteger(plot_index,PLOT_LINE_COLOR,i,obj.BufferColorByIndex(buffer_num,(uchar)i));
  }

//+------------------------------------------------------------------+
//| Set the initializing value of the color index                    |
//| for the specified buffer of indicator specified by handle        |
//+------------------------------------------------------------------+
void CMSTFIndicators::SetBufferInitColorIndex(const int ind_handle,const uint buffer_num,const uchar index)
  {
//--- Get a pointer to the indicator object using the handle passed to the method
   CIndMSTF *obj=this.GetIndicatorObj(ind_handle,__FUNCTION__);
   if(obj==NULL)
     {
      ::PrintFormat("%s: Failed to get indicator object",__FUNCTION__);
      return;
     }
//--- Set the initializing color index value for the specified buffer
   obj.SetBufferInitColorIndex(buffer_num,index);
  }
//+------------------------------------------------------------------+
//| Return the initializing value of the color index                 |
//| for the specified buffer of indicator specified by handle        |
//+------------------------------------------------------------------+
uchar CMSTFIndicators::BufferInitColorIndex(const int ind_handle,const uint buffer_num) const
  {
//--- Get a pointer to the indicator object using the handle passed to the method
   CIndMSTF *obj=this.GetIndicatorObj(ind_handle,__FUNCTION__);
   if(obj==NULL)
     {
      ::PrintFormat("%s: Failed to get indicator object",__FUNCTION__);
      return WRONG_VALUE;
     }
//--- Return the initializing value of the color index set for the specified buffer
   return obj.BufferInitColorIndex(buffer_num);
  }
//+------------------------------------------------------------------+
//| Set the color value by index for the specified buffer            |
//| of the indicator specified by handle                             |
//+------------------------------------------------------------------+
void CMSTFIndicators::SetBufferColorToIndex(const int ind_handle,const uint buffer_num,const uchar color_idx,const color clr)
  {
//--- Get a pointer to the indicator object using the handle passed to the method
   CIndMSTF *obj=this.GetIndicatorObj(ind_handle,__FUNCTION__);
   if(obj==NULL)
     {
      ::PrintFormat("%s: Failed to get indicator object",__FUNCTION__);
      return;
     }
//--- Set the color value for the specified buffer by index
   obj.SetBufferColorToIndex(buffer_num,color_idx,clr);
  }
//+------------------------------------------------------------------+
//| Return the color value by index for the specified buffer         |
//| of the indicator specified by handle                             |
//+------------------------------------------------------------------+
color CMSTFIndicators::BufferColorByIndex(const int ind_handle,const uint buffer_num,const uchar color_idx) const
  {
//--- Get a pointer to the indicator object using the handle passed to the method
   CIndMSTF *obj=this.GetIndicatorObj(ind_handle,__FUNCTION__);
   if(obj==NULL)
     {
      ::PrintFormat("%s: Failed to get indicator object",__FUNCTION__);
      return WRONG_VALUE;
     }
//--- Return the color value, set for the specified buffer, by index
   return obj.BufferColorByIndex(buffer_num,color_idx);
  }
//+------------------------------------------------------------------+
//| Return the color flag for the specified buffer                   |
//| of the indicator specified by handle                             |
//+------------------------------------------------------------------+
bool CMSTFIndicators::IsColoredBuffer(const int ind_handle,const uint buffer_num) const
  {
//--- Get a pointer to the indicator object using the handle passed to the method
   CIndMSTF *obj=this.GetIndicatorObj(ind_handle,__FUNCTION__);
   if(obj==NULL)
     {
      ::PrintFormat("%s: Failed to get indicator object",__FUNCTION__);
      return false;
     }
//--- Return value of the color flag set for the specified buffer
   return obj.IsColoredBuffer(buffer_num);
  }
Die Methoden zum Hinzufügen von Indikatorobjekten zur Kollektion wurden geändert, um das sofortige Setzen der Dezimalstellen und den anfänglichen „leeren Wert“ des Daten- und Farbpuffers für den erstellten Indikator zu ermöglichen:
//+------------------------------------------------------------------+
//| Add the Accelerator Oscillator indicator to the collection       |
//+------------------------------------------------------------------+
int CMSTFIndicators::AddNewAC(const string symbol,const ENUM_TIMEFRAMES timeframe)
  {
//--- Create a new indicator object. If there is an error, add a journal message and return INVALID_HANDLE
   CIndAC *ind_obj=new CIndAC(symbol,timeframe);
   if(ind_obj==NULL)
     {
      ::PrintFormat("%s: Error. Failed to create AC indicator object",__FUNCTION__);
      return INVALID_HANDLE;
     }
//--- Get the result of adding the created indicator object to the collection list
   int handle=this.AddNewIndicator(ind_obj,__FUNCTION__);
//--- If the indicator is successfully created and added to the collection, set the parameters for its display
   if(handle!=INVALID_HANDLE && ::CheckPointer(ind_obj)!=POINTER_INVALID)
     {
      ::IndicatorSetInteger(INDICATOR_DIGITS,ind_obj.Digits());
      ind_obj.SetBufferInitValue(0,EMPTY_VALUE);
      ind_obj.SetBufferInitColorIndex(0,0);
     }
//--- Return the handle of the created indicator or INVALID_HANDLE
   return handle;
  }
Wo nötig können wir auch die Anzahl der Stufen des Indikators und deren Werte fest:
//+------------------------------------------------------------------+
//| Add the Commodity Channel Index indicator to the collection      |
//+------------------------------------------------------------------+
int CMSTFIndicators::AddNewCCI(const string symbol,const ENUM_TIMEFRAMES timeframe,
                               const int ma_period=14,
                               const ENUM_APPLIED_PRICE applied_price=PRICE_TYPICAL)
  {
//--- Create a new indicator object. If there is an error, add a journal message and return INVALID_HANDLE
   CIndCCI *ind_obj=new CIndCCI(symbol,timeframe,ma_period,applied_price);
   if(ind_obj==NULL)
     {
      ::PrintFormat("%s: Error. Failed to create CCI indicator object",__FUNCTION__);
      return INVALID_HANDLE;
     }
//--- Get the result of adding the created indicator object to the collection list
   int handle=this.AddNewIndicator(ind_obj,__FUNCTION__);
//--- If the indicator is successfully created and added to the collection, set the parameters for its display
   if(handle!=INVALID_HANDLE && ::CheckPointer(ind_obj)!=POINTER_INVALID)
     {
      ::IndicatorSetInteger(INDICATOR_LEVELS,2);
      ::IndicatorSetDouble(INDICATOR_LEVELVALUE,0,-100.0);
      ::IndicatorSetDouble(INDICATOR_LEVELVALUE,1, 100.0);
      ::IndicatorSetInteger(INDICATOR_DIGITS,ind_obj.Digits());
      ind_obj.SetBufferInitValue(0,EMPTY_VALUE);
     }
//--- Return the handle of the created indicator or INVALID_HANDLE
   return handle;
  }
Solche Änderungen wurden an allen ähnlichen Methoden vorgenommen. Sie finden sie in den Dateien im Anhang zu diesem Artikel. Zuvor gaben die Methoden einfach das Ergebnis der Erstellung und des Hinzufügens eines Indikatorobjekts zur Kollektionsliste zurück. Dies war entweder das Handle des erstellten Indikators oder INVALID_HANDLE im Falle eines Fehlers. Wenn nun das Indikatorobjekt erfolgreich erstellt wurde und der Zeiger auf das Objekt in der Liste gültig ist, setzen wir Digits und Levels für den Indikator auf dem Chart und legen die „leere Werte“ für seine Puffer des erstellte Indikatorobjekts fest.
Alle Änderungen wurden an der Bibliothek der Multi-Symbol- und Multi-Perioden-Indikatoren vorgenommen. Alle Änderungen können in der dem Artikel beigefügten Datei IndMSTF.mqh vollständig eingesehen werden.
Tests
Für Testindikatoren wird die Dashboard-Klasse Dashboard.mqh verwendet, die speziell für das Testen von Multi-Indikatoren erstellt wurde.
Die Dashboard-Klassendatei ist dem Artikel beigefügt. Sie sollte sich im Pfad \MQL5\Include\Dashboard\Dashboard.mqh befinden.
Im vorherigen Artikel haben wir bereits einen Testindikator erstellt, der einen in der Liste ausgewählten gleitenden Durchschnitt mit mehreren Symbolen und mehreren Perioden zeichnet. Auf der Grundlage dieser Datei werden wir nun einige andere Multi-Symbol- und Multi-Perioden-Standardindikatoren erstellen, einschließlich solcher mit mehrfarbigen Puffern. Der Testindikator zeichnet eine Linie mit Indikatordaten des aktuellen Symbols und der aktuellen Periode und eine zweite Linie mit Daten eines anderen Symbols und einer anderen Periode auf demselben Chart. Das Symbol und der Zeitraum sollten in den Indikatoreinstellungen ausgewählt werden. Die Linie des höheren Zeitrahmens wird dicker sein.
Einige Indikatoren sehen nicht korrekt aus, wenn Daten aus verschiedenen Zeitrahmen in einem Fenster angezeigt werden. Einige Volumenindikatoren zeigen zum Beispiel das Volumen für einen ausgewählte Zeitrahmen des Charts an. Auf dem höheren Zeitrahmen ist das Tick-Volumen definitiv höher als auf dem niedrigeren, und die Linie auf dem niedrigeren Zeitrahmen wird fast gerade gegen die Linie auf dem höheren sein. Daher wird bei solchen Indikatoren nur eine Zeile angezeigt - diejenige für das Symbol und den Zeitraum, die in den Indikatoreinstellungen ausgewählt wurden.
Der Indikator Accumulation/Distribution:
//+------------------------------------------------------------------+
//|                                      TestMSTFAccDistribution.mq5 |
//|                                  Copyright 2023, MetaQuotes Ltd. |
//|                                             https://www.mql5.com |
//+------------------------------------------------------------------+
#property copyright "Copyright 2023, MetaQuotes Ltd."
#property link      "https://www.mql5.com"
#property version   "1.00"
#property indicator_separate_window
#property indicator_buffers 1
#property indicator_plots   1
//--- enums

//--- plot MSTF A/D
#property indicator_label1  "MSTF A/D"
#property indicator_type1   DRAW_LINE
#property indicator_color1  clrDodgerBlue
#property indicator_style1  STYLE_SOLID
#property indicator_width1  1

//--- includes
#include <IndMSTF\IndMSTF.mqh>
#include <Dashboard\Dashboard.mqh>
//--- input parameters
input string               InpSymbol      =  NULL;             /* Symbol                     */ // Symbol
input ENUM_TIMEFRAMES      InpTimeframe   =  PERIOD_CURRENT;   /* Timeframe                  */ // Timeframe
input ENUM_APPLIED_VOLUME  InpVolume      =  VOLUME_TICK;      /* Applied Volume             */ // Volume used for calculation
input uchar                InpLineWidth1  =  2;                /* Senior period Line Width   */ // Line width for higher period
input uchar                InpLineWidth2  =  1;                /* Junior period Line Width   */ // Line width for lower period
input bool                 InpAsSeries    =  true;             /* As Series flag             */ // Timeseries flag of indicator buffer arrays

//--- indicator buffers
double         BufferAD[];
//--- global variables
int handle_ad;
CMSTFIndicators indicators;      // An instance of the indicator collection object
//--- variables for the panel
CDashboard *panel=NULL;          // Pointer to the panel object
int         mouse_bar_index;     // Index of the bar the data is taken from
//+------------------------------------------------------------------+
//| Custom indicator initialization function                         |
//+------------------------------------------------------------------+
int OnInit()
  {
//--- Set a timer with an interval of 1 second
   EventSetTimer(1);
//--- Assign the BufferMA1 and BufferMA2 arrays to the plot buffers 0 and 1, respectively
   SetIndexBuffer(0,BufferAD,INDICATOR_DATA);
//--- Set the line width
   int w1=0,w2=0;
   if(InpTimeframe>Period())
     {
      w1=InpLineWidth2;
      w2=InpLineWidth1;
     }
   else
     {
      w1=InpLineWidth1;
      w2=InpLineWidth2;
     }
   PlotIndexSetInteger(0,PLOT_LINE_WIDTH,w1);
   PlotIndexSetInteger(1,PLOT_LINE_WIDTH,w2);
//--- sets indicator shift

//--- Set the timeseries flags for the indicator buffer arrays (for testing, to see that there is no difference)
   ArraySetAsSeries(BufferAD,InpAsSeries);

//--- Create two indicators of the same type
//--- The first one is calculated on the current chart symbol/period, the second - on those specified in the settings
   handle_ad=indicators.AddNewAD(InpSymbol,InpTimeframe,InpVolume);

//--- If failed to create indicator handles, return initialization error
   if(handle_ad==INVALID_HANDLE)
      return INIT_FAILED;
//--- Set descriptions for indicator lines from buffer descriptions of calculation part of created indicators
   indicators.SetPlotLabelFromBuffer(0,handle_ad,0);

//--- Dashboard
//--- Create the panel
   int width=220;
   panel=new CDashboard(1,20,20,width,264,0);
   if(panel==NULL)
     {
      Print("Error. Failed to create panel object");
      return INIT_FAILED;
     }
//--- Set font parameters
   panel.SetFontParams("Calibri",9);
//--- Display the panel with the "Symbol, Timeframe description" header text
   panel.View(Symbol()+", "+StringSubstr(EnumToString(Period()),7));

//--- Create a table with ID 0 to display bar data in it
   panel.CreateNewTable(0);
//--- Draw a table with ID 0 on the panel background
   panel.DrawGrid(0,2,20,6,2,18,width/2-2);

//--- Create a table with ID 1 to display the data of indicator 1
   panel.CreateNewTable(1);
//--- Get the Y2 table coordinate with ID 0 and
//--- set the Y1 coordinate for the table with ID 1
   int y1=panel.TableY2(0)+22;
//--- Draw a table with ID 1 on the panel background
   panel.DrawGrid(1,2,y1,2,2,18,width/2-2);

//--- Create a table with ID 2 to display the data of indicator 2
   panel.CreateNewTable(2);
//--- Get the Y2 coordinate of the table with ID 1 and
//--- set the Y1 coordinate for the table with ID 2
   int y2=panel.TableY2(1)+3;
//--- Draw a table with ID 2 on the background of the dashboard
   panel.DrawGrid(2,2,y2,3,2,18,width/2-2);

//--- Initialize the variable with the index of the mouse cursor bar
   mouse_bar_index=0;
//--- Display the data of the current bar on the panel
   DrawData(mouse_bar_index,TimeCurrent());

//--- Successful initialization
   return(INIT_SUCCEEDED);
  }
//+------------------------------------------------------------------+
//| Custom indicator deinitialization function                       |
//+------------------------------------------------------------------+
void OnDeinit(const int reason)
  {
//--- Delete the timer
   EventKillTimer();
//--- If the panel object exists, delete it
   if(panel!=NULL)
      delete panel;
//--- Delete all comments
   Comment("");
  }
//+------------------------------------------------------------------+
//| Custom indicator iteration function                              |
//+------------------------------------------------------------------+
int OnCalculate(const int rates_total,
                const int prev_calculated,
                const datetime &time[],
                const double &open[],
                const double &high[],
                const double &low[],
                const double &close[],
                const long &tick_volume[],
                const long &volume[],
                const int &spread[])
  {
//--- Number of bars for calculation
   int limit=rates_total-prev_calculated;
//--- If limit > 1, then this is the first calculation or change in the history
   if(limit>1)
     {
      //--- specify all the available history for calculation
      limit=rates_total-1;
      /*
      // If the indicator has any buffers that display other calculations (not multi-indicators),
      // initialize them here with the "empty" value set for these buffers
      */
     }
//--- Calculate all created multi-symbol multi-period indicators
   if(!indicators.Calculate())
      return 0;

//--- Display the bar data under cursor (or current bar if cursor is outside the chart) on the dashboard
   DrawData(mouse_bar_index,time[mouse_bar_index]);

//--- From buffers of calculated indicators, output data to indicator buffers
   if(!indicators.DataToBuffer(NULL,PERIOD_CURRENT,handle_ad,0,0,limit,BufferAD))
      return 0;

//--- return value of prev_calculated for the next call
   return(rates_total);
  }
//+------------------------------------------------------------------+
//| Timer function                                                   |
//+------------------------------------------------------------------+
void OnTimer()
  {
//--- Call the indicator collection timer
   indicators.OnTimer();
  }
//+------------------------------------------------------------------+
//| ChartEvent function                                              |
//+------------------------------------------------------------------+
void OnChartEvent(const int id,
                  const long &lparam,
                  const double &dparam,
                  const string &sparam)
  {
//--- Handling the panel
//--- Call the panel event handler
   panel.OnChartEvent(id,lparam,dparam,sparam);

//--- If the cursor moves or a click is made on the chart
   if(id==CHARTEVENT_MOUSE_MOVE || id==CHARTEVENT_CLICK)
     {
      //--- Declare the variables to record time and price coordinates in them
      datetime time=0;
      double price=0;
      int wnd=0;
      //--- If the cursor coordinates are converted to date and time
      if(ChartXYToTimePrice(ChartID(),(int)lparam,(int)dparam,wnd,time,price))
        {
         //--- write the bar index where the cursor is located to a global variable
         mouse_bar_index=iBarShift(Symbol(),PERIOD_CURRENT,time);
         //--- Display the bar data under the cursor on the panel
         DrawData(mouse_bar_index,time);
        }
     }

//--- If we received a custom event, display the appropriate message in the journal
   if(id>CHARTEVENT_CUSTOM)
     {
      //--- Here we can implement handling a click on the close button on the panel
      PrintFormat("%s: Event id=%ld, object id (lparam): %lu, event message (sparam): %s",__FUNCTION__,id,lparam,sparam);
     }
  }
//+------------------------------------------------------------------+
//| Display data from the specified timeseries index to the panel    |
//+------------------------------------------------------------------+
void DrawData(const int index,const datetime time)
  {
//--- Declare the variables to receive data in them
   MqlRates rates[1];

//--- Exit if unable to get the bar data by the specified index
   if(CopyRates(Symbol(),PERIOD_CURRENT,index,1,rates)!=1)
      return;

//--- Set font parameters for bar and indicator data headers
   int  size=0;
   uint flags=0;
   uint angle=0;
   string name=panel.FontParams(size,flags,angle);
   panel.SetFontParams(name,9,FW_BOLD);
   panel.DrawText("Bar data ["+(string)index+"]",3,panel.TableY1(0)-16,clrMaroon,panel.Width()-6);
   panel.DrawText("Indicators data ["+(string)index+"]",3,panel.TableY1(1)-16,clrGreen,panel.Width()-6);
//--- Set font parameters for bar and indicator data
   panel.SetFontParams(name,9);

//--- Display the data of the specified bar in table 0 on the panel
   panel.DrawText("Date",  panel.CellX(0,0,0)+2, panel.CellY(0,0,0)+2); panel.DrawText(TimeToString(  rates[0].time,TIME_DATE),     panel.CellX(0,0,1)+2, panel.CellY(0,0,1)+2,clrNONE,90);
   panel.DrawText("Time",  panel.CellX(0,1,0)+2, panel.CellY(0,1,0)+2); panel.DrawText(TimeToString(  rates[0].time,TIME_MINUTES),  panel.CellX(0,1,1)+2, panel.CellY(0,1,1)+2,clrNONE,90);
   panel.DrawText("Open",  panel.CellX(0,2,0)+2, panel.CellY(0,2,0)+2); panel.DrawText(DoubleToString(rates[0].open,Digits()),      panel.CellX(0,2,1)+2, panel.CellY(0,2,1)+2,clrNONE,90);
   panel.DrawText("High",  panel.CellX(0,3,0)+2, panel.CellY(0,3,0)+2); panel.DrawText(DoubleToString(rates[0].high,Digits()),      panel.CellX(0,3,1)+2, panel.CellY(0,3,1)+2,clrNONE,90);
   panel.DrawText("Low",   panel.CellX(0,4,0)+2, panel.CellY(0,4,0)+2); panel.DrawText(DoubleToString(rates[0].low,Digits()),       panel.CellX(0,4,1)+2, panel.CellY(0,4,1)+2,clrNONE,90);
   panel.DrawText("Close", panel.CellX(0,5,0)+2, panel.CellY(0,5,0)+2); panel.DrawText(DoubleToString(rates[0].close,Digits()),     panel.CellX(0,5,1)+2, panel.CellY(0,5,1)+2,clrNONE,90);

//--- Output the data of indicator 1 from the specified bar into table 1
   panel.DrawText(indicators.Title(handle_ad), panel.CellX(1,0,0)+2, panel.CellY(1,0,0)+2);
   double value1=indicators.GetData(handle_ad,0,0,index);
   string value_str1=(value1!=EMPTY_VALUE ? DoubleToString(value1,indicators.Digits(handle_ad)) : " ");
   panel.DrawText(value_str1,panel.CellX(1,0,1)+2,panel.CellY(1,0,1)+2,clrNONE,110);

//--- Display a description of the indicator 1 line state
   panel.DrawText("Line state", panel.CellX(1,1,0)+2, panel.CellY(1,1,0)+2);
   ENUM_LINE_STATE state1=indicators.BufferLineState(Symbol(),PERIOD_CURRENT,handle_ad,0,0,index);
   panel.DrawText(BufferLineStateDescription(state1),panel.CellX(1,1,1)+2,panel.CellY(1,1,1)+2,clrNONE,110);

//--- Output the data of indicator 2 from the specified bar into table 2
   panel.DrawText(indicators.Title(handle_ad), panel.CellX(2,0,0)+2, panel.CellY(2,0,0)+2);
   double value2=indicators.GetDataTo(Symbol(),PERIOD_CURRENT,handle_ad,0,0,index);
   string value_str2=(value2!=EMPTY_VALUE ? DoubleToString(value2,indicators.Digits(handle_ad)) : " ");
   panel.DrawText(value_str2,panel.CellX(2,0,1)+2,panel.CellY(2,0,1)+2,clrNONE,110);

//--- Display a description of the indicator 2 line state
   panel.DrawText("Line state", panel.CellX(2,1,0)+2, panel.CellY(2,1,0)+2);
   ENUM_LINE_STATE state2=indicators.BufferLineState(Symbol(),PERIOD_CURRENT,handle_ad,0,0,index);
   panel.DrawText(BufferLineStateDescription(state2),panel.CellX(2,1,1)+2,panel.CellY(2,1,1)+2,clrNONE,110);

//--- Redraw the chart to immediately display all changes on the panel
   ChartRedraw(ChartID());
  }
//+------------------------------------------------------------------+
Nach dem Kompilieren und Starten des Indikators auf dem M1-Chart, wobei M5 für die Berechnungen ausgewählt wurde, sehen wir:
Der Indikator Accelerator Oscillator:
//+------------------------------------------------------------------+
//|                                TestMSTFAcceleratorOscillator.mq5 |
//|                                  Copyright 2023, MetaQuotes Ltd. |
//|                                             https://www.mql5.com |
//+------------------------------------------------------------------+
#property copyright "Copyright 2023, MetaQuotes Ltd."
#property link      "https://www.mql5.com"
#property version   "1.00"
#property indicator_separate_window
#property indicator_buffers 4
#property indicator_plots   2
//--- enums

//--- plot AC1
#property indicator_label1  "AC1"
#property indicator_type1   DRAW_COLOR_HISTOGRAM
#property indicator_color1  clrGreen,clrRed
#property indicator_style1  STYLE_SOLID
#property indicator_width1  1

//--- plot AC2
#property indicator_label2  "AC2"
#property indicator_type2   DRAW_COLOR_HISTOGRAM
#property indicator_color2  clrGreen,clrRed
#property indicator_style2  STYLE_SOLID
#property indicator_width2  1

//--- includes
#include <IndMSTF\IndMSTF.mqh>
#include <Dashboard\Dashboard.mqh>
//--- input parameters
input string               InpSymbol      =  NULL;             /* Symbol                     */ // Symbol
input ENUM_TIMEFRAMES      InpTimeframe   =  PERIOD_CURRENT;   /* Timeframe                  */ // Timeframe
input uchar                InpLineWidth1  =  2;                /* Senior period Line Width   */ // Line width for higher period
input uchar                InpLineWidth2  =  1;                /* Junior period Line Width   */ // Line width for lower period
input bool                 InpAsSeries    =  true;             /* As Series flag             */ // Timeseries flag of indicator buffer arrays

//--- indicator buffers
double         BufferAC1[];
double         BufferClrAC1[];
double         BufferAC2[];
double         BufferClrAC2[];
//--- global variables
int handle_ac1;
int handle_ac2;
CMSTFIndicators indicators;      // An instance of the indicator collection object
//--- variables for the panel
CDashboard *panel=NULL;          // Pointer to the panel object
int         mouse_bar_index;     // Index of the bar the data is taken from
//+------------------------------------------------------------------+
//| Custom indicator initialization function                         |
//+------------------------------------------------------------------+
int OnInit()
  {
//--- Set a timer with an interval of 1 second
   EventSetTimer(1);
//--- Assign arrays BufferAC1 and BufferAC2 to plot buffers 0 and 2, respectively,
//--- and color arrays BufferClrAC1 and BufferClrAC2 to buffers 1 and 3
   SetIndexBuffer(0,BufferAC1,INDICATOR_DATA);
   SetIndexBuffer(1,BufferClrAC1,INDICATOR_COLOR_INDEX);
   SetIndexBuffer(2,BufferAC2,INDICATOR_DATA);
   SetIndexBuffer(3,BufferClrAC2,INDICATOR_COLOR_INDEX);
//--- Set the line width
   int w1=0,w2=0;
   if(InpTimeframe>Period())
     {
      w1=InpLineWidth2;
      w2=InpLineWidth1;
     }
   else
     {
      w1=InpLineWidth1;
      w2=InpLineWidth2;
     }
   PlotIndexSetInteger(0,PLOT_LINE_WIDTH,w1);
   PlotIndexSetInteger(1,PLOT_LINE_WIDTH,w2);
//--- sets indicator shift

//--- Set the timeseries flags for the indicator buffer arrays (for testing, to see that there is no difference)
   ArraySetAsSeries(BufferAC1,InpAsSeries);
   ArraySetAsSeries(BufferClrAC1,InpAsSeries);
   ArraySetAsSeries(BufferAC2,InpAsSeries);
   ArraySetAsSeries(BufferClrAC2,InpAsSeries);

//--- Create two indicators of the same type
//--- The first one is calculated on the current chart symbol/period, the second - on those specified in the settings
   handle_ac1=indicators.AddNewAC(NULL,PERIOD_CURRENT);
   handle_ac2=indicators.AddNewAC(InpSymbol,InpTimeframe);

//--- If failed to create indicator handles, return initialization error
   if(handle_ac1==INVALID_HANDLE || handle_ac2==INVALID_HANDLE)
      return INIT_FAILED;
//--- Set descriptions for indicator lines from buffer descriptions of calculation part of created indicators
   indicators.SetPlotLabelFromBuffer(0,handle_ac1,0);
   indicators.SetPlotLabelFromBuffer(1,handle_ac2,0);

//--- Dashboard
//--- Create the panel
   int width=247;
   panel=new CDashboard(1,20,20,width,264,0);
   if(panel==NULL)
     {
      Print("Error. Failed to create panel object");
      return INIT_FAILED;
     }
//--- Set font parameters
   panel.SetFontParams("Calibri",9);
//--- Display the panel with the "Symbol, Timeframe description" header text
   panel.View(Symbol()+", "+StringSubstr(EnumToString(Period()),7));

//--- Create a table with ID 0 to display bar data in it
   panel.CreateNewTable(0);
//--- Draw a table with ID 0 on the panel background
   panel.DrawGrid(0,2,20,6,2,18,width/2-2);

//--- Create a table with ID 1 to display the data of indicator 1
   panel.CreateNewTable(1);
//--- Get the Y2 table coordinate with ID 0 and
//--- set the Y1 coordinate for the table with ID 1
   int y1=panel.TableY2(0)+22;
//--- Draw a table with ID 1 on the panel background
   panel.DrawGrid(1,2,y1,2,2,18,width/2-2);

//--- Create a table with ID 2 to display the data of indicator 2
   panel.CreateNewTable(2);
//--- Get the Y2 coordinate of the table with ID 1 and
//--- set the Y1 coordinate for the table with ID 2
   int y2=panel.TableY2(1)+3;
//--- Draw a table with ID 2 on the background of the dashboard
   panel.DrawGrid(2,2,y2,3,2,18,width/2-2);

//--- Initialize the variable with the index of the mouse cursor bar
   mouse_bar_index=0;
//--- Display the data of the current bar on the panel
   DrawData(mouse_bar_index,TimeCurrent());

//--- Successful initialization
   return(INIT_SUCCEEDED);
  }
//+------------------------------------------------------------------+
//| Custom indicator deinitialization function                       |
//+------------------------------------------------------------------+
void OnDeinit(const int reason)
  {
//--- Delete the timer
   EventKillTimer();
//--- If the panel object exists, delete it
   if(panel!=NULL)
      delete panel;
//--- Delete all comments
   Comment("");
  }
//+------------------------------------------------------------------+
//| Custom indicator iteration function                              |
//+------------------------------------------------------------------+
int OnCalculate(const int rates_total,
                const int prev_calculated,
                const datetime &time[],
                const double &open[],
                const double &high[],
                const double &low[],
                const double &close[],
                const long &tick_volume[],
                const long &volume[],
                const int &spread[])
  {
//--- Number of bars for calculation
   int limit=rates_total-prev_calculated;
//--- If limit > 1, then this is the first calculation or change in the history
   if(limit>1)
     {
      //--- specify all the available history for calculation
      limit=rates_total-1;
      /*
      // If the indicator has any buffers that display other calculations (not multi-indicators),
      // initialize them here with the "empty" value set for these buffers
      */
     }
//--- Calculate all created multi-symbol multi-period indicators
   if(!indicators.Calculate())
      return 0;

//--- Display the bar data under cursor (or current bar if cursor is outside the chart) on the dashboard
   DrawData(mouse_bar_index,time[mouse_bar_index]);

//--- From buffers of calculated indicators, output data to indicator buffers
   if(!indicators.DataToColorBuffer(NULL,PERIOD_CURRENT,handle_ac1,0,0,limit,BufferAC1,BufferClrAC1))
      return 0;
   if(!indicators.DataToColorBuffer(NULL,PERIOD_CURRENT,handle_ac2,0,0,limit,BufferAC2,BufferClrAC2))
      return 0;

//--- return value of prev_calculated for the next call
   return(rates_total);
  }
//+------------------------------------------------------------------+
//| Timer function                                                   |
//+------------------------------------------------------------------+
void OnTimer()
  {
//--- Call the indicator collection timer
   indicators.OnTimer();
  }
//+------------------------------------------------------------------+
//| ChartEvent function                                              |
//+------------------------------------------------------------------+
void OnChartEvent(const int id,
                  const long &lparam,
                  const double &dparam,
                  const string &sparam)
  {
//--- Handling the panel
//--- Call the panel event handler
   panel.OnChartEvent(id,lparam,dparam,sparam);

//--- If the cursor moves or a click is made on the chart
   if(id==CHARTEVENT_MOUSE_MOVE || id==CHARTEVENT_CLICK)
     {
      //--- Declare the variables to record time and price coordinates in them
      datetime time=0;
      double price=0;
      int wnd=0;
      //--- If the cursor coordinates are converted to date and time
      if(ChartXYToTimePrice(ChartID(),(int)lparam,(int)dparam,wnd,time,price))
        {
         //--- write the bar index where the cursor is located to a global variable
         mouse_bar_index=iBarShift(Symbol(),PERIOD_CURRENT,time);
         //--- Display the bar data under the cursor on the panel
         DrawData(mouse_bar_index,time);
        }
     }

//--- If we received a custom event, display the appropriate message in the journal
   if(id>CHARTEVENT_CUSTOM)
     {
      //--- Here we can implement handling a click on the close button on the panel
      PrintFormat("%s: Event id=%ld, object id (lparam): %lu, event message (sparam): %s",__FUNCTION__,id,lparam,sparam);
     }
  }
//+------------------------------------------------------------------+
//| Display data from the specified timeseries index to the panel    |
//+------------------------------------------------------------------+
void DrawData(const int index,const datetime time)
  {
//--- Declare the variables to receive data in them
   MqlRates rates[1];

//--- Exit if unable to get the bar data by the specified index
   if(CopyRates(Symbol(),PERIOD_CURRENT,index,1,rates)!=1)
      return;

//--- Set font parameters for bar and indicator data headers
   int  size=0;
   uint flags=0;
   uint angle=0;
   string name=panel.FontParams(size,flags,angle);
   panel.SetFontParams(name,9,FW_BOLD);
   panel.DrawText("Bar data ["+(string)index+"]",3,panel.TableY1(0)-16,clrMaroon,panel.Width()-6);
   panel.DrawText("Indicators data ["+(string)index+"]",3,panel.TableY1(1)-16,clrGreen,panel.Width()-6);
//--- Set font parameters for bar and indicator data
   panel.SetFontParams(name,9);

//--- Display the data of the specified bar in table 0 on the panel
   panel.DrawText("Date",  panel.CellX(0,0,0)+2, panel.CellY(0,0,0)+2); panel.DrawText(TimeToString(  rates[0].time,TIME_DATE),     panel.CellX(0,0,1)+2, panel.CellY(0,0,1)+2,clrNONE,90);
   panel.DrawText("Time",  panel.CellX(0,1,0)+2, panel.CellY(0,1,0)+2); panel.DrawText(TimeToString(  rates[0].time,TIME_MINUTES),  panel.CellX(0,1,1)+2, panel.CellY(0,1,1)+2,clrNONE,90);
   panel.DrawText("Open",  panel.CellX(0,2,0)+2, panel.CellY(0,2,0)+2); panel.DrawText(DoubleToString(rates[0].open,Digits()),      panel.CellX(0,2,1)+2, panel.CellY(0,2,1)+2,clrNONE,90);
   panel.DrawText("High",  panel.CellX(0,3,0)+2, panel.CellY(0,3,0)+2); panel.DrawText(DoubleToString(rates[0].high,Digits()),      panel.CellX(0,3,1)+2, panel.CellY(0,3,1)+2,clrNONE,90);
   panel.DrawText("Low",   panel.CellX(0,4,0)+2, panel.CellY(0,4,0)+2); panel.DrawText(DoubleToString(rates[0].low,Digits()),       panel.CellX(0,4,1)+2, panel.CellY(0,4,1)+2,clrNONE,90);
   panel.DrawText("Close", panel.CellX(0,5,0)+2, panel.CellY(0,5,0)+2); panel.DrawText(DoubleToString(rates[0].close,Digits()),     panel.CellX(0,5,1)+2, panel.CellY(0,5,1)+2,clrNONE,90);

//--- Output the data of indicator 1 from the specified bar into table 1
   panel.DrawText(indicators.Title(handle_ac1), panel.CellX(1,0,0)+2, panel.CellY(1,0,0)+2);
   double value1=indicators.GetData(handle_ac1,0,0,index);
   string value_str1=(value1!=EMPTY_VALUE ? DoubleToString(value1,indicators.Digits(handle_ac1)) : " ");
   panel.DrawText(value_str1,panel.CellX(1,0,1)+2,panel.CellY(1,0,1)+2,clrNONE,110);

//--- Display a description of the indicator 1 line state
   panel.DrawText("Line state", panel.CellX(1,1,0)+2, panel.CellY(1,1,0)+2);
   ENUM_LINE_STATE state1=indicators.BufferLineState(Symbol(),PERIOD_CURRENT,handle_ac1,0,0,index);
   panel.DrawText(BufferLineStateDescription(state1),panel.CellX(1,1,1)+2,panel.CellY(1,1,1)+2,clrNONE,110);

//--- Output the data of indicator 2 from the specified bar into table 2
   panel.DrawText(indicators.Title(handle_ac2), panel.CellX(2,0,0)+2, panel.CellY(2,0,0)+2);
   double value2=indicators.GetDataTo(Symbol(),PERIOD_CURRENT,handle_ac2,0,0,index);
   string value_str2=(value2!=EMPTY_VALUE ? DoubleToString(value2,indicators.Digits(handle_ac2)) : " ");
   panel.DrawText(value_str2,panel.CellX(2,0,1)+2,panel.CellY(2,0,1)+2,clrNONE,110);

//--- Display a description of the indicator 2 line state
   panel.DrawText("Line state", panel.CellX(2,1,0)+2, panel.CellY(2,1,0)+2);
   ENUM_LINE_STATE state2=indicators.BufferLineState(Symbol(),PERIOD_CURRENT,handle_ac2,0,0,index);
   panel.DrawText(BufferLineStateDescription(state2),panel.CellX(2,1,1)+2,panel.CellY(2,1,1)+2,clrNONE,110);

//--- Display description of relationship between indicator 1 line relative to indicator 2 line
   double value21=indicators.GetDataTo(Symbol(),PERIOD_CURRENT,handle_ac2,0,0,index+1);
   ENUM_LINE_STATE stateR=indicators.BufferLineStateRelative(Symbol(),PERIOD_CURRENT,handle_ac1,0,0,index,value2,value21);
   string ma1=indicators.Name(handle_ac1);
   string ma2=indicators.Name(handle_ac2);
   string state_relative=
     (
      stateR==LINE_STATE_ABOVE      ? StringFormat("%s1 > %s2",ma1,ma2)   :
      stateR==LINE_STATE_BELOW      ? StringFormat("%s1 < %s2",ma1,ma2)           :
      stateR==LINE_STATE_CROSS_DOWN ? "Top-down crossing"   :
      stateR==LINE_STATE_CROSS_UP   ? "Bottom-up crossing"  :
      BufferLineStateDescription(stateR)
     );
   panel.DrawText(StringFormat("%s1 vs %s2",ma1,ma2), panel.CellX(2,2,0)+2, panel.CellY(2,2,0)+2);
   panel.DrawText(state_relative, panel.CellX(2,2,1)+2, panel.CellY(2,2,1)+2,clrNONE,110);

//--- Redraw the chart to immediately display all changes on the panel
   ChartRedraw(ChartID());
  }
//+------------------------------------------------------------------+
Nach dem Kompilieren und Starten des Indikators auf dem M1-Chart, wobei M5 für die Berechnungen ausgewählt wurde, sehen wir:
Der Indikator Alligator:
//+------------------------------------------------------------------+
//|                                        TestMSTFAlligator.mq5.mq5 |
//|                                  Copyright 2023, MetaQuotes Ltd. |
//|                                             https://www.mql5.com |
//+------------------------------------------------------------------+
#property copyright "Copyright 2023, MetaQuotes Ltd."
#property link      "https://www.mql5.com"
#property version   "1.00"
#property indicator_chart_window
#property indicator_buffers 6
#property indicator_plots   6
//--- enums

//--- plot Jaws1
#property indicator_label1  "Jaws1"
#property indicator_type1   DRAW_LINE
#property indicator_color1  clrDodgerBlue
#property indicator_width1  1

//--- plot Teeth1
#property indicator_label2  "Teeth1"
#property indicator_type2   DRAW_LINE
#property indicator_color2  clrOrangeRed
#property indicator_width2  1

//--- plot Lips1
#property indicator_label3  "Lips1"
#property indicator_type3   DRAW_LINE
#property indicator_color3  clrLime
#property indicator_width3  1

//--- plot Jaws2
#property indicator_label4  "Jaws2"
#property indicator_type4  DRAW_LINE
#property indicator_color4  clrBlue
#property indicator_width4  1

//--- plot Teeth2
#property indicator_label5  "Teeth"
#property indicator_type5   DRAW_LINE
#property indicator_color5  clrRed
#property indicator_width5  1

//--- plot Lips2
#property indicator_label6  "Lips"
#property indicator_type6   DRAW_LINE
#property indicator_color6  clrLimeGreen
#property indicator_width6  1

//--- includes
#include <IndMSTF\IndMSTF.mqh>
#include <Dashboard\Dashboard.mqh>
//--- input parameters
input string               InpSymbol      =  NULL;             /* Symbol                     */ // Moving average symbol
input ENUM_TIMEFRAMES      InpTimeframe   =  PERIOD_CURRENT;   /* Timeframe                  */ // Moving average timeframe
input int                  InpJawsPeriod  =  13;               /* Jaws Period                */ // Jaws calculation period
input int                  InpJawsShift   =  8;                /* Jaws Shift                 */ // Jaws shift
input int                  InpTeethPeriod =  8;                /* Teeth Period               */ // Teeth calculation period
input int                  InpTeethShift  =  5;                /* Teeth Shift                */ // Teeth shift
input int                  InpLipsPeriod  =  5;                /* Lips Period                */ // Lips calculation period
input int                  InpLipsShift   =  3;                /* Lips Shift                 */ // Lips shift
input ENUM_MA_METHOD       InpMethod      =  MODE_SMMA;        /* Method                     */ // Calculation method
input ENUM_APPLIED_PRICE   InpPrice       =  PRICE_MEDIAN;     /* Applied Price              */ // Price used for calculations
input uchar                InpLineWidth1  =  2;                /* Senior period Line Width   */ // Line width for higher period
input uchar                InpLineWidth2  =  1;                /* Junior period Line Width   */ // Line width for lower period
input bool                 InpAsSeries    =  true;             /* As Series flag             */ // Timeseries flag of indicator buffer arrays

//--- indicator buffers
double         BufferJaws1[];
double         BufferTeeth1[];
double         BufferLips1[];
double         BufferJaws2[];
double         BufferTeeth2[];
double         BufferLips2[];
//--- global variables
int handle_alligator1;
int handle_alligator2;
CMSTFIndicators indicators;      // An instance of the indicator collection object
//--- variables for the panel
CDashboard *panel=NULL;          // Pointer to the panel object
int         mouse_bar_index;     // Index of the bar the data is taken from
//+------------------------------------------------------------------+
//| Custom indicator initialization function                         |
//+------------------------------------------------------------------+
int OnInit()
  {
//--- Set a timer with an interval of 1 second
   EventSetTimer(1);
//--- Assign arrays BufferBandsUp1, BufferBandsDn1 and BufferBandsMd1 to plot buffers 0, 1 and 2, respectively
   SetIndexBuffer(0,BufferJaws1,INDICATOR_DATA);
   SetIndexBuffer(1,BufferTeeth1,INDICATOR_DATA);
   SetIndexBuffer(2,BufferLips1,INDICATOR_DATA);
//--- Set arrays BufferBandsUp2, BufferBandsDn2 and BufferBandsMd2 to buffers 3, 4 and 5, respectively
   SetIndexBuffer(3,BufferJaws2,INDICATOR_DATA);
   SetIndexBuffer(4,BufferTeeth2,INDICATOR_DATA);
   SetIndexBuffer(5,BufferLips2,INDICATOR_DATA);
//--- Set the line width
   int w1=0,w2=0;
   if(InpTimeframe>Period())
     {
      w1=InpLineWidth2;
      w2=InpLineWidth1;
     }
   else
     {
      w1=InpLineWidth1;
      w2=InpLineWidth2;
     }
   PlotIndexSetInteger(0,PLOT_LINE_WIDTH,w1);
   PlotIndexSetInteger(1,PLOT_LINE_WIDTH,w1);
   PlotIndexSetInteger(2,PLOT_LINE_WIDTH,w1);
   PlotIndexSetInteger(3,PLOT_LINE_WIDTH,w2);
   PlotIndexSetInteger(4,PLOT_LINE_WIDTH,w2);
   PlotIndexSetInteger(5,PLOT_LINE_WIDTH,w2);
//--- Set the timeseries flags for the indicator buffer arrays (for testing, to see that there is no difference)
   ArraySetAsSeries(BufferJaws1,InpAsSeries);
   ArraySetAsSeries(BufferTeeth1,InpAsSeries);
   ArraySetAsSeries(BufferLips1,InpAsSeries);
   ArraySetAsSeries(BufferJaws2,InpAsSeries);
   ArraySetAsSeries(BufferTeeth2,InpAsSeries);
   ArraySetAsSeries(BufferLips2,InpAsSeries);
//--- Create two indicators of the same type
//--- The first one is calculated on the current chart symbol/period, the second - on those specified in the settings
   handle_alligator1=indicators.AddNewAlligator(NULL,PERIOD_CURRENT,InpJawsPeriod,InpJawsShift,InpTeethPeriod,InpTeethShift,InpLipsPeriod,InpLipsShift,InpMethod,InpPrice);
   handle_alligator2=indicators.AddNewAlligator(InpSymbol,InpTimeframe,InpJawsPeriod,InpJawsShift,InpTeethPeriod,InpTeethShift,InpLipsPeriod,InpLipsShift,InpMethod,InpPrice);

//--- If failed to create indicator handles, return initialization error
   if(handle_alligator1==INVALID_HANDLE || handle_alligator2==INVALID_HANDLE)
      return INIT_FAILED;
//--- Set descriptions for indicator lines from buffer descriptions of calculation part of created indicators
   indicators.SetPlotLabelFromBuffer(0,handle_alligator1,0);
   indicators.SetPlotLabelFromBuffer(1,handle_alligator1,1);
   indicators.SetPlotLabelFromBuffer(2,handle_alligator1,2);
   indicators.SetPlotLabelFromBuffer(3,handle_alligator2,0);
   indicators.SetPlotLabelFromBuffer(4,handle_alligator2,1);
   indicators.SetPlotLabelFromBuffer(5,handle_alligator2,2);
//--- Set shifts for indicator lines
   indicators.SetPlotShift(0,InpJawsShift);
   indicators.SetPlotShift(1,InpTeethShift);
   indicators.SetPlotShift(2,InpLipsShift);
   indicators.SetPlotShift(3,InpJawsShift);
   indicators.SetPlotShift(4,InpTeethShift);
   indicators.SetPlotShift(5,InpLipsShift);

//--- Dashboard
//--- Create the panel
   int width=321;
   panel=new CDashboard(1,20,20,width,264);
   if(panel==NULL)
     {
      Print("Error. Failed to create panel object");
      return INIT_FAILED;
     }
//--- Set font parameters
   panel.SetFontParams("Calibri",9);
//--- Display the panel with the "Symbol, Timeframe description" header text
   panel.View(Symbol()+", "+StringSubstr(EnumToString(Period()),7));

//--- Create a table with ID 0 to display bar data in it
   panel.CreateNewTable(0);
//--- Draw a table with ID 0 on the panel background
   panel.DrawGrid(0,2,20,6,2,18,width/2-2);

//--- Create a table with ID 1 to display the data of indicator 1
   panel.CreateNewTable(1);
//--- Get the Y2 table coordinate with ID 0 and
//--- set the Y1 coordinate for the table with ID 1
   int y1=panel.TableY2(0)+22;
//--- Draw a table with ID 1 on the panel background
   panel.DrawGrid(1,2,y1,2,2,18,width/2-2);

//--- Create a table with ID 2 to display the data of indicator 2
   panel.CreateNewTable(2);
//--- Get the Y2 coordinate of the table with ID 1 and
//--- set the Y1 coordinate for the table with ID 2
   int y2=panel.TableY2(1)+3;
//--- Draw a table with ID 2 on the background of the dashboard
   panel.DrawGrid(2,2,y2,3,2,18,width/2-2);

//--- Initialize the variable with the index of the mouse cursor bar
   mouse_bar_index=0;
//--- Display the data of the current bar on the panel
   DrawData(mouse_bar_index,TimeCurrent());

//--- Successful initialization
   return(INIT_SUCCEEDED);
  }
//+------------------------------------------------------------------+
//| Custom indicator deinitialization function                       |
//+------------------------------------------------------------------+
void OnDeinit(const int reason)
  {
//--- Delete the timer
   EventKillTimer();
//--- If the panel object exists, delete it
   if(panel!=NULL)
      delete panel;
//--- Delete all comments
   Comment("");
  }
//+------------------------------------------------------------------+
//| Custom indicator iteration function                              |
//+------------------------------------------------------------------+
int OnCalculate(const int rates_total,
                const int prev_calculated,
                const datetime &time[],
                const double &open[],
                const double &high[],
                const double &low[],
                const double &close[],
                const long &tick_volume[],
                const long &volume[],
                const int &spread[])
  {
//--- Number of bars for calculation
   int limit=rates_total-prev_calculated;
//--- If limit > 1, then this is the first calculation or change in the history
   if(limit>1)
     {
      //--- specify all the available history for calculation
      limit=rates_total-1;
      /*
      // If the indicator has any buffers that display other calculations (not multi-indicators),
      // initialize them here with the "empty" value set for these buffers
      */
     }
//--- Calculate all created multi-symbol multi-period indicators
   if(!indicators.Calculate())
      return 0;

//--- Display the bar data under cursor (or current bar if cursor is outside the chart) on the dashboard
   DrawData(mouse_bar_index,time[mouse_bar_index]);

//--- From buffers of calculated indicators, output data to indicator buffers
   if(!indicators.DataToBuffer(NULL,PERIOD_CURRENT,handle_alligator1,0,0,limit,BufferJaws1))
      return 0;
   if(!indicators.DataToBuffer(NULL,PERIOD_CURRENT,handle_alligator1,1,0,limit,BufferTeeth1))
      return 0;
   if(!indicators.DataToBuffer(NULL,PERIOD_CURRENT,handle_alligator1,2,0,limit,BufferLips1))
      return 0;

   if(!indicators.DataToBuffer(NULL,PERIOD_CURRENT,handle_alligator2,0,0,limit,BufferJaws2))
      return 0;
   if(!indicators.DataToBuffer(NULL,PERIOD_CURRENT,handle_alligator2,1,0,limit,BufferTeeth2))
      return 0;
   if(!indicators.DataToBuffer(NULL,PERIOD_CURRENT,handle_alligator2,2,0,limit,BufferLips2))
      return 0;

//--- return value of prev_calculated for the next call
   return(rates_total);
  }
//+------------------------------------------------------------------+
//| Timer function                                                   |
//+------------------------------------------------------------------+
void OnTimer()
  {
//--- Call the indicator collection timer
   indicators.OnTimer();
  }
//+------------------------------------------------------------------+
//| ChartEvent function                                              |
//+------------------------------------------------------------------+
void OnChartEvent(const int id,
                  const long &lparam,
                  const double &dparam,
                  const string &sparam)
  {
//--- Handling the panel
//--- Call the panel event handler
   panel.OnChartEvent(id,lparam,dparam,sparam);

//--- If the cursor moves or a click is made on the chart
   if(id==CHARTEVENT_MOUSE_MOVE || id==CHARTEVENT_CLICK)
     {
      //--- Declare the variables to record time and price coordinates in them
      datetime time=0;
      double price=0;
      int wnd=0;
      //--- If the cursor coordinates are converted to date and time
      if(ChartXYToTimePrice(ChartID(),(int)lparam,(int)dparam,wnd,time,price))
        {
         //--- write the bar index where the cursor is located to a global variable
         mouse_bar_index=iBarShift(Symbol(),PERIOD_CURRENT,time);
         //--- Display the bar data under the cursor on the panel
         DrawData(mouse_bar_index,time);
        }
     }

//--- If we received a custom event, display the appropriate message in the journal
   if(id>CHARTEVENT_CUSTOM)
     {
      //--- Here we can implement handling a click on the close button on the panel
      PrintFormat("%s: Event id=%ld, object id (lparam): %lu, event message (sparam): %s",__FUNCTION__,id,lparam,sparam);
     }
  }
//+------------------------------------------------------------------+
//| Display data from the specified timeseries index to the panel    |
//+------------------------------------------------------------------+
void DrawData(const int index,const datetime time)
  {
//--- Declare the variables to receive data in them
   MqlRates rates[1];

//--- Exit if unable to get the bar data by the specified index
   if(CopyRates(Symbol(),PERIOD_CURRENT,index,1,rates)!=1)
      return;

//--- Set font parameters for bar and indicator data headers
   int  size=0;
   uint flags=0;
   uint angle=0;
   string name=panel.FontParams(size,flags,angle);
   panel.SetFontParams(name,9,FW_BOLD);
   panel.DrawText("Bar data ["+(string)index+"]",3,panel.TableY1(0)-16,clrMaroon,panel.Width()-6);
   panel.DrawText("Indicators data ["+(string)index+"]",3,panel.TableY1(1)-16,clrGreen,panel.Width()-6);
//--- Set font parameters for bar and indicator data
   panel.SetFontParams(name,9);

//--- Display the data of the specified bar in table 0 on the panel
   panel.DrawText("Date",  panel.CellX(0,0,0)+2, panel.CellY(0,0,0)+2); panel.DrawText(TimeToString(  rates[0].time,TIME_DATE),     panel.CellX(0,0,1)+2, panel.CellY(0,0,1)+2,clrNONE,90);
   panel.DrawText("Time",  panel.CellX(0,1,0)+2, panel.CellY(0,1,0)+2); panel.DrawText(TimeToString(  rates[0].time,TIME_MINUTES),  panel.CellX(0,1,1)+2, panel.CellY(0,1,1)+2,clrNONE,90);
   panel.DrawText("Open",  panel.CellX(0,2,0)+2, panel.CellY(0,2,0)+2); panel.DrawText(DoubleToString(rates[0].open,Digits()),      panel.CellX(0,2,1)+2, panel.CellY(0,2,1)+2,clrNONE,90);
   panel.DrawText("High",  panel.CellX(0,3,0)+2, panel.CellY(0,3,0)+2); panel.DrawText(DoubleToString(rates[0].high,Digits()),      panel.CellX(0,3,1)+2, panel.CellY(0,3,1)+2,clrNONE,90);
   panel.DrawText("Low",   panel.CellX(0,4,0)+2, panel.CellY(0,4,0)+2); panel.DrawText(DoubleToString(rates[0].low,Digits()),       panel.CellX(0,4,1)+2, panel.CellY(0,4,1)+2,clrNONE,90);
   panel.DrawText("Close", panel.CellX(0,5,0)+2, panel.CellY(0,5,0)+2); panel.DrawText(DoubleToString(rates[0].close,Digits()),     panel.CellX(0,5,1)+2, panel.CellY(0,5,1)+2,clrNONE,90);

//--- Output the data of indicator 1 from the specified bar into table 1
   panel.DrawText(indicators.Title(handle_alligator1), panel.CellX(1,0,0)+2, panel.CellY(1,0,0)+2);
   double value1=indicators.GetData(handle_alligator1,0,0,index+InpJawsShift);
   string value_str1=(value1!=EMPTY_VALUE ? DoubleToString(value1,indicators.Digits(handle_alligator1)) : " ");
   panel.DrawText(value_str1,panel.CellX(1,0,1)+2,panel.CellY(1,0,1)+2,clrNONE,150);

//--- Display a description of the indicator 1 line state
   panel.DrawText("Line state", panel.CellX(1,1,0)+2, panel.CellY(1,1,0)+2);
   ENUM_LINE_STATE state1=indicators.BufferLineState(Symbol(),PERIOD_CURRENT,handle_alligator1,0,0,index);
   panel.DrawText(BufferLineStateDescription(state1),panel.CellX(1,1,1)+2,panel.CellY(1,1,1)+2,clrNONE,150);

//--- Output the data of indicator 2 from the specified bar into table 2
   panel.DrawText(indicators.Title(handle_alligator2), panel.CellX(2,0,0)+2, panel.CellY(2,0,0)+2);
   double value2=indicators.GetDataTo(Symbol(),PERIOD_CURRENT,handle_alligator2,0,0,index);
   string value_str2=(value2!=EMPTY_VALUE ? DoubleToString(value2,indicators.Digits(handle_alligator2)) : " ");
   panel.DrawText(value_str2,panel.CellX(2,0,1)+2,panel.CellY(2,0,1)+2,clrNONE,150);

//--- Display a description of the indicator 2 line state
   panel.DrawText("Line state", panel.CellX(2,1,0)+2, panel.CellY(2,1,0)+2);
   ENUM_LINE_STATE state2=indicators.BufferLineState(Symbol(),PERIOD_CURRENT,handle_alligator2,0,0,index);
   panel.DrawText(BufferLineStateDescription(state2),panel.CellX(2,1,1)+2,panel.CellY(2,1,1)+2,clrNONE,150);

//--- Display description of relationship between indicator 1 line relative to indicator 2 line
   double value21=indicators.GetDataTo(Symbol(),PERIOD_CURRENT,handle_alligator2,0,0,index+1);
   ENUM_LINE_STATE stateR=indicators.BufferLineStateRelative(Symbol(),PERIOD_CURRENT,handle_alligator1,0,0,index,value2,value21);
   string ma1=indicators.Name(handle_alligator1);
   string ma2=indicators.Name(handle_alligator2);
   string state_relative=
     (
      stateR==LINE_STATE_ABOVE      ? StringFormat("%s1 > %s2",ma1,ma2)   :
      stateR==LINE_STATE_BELOW      ? StringFormat("%s1 < %s2",ma1,ma2)           :
      stateR==LINE_STATE_CROSS_DOWN ? "Top-down crossing"   :
      stateR==LINE_STATE_CROSS_UP   ? "Bottom-up crossing"  :
      BufferLineStateDescription(stateR)
     );
   panel.DrawText(StringFormat("%s1 vs %s2",ma1,ma2), panel.CellX(2,2,0)+2, panel.CellY(2,2,0)+2);
   panel.DrawText(state_relative, panel.CellX(2,2,1)+2, panel.CellY(2,2,1)+2,clrNONE,150);

//--- Redraw the chart to immediately display all changes on the panel
   ChartRedraw(ChartID());
  }
//+------------------------------------------------------------------+
Nach dem Kompilieren und Starten des Indikators auf dem M1-Chart, wobei M5 für die Berechnungen ausgewählt wurde, sehen wir:
Der Indikator Average Directional Movement Index:
//+------------------------------------------------------------------+
//|                      TestMSTFAverageDirectionalMovementIndex.mq5 |
//|                                  Copyright 2023, MetaQuotes Ltd. |
//|                                             https://www.mql5.com |
//+------------------------------------------------------------------+
#property copyright "Copyright 2023, MetaQuotes Ltd."
#property link      "https://www.mql5.com"
#property version   "1.00"
#property indicator_separate_window
#property indicator_buffers 6
#property indicator_plots   6
//--- enums

//--- plot ADX1
#property indicator_label1  "ADX1"
#property indicator_type1   DRAW_LINE
#property indicator_color1  clrDodgerBlue
#property indicator_style1  STYLE_SOLID
#property indicator_width1  1

//--- plot +DI1
#property indicator_label2  "+DI1"
#property indicator_type2   DRAW_LINE
#property indicator_color2  clrGreen
#property indicator_style2  STYLE_SOLID
#property indicator_width2  1

//--- plot -DI1
#property indicator_label3  "-DI1"
#property indicator_type3   DRAW_LINE
#property indicator_color3  clrRed
#property indicator_style3  STYLE_SOLID
#property indicator_width3  1

//--- plot ADX2
#property indicator_label4  "ADX2"
#property indicator_type4   DRAW_LINE
#property indicator_color4  clrBlue
#property indicator_style4  STYLE_SOLID
#property indicator_width4  1

//--- plot +DI2
#property indicator_label5  "+DI2"
#property indicator_type5   DRAW_LINE
#property indicator_color5  clrGreen
#property indicator_style5  STYLE_SOLID
#property indicator_width5  1

//--- plot -DI2
#property indicator_label6  "-DI2"
#property indicator_type6   DRAW_LINE
#property indicator_color6  clrRed
#property indicator_style6  STYLE_SOLID
#property indicator_width6  1

//--- includes
#include <IndMSTF\IndMSTF.mqh>
#include <Dashboard\Dashboard.mqh>
//--- input parameters
input string               InpSymbol      =  NULL;             /* Symbol                     */ // Symbol
input ENUM_TIMEFRAMES      InpTimeframe   =  PERIOD_CURRENT;   /* Timeframe                  */ // Timeframe
input int                  InpPeriod      =  14;               /* Period                     */ // Calculation period
input uchar                InpLineWidth1  =  2;                /* Senior period Line Width   */ // Line width for higher period
input uchar                InpLineWidth2  =  1;                /* Junior period Line Width   */ // Line width for lower period
input bool                 InpAsSeries    =  true;             /* As Series flag             */ // Timeseries flag of indicator buffer arrays

//--- indicator buffers
double         BufferADX1[];
double         BufferDIPlus1[];
double         BufferDIMinus1[];
double         BufferADX2[];
double         BufferDIPlus2[];
double         BufferDIMinus2[];
//--- global variables
int handle_adx1;
int handle_adx2;
CMSTFIndicators indicators;      // An instance of the indicator collection object
//--- variables for the panel
CDashboard *panel=NULL;          // Pointer to the panel object
int         mouse_bar_index;     // Index of the bar the data is taken from
//+------------------------------------------------------------------+
//| Custom indicator initialization function                         |
//+------------------------------------------------------------------+
int OnInit()
  {
//--- Set a timer with an interval of 1 second
   EventSetTimer(1);
//--- Assign the BufferMA1 and BufferMA2 arrays to the plot buffers 0 and 1, respectively
   SetIndexBuffer(0,BufferADX1,INDICATOR_DATA);
   SetIndexBuffer(1,BufferDIPlus1,INDICATOR_DATA);
   SetIndexBuffer(2,BufferDIMinus1,INDICATOR_DATA);
   SetIndexBuffer(3,BufferADX2,INDICATOR_DATA);
   SetIndexBuffer(4,BufferDIPlus2,INDICATOR_DATA);
   SetIndexBuffer(5,BufferDIMinus2,INDICATOR_DATA);
//--- Set the line width
   int w1=0,w2=0;
   if(InpTimeframe>Period())
     {
      w1=InpLineWidth2;
      w2=InpLineWidth1;
     }
   else
     {
      w1=InpLineWidth1;
      w2=InpLineWidth2;
     }
   PlotIndexSetInteger(0,PLOT_LINE_WIDTH,w1);
   PlotIndexSetInteger(1,PLOT_LINE_WIDTH,w1);
   PlotIndexSetInteger(2,PLOT_LINE_WIDTH,w1);
   PlotIndexSetInteger(3,PLOT_LINE_WIDTH,w2);
   PlotIndexSetInteger(4,PLOT_LINE_WIDTH,w2);
   PlotIndexSetInteger(5,PLOT_LINE_WIDTH,w2);
//--- sets indicator shift

//--- Set the timeseries flags for the indicator buffer arrays (for testing, to see that there is no difference)
   ArraySetAsSeries(BufferADX1,InpAsSeries);
   ArraySetAsSeries(BufferDIPlus1,InpAsSeries);
   ArraySetAsSeries(BufferDIMinus1,InpAsSeries);
   ArraySetAsSeries(BufferADX2,InpAsSeries);
   ArraySetAsSeries(BufferDIPlus2,InpAsSeries);
   ArraySetAsSeries(BufferDIMinus2,InpAsSeries);

//--- Create two indicators of the same type
//--- The first one is calculated on the current chart symbol/period, the second - on those specified in the settings
   handle_adx1=indicators.AddNewADX(NULL,PERIOD_CURRENT,InpPeriod);
   handle_adx2=indicators.AddNewADX(InpSymbol,InpTimeframe,InpPeriod);

//--- If failed to create indicator handles, return initialization error
   if(handle_adx1==INVALID_HANDLE || handle_adx2==INVALID_HANDLE)
      return INIT_FAILED;
//--- Set descriptions for indicator lines from buffer descriptions of calculation part of created indicators
   indicators.SetPlotLabelFromBuffer(0,handle_adx1,0);
   indicators.SetPlotLabelFromBuffer(1,handle_adx1,1);
   indicators.SetPlotLabelFromBuffer(2,handle_adx1,2);
   indicators.SetPlotLabelFromBuffer(3,handle_adx2,0);
   indicators.SetPlotLabelFromBuffer(4,handle_adx2,1);
   indicators.SetPlotLabelFromBuffer(5,handle_adx2,2);

//--- Dashboard
//--- Create the panel
   int width=301;
   panel=new CDashboard(1,20,20,width,264,0);
   if(panel==NULL)
     {
      Print("Error. Failed to create panel object");
      return INIT_FAILED;
     }
//--- Set font parameters
   panel.SetFontParams("Calibri",9);
//--- Display the panel with the "Symbol, Timeframe description" header text
   panel.View(Symbol()+", "+StringSubstr(EnumToString(Period()),7));

//--- Create a table with ID 0 to display bar data in it
   panel.CreateNewTable(0);
//--- Draw a table with ID 0 on the panel background
   panel.DrawGrid(0,2,20,6,2,18,width/2-2);

//--- Create a table with ID 1 to display the data of indicator 1
   panel.CreateNewTable(1);
//--- Get the Y2 table coordinate with ID 0 and
//--- set the Y1 coordinate for the table with ID 1
   int y1=panel.TableY2(0)+22;
//--- Draw a table with ID 1 on the panel background
   panel.DrawGrid(1,2,y1,2,2,18,width/2-2);

//--- Create a table with ID 2 to display the data of indicator 2
   panel.CreateNewTable(2);
//--- Get the Y2 coordinate of the table with ID 1 and
//--- set the Y1 coordinate for the table with ID 2
   int y2=panel.TableY2(1)+3;
//--- Draw a table with ID 2 on the background of the dashboard
   panel.DrawGrid(2,2,y2,3,2,18,width/2-2);

//--- Initialize the variable with the index of the mouse cursor bar
   mouse_bar_index=0;
//--- Display the data of the current bar on the panel
   DrawData(mouse_bar_index,TimeCurrent());

//--- Successful initialization
   return(INIT_SUCCEEDED);
  }
//+------------------------------------------------------------------+
//| Custom indicator deinitialization function                       |
//+------------------------------------------------------------------+
void OnDeinit(const int reason)
  {
//--- Delete the timer
   EventKillTimer();
//--- If the panel object exists, delete it
   if(panel!=NULL)
      delete panel;
//--- Delete all comments
   Comment("");
  }
//+------------------------------------------------------------------+
//| Custom indicator iteration function                              |
//+------------------------------------------------------------------+
int OnCalculate(const int rates_total,
                const int prev_calculated,
                const datetime &time[],
                const double &open[],
                const double &high[],
                const double &low[],
                const double &close[],
                const long &tick_volume[],
                const long &volume[],
                const int &spread[])
  {
//--- Number of bars for calculation
   int limit=rates_total-prev_calculated;
//--- If limit > 1, then this is the first calculation or change in the history
   if(limit>1)
     {
      //--- specify all the available history for calculation
      limit=rates_total-1;
      /*
      // If the indicator has any buffers that display other calculations (not multi-indicators),
      // initialize them here with the "empty" value set for these buffers
      */
     }
//--- Calculate all created multi-symbol multi-period indicators
   if(!indicators.Calculate())
      return 0;

//--- Display the bar data under cursor (or current bar if cursor is outside the chart) on the dashboard
   DrawData(mouse_bar_index,time[mouse_bar_index]);

//--- From buffers of calculated indicators, output data to indicator buffers
   if(!indicators.DataToBuffer(NULL,PERIOD_CURRENT,handle_adx1,0,0,limit,BufferADX1))
      return 0;
   if(!indicators.DataToBuffer(NULL,PERIOD_CURRENT,handle_adx1,1,0,limit,BufferDIPlus1))
      return 0;
   if(!indicators.DataToBuffer(NULL,PERIOD_CURRENT,handle_adx1,2,0,limit,BufferDIMinus1))
      return 0;

   if(!indicators.DataToBuffer(NULL,PERIOD_CURRENT,handle_adx2,0,0,limit,BufferADX2))
      return 0;
   if(!indicators.DataToBuffer(NULL,PERIOD_CURRENT,handle_adx2,1,0,limit,BufferDIPlus2))
      return 0;
   if(!indicators.DataToBuffer(NULL,PERIOD_CURRENT,handle_adx2,2,0,limit,BufferDIMinus2))
      return 0;

//--- return value of prev_calculated for the next call
   return(rates_total);
  }
//+------------------------------------------------------------------+
//| Timer function                                                   |
//+------------------------------------------------------------------+
void OnTimer()
  {
//--- Call the indicator collection timer
   indicators.OnTimer();
  }
//+------------------------------------------------------------------+
//| ChartEvent function                                              |
//+------------------------------------------------------------------+
void OnChartEvent(const int id,
                  const long &lparam,
                  const double &dparam,
                  const string &sparam)
  {
//--- Handling the panel
//--- Call the panel event handler
   panel.OnChartEvent(id,lparam,dparam,sparam);

//--- If the cursor moves or a click is made on the chart
   if(id==CHARTEVENT_MOUSE_MOVE || id==CHARTEVENT_CLICK)
     {
      //--- Declare the variables to record time and price coordinates in them
      datetime time=0;
      double price=0;
      int wnd=0;
      //--- If the cursor coordinates are converted to date and time
      if(ChartXYToTimePrice(ChartID(),(int)lparam,(int)dparam,wnd,time,price))
        {
         //--- write the bar index where the cursor is located to a global variable
         mouse_bar_index=iBarShift(Symbol(),PERIOD_CURRENT,time);
         //--- Display the bar data under the cursor on the panel
         DrawData(mouse_bar_index,time);
        }
     }

//--- If we received a custom event, display the appropriate message in the journal
   if(id>CHARTEVENT_CUSTOM)
     {
      //--- Here we can implement handling a click on the close button on the panel
      PrintFormat("%s: Event id=%ld, object id (lparam): %lu, event message (sparam): %s",__FUNCTION__,id,lparam,sparam);
     }
  }
//+------------------------------------------------------------------+
//| Display data from the specified timeseries index to the panel    |
//+------------------------------------------------------------------+
void DrawData(const int index,const datetime time)
  {
//--- Declare the variables to receive data in them
   MqlRates rates[1];

//--- Exit if unable to get the bar data by the specified index
   if(CopyRates(Symbol(),PERIOD_CURRENT,index,1,rates)!=1)
      return;

//--- Set font parameters for bar and indicator data headers
   int  size=0;
   uint flags=0;
   uint angle=0;
   string name=panel.FontParams(size,flags,angle);
   panel.SetFontParams(name,9,FW_BOLD);
   panel.DrawText("Bar data ["+(string)index+"]",3,panel.TableY1(0)-16,clrMaroon,panel.Width()-6);
   panel.DrawText("Indicators data ["+(string)index+"]",3,panel.TableY1(1)-16,clrGreen,panel.Width()-6);
//--- Set font parameters for bar and indicator data
   panel.SetFontParams(name,9);

//--- Display the data of the specified bar in table 0 on the panel
   panel.DrawText("Date",  panel.CellX(0,0,0)+2, panel.CellY(0,0,0)+2); panel.DrawText(TimeToString(  rates[0].time,TIME_DATE),     panel.CellX(0,0,1)+2, panel.CellY(0,0,1)+2,clrNONE,90);
   panel.DrawText("Time",  panel.CellX(0,1,0)+2, panel.CellY(0,1,0)+2); panel.DrawText(TimeToString(  rates[0].time,TIME_MINUTES),  panel.CellX(0,1,1)+2, panel.CellY(0,1,1)+2,clrNONE,90);
   panel.DrawText("Open",  panel.CellX(0,2,0)+2, panel.CellY(0,2,0)+2); panel.DrawText(DoubleToString(rates[0].open,Digits()),      panel.CellX(0,2,1)+2, panel.CellY(0,2,1)+2,clrNONE,90);
   panel.DrawText("High",  panel.CellX(0,3,0)+2, panel.CellY(0,3,0)+2); panel.DrawText(DoubleToString(rates[0].high,Digits()),      panel.CellX(0,3,1)+2, panel.CellY(0,3,1)+2,clrNONE,90);
   panel.DrawText("Low",   panel.CellX(0,4,0)+2, panel.CellY(0,4,0)+2); panel.DrawText(DoubleToString(rates[0].low,Digits()),       panel.CellX(0,4,1)+2, panel.CellY(0,4,1)+2,clrNONE,90);
   panel.DrawText("Close", panel.CellX(0,5,0)+2, panel.CellY(0,5,0)+2); panel.DrawText(DoubleToString(rates[0].close,Digits()),     panel.CellX(0,5,1)+2, panel.CellY(0,5,1)+2,clrNONE,90);

//--- Output the data of indicator 1 from the specified bar into table 1
   panel.DrawText(indicators.Title(handle_adx1), panel.CellX(1,0,0)+2, panel.CellY(1,0,0)+2);
   double value1=indicators.GetData(handle_adx1,0,0,index);
   string value_str1=(value1!=EMPTY_VALUE ? DoubleToString(value1,indicators.Digits(handle_adx1)) : " ");
   panel.DrawText(value_str1,panel.CellX(1,0,1)+2,panel.CellY(1,0,1)+2,clrNONE,190);

//--- Display a description of the indicator 1 line state
   panel.DrawText("Line state", panel.CellX(1,1,0)+2, panel.CellY(1,1,0)+2);
   ENUM_LINE_STATE state1=indicators.BufferLineState(Symbol(),PERIOD_CURRENT,handle_adx1,0,0,index);
   panel.DrawText(BufferLineStateDescription(state1),panel.CellX(1,1,1)+2,panel.CellY(1,1,1)+2,clrNONE,190);

//--- Output the data of indicator 2 from the specified bar into table 2
   panel.DrawText(indicators.Title(handle_adx2), panel.CellX(2,0,0)+2, panel.CellY(2,0,0)+2);
   double value2=indicators.GetDataTo(Symbol(),PERIOD_CURRENT,handle_adx2,0,0,index);
   string value_str2=(value2!=EMPTY_VALUE ? DoubleToString(value2,indicators.Digits(handle_adx2)) : " ");
   panel.DrawText(value_str2,panel.CellX(2,0,1)+2,panel.CellY(2,0,1)+2,clrNONE,190);

//--- Display a description of the indicator 2 line state
   panel.DrawText("Line state", panel.CellX(2,1,0)+2, panel.CellY(2,1,0)+2);
   ENUM_LINE_STATE state2=indicators.BufferLineState(Symbol(),PERIOD_CURRENT,handle_adx2,0,0,index);
   panel.DrawText(BufferLineStateDescription(state2),panel.CellX(2,1,1)+2,panel.CellY(2,1,1)+2,clrNONE,190);

//--- Display description of relationship between indicator 1 line relative to indicator 2 line
   double value21=indicators.GetDataTo(Symbol(),PERIOD_CURRENT,handle_adx2,0,0,index+1);
   ENUM_LINE_STATE stateR=indicators.BufferLineStateRelative(Symbol(),PERIOD_CURRENT,handle_adx1,0,0,index,value2,value21);
   string ma1=indicators.Name(handle_adx1);
   string ma2=indicators.Name(handle_adx2);
   string state_relative=
     (
      stateR==LINE_STATE_ABOVE      ? StringFormat("%s1 > %s2",ma1,ma2)   :
      stateR==LINE_STATE_BELOW      ? StringFormat("%s1 < %s2",ma1,ma2)           :
      stateR==LINE_STATE_CROSS_DOWN ? "Top-down crossing"   :
      stateR==LINE_STATE_CROSS_UP   ? "Bottom-up crossing"  :
      BufferLineStateDescription(stateR)
     );
   panel.DrawText(StringFormat("%s1 vs %s2",ma1,ma2), panel.CellX(2,2,0)+2, panel.CellY(2,2,0)+2);
   panel.DrawText(state_relative, panel.CellX(2,2,1)+2, panel.CellY(2,2,1)+2,clrNONE,190);

//--- Redraw the chart to immediately display all changes on the panel
   ChartRedraw(ChartID());
  }
//+------------------------------------------------------------------+
Nach dem Kompilieren und Starten des Indikators auf dem M1-Chart, wobei M5 für die Berechnungen ausgewählt wurde, sehen wir:
Der Indikator Average Directional Movement Index von Wilder:
//+------------------------------------------------------------------+
//|                TestMSTFAverageDirectionalMovementIndexWilder.mq5 |
//|                                  Copyright 2023, MetaQuotes Ltd. |
//|                                             https://www.mql5.com |
//+------------------------------------------------------------------+
#property copyright "Copyright 2023, MetaQuotes Ltd."
#property link      "https://www.mql5.com"
#property version   "1.00"
#property indicator_separate_window
#property indicator_buffers 6
#property indicator_plots   6
//--- enums

//--- plot ADXW1
#property indicator_label1  "ADXW1"
#property indicator_type1   DRAW_LINE
#property indicator_color1  clrDodgerBlue
#property indicator_style1  STYLE_SOLID
#property indicator_width1  1

//--- plot +DI1
#property indicator_label2  "+DI1"
#property indicator_type2   DRAW_LINE
#property indicator_color2  clrGreen
#property indicator_style2  STYLE_SOLID
#property indicator_width2  1

//--- plot -DI1
#property indicator_label3  "-DI1"
#property indicator_type3   DRAW_LINE
#property indicator_color3  clrRed
#property indicator_style3  STYLE_SOLID
#property indicator_width3  1

//--- plot ADXW2
#property indicator_label4  "ADXW2"
#property indicator_type4   DRAW_LINE
#property indicator_color4  clrBlue
#property indicator_style4  STYLE_SOLID
#property indicator_width4  1

//--- plot +DI2
#property indicator_label5  "+DI2"
#property indicator_type5   DRAW_LINE
#property indicator_color5  clrGreen
#property indicator_style5  STYLE_SOLID
#property indicator_width5  1

//--- plot -DI2
#property indicator_label6  "-DI2"
#property indicator_type6   DRAW_LINE
#property indicator_color6  clrRed
#property indicator_style6  STYLE_SOLID
#property indicator_width6  1

//--- includes
#include <IndMSTF\IndMSTF.mqh>
#include <Dashboard\Dashboard.mqh>
//--- input parameters
input string               InpSymbol      =  NULL;             /* Symbol                     */ // Symbol
input ENUM_TIMEFRAMES      InpTimeframe   =  PERIOD_CURRENT;   /* Timeframe                  */ // Timeframe
input int                  InpPeriod      =  14;               /* Period                     */ // Calculation period
input uchar                InpLineWidth1  =  2;                /* Senior period Line Width   */ // Line width for higher period
input uchar                InpLineWidth2  =  1;                /* Junior period Line Width   */ // Line width for lower period
input bool                 InpAsSeries    =  true;             /* As Series flag             */ // Timeseries flag of indicator buffer arrays

//--- indicator buffers
double         BufferADXW1[];
double         BufferDIPlus1[];
double         BufferDIMinus1[];
double         BufferADXW2[];
double         BufferDIPlus2[];
double         BufferDIMinus2[];
//--- global variables
int handle_adxw1;
int handle_adxw2;
CMSTFIndicators indicators;      // An instance of the indicator collection object
//--- variables for the panel
CDashboard *panel=NULL;          // Pointer to the panel object
int         mouse_bar_index;     // Index of the bar the data is taken from
//+------------------------------------------------------------------+
//| Custom indicator initialization function                         |
//+------------------------------------------------------------------+
int OnInit()
  {
//--- Set a timer with an interval of 1 second
   EventSetTimer(1);
//--- Assign the BufferMA1 and BufferMA2 arrays to the plot buffers 0 and 1, respectively
   SetIndexBuffer(0,BufferADXW1,INDICATOR_DATA);
   SetIndexBuffer(1,BufferDIPlus1,INDICATOR_DATA);
   SetIndexBuffer(2,BufferDIMinus1,INDICATOR_DATA);
   SetIndexBuffer(3,BufferADXW2,INDICATOR_DATA);
   SetIndexBuffer(4,BufferDIPlus2,INDICATOR_DATA);
   SetIndexBuffer(5,BufferDIMinus2,INDICATOR_DATA);
//--- Set the line width
   int w1=0,w2=0;
   if(InpTimeframe>Period())
     {
      w1=InpLineWidth2;
      w2=InpLineWidth1;
     }
   else
     {
      w1=InpLineWidth1;
      w2=InpLineWidth2;
     }
   PlotIndexSetInteger(0,PLOT_LINE_WIDTH,w1);
   PlotIndexSetInteger(1,PLOT_LINE_WIDTH,w1);
   PlotIndexSetInteger(2,PLOT_LINE_WIDTH,w1);
   PlotIndexSetInteger(3,PLOT_LINE_WIDTH,w2);
   PlotIndexSetInteger(4,PLOT_LINE_WIDTH,w2);
   PlotIndexSetInteger(5,PLOT_LINE_WIDTH,w2);
//--- sets indicator shift

//--- Set the timeseries flags for the indicator buffer arrays (for testing, to see that there is no difference)
   ArraySetAsSeries(BufferADXW1,InpAsSeries);
   ArraySetAsSeries(BufferDIPlus1,InpAsSeries);
   ArraySetAsSeries(BufferDIMinus1,InpAsSeries);
   ArraySetAsSeries(BufferADXW2,InpAsSeries);
   ArraySetAsSeries(BufferDIPlus2,InpAsSeries);
   ArraySetAsSeries(BufferDIMinus2,InpAsSeries);

//--- Create two indicators of the same type
//--- The first one is calculated on the current chart symbol/period, the second - on those specified in the settings
   handle_adxw1=indicators.AddNewADX(NULL,PERIOD_CURRENT,InpPeriod);
   handle_adxw2=indicators.AddNewADX(InpSymbol,InpTimeframe,InpPeriod);

//--- If failed to create indicator handles, return initialization error
   if(handle_adxw1==INVALID_HANDLE || handle_adxw2==INVALID_HANDLE)
      return INIT_FAILED;
//--- Set descriptions for indicator lines from buffer descriptions of calculation part of created indicators
   indicators.SetPlotLabelFromBuffer(0,handle_adxw1,0);
   indicators.SetPlotLabelFromBuffer(1,handle_adxw1,1);
   indicators.SetPlotLabelFromBuffer(2,handle_adxw1,2);
   indicators.SetPlotLabelFromBuffer(3,handle_adxw2,0);
   indicators.SetPlotLabelFromBuffer(4,handle_adxw2,1);
   indicators.SetPlotLabelFromBuffer(5,handle_adxw2,2);

//--- Dashboard
//--- Create the panel
   int width=301;
   panel=new CDashboard(1,20,20,width,264,0);
   if(panel==NULL)
     {
      Print("Error. Failed to create panel object");
      return INIT_FAILED;
     }
//--- Set font parameters
   panel.SetFontParams("Calibri",9);
//--- Display the panel with the "Symbol, Timeframe description" header text
   panel.View(Symbol()+", "+StringSubstr(EnumToString(Period()),7));

//--- Create a table with ID 0 to display bar data in it
   panel.CreateNewTable(0);
//--- Draw a table with ID 0 on the panel background
   panel.DrawGrid(0,2,20,6,2,18,width/2-2);

//--- Create a table with ID 1 to display the data of indicator 1
   panel.CreateNewTable(1);
//--- Get the Y2 table coordinate with ID 0 and
//--- set the Y1 coordinate for the table with ID 1
   int y1=panel.TableY2(0)+22;
//--- Draw a table with ID 1 on the panel background
   panel.DrawGrid(1,2,y1,2,2,18,width/2-2);

//--- Create a table with ID 2 to display the data of indicator 2
   panel.CreateNewTable(2);
//--- Get the Y2 coordinate of the table with ID 1 and
//--- set the Y1 coordinate for the table with ID 2
   int y2=panel.TableY2(1)+3;
//--- Draw a table with ID 2 on the background of the dashboard
   panel.DrawGrid(2,2,y2,3,2,18,width/2-2);

//--- Initialize the variable with the index of the mouse cursor bar
   mouse_bar_index=0;
//--- Display the data of the current bar on the panel
   DrawData(mouse_bar_index,TimeCurrent());

//--- Successful initialization
   return(INIT_SUCCEEDED);
  }
//+------------------------------------------------------------------+
//| Custom indicator deinitialization function                       |
//+------------------------------------------------------------------+
void OnDeinit(const int reason)
  {
//--- Delete the timer
   EventKillTimer();
//--- If the panel object exists, delete it
   if(panel!=NULL)
      delete panel;
//--- Delete all comments
   Comment("");
  }
//+------------------------------------------------------------------+
//| Custom indicator iteration function                              |
//+------------------------------------------------------------------+
int OnCalculate(const int rates_total,
                const int prev_calculated,
                const datetime &time[],
                const double &open[],
                const double &high[],
                const double &low[],
                const double &close[],
                const long &tick_volume[],
                const long &volume[],
                const int &spread[])
  {
//--- Number of bars for calculation
   int limit=rates_total-prev_calculated;
//--- If limit > 1, then this is the first calculation or change in the history
   if(limit>1)
     {
      //--- specify all the available history for calculation
      limit=rates_total-1;
      /*
      // If the indicator has any buffers that display other calculations (not multi-indicators),
      // initialize them here with the "empty" value set for these buffers
      */
     }
//--- Calculate all created multi-symbol multi-period indicators
   if(!indicators.Calculate())
      return 0;

//--- Display the bar data under cursor (or current bar if cursor is outside the chart) on the dashboard
   DrawData(mouse_bar_index,time[mouse_bar_index]);

//--- From buffers of calculated indicators, output data to indicator buffers
   if(!indicators.DataToBuffer(NULL,PERIOD_CURRENT,handle_adxw1,0,0,limit,BufferADXW1))
      return 0;
   if(!indicators.DataToBuffer(NULL,PERIOD_CURRENT,handle_adxw1,1,0,limit,BufferDIPlus1))
      return 0;
   if(!indicators.DataToBuffer(NULL,PERIOD_CURRENT,handle_adxw1,2,0,limit,BufferDIMinus1))
      return 0;

   if(!indicators.DataToBuffer(NULL,PERIOD_CURRENT,handle_adxw2,0,0,limit,BufferADXW2))
      return 0;
   if(!indicators.DataToBuffer(NULL,PERIOD_CURRENT,handle_adxw2,1,0,limit,BufferDIPlus2))
      return 0;
   if(!indicators.DataToBuffer(NULL,PERIOD_CURRENT,handle_adxw2,2,0,limit,BufferDIMinus2))
      return 0;

//--- return value of prev_calculated for the next call
   return(rates_total);
  }
//+------------------------------------------------------------------+
//| Timer function                                                   |
//+------------------------------------------------------------------+
void OnTimer()
  {
//--- Call the indicator collection timer
   indicators.OnTimer();
  }
//+------------------------------------------------------------------+
//| ChartEvent function                                              |
//+------------------------------------------------------------------+
void OnChartEvent(const int id,
                  const long &lparam,
                  const double &dparam,
                  const string &sparam)
  {
//--- Handling the panel
//--- Call the panel event handler
   panel.OnChartEvent(id,lparam,dparam,sparam);

//--- If the cursor moves or a click is made on the chart
   if(id==CHARTEVENT_MOUSE_MOVE || id==CHARTEVENT_CLICK)
     {
      //--- Declare the variables to record time and price coordinates in them
      datetime time=0;
      double price=0;
      int wnd=0;
      //--- If the cursor coordinates are converted to date and time
      if(ChartXYToTimePrice(ChartID(),(int)lparam,(int)dparam,wnd,time,price))
        {
         //--- write the bar index where the cursor is located to a global variable
         mouse_bar_index=iBarShift(Symbol(),PERIOD_CURRENT,time);
         //--- Display the bar data under the cursor on the panel
         DrawData(mouse_bar_index,time);
        }
     }

//--- If we received a custom event, display the appropriate message in the journal
   if(id>CHARTEVENT_CUSTOM)
     {
      //--- Here we can implement handling a click on the close button on the panel
      PrintFormat("%s: Event id=%ld, object id (lparam): %lu, event message (sparam): %s",__FUNCTION__,id,lparam,sparam);
     }
  }
//+------------------------------------------------------------------+
//| Display data from the specified timeseries index to the panel    |
//+------------------------------------------------------------------+
void DrawData(const int index,const datetime time)
  {
//--- Declare the variables to receive data in them
   MqlRates rates[1];

//--- Exit if unable to get the bar data by the specified index
   if(CopyRates(Symbol(),PERIOD_CURRENT,index,1,rates)!=1)
      return;

//--- Set font parameters for bar and indicator data headers
   int  size=0;
   uint flags=0;
   uint angle=0;
   string name=panel.FontParams(size,flags,angle);
   panel.SetFontParams(name,9,FW_BOLD);
   panel.DrawText("Bar data ["+(string)index+"]",3,panel.TableY1(0)-16,clrMaroon,panel.Width()-6);
   panel.DrawText("Indicators data ["+(string)index+"]",3,panel.TableY1(1)-16,clrGreen,panel.Width()-6);
//--- Set font parameters for bar and indicator data
   panel.SetFontParams(name,9);

//--- Display the data of the specified bar in table 0 on the panel
   panel.DrawText("Date",  panel.CellX(0,0,0)+2, panel.CellY(0,0,0)+2); panel.DrawText(TimeToString(  rates[0].time,TIME_DATE),     panel.CellX(0,0,1)+2, panel.CellY(0,0,1)+2,clrNONE,90);
   panel.DrawText("Time",  panel.CellX(0,1,0)+2, panel.CellY(0,1,0)+2); panel.DrawText(TimeToString(  rates[0].time,TIME_MINUTES),  panel.CellX(0,1,1)+2, panel.CellY(0,1,1)+2,clrNONE,90);
   panel.DrawText("Open",  panel.CellX(0,2,0)+2, panel.CellY(0,2,0)+2); panel.DrawText(DoubleToString(rates[0].open,Digits()),      panel.CellX(0,2,1)+2, panel.CellY(0,2,1)+2,clrNONE,90);
   panel.DrawText("High",  panel.CellX(0,3,0)+2, panel.CellY(0,3,0)+2); panel.DrawText(DoubleToString(rates[0].high,Digits()),      panel.CellX(0,3,1)+2, panel.CellY(0,3,1)+2,clrNONE,90);
   panel.DrawText("Low",   panel.CellX(0,4,0)+2, panel.CellY(0,4,0)+2); panel.DrawText(DoubleToString(rates[0].low,Digits()),       panel.CellX(0,4,1)+2, panel.CellY(0,4,1)+2,clrNONE,90);
   panel.DrawText("Close", panel.CellX(0,5,0)+2, panel.CellY(0,5,0)+2); panel.DrawText(DoubleToString(rates[0].close,Digits()),     panel.CellX(0,5,1)+2, panel.CellY(0,5,1)+2,clrNONE,90);

//--- Output the data of indicator 1 from the specified bar into table 1
   panel.DrawText(indicators.Title(handle_adxw1), panel.CellX(1,0,0)+2, panel.CellY(1,0,0)+2);
   double value1=indicators.GetData(handle_adxw1,0,0,index);
   string value_str1=(value1!=EMPTY_VALUE ? DoubleToString(value1,indicators.Digits(handle_adxw1)) : " ");
   panel.DrawText(value_str1,panel.CellX(1,0,1)+2,panel.CellY(1,0,1)+2,clrNONE,190);

//--- Display a description of the indicator 1 line state
   panel.DrawText("Line state", panel.CellX(1,1,0)+2, panel.CellY(1,1,0)+2);
   ENUM_LINE_STATE state1=indicators.BufferLineState(Symbol(),PERIOD_CURRENT,handle_adxw1,0,0,index);
   panel.DrawText(BufferLineStateDescription(state1),panel.CellX(1,1,1)+2,panel.CellY(1,1,1)+2,clrNONE,190);

//--- Output the data of indicator 2 from the specified bar into table 2
   panel.DrawText(indicators.Title(handle_adxw2), panel.CellX(2,0,0)+2, panel.CellY(2,0,0)+2);
   double value2=indicators.GetDataTo(Symbol(),PERIOD_CURRENT,handle_adxw2,0,0,index);
   string value_str2=(value2!=EMPTY_VALUE ? DoubleToString(value2,indicators.Digits(handle_adxw2)) : " ");
   panel.DrawText(value_str2,panel.CellX(2,0,1)+2,panel.CellY(2,0,1)+2,clrNONE,190);

//--- Display a description of the indicator 2 line state
   panel.DrawText("Line state", panel.CellX(2,1,0)+2, panel.CellY(2,1,0)+2);
   ENUM_LINE_STATE state2=indicators.BufferLineState(Symbol(),PERIOD_CURRENT,handle_adxw2,0,0,index);
   panel.DrawText(BufferLineStateDescription(state2),panel.CellX(2,1,1)+2,panel.CellY(2,1,1)+2,clrNONE,190);

//--- Display description of relationship between indicator 1 line relative to indicator 2 line
   double value21=indicators.GetDataTo(Symbol(),PERIOD_CURRENT,handle_adxw2,0,0,index+1);
   ENUM_LINE_STATE stateR=indicators.BufferLineStateRelative(Symbol(),PERIOD_CURRENT,handle_adxw1,0,0,index,value2,value21);
   string ma1=indicators.Name(handle_adxw1);
   string ma2=indicators.Name(handle_adxw2);
   string state_relative=
     (
      stateR==LINE_STATE_ABOVE      ? StringFormat("%s1 > %s2",ma1,ma2)   :
      stateR==LINE_STATE_BELOW      ? StringFormat("%s1 < %s2",ma1,ma2)           :
      stateR==LINE_STATE_CROSS_DOWN ? "Top-down crossing"   :
      stateR==LINE_STATE_CROSS_UP   ? "Bottom-up crossing"  :
      BufferLineStateDescription(stateR)
     );
   panel.DrawText(StringFormat("%s1 vs %s2",ma1,ma2), panel.CellX(2,2,0)+2, panel.CellY(2,2,0)+2);
   panel.DrawText(state_relative, panel.CellX(2,2,1)+2, panel.CellY(2,2,1)+2,clrNONE,190);

//--- Redraw the chart to immediately display all changes on the panel
   ChartRedraw(ChartID());
  }
//+------------------------------------------------------------------+
Nach dem Kompilieren und Starten des Indikators auf dem M1-Chart, wobei M5 für die Berechnungen ausgewählt wurde, sehen wir:
Der Indikator Average True Range:
//+------------------------------------------------------------------+
//|                                     TestMSTFAverageTrueRange.mq5 |
//|                                  Copyright 2023, MetaQuotes Ltd. |
//|                                             https://www.mql5.com |
//+------------------------------------------------------------------+
#property copyright "Copyright 2023, MetaQuotes Ltd."
#property link      "https://www.mql5.com"
#property version   "1.00"
#property indicator_separate_window
#property indicator_buffers 2
#property indicator_plots   2
//--- enums

//--- plot ATR1
#property indicator_label1  "ATR1"
#property indicator_type1   DRAW_LINE
#property indicator_color1  clrDodgerBlue
#property indicator_style1  STYLE_SOLID
#property indicator_width1  1

//--- plot ATR2
#property indicator_label2  "ATR2"
#property indicator_type2   DRAW_LINE
#property indicator_color2  clrRed
#property indicator_style2  STYLE_SOLID
#property indicator_width2  1

//--- includes
#include <IndMSTF\IndMSTF.mqh>
#include <Dashboard\Dashboard.mqh>
//--- input parameters
input string               InpSymbol      =  NULL;             /* Symbol                     */ // Symbol
input ENUM_TIMEFRAMES      InpTimeframe   =  PERIOD_CURRENT;   /* Timeframe                  */ // Timeframe
input int                  InpPeriod      =  14;               /* Period                     */ // Calculation period
input uchar                InpLineWidth1  =  2;                /* Senior period Line Width   */ // Line width for higher period
input uchar                InpLineWidth2  =  1;                /* Junior period Line Width   */ // Line width for lower period
input bool                 InpAsSeries    =  true;             /* As Series flag             */ // Timeseries flag of indicator buffer arrays

//--- indicator buffers
double         BufferATR1[];
double         BufferATR2[];
//--- global variables
int handle_atr1;
int handle_atr2;
CMSTFIndicators indicators;      // An instance of the indicator collection object
//--- variables for the panel
CDashboard *panel=NULL;          // Pointer to the panel object
int         mouse_bar_index;     // Index of the bar the data is taken from
//+------------------------------------------------------------------+
//| Custom indicator initialization function                         |
//+------------------------------------------------------------------+
int OnInit()
  {
//--- Set a timer with an interval of 1 second
   EventSetTimer(1);
//--- Assign the BufferMA1 and BufferMA2 arrays to the plot buffers 0 and 1, respectively
   SetIndexBuffer(0,BufferATR1,INDICATOR_DATA);
   SetIndexBuffer(1,BufferATR2,INDICATOR_DATA);
//--- Set the line width
   int w1=0,w2=0;
   if(InpTimeframe>Period())
     {
      w1=InpLineWidth2;
      w2=InpLineWidth1;
     }
   else
     {
      w1=InpLineWidth1;
      w2=InpLineWidth2;
     }
   PlotIndexSetInteger(0,PLOT_LINE_WIDTH,w1);
   PlotIndexSetInteger(1,PLOT_LINE_WIDTH,w2);
//--- sets indicator shift

//--- Set the timeseries flags for the indicator buffer arrays (for testing, to see that there is no difference)
   ArraySetAsSeries(BufferATR1,InpAsSeries);
   ArraySetAsSeries(BufferATR2,InpAsSeries);

//--- Create two indicators of the same type
//--- The first one is calculated on the current chart symbol/period, the second - on those specified in the settings
   handle_atr1=indicators.AddNewATR(NULL,PERIOD_CURRENT,InpPeriod);
   handle_atr2=indicators.AddNewATR(InpSymbol,InpTimeframe,InpPeriod);

//--- If failed to create indicator handles, return initialization error
   if(handle_atr1==INVALID_HANDLE || handle_atr2==INVALID_HANDLE)
      return INIT_FAILED;
//--- Set descriptions for indicator lines from buffer descriptions of calculation part of created indicators
   indicators.SetPlotLabelFromBuffer(0,handle_atr1,0);
   indicators.SetPlotLabelFromBuffer(1,handle_atr2,0);

//--- Dashboard
//--- Create the panel
   int width=237;
   panel=new CDashboard(1,20,20,width,264,0);
   if(panel==NULL)
     {
      Print("Error. Failed to create panel object");
      return INIT_FAILED;
     }
//--- Set font parameters
   panel.SetFontParams("Calibri",9);
//--- Display the panel with the "Symbol, Timeframe description" header text
   panel.View(Symbol()+", "+StringSubstr(EnumToString(Period()),7));

//--- Create a table with ID 0 to display bar data in it
   panel.CreateNewTable(0);
//--- Draw a table with ID 0 on the panel background
   panel.DrawGrid(0,2,20,6,2,18,width/2-2);

//--- Create a table with ID 1 to display the data of indicator 1
   panel.CreateNewTable(1);
//--- Get the Y2 table coordinate with ID 0 and
//--- set the Y1 coordinate for the table with ID 1
   int y1=panel.TableY2(0)+22;
//--- Draw a table with ID 1 on the panel background
   panel.DrawGrid(1,2,y1,2,2,18,width/2-2);

//--- Create a table with ID 2 to display the data of indicator 2
   panel.CreateNewTable(2);
//--- Get the Y2 coordinate of the table with ID 1 and
//--- set the Y1 coordinate for the table with ID 2
   int y2=panel.TableY2(1)+3;
//--- Draw a table with ID 2 on the background of the dashboard
   panel.DrawGrid(2,2,y2,3,2,18,width/2-2);

//--- Initialize the variable with the index of the mouse cursor bar
   mouse_bar_index=0;
//--- Display the data of the current bar on the panel
   DrawData(mouse_bar_index,TimeCurrent());

//--- Successful initialization
   return(INIT_SUCCEEDED);
  }
//+------------------------------------------------------------------+
//| Custom indicator deinitialization function                       |
//+------------------------------------------------------------------+
void OnDeinit(const int reason)
  {
//--- Delete the timer
   EventKillTimer();
//--- If the panel object exists, delete it
   if(panel!=NULL)
      delete panel;
//--- Delete all comments
   Comment("");
  }
//+------------------------------------------------------------------+
//| Custom indicator iteration function                              |
//+------------------------------------------------------------------+
int OnCalculate(const int rates_total,
                const int prev_calculated,
                const datetime &time[],
                const double &open[],
                const double &high[],
                const double &low[],
                const double &close[],
                const long &tick_volume[],
                const long &volume[],
                const int &spread[])
  {
//--- Number of bars for calculation
   int limit=rates_total-prev_calculated;
//--- If limit > 1, then this is the first calculation or change in the history
   if(limit>1)
     {
      //--- specify all the available history for calculation
      limit=rates_total-1;
      /*
      // If the indicator has any buffers that display other calculations (not multi-indicators),
      // initialize them here with the "empty" value set for these buffers
      */
     }
//--- Calculate all created multi-symbol multi-period indicators
   if(!indicators.Calculate())
      return 0;

//--- Display the bar data under cursor (or current bar if cursor is outside the chart) on the dashboard
   DrawData(mouse_bar_index,time[mouse_bar_index]);

//--- From buffers of calculated indicators, output data to indicator buffers
   if(!indicators.DataToBuffer(NULL,PERIOD_CURRENT,handle_atr1,0,0,limit,BufferATR1))
      return 0;
   if(!indicators.DataToBuffer(NULL,PERIOD_CURRENT,handle_atr2,0,0,limit,BufferATR2))
      return 0;

//--- return value of prev_calculated for the next call
   return(rates_total);
  }
//+------------------------------------------------------------------+
//| Timer function                                                   |
//+------------------------------------------------------------------+
void OnTimer()
  {
//--- Call the indicator collection timer
   indicators.OnTimer();
  }
//+------------------------------------------------------------------+
//| ChartEvent function                                              |
//+------------------------------------------------------------------+
void OnChartEvent(const int id,
                  const long &lparam,
                  const double &dparam,
                  const string &sparam)
  {
//--- Handling the panel
//--- Call the panel event handler
   panel.OnChartEvent(id,lparam,dparam,sparam);

//--- If the cursor moves or a click is made on the chart
   if(id==CHARTEVENT_MOUSE_MOVE || id==CHARTEVENT_CLICK)
     {
      //--- Declare the variables to record time and price coordinates in them
      datetime time=0;
      double price=0;
      int wnd=0;
      //--- If the cursor coordinates are converted to date and time
      if(ChartXYToTimePrice(ChartID(),(int)lparam,(int)dparam,wnd,time,price))
        {
         //--- write the bar index where the cursor is located to a global variable
         mouse_bar_index=iBarShift(Symbol(),PERIOD_CURRENT,time);
         //--- Display the bar data under the cursor on the panel
         DrawData(mouse_bar_index,time);
        }
     }

//--- If we received a custom event, display the appropriate message in the journal
   if(id>CHARTEVENT_CUSTOM)
     {
      //--- Here we can implement handling a click on the close button on the panel
      PrintFormat("%s: Event id=%ld, object id (lparam): %lu, event message (sparam): %s",__FUNCTION__,id,lparam,sparam);
     }
  }
//+------------------------------------------------------------------+
//| Display data from the specified timeseries index to the panel    |
//+------------------------------------------------------------------+
void DrawData(const int index,const datetime time)
  {
//--- Declare the variables to receive data in them
   MqlRates rates[1];

//--- Exit if unable to get the bar data by the specified index
   if(CopyRates(Symbol(),PERIOD_CURRENT,index,1,rates)!=1)
      return;

//--- Set font parameters for bar and indicator data headers
   int  size=0;
   uint flags=0;
   uint angle=0;
   string name=panel.FontParams(size,flags,angle);
   panel.SetFontParams(name,9,FW_BOLD);
   panel.DrawText("Bar data ["+(string)index+"]",3,panel.TableY1(0)-16,clrMaroon,panel.Width()-6);
   panel.DrawText("Indicators data ["+(string)index+"]",3,panel.TableY1(1)-16,clrGreen,panel.Width()-6);
//--- Set font parameters for bar and indicator data
   panel.SetFontParams(name,9);

//--- Display the data of the specified bar in table 0 on the panel
   panel.DrawText("Date",  panel.CellX(0,0,0)+2, panel.CellY(0,0,0)+2); panel.DrawText(TimeToString(  rates[0].time,TIME_DATE),     panel.CellX(0,0,1)+2, panel.CellY(0,0,1)+2,clrNONE,90);
   panel.DrawText("Time",  panel.CellX(0,1,0)+2, panel.CellY(0,1,0)+2); panel.DrawText(TimeToString(  rates[0].time,TIME_MINUTES),  panel.CellX(0,1,1)+2, panel.CellY(0,1,1)+2,clrNONE,90);
   panel.DrawText("Open",  panel.CellX(0,2,0)+2, panel.CellY(0,2,0)+2); panel.DrawText(DoubleToString(rates[0].open,Digits()),      panel.CellX(0,2,1)+2, panel.CellY(0,2,1)+2,clrNONE,90);
   panel.DrawText("High",  panel.CellX(0,3,0)+2, panel.CellY(0,3,0)+2); panel.DrawText(DoubleToString(rates[0].high,Digits()),      panel.CellX(0,3,1)+2, panel.CellY(0,3,1)+2,clrNONE,90);
   panel.DrawText("Low",   panel.CellX(0,4,0)+2, panel.CellY(0,4,0)+2); panel.DrawText(DoubleToString(rates[0].low,Digits()),       panel.CellX(0,4,1)+2, panel.CellY(0,4,1)+2,clrNONE,90);
   panel.DrawText("Close", panel.CellX(0,5,0)+2, panel.CellY(0,5,0)+2); panel.DrawText(DoubleToString(rates[0].close,Digits()),     panel.CellX(0,5,1)+2, panel.CellY(0,5,1)+2,clrNONE,90);

//--- Output the data of indicator 1 from the specified bar into table 1
   panel.DrawText(indicators.Title(handle_atr1), panel.CellX(1,0,0)+2, panel.CellY(1,0,0)+2);
   double value1=indicators.GetData(handle_atr1,0,0,index);
   string value_str1=(value1!=EMPTY_VALUE ? DoubleToString(value1,indicators.Digits(handle_atr1)) : " ");
   panel.DrawText(value_str1,panel.CellX(1,0,1)+2,panel.CellY(1,0,1)+2,clrNONE,110);

//--- Display a description of the indicator 1 line state
   panel.DrawText("Line state", panel.CellX(1,1,0)+2, panel.CellY(1,1,0)+2);
   ENUM_LINE_STATE state1=indicators.BufferLineState(Symbol(),PERIOD_CURRENT,handle_atr1,0,0,index);
   panel.DrawText(BufferLineStateDescription(state1),panel.CellX(1,1,1)+2,panel.CellY(1,1,1)+2,clrNONE,110);

//--- Output the data of indicator 2 from the specified bar into table 2
   panel.DrawText(indicators.Title(handle_atr2), panel.CellX(2,0,0)+2, panel.CellY(2,0,0)+2);
   double value2=indicators.GetDataTo(Symbol(),PERIOD_CURRENT,handle_atr2,0,0,index);
   string value_str2=(value2!=EMPTY_VALUE ? DoubleToString(value2,indicators.Digits(handle_atr2)) : " ");
   panel.DrawText(value_str2,panel.CellX(2,0,1)+2,panel.CellY(2,0,1)+2,clrNONE,110);

//--- Display a description of the indicator 2 line state
   panel.DrawText("Line state", panel.CellX(2,1,0)+2, panel.CellY(2,1,0)+2);
   ENUM_LINE_STATE state2=indicators.BufferLineState(Symbol(),PERIOD_CURRENT,handle_atr2,0,0,index);
   panel.DrawText(BufferLineStateDescription(state2),panel.CellX(2,1,1)+2,panel.CellY(2,1,1)+2,clrNONE,110);

//--- Display description of relationship between indicator 1 line relative to indicator 2 line
   double value21=indicators.GetDataTo(Symbol(),PERIOD_CURRENT,handle_atr2,0,0,index+1);
   ENUM_LINE_STATE stateR=indicators.BufferLineStateRelative(Symbol(),PERIOD_CURRENT,handle_atr1,0,0,index,value2,value21);
   string ma1=indicators.Name(handle_atr1);
   string ma2=indicators.Name(handle_atr2);
   string state_relative=
     (
      stateR==LINE_STATE_ABOVE      ? StringFormat("%s1 > %s2",ma1,ma2)   :
      stateR==LINE_STATE_BELOW      ? StringFormat("%s1 < %s2",ma1,ma2)           :
      stateR==LINE_STATE_CROSS_DOWN ? "Top-down crossing"   :
      stateR==LINE_STATE_CROSS_UP   ? "Bottom-up crossing"  :
      BufferLineStateDescription(stateR)
     );
   panel.DrawText(StringFormat("%s1 vs %s2",ma1,ma2), panel.CellX(2,2,0)+2, panel.CellY(2,2,0)+2);
   panel.DrawText(state_relative, panel.CellX(2,2,1)+2, panel.CellY(2,2,1)+2,clrNONE,110);

//--- Redraw the chart to immediately display all changes on the panel
   ChartRedraw(ChartID());
  }
//+------------------------------------------------------------------+
Nach dem Kompilieren und Starten des Indikators auf dem M1-Chart, wobei M5 für die Berechnungen ausgewählt wurde, sehen wir:
Um die Indikatoren schneller zu zeichnen, können Sie den Zeitrahmen des Charts wechseln.
Der Indikator Awesome Oscillator:
//+------------------------------------------------------------------+
//|                                    TestMSTFAwesomeOscillator.mq5 |
//|                                  Copyright 2023, MetaQuotes Ltd. |
//|                                             https://www.mql5.com |
//+------------------------------------------------------------------+
#property copyright "Copyright 2023, MetaQuotes Ltd."
#property link      "https://www.mql5.com"
#property version   "1.00"
#property indicator_separate_window
#property indicator_buffers 4
#property indicator_plots   2
//--- enums

//--- plot AC1
#property indicator_label1  "AO1"
#property indicator_type1   DRAW_COLOR_HISTOGRAM
#property indicator_color1  clrGreen,clrRed
#property indicator_style1  STYLE_SOLID
#property indicator_width1  1

//--- plot AC2
#property indicator_label2  "AO2"
#property indicator_type2   DRAW_COLOR_HISTOGRAM
#property indicator_color2  clrGreen,clrRed
#property indicator_style2  STYLE_SOLID
#property indicator_width2  1

//--- includes
#include <IndMSTF\IndMSTF.mqh>
#include <Dashboard\Dashboard.mqh>
//--- input parameters
input string               InpSymbol      =  NULL;             /* Symbol                     */ // Symbol
input ENUM_TIMEFRAMES      InpTimeframe   =  PERIOD_CURRENT;   /* Timeframe                  */ // Timeframe
input uchar                InpLineWidth1  =  2;                /* Senior period Line Width   */ // Line width for higher period
input uchar                InpLineWidth2  =  1;                /* Junior period Line Width   */ // Line width for lower period
input bool                 InpAsSeries    =  true;             /* As Series flag             */ // Timeseries flag of indicator buffer arrays

//--- indicator buffers
double         BufferAO1[];
double         BufferClrAO1[];
double         BufferAO2[];
double         BufferClrAO2[];
//--- global variables
int handle_ao1;
int handle_ao2;
CMSTFIndicators indicators;      // An instance of the indicator collection object
//--- variables for the panel
CDashboard *panel=NULL;          // Pointer to the panel object
int         mouse_bar_index;     // Index of the bar the data is taken from
//+------------------------------------------------------------------+
//| Custom indicator initialization function                         |
//+------------------------------------------------------------------+
int OnInit()
  {
//--- Set a timer with an interval of 1 second
   EventSetTimer(1);
//--- Assign arrays BufferAO1 and BufferAO2 to plot buffers 0 and 2, respectively,
//--- and color arrays BufferClrAO1 and BufferClrAO2 to buffers 1 and 3
   SetIndexBuffer(0,BufferAO1,INDICATOR_DATA);
   SetIndexBuffer(1,BufferClrAO1,INDICATOR_COLOR_INDEX);
   SetIndexBuffer(2,BufferAO2,INDICATOR_DATA);
   SetIndexBuffer(3,BufferClrAO2,INDICATOR_COLOR_INDEX);
//--- Set the line width
   int w1=0,w2=0;
   if(InpTimeframe>Period())
     {
      w1=InpLineWidth2;
      w2=InpLineWidth1;
     }
   else
     {
      w1=InpLineWidth1;
      w2=InpLineWidth2;
     }
   PlotIndexSetInteger(0,PLOT_LINE_WIDTH,w1);
   PlotIndexSetInteger(1,PLOT_LINE_WIDTH,w2);
//--- sets indicator shift

//--- Set the timeseries flags for the indicator buffer arrays (for testing, to see that there is no difference)
   ArraySetAsSeries(BufferAO1,InpAsSeries);
   ArraySetAsSeries(BufferClrAO1,InpAsSeries);
   ArraySetAsSeries(BufferAO2,InpAsSeries);
   ArraySetAsSeries(BufferClrAO2,InpAsSeries);

//--- Create two indicators of the same type
//--- The first one is calculated on the current chart symbol/period, the second - on those specified in the settings
   handle_ao1=indicators.AddNewAO(NULL,PERIOD_CURRENT);
   handle_ao2=indicators.AddNewAO(InpSymbol,InpTimeframe);

//--- If failed to create indicator handles, return initialization error
   if(handle_ao1==INVALID_HANDLE || handle_ao2==INVALID_HANDLE)
      return INIT_FAILED;
//--- Set descriptions for indicator lines from buffer descriptions of calculation part of created indicators
   indicators.SetPlotLabelFromBuffer(0,handle_ao1,0);
   indicators.SetPlotLabelFromBuffer(1,handle_ao2,0);

//--- Dashboard
//--- Create the panel
   int width=247;
   panel=new CDashboard(1,20,20,width,264,0);
   if(panel==NULL)
     {
      Print("Error. Failed to create panel object");
      return INIT_FAILED;
     }
//--- Set font parameters
   panel.SetFontParams("Calibri",9);
//--- Display the panel with the "Symbol, Timeframe description" header text
   panel.View(Symbol()+", "+StringSubstr(EnumToString(Period()),7));

//--- Create a table with ID 0 to display bar data in it
   panel.CreateNewTable(0);
//--- Draw a table with ID 0 on the panel background
   panel.DrawGrid(0,2,20,6,2,18,width/2-2);

//--- Create a table with ID 1 to display the data of indicator 1
   panel.CreateNewTable(1);
//--- Get the Y2 table coordinate with ID 0 and
//--- set the Y1 coordinate for the table with ID 1
   int y1=panel.TableY2(0)+22;
//--- Draw a table with ID 1 on the panel background
   panel.DrawGrid(1,2,y1,2,2,18,width/2-2);

//--- Create a table with ID 2 to display the data of indicator 2
   panel.CreateNewTable(2);
//--- Get the Y2 coordinate of the table with ID 1 and
//--- set the Y1 coordinate for the table with ID 2
   int y2=panel.TableY2(1)+3;
//--- Draw a table with ID 2 on the background of the dashboard
   panel.DrawGrid(2,2,y2,3,2,18,width/2-2);

//--- Initialize the variable with the index of the mouse cursor bar
   mouse_bar_index=0;
//--- Display the data of the current bar on the panel
   DrawData(mouse_bar_index,TimeCurrent());

//--- Successful initialization
   return(INIT_SUCCEEDED);
  }
//+------------------------------------------------------------------+
//| Custom indicator deinitialization function                       |
//+------------------------------------------------------------------+
void OnDeinit(const int reason)
  {
//--- Delete the timer
   EventKillTimer();
//--- If the panel object exists, delete it
   if(panel!=NULL)
      delete panel;
//--- Delete all comments
   Comment("");
  }
//+------------------------------------------------------------------+
//| Custom indicator iteration function                              |
//+------------------------------------------------------------------+
int OnCalculate(const int rates_total,
                const int prev_calculated,
                const datetime &time[],
                const double &open[],
                const double &high[],
                const double &low[],
                const double &close[],
                const long &tick_volume[],
                const long &volume[],
                const int &spread[])
  {
//--- Number of bars for calculation
   int limit=rates_total-prev_calculated;
//--- If limit > 1, then this is the first calculation or change in the history
   if(limit>1)
     {
      //--- specify all the available history for calculation
      limit=rates_total-1;
      /*
      // If the indicator has any buffers that display other calculations (not multi-indicators),
      // initialize them here with the "empty" value set for these buffers
      */
     }
//--- Calculate all created multi-symbol multi-period indicators
   if(!indicators.Calculate())
      return 0;

//--- Display the bar data under cursor (or current bar if cursor is outside the chart) on the dashboard
   DrawData(mouse_bar_index,time[mouse_bar_index]);

//--- From buffers of calculated indicators, output data to indicator buffers
   if(!indicators.DataToColorBuffer(NULL,PERIOD_CURRENT,handle_ao1,0,0,limit,BufferAO1,BufferClrAO1))
      return 0;
   if(!indicators.DataToColorBuffer(NULL,PERIOD_CURRENT,handle_ao2,0,0,limit,BufferAO2,BufferClrAO2))
      return 0;

//--- return value of prev_calculated for the next call
   return(rates_total);
  }
//+------------------------------------------------------------------+
//| Timer function                                                   |
//+------------------------------------------------------------------+
void OnTimer()
  {
//--- Call the indicator collection timer
   indicators.OnTimer();
  }
//+------------------------------------------------------------------+
//| ChartEvent function                                              |
//+------------------------------------------------------------------+
void OnChartEvent(const int id,
                  const long &lparam,
                  const double &dparam,
                  const string &sparam)
  {
//--- Handling the panel
//--- Call the panel event handler
   panel.OnChartEvent(id,lparam,dparam,sparam);

//--- If the cursor moves or a click is made on the chart
   if(id==CHARTEVENT_MOUSE_MOVE || id==CHARTEVENT_CLICK)
     {
      //--- Declare the variables to record time and price coordinates in them
      datetime time=0;
      double price=0;
      int wnd=0;
      //--- If the cursor coordinates are converted to date and time
      if(ChartXYToTimePrice(ChartID(),(int)lparam,(int)dparam,wnd,time,price))
        {
         //--- write the bar index where the cursor is located to a global variable
         mouse_bar_index=iBarShift(Symbol(),PERIOD_CURRENT,time);
         //--- Display the bar data under the cursor on the panel
         DrawData(mouse_bar_index,time);
        }
     }

//--- If we received a custom event, display the appropriate message in the journal
   if(id>CHARTEVENT_CUSTOM)
     {
      //--- Here we can implement handling a click on the close button on the panel
      PrintFormat("%s: Event id=%ld, object id (lparam): %lu, event message (sparam): %s",__FUNCTION__,id,lparam,sparam);
     }
  }
//+------------------------------------------------------------------+
//| Display data from the specified timeseries index to the panel    |
//+------------------------------------------------------------------+
void DrawData(const int index,const datetime time)
  {
//--- Declare the variables to receive data in them
   MqlRates rates[1];

//--- Exit if unable to get the bar data by the specified index
   if(CopyRates(Symbol(),PERIOD_CURRENT,index,1,rates)!=1)
      return;

//--- Set font parameters for bar and indicator data headers
   int  size=0;
   uint flags=0;
   uint angle=0;
   string name=panel.FontParams(size,flags,angle);
   panel.SetFontParams(name,9,FW_BOLD);
   panel.DrawText("Bar data ["+(string)index+"]",3,panel.TableY1(0)-16,clrMaroon,panel.Width()-6);
   panel.DrawText("Indicators data ["+(string)index+"]",3,panel.TableY1(1)-16,clrGreen,panel.Width()-6);
//--- Set font parameters for bar and indicator data
   panel.SetFontParams(name,9);

//--- Display the data of the specified bar in table 0 on the panel
   panel.DrawText("Date",  panel.CellX(0,0,0)+2, panel.CellY(0,0,0)+2); panel.DrawText(TimeToString(  rates[0].time,TIME_DATE),     panel.CellX(0,0,1)+2, panel.CellY(0,0,1)+2,clrNONE,90);
   panel.DrawText("Time",  panel.CellX(0,1,0)+2, panel.CellY(0,1,0)+2); panel.DrawText(TimeToString(  rates[0].time,TIME_MINUTES),  panel.CellX(0,1,1)+2, panel.CellY(0,1,1)+2,clrNONE,90);
   panel.DrawText("Open",  panel.CellX(0,2,0)+2, panel.CellY(0,2,0)+2); panel.DrawText(DoubleToString(rates[0].open,Digits()),      panel.CellX(0,2,1)+2, panel.CellY(0,2,1)+2,clrNONE,90);
   panel.DrawText("High",  panel.CellX(0,3,0)+2, panel.CellY(0,3,0)+2); panel.DrawText(DoubleToString(rates[0].high,Digits()),      panel.CellX(0,3,1)+2, panel.CellY(0,3,1)+2,clrNONE,90);
   panel.DrawText("Low",   panel.CellX(0,4,0)+2, panel.CellY(0,4,0)+2); panel.DrawText(DoubleToString(rates[0].low,Digits()),       panel.CellX(0,4,1)+2, panel.CellY(0,4,1)+2,clrNONE,90);
   panel.DrawText("Close", panel.CellX(0,5,0)+2, panel.CellY(0,5,0)+2); panel.DrawText(DoubleToString(rates[0].close,Digits()),     panel.CellX(0,5,1)+2, panel.CellY(0,5,1)+2,clrNONE,90);

//--- Output the data of indicator 1 from the specified bar into table 1
   panel.DrawText(indicators.Title(handle_ao1), panel.CellX(1,0,0)+2, panel.CellY(1,0,0)+2);
   double value1=indicators.GetData(handle_ao1,0,0,index);
   string value_str1=(value1!=EMPTY_VALUE ? DoubleToString(value1,indicators.Digits(handle_ao1)) : " ");
   panel.DrawText(value_str1,panel.CellX(1,0,1)+2,panel.CellY(1,0,1)+2,clrNONE,110);

//--- Display a description of the indicator 1 line state
   panel.DrawText("Line state", panel.CellX(1,1,0)+2, panel.CellY(1,1,0)+2);
   ENUM_LINE_STATE state1=indicators.BufferLineState(Symbol(),PERIOD_CURRENT,handle_ao1,0,0,index);
   panel.DrawText(BufferLineStateDescription(state1),panel.CellX(1,1,1)+2,panel.CellY(1,1,1)+2,clrNONE,110);

//--- Output the data of indicator 2 from the specified bar into table 2
   panel.DrawText(indicators.Title(handle_ao2), panel.CellX(2,0,0)+2, panel.CellY(2,0,0)+2);
   double value2=indicators.GetDataTo(Symbol(),PERIOD_CURRENT,handle_ao2,0,0,index);
   string value_str2=(value2!=EMPTY_VALUE ? DoubleToString(value2,indicators.Digits(handle_ao2)) : " ");
   panel.DrawText(value_str2,panel.CellX(2,0,1)+2,panel.CellY(2,0,1)+2,clrNONE,110);

//--- Display a description of the indicator 2 line state
   panel.DrawText("Line state", panel.CellX(2,1,0)+2, panel.CellY(2,1,0)+2);
   ENUM_LINE_STATE state2=indicators.BufferLineState(Symbol(),PERIOD_CURRENT,handle_ao2,0,0,index);
   panel.DrawText(BufferLineStateDescription(state2),panel.CellX(2,1,1)+2,panel.CellY(2,1,1)+2,clrNONE,110);

//--- Display description of relationship between indicator 1 line relative to indicator 2 line
   double value21=indicators.GetDataTo(Symbol(),PERIOD_CURRENT,handle_ao2,0,0,index+1);
   ENUM_LINE_STATE stateR=indicators.BufferLineStateRelative(Symbol(),PERIOD_CURRENT,handle_ao1,0,0,index,value2,value21);
   string ma1=indicators.Name(handle_ao1);
   string ma2=indicators.Name(handle_ao2);
   string state_relative=
     (
      stateR==LINE_STATE_ABOVE      ? StringFormat("%s1 > %s2",ma1,ma2)   :
      stateR==LINE_STATE_BELOW      ? StringFormat("%s1 < %s2",ma1,ma2)           :
      stateR==LINE_STATE_CROSS_DOWN ? "Top-down crossing"   :
      stateR==LINE_STATE_CROSS_UP   ? "Bottom-up crossing"  :
      BufferLineStateDescription(stateR)
     );
   panel.DrawText(StringFormat("%s1 vs %s2",ma1,ma2), panel.CellX(2,2,0)+2, panel.CellY(2,2,0)+2);
   panel.DrawText(state_relative, panel.CellX(2,2,1)+2, panel.CellY(2,2,1)+2,clrNONE,110);

//--- Redraw the chart to immediately display all changes on the panel
   ChartRedraw(ChartID());
  }
//+------------------------------------------------------------------+
Nach dem Kompilieren und Starten des Indikators auf dem M1-Chart, wobei M5 für die Berechnungen ausgewählt wurde, sehen wir:
Der Indikator Bears Power:
//+------------------------------------------------------------------+
//|                                           TestMSTFBearsPower.mq5 |
//|                                  Copyright 2023, MetaQuotes Ltd. |
//|                                             https://www.mql5.com |
//+------------------------------------------------------------------+
#property copyright "Copyright 2023, MetaQuotes Ltd."
#property link      "https://www.mql5.com"
#property version   "1.00"
#property indicator_separate_window
#property indicator_buffers 2
#property indicator_plots   2
//--- enums

//--- plot Bears1
#property indicator_label1  "Bears1"
#property indicator_type1   DRAW_HISTOGRAM
#property indicator_color1  clrGray
#property indicator_style1  STYLE_SOLID
#property indicator_width1  1

//--- plot Bears2
#property indicator_label2  "Bears2"
#property indicator_type2   DRAW_HISTOGRAM
#property indicator_color2  clrDodgerBlue
#property indicator_style2  STYLE_SOLID
#property indicator_width2  1

//--- includes
#include <IndMSTF\IndMSTF.mqh>
#include <Dashboard\Dashboard.mqh>
//--- input parameters
input string               InpSymbol      =  NULL;             /* Symbol                     */ // Symbol
input ENUM_TIMEFRAMES      InpTimeframe   =  PERIOD_CURRENT;   /* Timeframe                  */ // Timeframe
input int                  InpPeriod      =  13;               /* Period                     */ // Calculation period
input uchar                InpLineWidth1  =  2;                /* Senior period Line Width   */ // Line width for higher period
input uchar                InpLineWidth2  =  1;                /* Junior period Line Width   */ // Line width for lower period
input bool                 InpAsSeries    =  true;             /* As Series flag             */ // Timeseries flag of indicator buffer arrays

//--- indicator buffers
double         BufferBears1[];
double         BufferBears2[];
//--- global variables
int handle_bears1;
int handle_bears2;
CMSTFIndicators indicators;      // An instance of the indicator collection object
//--- variables for the panel
CDashboard *panel=NULL;          // Pointer to the panel object
int         mouse_bar_index;     // Index of the bar the data is taken from
//+------------------------------------------------------------------+
//| Custom indicator initialization function                         |
//+------------------------------------------------------------------+
int OnInit()
  {
//--- Set a timer with an interval of 1 second
   EventSetTimer(1);
//--- Assign the BufferMA1 and BufferMA2 arrays to the plot buffers 0 and 1, respectively
   SetIndexBuffer(0,BufferBears1,INDICATOR_DATA);
   SetIndexBuffer(1,BufferBears2,INDICATOR_DATA);
//--- Set the line width
   int w1=0,w2=0;
   if(InpTimeframe>Period())
     {
      w1=InpLineWidth2;
      w2=InpLineWidth1;
     }
   else
     {
      w1=InpLineWidth1;
      w2=InpLineWidth2;
     }
   PlotIndexSetInteger(0,PLOT_LINE_WIDTH,w1);
   PlotIndexSetInteger(1,PLOT_LINE_WIDTH,w2);
//--- sets indicator shift

//--- Set the timeseries flags for the indicator buffer arrays (for testing, to see that there is no difference)
   ArraySetAsSeries(BufferBears1,InpAsSeries);
   ArraySetAsSeries(BufferBears2,InpAsSeries);

//--- Create two indicators of the same type
//--- The first one is calculated on the current chart symbol/period, the second - on those specified in the settings
   handle_bears1=indicators.AddNewBearsPower(NULL,PERIOD_CURRENT,InpPeriod);
   handle_bears2=indicators.AddNewBearsPower(InpSymbol,InpTimeframe,InpPeriod);

//--- If failed to create indicator handles, return initialization error
   if(handle_bears1==INVALID_HANDLE || handle_bears2==INVALID_HANDLE)
      return INIT_FAILED;
//--- Set descriptions for indicator lines from buffer descriptions of calculation part of created indicators
   indicators.SetPlotLabelFromBuffer(0,handle_bears1,0);
   indicators.SetPlotLabelFromBuffer(1,handle_bears2,0);

//--- Dashboard
//--- Create the panel
   int width=247;
   panel=new CDashboard(1,20,20,width,264,0);
   if(panel==NULL)
     {
      Print("Error. Failed to create panel object");
      return INIT_FAILED;
     }
//--- Set font parameters
   panel.SetFontParams("Calibri",9);
//--- Display the panel with the "Symbol, Timeframe description" header text
   panel.View(Symbol()+", "+StringSubstr(EnumToString(Period()),7));

//--- Create a table with ID 0 to display bar data in it
   panel.CreateNewTable(0);
//--- Draw a table with ID 0 on the panel background
   panel.DrawGrid(0,2,20,6,2,18,width/2-2);

//--- Create a table with ID 1 to display the data of indicator 1
   panel.CreateNewTable(1);
//--- Get the Y2 table coordinate with ID 0 and
//--- set the Y1 coordinate for the table with ID 1
   int y1=panel.TableY2(0)+22;
//--- Draw a table with ID 1 on the panel background
   panel.DrawGrid(1,2,y1,2,2,18,width/2-2);

//--- Create a table with ID 2 to display the data of indicator 2
   panel.CreateNewTable(2);
//--- Get the Y2 coordinate of the table with ID 1 and
//--- set the Y1 coordinate for the table with ID 2
   int y2=panel.TableY2(1)+3;
//--- Draw a table with ID 2 on the background of the dashboard
   panel.DrawGrid(2,2,y2,3,2,18,width/2-2);

//--- Initialize the variable with the index of the mouse cursor bar
   mouse_bar_index=0;
//--- Display the data of the current bar on the panel
   DrawData(mouse_bar_index,TimeCurrent());

//--- Successful initialization
   return(INIT_SUCCEEDED);
  }
//+------------------------------------------------------------------+
//| Custom indicator deinitialization function                       |
//+------------------------------------------------------------------+
void OnDeinit(const int reason)
  {
//--- Delete the timer
   EventKillTimer();
//--- If the panel object exists, delete it
   if(panel!=NULL)
      delete panel;
//--- Delete all comments
   Comment("");
  }
//+------------------------------------------------------------------+
//| Custom indicator iteration function                              |
//+------------------------------------------------------------------+
int OnCalculate(const int rates_total,
                const int prev_calculated,
                const datetime &time[],
                const double &open[],
                const double &high[],
                const double &low[],
                const double &close[],
                const long &tick_volume[],
                const long &volume[],
                const int &spread[])
  {
//--- Number of bars for calculation
   int limit=rates_total-prev_calculated;
//--- If limit > 1, then this is the first calculation or change in the history
   if(limit>1)
     {
      //--- specify all the available history for calculation
      limit=rates_total-1;
      /*
      // If the indicator has any buffers that display other calculations (not multi-indicators),
      // initialize them here with the "empty" value set for these buffers
      */
     }
//--- Calculate all created multi-symbol multi-period indicators
   if(!indicators.Calculate())
      return 0;

//--- Display the bar data under cursor (or current bar if cursor is outside the chart) on the dashboard
   DrawData(mouse_bar_index,time[mouse_bar_index]);

//--- From buffers of calculated indicators, output data to indicator buffers
   if(!indicators.DataToBuffer(NULL,PERIOD_CURRENT,handle_bears1,0,0,limit,BufferBears1))
      return 0;
   if(!indicators.DataToBuffer(NULL,PERIOD_CURRENT,handle_bears2,0,0,limit,BufferBears2))
      return 0;

//--- return value of prev_calculated for the next call
   return(rates_total);
  }
//+------------------------------------------------------------------+
//| Timer function                                                   |
//+------------------------------------------------------------------+
void OnTimer()
  {
//--- Call the indicator collection timer
   indicators.OnTimer();
  }
//+------------------------------------------------------------------+
//| ChartEvent function                                              |
//+------------------------------------------------------------------+
void OnChartEvent(const int id,
                  const long &lparam,
                  const double &dparam,
                  const string &sparam)
  {
//--- Handling the panel
//--- Call the panel event handler
   panel.OnChartEvent(id,lparam,dparam,sparam);

//--- If the cursor moves or a click is made on the chart
   if(id==CHARTEVENT_MOUSE_MOVE || id==CHARTEVENT_CLICK)
     {
      //--- Declare the variables to record time and price coordinates in them
      datetime time=0;
      double price=0;
      int wnd=0;
      //--- If the cursor coordinates are converted to date and time
      if(ChartXYToTimePrice(ChartID(),(int)lparam,(int)dparam,wnd,time,price))
        {
         //--- write the bar index where the cursor is located to a global variable
         mouse_bar_index=iBarShift(Symbol(),PERIOD_CURRENT,time);
         //--- Display the bar data under the cursor on the panel
         DrawData(mouse_bar_index,time);
        }
     }

//--- If we received a custom event, display the appropriate message in the journal
   if(id>CHARTEVENT_CUSTOM)
     {
      //--- Here we can implement handling a click on the close button on the panel
      PrintFormat("%s: Event id=%ld, object id (lparam): %lu, event message (sparam): %s",__FUNCTION__,id,lparam,sparam);
     }
  }
//+------------------------------------------------------------------+
//| Display data from the specified timeseries index to the panel    |
//+------------------------------------------------------------------+
void DrawData(const int index,const datetime time)
  {
//--- Declare the variables to receive data in them
   MqlRates rates[1];

//--- Exit if unable to get the bar data by the specified index
   if(CopyRates(Symbol(),PERIOD_CURRENT,index,1,rates)!=1)
      return;

//--- Set font parameters for bar and indicator data headers
   int  size=0;
   uint flags=0;
   uint angle=0;
   string name=panel.FontParams(size,flags,angle);
   panel.SetFontParams(name,9,FW_BOLD);
   panel.DrawText("Bar data ["+(string)index+"]",3,panel.TableY1(0)-16,clrMaroon,panel.Width()-6);
   panel.DrawText("Indicators data ["+(string)index+"]",3,panel.TableY1(1)-16,clrGreen,panel.Width()-6);
//--- Set font parameters for bar and indicator data
   panel.SetFontParams(name,9);

//--- Display the data of the specified bar in table 0 on the panel
   panel.DrawText("Date",  panel.CellX(0,0,0)+2, panel.CellY(0,0,0)+2); panel.DrawText(TimeToString(  rates[0].time,TIME_DATE),     panel.CellX(0,0,1)+2, panel.CellY(0,0,1)+2,clrNONE,90);
   panel.DrawText("Time",  panel.CellX(0,1,0)+2, panel.CellY(0,1,0)+2); panel.DrawText(TimeToString(  rates[0].time,TIME_MINUTES),  panel.CellX(0,1,1)+2, panel.CellY(0,1,1)+2,clrNONE,90);
   panel.DrawText("Open",  panel.CellX(0,2,0)+2, panel.CellY(0,2,0)+2); panel.DrawText(DoubleToString(rates[0].open,Digits()),      panel.CellX(0,2,1)+2, panel.CellY(0,2,1)+2,clrNONE,90);
   panel.DrawText("High",  panel.CellX(0,3,0)+2, panel.CellY(0,3,0)+2); panel.DrawText(DoubleToString(rates[0].high,Digits()),      panel.CellX(0,3,1)+2, panel.CellY(0,3,1)+2,clrNONE,90);
   panel.DrawText("Low",   panel.CellX(0,4,0)+2, panel.CellY(0,4,0)+2); panel.DrawText(DoubleToString(rates[0].low,Digits()),       panel.CellX(0,4,1)+2, panel.CellY(0,4,1)+2,clrNONE,90);
   panel.DrawText("Close", panel.CellX(0,5,0)+2, panel.CellY(0,5,0)+2); panel.DrawText(DoubleToString(rates[0].close,Digits()),     panel.CellX(0,5,1)+2, panel.CellY(0,5,1)+2,clrNONE,90);

//--- Output the data of indicator 1 from the specified bar into table 1
   panel.DrawText(indicators.Title(handle_bears1), panel.CellX(1,0,0)+2, panel.CellY(1,0,0)+2);
   double value1=indicators.GetData(handle_bears1,0,0,index);
   string value_str1=(value1!=EMPTY_VALUE ? DoubleToString(value1,indicators.Digits(handle_bears1)) : " ");
   panel.DrawText(value_str1,panel.CellX(1,0,1)+2,panel.CellY(1,0,1)+2,clrNONE,110);

//--- Display a description of the indicator 1 line state
   panel.DrawText("Line state", panel.CellX(1,1,0)+2, panel.CellY(1,1,0)+2);
   ENUM_LINE_STATE state1=indicators.BufferLineState(Symbol(),PERIOD_CURRENT,handle_bears1,0,0,index);
   panel.DrawText(BufferLineStateDescription(state1),panel.CellX(1,1,1)+2,panel.CellY(1,1,1)+2,clrNONE,110);

//--- Output the data of indicator 2 from the specified bar into table 2
   panel.DrawText(indicators.Title(handle_bears2), panel.CellX(2,0,0)+2, panel.CellY(2,0,0)+2);
   double value2=indicators.GetDataTo(Symbol(),PERIOD_CURRENT,handle_bears2,0,0,index);
   string value_str2=(value2!=EMPTY_VALUE ? DoubleToString(value2,indicators.Digits(handle_bears2)) : " ");
   panel.DrawText(value_str2,panel.CellX(2,0,1)+2,panel.CellY(2,0,1)+2,clrNONE,110);

//--- Display a description of the indicator 2 line state
   panel.DrawText("Line state", panel.CellX(2,1,0)+2, panel.CellY(2,1,0)+2);
   ENUM_LINE_STATE state2=indicators.BufferLineState(Symbol(),PERIOD_CURRENT,handle_bears2,0,0,index);
   panel.DrawText(BufferLineStateDescription(state2),panel.CellX(2,1,1)+2,panel.CellY(2,1,1)+2,clrNONE,110);

//--- Display description of relationship between indicator 1 line relative to indicator 2 line
   double value21=indicators.GetDataTo(Symbol(),PERIOD_CURRENT,handle_bears2,0,0,index+1);
   ENUM_LINE_STATE stateR=indicators.BufferLineStateRelative(Symbol(),PERIOD_CURRENT,handle_bears1,0,0,index,value2,value21);
   string ma1=indicators.Name(handle_bears1);
   string ma2=indicators.Name(handle_bears2);
   string state_relative=
     (
      stateR==LINE_STATE_ABOVE      ? StringFormat("%s1 > %s2",ma1,ma2)   :
      stateR==LINE_STATE_BELOW      ? StringFormat("%s1 < %s2",ma1,ma2)           :
      stateR==LINE_STATE_CROSS_DOWN ? "Top-down crossing"   :
      stateR==LINE_STATE_CROSS_UP   ? "Bottom-up crossing"  :
      BufferLineStateDescription(stateR)
     );
   panel.DrawText(StringFormat("%s1 vs %s2",ma1,ma2), panel.CellX(2,2,0)+2, panel.CellY(2,2,0)+2);
   panel.DrawText(state_relative, panel.CellX(2,2,1)+2, panel.CellY(2,2,1)+2,clrNONE,110);

//--- Redraw the chart to immediately display all changes on the panel
   ChartRedraw(ChartID());
  }
//+------------------------------------------------------------------+
Nach dem Kompilieren und Starten des Indikators auf dem M1-Chart, wobei M5 für die Berechnungen ausgewählt wurde, sehen wir:
Der Indikator Bollinger Bands:
//+------------------------------------------------------------------+
//|                                   TestMSTFBollingerBands.mq5.mq5 |
//|                                  Copyright 2023, MetaQuotes Ltd. |
//|                                             https://www.mql5.com |
//+------------------------------------------------------------------+
#property copyright "Copyright 2023, MetaQuotes Ltd."
#property link      "https://www.mql5.com"
#property version   "1.00"
#property indicator_chart_window
#property indicator_buffers 6
#property indicator_plots   6
//--- enums

//--- plot BandsUpper1
#property indicator_label1  "BandsUpper1"
#property indicator_type1   DRAW_LINE
#property indicator_color1  clrGreen
#property indicator_width1  1

//--- plot BandsLower1
#property indicator_label2  "BandsLower1"
#property indicator_type2   DRAW_LINE
#property indicator_color2  clrGreen
#property indicator_width2  1

//--- plot BandsMiddle1
#property indicator_label3  "BandsMiddle1"
#property indicator_type3   DRAW_LINE
#property indicator_color3  clrGreen
#property indicator_width3  1

//--- plot BandsUpper2
#property indicator_label4  "BandsUpper2"
#property indicator_type4  DRAW_LINE
#property indicator_color4  clrDodgerBlue
#property indicator_width4  1

//--- plot BandsLower2
#property indicator_label5  "BandsLower2"
#property indicator_type5   DRAW_LINE
#property indicator_color5  clrDodgerBlue
#property indicator_width5  1

//--- plot BandsMiddle2
#property indicator_label6  "BandsMiddle2"
#property indicator_type6   DRAW_LINE
#property indicator_color6  clrDodgerBlue
#property indicator_width6  1

//--- includes
#include <IndMSTF\IndMSTF.mqh>
#include <Dashboard\Dashboard.mqh>
//--- input parameters
input string               InpSymbol      =  NULL;             /* Symbol                     */ // Moving average symbol
input ENUM_TIMEFRAMES      InpTimeframe   =  PERIOD_CURRENT;   /* Timeframe                  */ // Moving average timeframe
input int                  InpPeriod      =  20;               /* Period                     */ // Calculation period
input int                  InpShift       =  0;                /* Shift                      */ // Moving average shift
input double               InpDeviation   =  2.0;              /* Deviation                  */ // Deviation
input ENUM_APPLIED_PRICE   InpPrice       =  PRICE_CLOSE;      /* Applied Price              */ // Price used for calculations
input uchar                InpLineWidth1  =  2;                /* Senior period Line Width   */ // Line width for higher period
input uchar                InpLineWidth2  =  1;                /* Junior period Line Width   */ // Line width for lower period
input bool                 InpAsSeries    =  true;             /* As Series flag             */ // Timeseries flag of indicator buffer arrays

//--- indicator buffers
double         BufferBandsUp1[];
double         BufferBandsDn1[];
double         BufferBandsMd1[];
double         BufferBandsUp2[];
double         BufferBandsDn2[];
double         BufferBandsMd2[];
//--- global variables
int handle_bands1;
int handle_bands2;
CMSTFIndicators indicators;      // An instance of the indicator collection object
//--- variables for the panel
CDashboard *panel=NULL;          // Pointer to the panel object
int         mouse_bar_index;     // Index of the bar the data is taken from
//+------------------------------------------------------------------+
//| Custom indicator initialization function                         |
//+------------------------------------------------------------------+
int OnInit()
  {
//--- Set a timer with an interval of 1 second
   EventSetTimer(1);
//--- Assign arrays BufferBandsUp1, BufferBandsDn1 and BufferBandsMd1 to plot buffers 0, 1 and 2, respectively
   SetIndexBuffer(0,BufferBandsUp1,INDICATOR_DATA);
   SetIndexBuffer(1,BufferBandsDn1,INDICATOR_DATA);
   SetIndexBuffer(2,BufferBandsMd1,INDICATOR_DATA);
//--- Set arrays BufferBandsUp2, BufferBandsDn2 and BufferBandsMd2 to buffers 3, 4 and 5, respectively
   SetIndexBuffer(3,BufferBandsUp2,INDICATOR_DATA);
   SetIndexBuffer(4,BufferBandsDn2,INDICATOR_DATA);
   SetIndexBuffer(5,BufferBandsMd2,INDICATOR_DATA);
//--- Set the line width
   int w1=0,w2=0;
   if(InpTimeframe>Period())
     {
      w1=InpLineWidth2;
      w2=InpLineWidth1;
     }
   else
     {
      w1=InpLineWidth1;
      w2=InpLineWidth2;
     }
   PlotIndexSetInteger(0,PLOT_LINE_WIDTH,w1);
   PlotIndexSetInteger(1,PLOT_LINE_WIDTH,w1);
   PlotIndexSetInteger(2,PLOT_LINE_WIDTH,w1);
   PlotIndexSetInteger(3,PLOT_LINE_WIDTH,w2);
   PlotIndexSetInteger(4,PLOT_LINE_WIDTH,w2);
   PlotIndexSetInteger(5,PLOT_LINE_WIDTH,w2);
//--- Set the timeseries flags for the indicator buffer arrays (for testing, to see that there is no difference)
   ArraySetAsSeries(BufferBandsUp1,InpAsSeries);
   ArraySetAsSeries(BufferBandsDn1,InpAsSeries);
   ArraySetAsSeries(BufferBandsMd1,InpAsSeries);
   ArraySetAsSeries(BufferBandsUp2,InpAsSeries);
   ArraySetAsSeries(BufferBandsDn2,InpAsSeries);
   ArraySetAsSeries(BufferBandsMd2,InpAsSeries);

//--- Create two indicators of the same type
//--- The first one is calculated on the current chart symbol/period, the second - on those specified in the settings
   handle_bands1=indicators.AddNewBands(NULL,PERIOD_CURRENT,InpPeriod,InpShift,InpDeviation,InpPrice);
   handle_bands2=indicators.AddNewBands(InpSymbol,InpTimeframe,InpPeriod,InpShift,InpDeviation,InpPrice);

//--- If failed to create indicator handles, return initialization error
   if(handle_bands1==INVALID_HANDLE || handle_bands2==INVALID_HANDLE)
      return INIT_FAILED;
//--- Set descriptions for indicator lines from buffer descriptions of calculation part of created indicators
   indicators.SetPlotLabelFromBuffer(0,handle_bands1,0);
   indicators.SetPlotLabelFromBuffer(1,handle_bands1,1);
   indicators.SetPlotLabelFromBuffer(2,handle_bands1,2);
   indicators.SetPlotLabelFromBuffer(3,handle_bands2,0);
   indicators.SetPlotLabelFromBuffer(4,handle_bands2,1);
   indicators.SetPlotLabelFromBuffer(5,handle_bands2,2);
//--- Set shifts for indicator lines
   indicators.SetPlotShift(0,InpShift);
   indicators.SetPlotShift(1,InpShift);
   indicators.SetPlotShift(2,InpShift);
   indicators.SetPlotShift(3,InpShift);
   indicators.SetPlotShift(4,InpShift);
   indicators.SetPlotShift(5,InpShift);

//--- Dashboard
//--- Create the panel
   int width=301;
   panel=new CDashboard(1,20,20,width,264);
   if(panel==NULL)
     {
      Print("Error. Failed to create panel object");
      return INIT_FAILED;
     }
//--- Set font parameters
   panel.SetFontParams("Calibri",9);
//--- Display the panel with the "Symbol, Timeframe description" header text
   panel.View(Symbol()+", "+StringSubstr(EnumToString(Period()),7));

//--- Create a table with ID 0 to display bar data in it
   panel.CreateNewTable(0);
//--- Draw a table with ID 0 on the panel background
   panel.DrawGrid(0,2,20,6,2,18,width/2-2);

//--- Create a table with ID 1 to display the data of indicator 1
   panel.CreateNewTable(1);
//--- Get the Y2 table coordinate with ID 0 and
//--- set the Y1 coordinate for the table with ID 1
   int y1=panel.TableY2(0)+22;
//--- Draw a table with ID 1 on the panel background
   panel.DrawGrid(1,2,y1,2,2,18,width/2-2);

//--- Create a table with ID 2 to display the data of indicator 2
   panel.CreateNewTable(2);
//--- Get the Y2 coordinate of the table with ID 1 and
//--- set the Y1 coordinate for the table with ID 2
   int y2=panel.TableY2(1)+3;
//--- Draw a table with ID 2 on the background of the dashboard
   panel.DrawGrid(2,2,y2,3,2,18,width/2-2);

//--- Initialize the variable with the index of the mouse cursor bar
   mouse_bar_index=0;
//--- Display the data of the current bar on the panel
   DrawData(mouse_bar_index,TimeCurrent());

//--- Successful initialization
   return(INIT_SUCCEEDED);
  }
//+------------------------------------------------------------------+
//| Custom indicator deinitialization function                       |
//+------------------------------------------------------------------+
void OnDeinit(const int reason)
  {
//--- Delete the timer
   EventKillTimer();
//--- If the panel object exists, delete it
   if(panel!=NULL)
      delete panel;
//--- Delete all comments
   Comment("");
  }
//+------------------------------------------------------------------+
//| Custom indicator iteration function                              |
//+------------------------------------------------------------------+
int OnCalculate(const int rates_total,
                const int prev_calculated,
                const datetime &time[],
                const double &open[],
                const double &high[],
                const double &low[],
                const double &close[],
                const long &tick_volume[],
                const long &volume[],
                const int &spread[])
  {
//--- Number of bars for calculation
   int limit=rates_total-prev_calculated;
//--- If limit > 1, then this is the first calculation or change in the history
   if(limit>1)
     {
      //--- specify all the available history for calculation
      limit=rates_total-1;
      /*
      // If the indicator has any buffers that display other calculations (not multi-indicators),
      // initialize them here with the "empty" value set for these buffers
      */
     }
//--- Calculate all created multi-symbol multi-period indicators
   if(!indicators.Calculate())
      return 0;

//--- Display the bar data under cursor (or current bar if cursor is outside the chart) on the dashboard
   DrawData(mouse_bar_index,time[mouse_bar_index]);

//--- From buffers of calculated indicators, output data to indicator buffers
   if(!indicators.DataToBuffer(NULL,PERIOD_CURRENT,handle_bands1,0,0,limit,BufferBandsUp1))
      return 0;
   if(!indicators.DataToBuffer(NULL,PERIOD_CURRENT,handle_bands1,1,0,limit,BufferBandsDn1))
      return 0;
   if(!indicators.DataToBuffer(NULL,PERIOD_CURRENT,handle_bands1,2,0,limit,BufferBandsMd1))
      return 0;

   if(!indicators.DataToBuffer(NULL,PERIOD_CURRENT,handle_bands2,0,0,limit,BufferBandsUp2))
      return 0;
   if(!indicators.DataToBuffer(NULL,PERIOD_CURRENT,handle_bands2,1,0,limit,BufferBandsDn2))
      return 0;
   if(!indicators.DataToBuffer(NULL,PERIOD_CURRENT,handle_bands2,2,0,limit,BufferBandsMd2))
      return 0;

//--- return value of prev_calculated for the next call
   return(rates_total);
  }
//+------------------------------------------------------------------+
//| Timer function                                                   |
//+------------------------------------------------------------------+
void OnTimer()
  {
//--- Call the indicator collection timer
   indicators.OnTimer();
  }
//+------------------------------------------------------------------+
//| ChartEvent function                                              |
//+------------------------------------------------------------------+
void OnChartEvent(const int id,
                  const long &lparam,
                  const double &dparam,
                  const string &sparam)
  {
//--- Handling the panel
//--- Call the panel event handler
   panel.OnChartEvent(id,lparam,dparam,sparam);

//--- If the cursor moves or a click is made on the chart
   if(id==CHARTEVENT_MOUSE_MOVE || id==CHARTEVENT_CLICK)
     {
      //--- Declare the variables to record time and price coordinates in them
      datetime time=0;
      double price=0;
      int wnd=0;
      //--- If the cursor coordinates are converted to date and time
      if(ChartXYToTimePrice(ChartID(),(int)lparam,(int)dparam,wnd,time,price))
        {
         //--- write the bar index where the cursor is located to a global variable
         mouse_bar_index=iBarShift(Symbol(),PERIOD_CURRENT,time);
         //--- Display the bar data under the cursor on the panel
         DrawData(mouse_bar_index,time);
        }
     }

//--- If we received a custom event, display the appropriate message in the journal
   if(id>CHARTEVENT_CUSTOM)
     {
      //--- Here we can implement handling a click on the close button on the panel
      PrintFormat("%s: Event id=%ld, object id (lparam): %lu, event message (sparam): %s",__FUNCTION__,id,lparam,sparam);
     }
  }
//+------------------------------------------------------------------+
//| Display data from the specified timeseries index to the panel    |
//+------------------------------------------------------------------+
void DrawData(const int index,const datetime time)
  {
//--- Declare the variables to receive data in them
   MqlRates rates[1];

//--- Exit if unable to get the bar data by the specified index
   if(CopyRates(Symbol(),PERIOD_CURRENT,index,1,rates)!=1)
      return;

//--- Set font parameters for bar and indicator data headers
   int  size=0;
   uint flags=0;
   uint angle=0;
   string name=panel.FontParams(size,flags,angle);
   panel.SetFontParams(name,9,FW_BOLD);
   panel.DrawText("Bar data ["+(string)index+"]",3,panel.TableY1(0)-16,clrMaroon,panel.Width()-6);
   panel.DrawText("Indicators data ["+(string)index+"]",3,panel.TableY1(1)-16,clrGreen,panel.Width()-6);
//--- Set font parameters for bar and indicator data
   panel.SetFontParams(name,9);

//--- Display the data of the specified bar in table 0 on the panel
   panel.DrawText("Date",  panel.CellX(0,0,0)+2, panel.CellY(0,0,0)+2); panel.DrawText(TimeToString(  rates[0].time,TIME_DATE),     panel.CellX(0,0,1)+2, panel.CellY(0,0,1)+2,clrNONE,90);
   panel.DrawText("Time",  panel.CellX(0,1,0)+2, panel.CellY(0,1,0)+2); panel.DrawText(TimeToString(  rates[0].time,TIME_MINUTES),  panel.CellX(0,1,1)+2, panel.CellY(0,1,1)+2,clrNONE,90);
   panel.DrawText("Open",  panel.CellX(0,2,0)+2, panel.CellY(0,2,0)+2); panel.DrawText(DoubleToString(rates[0].open,Digits()),      panel.CellX(0,2,1)+2, panel.CellY(0,2,1)+2,clrNONE,90);
   panel.DrawText("High",  panel.CellX(0,3,0)+2, panel.CellY(0,3,0)+2); panel.DrawText(DoubleToString(rates[0].high,Digits()),      panel.CellX(0,3,1)+2, panel.CellY(0,3,1)+2,clrNONE,90);
   panel.DrawText("Low",   panel.CellX(0,4,0)+2, panel.CellY(0,4,0)+2); panel.DrawText(DoubleToString(rates[0].low,Digits()),       panel.CellX(0,4,1)+2, panel.CellY(0,4,1)+2,clrNONE,90);
   panel.DrawText("Close", panel.CellX(0,5,0)+2, panel.CellY(0,5,0)+2); panel.DrawText(DoubleToString(rates[0].close,Digits()),     panel.CellX(0,5,1)+2, panel.CellY(0,5,1)+2,clrNONE,90);

//--- Output the data of indicator 1 from the specified bar into table 1
   panel.DrawText(indicators.Title(handle_bands1), panel.CellX(1,0,0)+2, panel.CellY(1,0,0)+2);
   double value1=indicators.GetData(handle_bands1,0,0,index);
   string value_str1=(value1!=EMPTY_VALUE ? DoubleToString(value1,indicators.Digits(handle_bands1)) : " ");
   panel.DrawText(value_str1,panel.CellX(1,0,1)+2,panel.CellY(1,0,1)+2,clrNONE,150);

//--- Display a description of the indicator 1 line state
   panel.DrawText("Line state", panel.CellX(1,1,0)+2, panel.CellY(1,1,0)+2);
   ENUM_LINE_STATE state1=indicators.BufferLineState(Symbol(),PERIOD_CURRENT,handle_bands1,0,0,index);
   panel.DrawText(BufferLineStateDescription(state1),panel.CellX(1,1,1)+2,panel.CellY(1,1,1)+2,clrNONE,150);

//--- Output the data of indicator 2 from the specified bar into table 2
   panel.DrawText(indicators.Title(handle_bands2), panel.CellX(2,0,0)+2, panel.CellY(2,0,0)+2);
   double value2=indicators.GetDataTo(Symbol(),PERIOD_CURRENT,handle_bands2,0,0,index);
   string value_str2=(value2!=EMPTY_VALUE ? DoubleToString(value2,indicators.Digits(handle_bands2)) : " ");
   panel.DrawText(value_str2,panel.CellX(2,0,1)+2,panel.CellY(2,0,1)+2,clrNONE,150);

//--- Display a description of the indicator 2 line state
   panel.DrawText("Line state", panel.CellX(2,1,0)+2, panel.CellY(2,1,0)+2);
   ENUM_LINE_STATE state2=indicators.BufferLineState(Symbol(),PERIOD_CURRENT,handle_bands2,0,0,index);
   panel.DrawText(BufferLineStateDescription(state2),panel.CellX(2,1,1)+2,panel.CellY(2,1,1)+2,clrNONE,150);

//--- Display description of relationship between indicator 1 line relative to indicator 2 line
   double value21=indicators.GetDataTo(Symbol(),PERIOD_CURRENT,handle_bands2,0,0,index+1);
   ENUM_LINE_STATE stateR=indicators.BufferLineStateRelative(Symbol(),PERIOD_CURRENT,handle_bands1,0,0,index,value2,value21);
   string ma1=indicators.Name(handle_bands1);
   string ma2=indicators.Name(handle_bands2);
   string state_relative=
     (
      stateR==LINE_STATE_ABOVE      ? StringFormat("%s1 > %s2",ma1,ma2)   :
      stateR==LINE_STATE_BELOW      ? StringFormat("%s1 < %s2",ma1,ma2)           :
      stateR==LINE_STATE_CROSS_DOWN ? "Top-down crossing"   :
      stateR==LINE_STATE_CROSS_UP   ? "Bottom-up crossing"  :
      BufferLineStateDescription(stateR)
     );
   panel.DrawText(StringFormat("%s1 vs %s2",ma1,ma2), panel.CellX(2,2,0)+2, panel.CellY(2,2,0)+2);
   panel.DrawText(state_relative, panel.CellX(2,2,1)+2, panel.CellY(2,2,1)+2,clrNONE,150);

//--- Redraw the chart to immediately display all changes on the panel
   ChartRedraw(ChartID());
  }
//+------------------------------------------------------------------+
Nach dem Kompilieren und Starten des Indikators auf dem M1-Chart, wobei M5 für die Berechnungen ausgewählt wurde, sehen wir:
Der Indikator Bulls Power:
//+------------------------------------------------------------------+
//|                                           TestMSTFBullsPower.mq5 |
//|                                  Copyright 2023, MetaQuotes Ltd. |
//|                                             https://www.mql5.com |
//+------------------------------------------------------------------+
#property copyright "Copyright 2023, MetaQuotes Ltd."
#property link      "https://www.mql5.com"
#property version   "1.00"
#property indicator_separate_window
#property indicator_buffers 2
#property indicator_plots   2
//--- enums

//--- plot Bulls1
#property indicator_label1  "Bulls1"
#property indicator_type1   DRAW_HISTOGRAM
#property indicator_color1  clrGray
#property indicator_style1  STYLE_SOLID
#property indicator_width1  1

//--- plot Bulls2
#property indicator_label2  "Bulls2"
#property indicator_type2   DRAW_HISTOGRAM
#property indicator_color2  clrDodgerBlue
#property indicator_style2  STYLE_SOLID
#property indicator_width2  1

//--- includes
#include <IndMSTF\IndMSTF.mqh>
#include <Dashboard\Dashboard.mqh>
//--- input parameters
input string               InpSymbol      =  NULL;             /* Symbol                     */ // Symbol
input ENUM_TIMEFRAMES      InpTimeframe   =  PERIOD_CURRENT;   /* Timeframe                  */ // Timeframe
input int                  InpPeriod      =  13;               /* Period                     */ // Calculation period
input uchar                InpLineWidth1  =  2;                /* Senior period Line Width   */ // Line width for higher period
input uchar                InpLineWidth2  =  1;                /* Junior period Line Width   */ // Line width for lower period
input bool                 InpAsSeries    =  true;             /* As Series flag             */ // Timeseries flag of indicator buffer arrays

//--- indicator buffers
double         BufferBulls1[];
double         BufferBulls2[];
//--- global variables
int handle_bulls1;
int handle_bulls2;
CMSTFIndicators indicators;      // An instance of the indicator collection object
//--- variables for the panel
CDashboard *panel=NULL;          // Pointer to the panel object
int         mouse_bar_index;     // Index of the bar the data is taken from
//+------------------------------------------------------------------+
//| Custom indicator initialization function                         |
//+------------------------------------------------------------------+
int OnInit()
  {
//--- Set a timer with an interval of 1 second
   EventSetTimer(1);
//--- Assign the BufferMA1 and BufferMA2 arrays to the plot buffers 0 and 1, respectively
   SetIndexBuffer(0,BufferBulls1,INDICATOR_DATA);
   SetIndexBuffer(1,BufferBulls2,INDICATOR_DATA);
//--- Set the line width
   int w1=0,w2=0;
   if(InpTimeframe>Period())
     {
      w1=InpLineWidth2;
      w2=InpLineWidth1;
     }
   else
     {
      w1=InpLineWidth1;
      w2=InpLineWidth2;
     }
   PlotIndexSetInteger(0,PLOT_LINE_WIDTH,w1);
   PlotIndexSetInteger(1,PLOT_LINE_WIDTH,w2);
//--- sets indicator shift

//--- Set the timeseries flags for the indicator buffer arrays (for testing, to see that there is no difference)
   ArraySetAsSeries(BufferBulls1,InpAsSeries);
   ArraySetAsSeries(BufferBulls2,InpAsSeries);

//--- Create two indicators of the same type
//--- The first one is calculated on the current chart symbol/period, the second - on those specified in the settings
   handle_bulls1=indicators.AddNewBullsPower(NULL,PERIOD_CURRENT,InpPeriod);
   handle_bulls2=indicators.AddNewBullsPower(InpSymbol,InpTimeframe,InpPeriod);

//--- If failed to create indicator handles, return initialization error
   if(handle_bulls1==INVALID_HANDLE || handle_bulls2==INVALID_HANDLE)
      return INIT_FAILED;
//--- Set descriptions for indicator lines from buffer descriptions of calculation part of created indicators
   indicators.SetPlotLabelFromBuffer(0,handle_bulls1,0);
   indicators.SetPlotLabelFromBuffer(1,handle_bulls2,0);

//--- Dashboard
//--- Create the panel
   int width=247;
   panel=new CDashboard(1,20,20,width,264,0);
   if(panel==NULL)
     {
      Print("Error. Failed to create panel object");
      return INIT_FAILED;
     }
//--- Set font parameters
   panel.SetFontParams("Calibri",9);
//--- Display the panel with the "Symbol, Timeframe description" header text
   panel.View(Symbol()+", "+StringSubstr(EnumToString(Period()),7));

//--- Create a table with ID 0 to display bar data in it
   panel.CreateNewTable(0);
//--- Draw a table with ID 0 on the panel background
   panel.DrawGrid(0,2,20,6,2,18,width/2-2);

//--- Create a table with ID 1 to display the data of indicator 1
   panel.CreateNewTable(1);
//--- Get the Y2 table coordinate with ID 0 and
//--- set the Y1 coordinate for the table with ID 1
   int y1=panel.TableY2(0)+22;
//--- Draw a table with ID 1 on the panel background
   panel.DrawGrid(1,2,y1,2,2,18,width/2-2);

//--- Create a table with ID 2 to display the data of indicator 2
   panel.CreateNewTable(2);
//--- Get the Y2 coordinate of the table with ID 1 and
//--- set the Y1 coordinate for the table with ID 2
   int y2=panel.TableY2(1)+3;
//--- Draw a table with ID 2 on the background of the dashboard
   panel.DrawGrid(2,2,y2,3,2,18,width/2-2);

//--- Initialize the variable with the index of the mouse cursor bar
   mouse_bar_index=0;
//--- Display the data of the current bar on the panel
   DrawData(mouse_bar_index,TimeCurrent());

//--- Successful initialization
   return(INIT_SUCCEEDED);
  }
//+------------------------------------------------------------------+
//| Custom indicator deinitialization function                       |
//+------------------------------------------------------------------+
void OnDeinit(const int reason)
  {
//--- Delete the timer
   EventKillTimer();
//--- If the panel object exists, delete it
   if(panel!=NULL)
      delete panel;
//--- Delete all comments
   Comment("");
  }
//+------------------------------------------------------------------+
//| Custom indicator iteration function                              |
//+------------------------------------------------------------------+
int OnCalculate(const int rates_total,
                const int prev_calculated,
                const datetime &time[],
                const double &open[],
                const double &high[],
                const double &low[],
                const double &close[],
                const long &tick_volume[],
                const long &volume[],
                const int &spread[])
  {
//--- Number of bars for calculation
   int limit=rates_total-prev_calculated;
//--- If limit > 1, then this is the first calculation or change in the history
   if(limit>1)
     {
      //--- specify all the available history for calculation
      limit=rates_total-1;
      /*
      // If the indicator has any buffers that display other calculations (not multi-indicators),
      // initialize them here with the "empty" value set for these buffers
      */
     }
//--- Calculate all created multi-symbol multi-period indicators
   if(!indicators.Calculate())
      return 0;

//--- Display the bar data under cursor (or current bar if cursor is outside the chart) on the dashboard
   DrawData(mouse_bar_index,time[mouse_bar_index]);

//--- From buffers of calculated indicators, output data to indicator buffers
   if(!indicators.DataToBuffer(NULL,PERIOD_CURRENT,handle_bulls1,0,0,limit,BufferBulls1))
      return 0;
   if(!indicators.DataToBuffer(NULL,PERIOD_CURRENT,handle_bulls2,0,0,limit,BufferBulls2))
      return 0;

//--- return value of prev_calculated for the next call
   return(rates_total);
  }
//+------------------------------------------------------------------+
//| Timer function                                                   |
//+------------------------------------------------------------------+
void OnTimer()
  {
//--- Call the indicator collection timer
   indicators.OnTimer();
  }
//+------------------------------------------------------------------+
//| ChartEvent function                                              |
//+------------------------------------------------------------------+
void OnChartEvent(const int id,
                  const long &lparam,
                  const double &dparam,
                  const string &sparam)
  {
//--- Handling the panel
//--- Call the panel event handler
   panel.OnChartEvent(id,lparam,dparam,sparam);

//--- If the cursor moves or a click is made on the chart
   if(id==CHARTEVENT_MOUSE_MOVE || id==CHARTEVENT_CLICK)
     {
      //--- Declare the variables to record time and price coordinates in them
      datetime time=0;
      double price=0;
      int wnd=0;
      //--- If the cursor coordinates are converted to date and time
      if(ChartXYToTimePrice(ChartID(),(int)lparam,(int)dparam,wnd,time,price))
        {
         //--- write the bar index where the cursor is located to a global variable
         mouse_bar_index=iBarShift(Symbol(),PERIOD_CURRENT,time);
         //--- Display the bar data under the cursor on the panel
         DrawData(mouse_bar_index,time);
        }
     }

//--- If we received a custom event, display the appropriate message in the journal
   if(id>CHARTEVENT_CUSTOM)
     {
      //--- Here we can implement handling a click on the close button on the panel
      PrintFormat("%s: Event id=%ld, object id (lparam): %lu, event message (sparam): %s",__FUNCTION__,id,lparam,sparam);
     }
  }
//+------------------------------------------------------------------+
//| Display data from the specified timeseries index to the panel    |
//+------------------------------------------------------------------+
void DrawData(const int index,const datetime time)
  {
//--- Declare the variables to receive data in them
   MqlRates rates[1];

//--- Exit if unable to get the bar data by the specified index
   if(CopyRates(Symbol(),PERIOD_CURRENT,index,1,rates)!=1)
      return;

//--- Set font parameters for bar and indicator data headers
   int  size=0;
   uint flags=0;
   uint angle=0;
   string name=panel.FontParams(size,flags,angle);
   panel.SetFontParams(name,9,FW_BOLD);
   panel.DrawText("Bar data ["+(string)index+"]",3,panel.TableY1(0)-16,clrMaroon,panel.Width()-6);
   panel.DrawText("Indicators data ["+(string)index+"]",3,panel.TableY1(1)-16,clrGreen,panel.Width()-6);
//--- Set font parameters for bar and indicator data
   panel.SetFontParams(name,9);

//--- Display the data of the specified bar in table 0 on the panel
   panel.DrawText("Date",  panel.CellX(0,0,0)+2, panel.CellY(0,0,0)+2); panel.DrawText(TimeToString(  rates[0].time,TIME_DATE),     panel.CellX(0,0,1)+2, panel.CellY(0,0,1)+2,clrNONE,90);
   panel.DrawText("Time",  panel.CellX(0,1,0)+2, panel.CellY(0,1,0)+2); panel.DrawText(TimeToString(  rates[0].time,TIME_MINUTES),  panel.CellX(0,1,1)+2, panel.CellY(0,1,1)+2,clrNONE,90);
   panel.DrawText("Open",  panel.CellX(0,2,0)+2, panel.CellY(0,2,0)+2); panel.DrawText(DoubleToString(rates[0].open,Digits()),      panel.CellX(0,2,1)+2, panel.CellY(0,2,1)+2,clrNONE,90);
   panel.DrawText("High",  panel.CellX(0,3,0)+2, panel.CellY(0,3,0)+2); panel.DrawText(DoubleToString(rates[0].high,Digits()),      panel.CellX(0,3,1)+2, panel.CellY(0,3,1)+2,clrNONE,90);
   panel.DrawText("Low",   panel.CellX(0,4,0)+2, panel.CellY(0,4,0)+2); panel.DrawText(DoubleToString(rates[0].low,Digits()),       panel.CellX(0,4,1)+2, panel.CellY(0,4,1)+2,clrNONE,90);
   panel.DrawText("Close", panel.CellX(0,5,0)+2, panel.CellY(0,5,0)+2); panel.DrawText(DoubleToString(rates[0].close,Digits()),     panel.CellX(0,5,1)+2, panel.CellY(0,5,1)+2,clrNONE,90);

//--- Output the data of indicator 1 from the specified bar into table 1
   panel.DrawText(indicators.Title(handle_bulls1), panel.CellX(1,0,0)+2, panel.CellY(1,0,0)+2);
   double value1=indicators.GetData(handle_bulls1,0,0,index);
   string value_str1=(value1!=EMPTY_VALUE ? DoubleToString(value1,indicators.Digits(handle_bulls1)) : " ");
   panel.DrawText(value_str1,panel.CellX(1,0,1)+2,panel.CellY(1,0,1)+2,clrNONE,110);

//--- Display a description of the indicator 1 line state
   panel.DrawText("Line state", panel.CellX(1,1,0)+2, panel.CellY(1,1,0)+2);
   ENUM_LINE_STATE state1=indicators.BufferLineState(Symbol(),PERIOD_CURRENT,handle_bulls1,0,0,index);
   panel.DrawText(BufferLineStateDescription(state1),panel.CellX(1,1,1)+2,panel.CellY(1,1,1)+2,clrNONE,110);

//--- Output the data of indicator 2 from the specified bar into table 2
   panel.DrawText(indicators.Title(handle_bulls2), panel.CellX(2,0,0)+2, panel.CellY(2,0,0)+2);
   double value2=indicators.GetDataTo(Symbol(),PERIOD_CURRENT,handle_bulls2,0,0,index);
   string value_str2=(value2!=EMPTY_VALUE ? DoubleToString(value2,indicators.Digits(handle_bulls2)) : " ");
   panel.DrawText(value_str2,panel.CellX(2,0,1)+2,panel.CellY(2,0,1)+2,clrNONE,110);

//--- Display a description of the indicator 2 line state
   panel.DrawText("Line state", panel.CellX(2,1,0)+2, panel.CellY(2,1,0)+2);
   ENUM_LINE_STATE state2=indicators.BufferLineState(Symbol(),PERIOD_CURRENT,handle_bulls2,0,0,index);
   panel.DrawText(BufferLineStateDescription(state2),panel.CellX(2,1,1)+2,panel.CellY(2,1,1)+2,clrNONE,110);

//--- Display description of relationship between indicator 1 line relative to indicator 2 line
   double value21=indicators.GetDataTo(Symbol(),PERIOD_CURRENT,handle_bulls2,0,0,index+1);
   ENUM_LINE_STATE stateR=indicators.BufferLineStateRelative(Symbol(),PERIOD_CURRENT,handle_bulls1,0,0,index,value2,value21);
   string ma1=indicators.Name(handle_bulls1);
   string ma2=indicators.Name(handle_bulls2);
   string state_relative=
     (
      stateR==LINE_STATE_ABOVE      ? StringFormat("%s1 > %s2",ma1,ma2)   :
      stateR==LINE_STATE_BELOW      ? StringFormat("%s1 < %s2",ma1,ma2)           :
      stateR==LINE_STATE_CROSS_DOWN ? "Top-down crossing"   :
      stateR==LINE_STATE_CROSS_UP   ? "Bottom-up crossing"  :
      BufferLineStateDescription(stateR)
     );
   panel.DrawText(StringFormat("%s1 vs %s2",ma1,ma2), panel.CellX(2,2,0)+2, panel.CellY(2,2,0)+2);
   panel.DrawText(state_relative, panel.CellX(2,2,1)+2, panel.CellY(2,2,1)+2,clrNONE,110);

//--- Redraw the chart to immediately display all changes on the panel
   ChartRedraw(ChartID());
  }
//+------------------------------------------------------------------+
Nach dem Kompilieren und Starten des Indikators auf dem M1-Chart, wobei M5 für die Berechnungen ausgewählt wurde, sehen wir:
Auch hier musste ich den Zeitrahmen des Charts wechseln, um die Darstellung der Indikatoren zu gewährleisten.
Der Indikator Chaikin Oscillator:
//+------------------------------------------------------------------+
//|                                    TestMSTFChaikinOscillator.mq5 |
//|                                  Copyright 2023, MetaQuotes Ltd. |
//|                                             https://www.mql5.com |
//+------------------------------------------------------------------+
#property copyright "Copyright 2023, MetaQuotes Ltd."
#property link      "https://www.mql5.com"
#property version   "1.00"
#property indicator_separate_window
#property indicator_buffers 2
#property indicator_plots   2
//--- enums

//--- plot CHO1
#property indicator_label1  "CHO1"
#property indicator_type1   DRAW_LINE
#property indicator_color1  clrSeaGreen
#property indicator_style1  STYLE_SOLID
#property indicator_width1  1

//--- plot CHO2
#property indicator_label2  "CHO2"
#property indicator_type2   DRAW_LINE
#property indicator_color2  clrDodgerBlue
#property indicator_style2  STYLE_SOLID
#property indicator_width2  1

//--- includes
#include <IndMSTF\IndMSTF.mqh>
#include <Dashboard\Dashboard.mqh>
//--- input parameters
input string               InpSymbol      =  NULL;             /* Symbol                     */ // Symbol
input ENUM_TIMEFRAMES      InpTimeframe   =  PERIOD_CURRENT;   /* Timeframe                  */ // Timeframe
input int                  InpFastMAPeriod=  3;                /* Fast MA Period             */ // Fast MA period
input int                  InpSlowMAPeriod=  10;               /* Slow MA Period             */ // Slow MA period
input ENUM_MA_METHOD       InpMethod      =  MODE_EMA;         /* Method                     */ // Calculation method
input ENUM_APPLIED_VOLUME  InpVolume      =  VOLUME_TICK;      /* Applied Volume             */ // Volumes
input uchar                InpLineWidth1  =  2;                /* Senior period Line Width   */ // Line width for higher period
input uchar                InpLineWidth2  =  1;                /* Junior period Line Width   */ // Line width for lower period
input bool                 InpAsSeries    =  true;             /* As Series flag             */ // Timeseries flag of indicator buffer arrays

//--- indicator buffers
double         BufferCHO1[];
double         BufferCHO2[];
//--- global variables
int handle_cho1;
int handle_cho2;
CMSTFIndicators indicators;      // An instance of the indicator collection object
//--- variables for the panel
CDashboard *panel=NULL;          // Pointer to the panel object
int         mouse_bar_index;     // Index of the bar the data is taken from
//+------------------------------------------------------------------+
//| Custom indicator initialization function                         |
//+------------------------------------------------------------------+
int OnInit()
  {
//--- Set a timer with an interval of 1 second
   EventSetTimer(1);
//--- Assign the BufferMA1 and BufferMA2 arrays to the plot buffers 0 and 1, respectively
   SetIndexBuffer(0,BufferCHO1,INDICATOR_DATA);
   SetIndexBuffer(1,BufferCHO2,INDICATOR_DATA);
//--- Set the line width
   int w1=0,w2=0;
   if(InpTimeframe>Period())
     {
      w1=InpLineWidth2;
      w2=InpLineWidth1;
     }
   else
     {
      w1=InpLineWidth1;
      w2=InpLineWidth2;
     }
   PlotIndexSetInteger(0,PLOT_LINE_WIDTH,w1);
   PlotIndexSetInteger(1,PLOT_LINE_WIDTH,w2);
//--- sets indicator shift

//--- Set the timeseries flags for the indicator buffer arrays (for testing, to see that there is no difference)
   ArraySetAsSeries(BufferCHO1,InpAsSeries);
   ArraySetAsSeries(BufferCHO2,InpAsSeries);

//--- Create two indicators of the same type
//--- The first one is calculated on the current chart symbol/period, the second - on those specified in the settings
   handle_cho1=indicators.AddNewChaikin(NULL,PERIOD_CURRENT,InpFastMAPeriod,InpSlowMAPeriod,InpMethod,InpVolume);
   handle_cho2=indicators.AddNewChaikin(InpSymbol,InpTimeframe,InpFastMAPeriod,InpSlowMAPeriod,InpMethod,InpVolume);

//--- If failed to create indicator handles, return initialization error
   if(handle_cho1==INVALID_HANDLE || handle_cho2==INVALID_HANDLE)
      return INIT_FAILED;
//--- Set descriptions for indicator lines from buffer descriptions of calculation part of created indicators
   indicators.SetPlotLabelFromBuffer(0,handle_cho1,0);
   indicators.SetPlotLabelFromBuffer(1,handle_cho2,0);

//--- Dashboard
//--- Create the panel
   int width=247;
   panel=new CDashboard(1,20,20,width,264,0);
   if(panel==NULL)
     {
      Print("Error. Failed to create panel object");
      return INIT_FAILED;
     }
//--- Set font parameters
   panel.SetFontParams("Calibri",9);
//--- Display the panel with the "Symbol, Timeframe description" header text
   panel.View(Symbol()+", "+StringSubstr(EnumToString(Period()),7));

//--- Create a table with ID 0 to display bar data in it
   panel.CreateNewTable(0);
//--- Draw a table with ID 0 on the panel background
   panel.DrawGrid(0,2,20,6,2,18,width/2-2);

//--- Create a table with ID 1 to display the data of indicator 1
   panel.CreateNewTable(1);
//--- Get the Y2 table coordinate with ID 0 and
//--- set the Y1 coordinate for the table with ID 1
   int y1=panel.TableY2(0)+22;
//--- Draw a table with ID 1 on the panel background
   panel.DrawGrid(1,2,y1,2,2,18,width/2-2);

//--- Create a table with ID 2 to display the data of indicator 2
   panel.CreateNewTable(2);
//--- Get the Y2 coordinate of the table with ID 1 and
//--- set the Y1 coordinate for the table with ID 2
   int y2=panel.TableY2(1)+3;
//--- Draw a table with ID 2 on the background of the dashboard
   panel.DrawGrid(2,2,y2,3,2,18,width/2-2);

//--- Initialize the variable with the index of the mouse cursor bar
   mouse_bar_index=0;
//--- Display the data of the current bar on the panel
   DrawData(mouse_bar_index,TimeCurrent());

//--- Successful initialization
   return(INIT_SUCCEEDED);
  }
//+------------------------------------------------------------------+
//| Custom indicator deinitialization function                       |
//+------------------------------------------------------------------+
void OnDeinit(const int reason)
  {
//--- Delete the timer
   EventKillTimer();
//--- If the panel object exists, delete it
   if(panel!=NULL)
      delete panel;
//--- Delete all comments
   Comment("");
  }
//+------------------------------------------------------------------+
//| Custom indicator iteration function                              |
//+------------------------------------------------------------------+
int OnCalculate(const int rates_total,
                const int prev_calculated,
                const datetime &time[],
                const double &open[],
                const double &high[],
                const double &low[],
                const double &close[],
                const long &tick_volume[],
                const long &volume[],
                const int &spread[])
  {
//--- Number of bars for calculation
   int limit=rates_total-prev_calculated;
//--- If limit > 1, then this is the first calculation or change in the history
   if(limit>1)
     {
      //--- specify all the available history for calculation
      limit=rates_total-1;
      /*
      // If the indicator has any buffers that display other calculations (not multi-indicators),
      // initialize them here with the "empty" value set for these buffers
      */
     }
//--- Calculate all created multi-symbol multi-period indicators
   if(!indicators.Calculate())
      return 0;

//--- Display the bar data under cursor (or current bar if cursor is outside the chart) on the dashboard
   DrawData(mouse_bar_index,time[mouse_bar_index]);

//--- From buffers of calculated indicators, output data to indicator buffers
   if(!indicators.DataToBuffer(NULL,PERIOD_CURRENT,handle_cho1,0,0,limit,BufferCHO1))
      return 0;
   if(!indicators.DataToBuffer(NULL,PERIOD_CURRENT,handle_cho2,0,0,limit,BufferCHO2))
      return 0;

//--- return value of prev_calculated for the next call
   return(rates_total);
  }
//+------------------------------------------------------------------+
//| Timer function                                                   |
//+------------------------------------------------------------------+
void OnTimer()
  {
//--- Call the indicator collection timer
   indicators.OnTimer();
  }
//+------------------------------------------------------------------+
//| ChartEvent function                                              |
//+------------------------------------------------------------------+
void OnChartEvent(const int id,
                  const long &lparam,
                  const double &dparam,
                  const string &sparam)
  {
//--- Handling the panel
//--- Call the panel event handler
   panel.OnChartEvent(id,lparam,dparam,sparam);

//--- If the cursor moves or a click is made on the chart
   if(id==CHARTEVENT_MOUSE_MOVE || id==CHARTEVENT_CLICK)
     {
      //--- Declare the variables to record time and price coordinates in them
      datetime time=0;
      double price=0;
      int wnd=0;
      //--- If the cursor coordinates are converted to date and time
      if(ChartXYToTimePrice(ChartID(),(int)lparam,(int)dparam,wnd,time,price))
        {
         //--- write the bar index where the cursor is located to a global variable
         mouse_bar_index=iBarShift(Symbol(),PERIOD_CURRENT,time);
         //--- Display the bar data under the cursor on the panel
         DrawData(mouse_bar_index,time);
        }
     }

//--- If we received a custom event, display the appropriate message in the journal
   if(id>CHARTEVENT_CUSTOM)
     {
      //--- Here we can implement handling a click on the close button on the panel
      PrintFormat("%s: Event id=%ld, object id (lparam): %lu, event message (sparam): %s",__FUNCTION__,id,lparam,sparam);
     }
  }
//+------------------------------------------------------------------+
//| Display data from the specified timeseries index to the panel    |
//+------------------------------------------------------------------+
void DrawData(const int index,const datetime time)
  {
//--- Declare the variables to receive data in them
   MqlRates rates[1];

//--- Exit if unable to get the bar data by the specified index
   if(CopyRates(Symbol(),PERIOD_CURRENT,index,1,rates)!=1)
      return;

//--- Set font parameters for bar and indicator data headers
   int  size=0;
   uint flags=0;
   uint angle=0;
   string name=panel.FontParams(size,flags,angle);
   panel.SetFontParams(name,9,FW_BOLD);
   panel.DrawText("Bar data ["+(string)index+"]",3,panel.TableY1(0)-16,clrMaroon,panel.Width()-6);
   panel.DrawText("Indicators data ["+(string)index+"]",3,panel.TableY1(1)-16,clrGreen,panel.Width()-6);
//--- Set font parameters for bar and indicator data
   panel.SetFontParams(name,9);

//--- Display the data of the specified bar in table 0 on the panel
   panel.DrawText("Date",  panel.CellX(0,0,0)+2, panel.CellY(0,0,0)+2); panel.DrawText(TimeToString(  rates[0].time,TIME_DATE),     panel.CellX(0,0,1)+2, panel.CellY(0,0,1)+2,clrNONE,90);
   panel.DrawText("Time",  panel.CellX(0,1,0)+2, panel.CellY(0,1,0)+2); panel.DrawText(TimeToString(  rates[0].time,TIME_MINUTES),  panel.CellX(0,1,1)+2, panel.CellY(0,1,1)+2,clrNONE,90);
   panel.DrawText("Open",  panel.CellX(0,2,0)+2, panel.CellY(0,2,0)+2); panel.DrawText(DoubleToString(rates[0].open,Digits()),      panel.CellX(0,2,1)+2, panel.CellY(0,2,1)+2,clrNONE,90);
   panel.DrawText("High",  panel.CellX(0,3,0)+2, panel.CellY(0,3,0)+2); panel.DrawText(DoubleToString(rates[0].high,Digits()),      panel.CellX(0,3,1)+2, panel.CellY(0,3,1)+2,clrNONE,90);
   panel.DrawText("Low",   panel.CellX(0,4,0)+2, panel.CellY(0,4,0)+2); panel.DrawText(DoubleToString(rates[0].low,Digits()),       panel.CellX(0,4,1)+2, panel.CellY(0,4,1)+2,clrNONE,90);
   panel.DrawText("Close", panel.CellX(0,5,0)+2, panel.CellY(0,5,0)+2); panel.DrawText(DoubleToString(rates[0].close,Digits()),     panel.CellX(0,5,1)+2, panel.CellY(0,5,1)+2,clrNONE,90);

//--- Output the data of indicator 1 from the specified bar into table 1
   panel.DrawText(indicators.Title(handle_cho1), panel.CellX(1,0,0)+2, panel.CellY(1,0,0)+2);
   double value1=indicators.GetData(handle_cho1,0,0,index);
   string value_str1=(value1!=EMPTY_VALUE ? DoubleToString(value1,indicators.Digits(handle_cho1)) : " ");
   panel.DrawText(value_str1,panel.CellX(1,0,1)+2,panel.CellY(1,0,1)+2,clrNONE,110);

//--- Display a description of the indicator 1 line state
   panel.DrawText("Line state", panel.CellX(1,1,0)+2, panel.CellY(1,1,0)+2);
   ENUM_LINE_STATE state1=indicators.BufferLineState(Symbol(),PERIOD_CURRENT,handle_cho1,0,0,index);
   panel.DrawText(BufferLineStateDescription(state1),panel.CellX(1,1,1)+2,panel.CellY(1,1,1)+2,clrNONE,110);

//--- Output the data of indicator 2 from the specified bar into table 2
   panel.DrawText(indicators.Title(handle_cho2), panel.CellX(2,0,0)+2, panel.CellY(2,0,0)+2);
   double value2=indicators.GetDataTo(Symbol(),PERIOD_CURRENT,handle_cho2,0,0,index);
   string value_str2=(value2!=EMPTY_VALUE ? DoubleToString(value2,indicators.Digits(handle_cho2)) : " ");
   panel.DrawText(value_str2,panel.CellX(2,0,1)+2,panel.CellY(2,0,1)+2,clrNONE,110);

//--- Display a description of the indicator 2 line state
   panel.DrawText("Line state", panel.CellX(2,1,0)+2, panel.CellY(2,1,0)+2);
   ENUM_LINE_STATE state2=indicators.BufferLineState(Symbol(),PERIOD_CURRENT,handle_cho2,0,0,index);
   panel.DrawText(BufferLineStateDescription(state2),panel.CellX(2,1,1)+2,panel.CellY(2,1,1)+2,clrNONE,110);

//--- Display description of relationship between indicator 1 line relative to indicator 2 line
   double value21=indicators.GetDataTo(Symbol(),PERIOD_CURRENT,handle_cho2,0,0,index+1);
   ENUM_LINE_STATE stateR=indicators.BufferLineStateRelative(Symbol(),PERIOD_CURRENT,handle_cho1,0,0,index,value2,value21);
   string ma1=indicators.Name(handle_cho1);
   string ma2=indicators.Name(handle_cho2);
   string state_relative=
     (
      stateR==LINE_STATE_ABOVE      ? StringFormat("%s1 > %s2",ma1,ma2)   :
      stateR==LINE_STATE_BELOW      ? StringFormat("%s1 < %s2",ma1,ma2)           :
      stateR==LINE_STATE_CROSS_DOWN ? "Top-down crossing"   :
      stateR==LINE_STATE_CROSS_UP   ? "Bottom-up crossing"  :
      BufferLineStateDescription(stateR)
     );
   panel.DrawText(StringFormat("%s1 vs %s2",ma1,ma2), panel.CellX(2,2,0)+2, panel.CellY(2,2,0)+2);
   panel.DrawText(state_relative, panel.CellX(2,2,1)+2, panel.CellY(2,2,1)+2,clrNONE,110);

//--- Redraw the chart to immediately display all changes on the panel
   ChartRedraw(ChartID());
  }
//+------------------------------------------------------------------+
Nach dem Kompilieren und Starten des Indikators auf dem M1-Chart, wobei M5 für die Berechnungen ausgewählt wurde, sehen wir:
Der Indikator Commodity Channel Index:
//+------------------------------------------------------------------+
//|                                TestMSTFCommodityChannelIndex.mq5 |
//|                                  Copyright 2023, MetaQuotes Ltd. |
//|                                             https://www.mql5.com |
//+------------------------------------------------------------------+
#property copyright "Copyright 2023, MetaQuotes Ltd."
#property link      "https://www.mql5.com"
#property version   "1.00"
#property indicator_separate_window
#property indicator_buffers 2
#property indicator_plots   2
//--- enums

//--- plot CCI1
#property indicator_label1  "CCI1"
#property indicator_type1   DRAW_LINE
#property indicator_color1  clrSeaGreen
#property indicator_style1  STYLE_SOLID
#property indicator_width1  1

//--- plot CCI2
#property indicator_label2  "CCI2"
#property indicator_type2   DRAW_LINE
#property indicator_color2  clrDodgerBlue
#property indicator_style2  STYLE_SOLID
#property indicator_width2  1

//--- includes
#include <IndMSTF\IndMSTF.mqh>
#include <Dashboard\Dashboard.mqh>
//--- input parameters
input string               InpSymbol      =  NULL;             /* Symbol                     */ // Symbol
input ENUM_TIMEFRAMES      InpTimeframe   =  PERIOD_CURRENT;   /* Timeframe                  */ // Timeframe
input int                  InpPeriod      =  14;               /* Period                     */ // Calculation period
input ENUM_APPLIED_PRICE   InpPrice       =  PRICE_TYPICAL;    /* Applied Price              */ // Calculation price
input uchar                InpLineWidth1  =  2;                /* Senior period Line Width   */ // Line width for higher period
input uchar                InpLineWidth2  =  1;                /* Junior period Line Width   */ // Line width for lower period
input bool                 InpAsSeries    =  true;             /* As Series flag             */ // Timeseries flag of indicator buffer arrays

//--- indicator buffers
double         BufferCCI1[];
double         BufferCCI2[];
//--- global variables
int handle_cci1;
int handle_cci2;
CMSTFIndicators indicators;      // An instance of the indicator collection object
//--- variables for the panel
CDashboard *panel=NULL;          // Pointer to the panel object
int         mouse_bar_index;     // Index of the bar the data is taken from
//+------------------------------------------------------------------+
//| Custom indicator initialization function                         |
//+------------------------------------------------------------------+
int OnInit()
  {
//--- Set a timer with an interval of 1 second
   EventSetTimer(1);
//--- Assign the BufferMA1 and BufferMA2 arrays to the plot buffers 0 and 1, respectively
   SetIndexBuffer(0,BufferCCI1,INDICATOR_DATA);
   SetIndexBuffer(1,BufferCCI2,INDICATOR_DATA);
//--- Set the line width
   int w1=0,w2=0;
   if(InpTimeframe>Period())
     {
      w1=InpLineWidth2;
      w2=InpLineWidth1;
     }
   else
     {
      w1=InpLineWidth1;
      w2=InpLineWidth2;
     }
   PlotIndexSetInteger(0,PLOT_LINE_WIDTH,w1);
   PlotIndexSetInteger(1,PLOT_LINE_WIDTH,w2);
//--- sets indicator shift

//--- Set the timeseries flags for the indicator buffer arrays (for testing, to see that there is no difference)
   ArraySetAsSeries(BufferCCI1,InpAsSeries);
   ArraySetAsSeries(BufferCCI2,InpAsSeries);

//--- Create two indicators of the same type
//--- The first one is calculated on the current chart symbol/period, the second - on those specified in the settings
   handle_cci1=indicators.AddNewCCI(NULL,PERIOD_CURRENT,InpPeriod,InpPrice);
   handle_cci2=indicators.AddNewCCI(InpSymbol,InpTimeframe,InpPeriod,InpPrice);

//--- If failed to create indicator handles, return initialization error
   if(handle_cci1==INVALID_HANDLE || handle_cci2==INVALID_HANDLE)
      return INIT_FAILED;
//--- Set descriptions for indicator lines from buffer descriptions of calculation part of created indicators
   indicators.SetPlotLabelFromBuffer(0,handle_cci1,0);
   indicators.SetPlotLabelFromBuffer(1,handle_cci2,0);

//--- Dashboard
//--- Create the panel
   int width=247;
   panel=new CDashboard(1,20,20,width,264,0);
   if(panel==NULL)
     {
      Print("Error. Failed to create panel object");
      return INIT_FAILED;
     }
//--- Set font parameters
   panel.SetFontParams("Calibri",9);
//--- Display the panel with the "Symbol, Timeframe description" header text
   panel.View(Symbol()+", "+StringSubstr(EnumToString(Period()),7));

//--- Create a table with ID 0 to display bar data in it
   panel.CreateNewTable(0);
//--- Draw a table with ID 0 on the panel background
   panel.DrawGrid(0,2,20,6,2,18,width/2-2);

//--- Create a table with ID 1 to display the data of indicator 1
   panel.CreateNewTable(1);
//--- Get the Y2 table coordinate with ID 0 and
//--- set the Y1 coordinate for the table with ID 1
   int y1=panel.TableY2(0)+22;
//--- Draw a table with ID 1 on the panel background
   panel.DrawGrid(1,2,y1,2,2,18,width/2-2);

//--- Create a table with ID 2 to display the data of indicator 2
   panel.CreateNewTable(2);
//--- Get the Y2 coordinate of the table with ID 1 and
//--- set the Y1 coordinate for the table with ID 2
   int y2=panel.TableY2(1)+3;
//--- Draw a table with ID 2 on the background of the dashboard
   panel.DrawGrid(2,2,y2,3,2,18,width/2-2);

//--- Initialize the variable with the index of the mouse cursor bar
   mouse_bar_index=0;
//--- Display the data of the current bar on the panel
   DrawData(mouse_bar_index,TimeCurrent());

//--- Successful initialization
   return(INIT_SUCCEEDED);
  }
//+------------------------------------------------------------------+
//| Custom indicator deinitialization function                       |
//+------------------------------------------------------------------+
void OnDeinit(const int reason)
  {
//--- Delete the timer
   EventKillTimer();
//--- If the panel object exists, delete it
   if(panel!=NULL)
      delete panel;
//--- Delete all comments
   Comment("");
  }
//+------------------------------------------------------------------+
//| Custom indicator iteration function                              |
//+------------------------------------------------------------------+
int OnCalculate(const int rates_total,
                const int prev_calculated,
                const datetime &time[],
                const double &open[],
                const double &high[],
                const double &low[],
                const double &close[],
                const long &tick_volume[],
                const long &volume[],
                const int &spread[])
  {
//--- Number of bars for calculation
   int limit=rates_total-prev_calculated;
//--- If limit > 1, then this is the first calculation or change in the history
   if(limit>1)
     {
      //--- specify all the available history for calculation
      limit=rates_total-1;
      /*
      // If the indicator has any buffers that display other calculations (not multi-indicators),
      // initialize them here with the "empty" value set for these buffers
      */
     }
//--- Calculate all created multi-symbol multi-period indicators
   if(!indicators.Calculate())
      return 0;

//--- Display the bar data under cursor (or current bar if cursor is outside the chart) on the dashboard
   DrawData(mouse_bar_index,time[mouse_bar_index]);

//--- From buffers of calculated indicators, output data to indicator buffers
   if(!indicators.DataToBuffer(NULL,PERIOD_CURRENT,handle_cci1,0,0,limit,BufferCCI1))
      return 0;
   if(!indicators.DataToBuffer(NULL,PERIOD_CURRENT,handle_cci2,0,0,limit,BufferCCI2))
      return 0;

//--- return value of prev_calculated for the next call
   return(rates_total);
  }
//+------------------------------------------------------------------+
//| Timer function                                                   |
//+------------------------------------------------------------------+
void OnTimer()
  {
//--- Call the indicator collection timer
   indicators.OnTimer();
  }
//+------------------------------------------------------------------+
//| ChartEvent function                                              |
//+------------------------------------------------------------------+
void OnChartEvent(const int id,
                  const long &lparam,
                  const double &dparam,
                  const string &sparam)
  {
//--- Handling the panel
//--- Call the panel event handler
   panel.OnChartEvent(id,lparam,dparam,sparam);

//--- If the cursor moves or a click is made on the chart
   if(id==CHARTEVENT_MOUSE_MOVE || id==CHARTEVENT_CLICK)
     {
      //--- Declare the variables to record time and price coordinates in them
      datetime time=0;
      double price=0;
      int wnd=0;
      //--- If the cursor coordinates are converted to date and time
      if(ChartXYToTimePrice(ChartID(),(int)lparam,(int)dparam,wnd,time,price))
        {
         //--- write the bar index where the cursor is located to a global variable
         mouse_bar_index=iBarShift(Symbol(),PERIOD_CURRENT,time);
         //--- Display the bar data under the cursor on the panel
         DrawData(mouse_bar_index,time);
        }
     }

//--- If we received a custom event, display the appropriate message in the journal
   if(id>CHARTEVENT_CUSTOM)
     {
      //--- Here we can implement handling a click on the close button on the panel
      PrintFormat("%s: Event id=%ld, object id (lparam): %lu, event message (sparam): %s",__FUNCTION__,id,lparam,sparam);
     }
  }
//+------------------------------------------------------------------+
//| Display data from the specified timeseries index to the panel    |
//+------------------------------------------------------------------+
void DrawData(const int index,const datetime time)
  {
//--- Declare the variables to receive data in them
   MqlRates rates[1];

//--- Exit if unable to get the bar data by the specified index
   if(CopyRates(Symbol(),PERIOD_CURRENT,index,1,rates)!=1)
      return;

//--- Set font parameters for bar and indicator data headers
   int  size=0;
   uint flags=0;
   uint angle=0;
   string name=panel.FontParams(size,flags,angle);
   panel.SetFontParams(name,9,FW_BOLD);
   panel.DrawText("Bar data ["+(string)index+"]",3,panel.TableY1(0)-16,clrMaroon,panel.Width()-6);
   panel.DrawText("Indicators data ["+(string)index+"]",3,panel.TableY1(1)-16,clrGreen,panel.Width()-6);
//--- Set font parameters for bar and indicator data
   panel.SetFontParams(name,9);

//--- Display the data of the specified bar in table 0 on the panel
   panel.DrawText("Date",  panel.CellX(0,0,0)+2, panel.CellY(0,0,0)+2); panel.DrawText(TimeToString(  rates[0].time,TIME_DATE),     panel.CellX(0,0,1)+2, panel.CellY(0,0,1)+2,clrNONE,90);
   panel.DrawText("Time",  panel.CellX(0,1,0)+2, panel.CellY(0,1,0)+2); panel.DrawText(TimeToString(  rates[0].time,TIME_MINUTES),  panel.CellX(0,1,1)+2, panel.CellY(0,1,1)+2,clrNONE,90);
   panel.DrawText("Open",  panel.CellX(0,2,0)+2, panel.CellY(0,2,0)+2); panel.DrawText(DoubleToString(rates[0].open,Digits()),      panel.CellX(0,2,1)+2, panel.CellY(0,2,1)+2,clrNONE,90);
   panel.DrawText("High",  panel.CellX(0,3,0)+2, panel.CellY(0,3,0)+2); panel.DrawText(DoubleToString(rates[0].high,Digits()),      panel.CellX(0,3,1)+2, panel.CellY(0,3,1)+2,clrNONE,90);
   panel.DrawText("Low",   panel.CellX(0,4,0)+2, panel.CellY(0,4,0)+2); panel.DrawText(DoubleToString(rates[0].low,Digits()),       panel.CellX(0,4,1)+2, panel.CellY(0,4,1)+2,clrNONE,90);
   panel.DrawText("Close", panel.CellX(0,5,0)+2, panel.CellY(0,5,0)+2); panel.DrawText(DoubleToString(rates[0].close,Digits()),     panel.CellX(0,5,1)+2, panel.CellY(0,5,1)+2,clrNONE,90);

//--- Output the data of indicator 1 from the specified bar into table 1
   panel.DrawText(indicators.Title(handle_cci1), panel.CellX(1,0,0)+2, panel.CellY(1,0,0)+2);
   double value1=indicators.GetData(handle_cci1,0,0,index);
   string value_str1=(value1!=EMPTY_VALUE ? DoubleToString(value1,indicators.Digits(handle_cci1)) : " ");
   panel.DrawText(value_str1,panel.CellX(1,0,1)+2,panel.CellY(1,0,1)+2,clrNONE,110);

//--- Display a description of the indicator 1 line state
   panel.DrawText("Line state", panel.CellX(1,1,0)+2, panel.CellY(1,1,0)+2);
   ENUM_LINE_STATE state1=indicators.BufferLineState(Symbol(),PERIOD_CURRENT,handle_cci1,0,0,index);
   panel.DrawText(BufferLineStateDescription(state1),panel.CellX(1,1,1)+2,panel.CellY(1,1,1)+2,clrNONE,110);

//--- Output the data of indicator 2 from the specified bar into table 2
   panel.DrawText(indicators.Title(handle_cci2), panel.CellX(2,0,0)+2, panel.CellY(2,0,0)+2);
   double value2=indicators.GetDataTo(Symbol(),PERIOD_CURRENT,handle_cci2,0,0,index);
   string value_str2=(value2!=EMPTY_VALUE ? DoubleToString(value2,indicators.Digits(handle_cci2)) : " ");
   panel.DrawText(value_str2,panel.CellX(2,0,1)+2,panel.CellY(2,0,1)+2,clrNONE,110);

//--- Display a description of the indicator 2 line state
   panel.DrawText("Line state", panel.CellX(2,1,0)+2, panel.CellY(2,1,0)+2);
   ENUM_LINE_STATE state2=indicators.BufferLineState(Symbol(),PERIOD_CURRENT,handle_cci2,0,0,index);
   panel.DrawText(BufferLineStateDescription(state2),panel.CellX(2,1,1)+2,panel.CellY(2,1,1)+2,clrNONE,110);

//--- Display description of relationship between indicator 1 line relative to indicator 2 line
   double value21=indicators.GetDataTo(Symbol(),PERIOD_CURRENT,handle_cci2,0,0,index+1);
   ENUM_LINE_STATE stateR=indicators.BufferLineStateRelative(Symbol(),PERIOD_CURRENT,handle_cci1,0,0,index,value2,value21);
   string ma1=indicators.Name(handle_cci1);
   string ma2=indicators.Name(handle_cci2);
   string state_relative=
     (
      stateR==LINE_STATE_ABOVE      ? StringFormat("%s1 > %s2",ma1,ma2)   :
      stateR==LINE_STATE_BELOW      ? StringFormat("%s1 < %s2",ma1,ma2)           :
      stateR==LINE_STATE_CROSS_DOWN ? "Top-down crossing"   :
      stateR==LINE_STATE_CROSS_UP   ? "Bottom-up crossing"  :
      BufferLineStateDescription(stateR)
     );
   panel.DrawText(StringFormat("%s1 vs %s2",ma1,ma2), panel.CellX(2,2,0)+2, panel.CellY(2,2,0)+2);
   panel.DrawText(state_relative, panel.CellX(2,2,1)+2, panel.CellY(2,2,1)+2,clrNONE,110);

//--- Redraw the chart to immediately display all changes on the panel
   ChartRedraw(ChartID());
  }
//+------------------------------------------------------------------+
Nach dem Kompilieren und Starten des Indikators auf dem M1-Chart, wobei M5 für die Berechnungen ausgewählt wurde, sehen wir:
Der Indikator von DeMarker:
//+------------------------------------------------------------------+
//|                                             TestMSTFDeMarker.mq5 |
//|                                  Copyright 2023, MetaQuotes Ltd. |
//|                                             https://www.mql5.com |
//+------------------------------------------------------------------+
#property copyright "Copyright 2023, MetaQuotes Ltd."
#property link      "https://www.mql5.com"
#property version   "1.00"
#property indicator_separate_window
#property indicator_buffers 2
#property indicator_plots   2
//--- enums

//--- plot DeM1
#property indicator_label1  "DeM1"
#property indicator_type1   DRAW_LINE
#property indicator_color1  clrSeaGreen
#property indicator_style1  STYLE_SOLID
#property indicator_width1  1

//--- plot DeM2
#property indicator_label2  "DeM2"
#property indicator_type2   DRAW_LINE
#property indicator_color2  clrDodgerBlue
#property indicator_style2  STYLE_SOLID
#property indicator_width2  1

//--- includes
#include <IndMSTF\IndMSTF.mqh>
#include <Dashboard\Dashboard.mqh>
//--- input parameters
input string               InpSymbol      =  NULL;             /* Symbol                     */ // Symbol
input ENUM_TIMEFRAMES      InpTimeframe   =  PERIOD_CURRENT;   /* Timeframe                  */ // Timeframe
input int                  InpPeriod      =  14;               /* Period                     */ // Calculation period
input uchar                InpLineWidth1  =  2;                /* Senior period Line Width   */ // Line width for higher period
input uchar                InpLineWidth2  =  1;                /* Junior period Line Width   */ // Line width for lower period
input bool                 InpAsSeries    =  true;             /* As Series flag             */ // Timeseries flag of indicator buffer arrays

//--- indicator buffers
double         BufferDeM1[];
double         BufferDeM2[];
//--- global variables
int handle_dem1;
int handle_dem2;
CMSTFIndicators indicators;      // An instance of the indicator collection object
//--- variables for the panel
CDashboard *panel=NULL;          // Pointer to the panel object
int         mouse_bar_index;     // Index of the bar the data is taken from
//+------------------------------------------------------------------+
//| Custom indicator initialization function                         |
//+------------------------------------------------------------------+
int OnInit()
  {
//--- Set a timer with an interval of 1 second
   EventSetTimer(1);
//--- Assign the BufferMA1 and BufferMA2 arrays to the plot buffers 0 and 1, respectively
   SetIndexBuffer(0,BufferDeM1,INDICATOR_DATA);
   SetIndexBuffer(1,BufferDeM2,INDICATOR_DATA);
//--- Set the line width
   int w1=0,w2=0;
   if(InpTimeframe>Period())
     {
      w1=InpLineWidth2;
      w2=InpLineWidth1;
     }
   else
     {
      w1=InpLineWidth1;
      w2=InpLineWidth2;
     }
   PlotIndexSetInteger(0,PLOT_LINE_WIDTH,w1);
   PlotIndexSetInteger(1,PLOT_LINE_WIDTH,w2);
//--- sets indicator shift

//--- Set the timeseries flags for the indicator buffer arrays (for testing, to see that there is no difference)
   ArraySetAsSeries(BufferDeM1,InpAsSeries);
   ArraySetAsSeries(BufferDeM2,InpAsSeries);

//--- Create two indicators of the same type
//--- The first one is calculated on the current chart symbol/period, the second - on those specified in the settings
   handle_dem1=indicators.AddNewDeMarker(NULL,PERIOD_CURRENT,InpPeriod);
   handle_dem2=indicators.AddNewDeMarker(InpSymbol,InpTimeframe,InpPeriod);

//--- If failed to create indicator handles, return initialization error
   if(handle_dem1==INVALID_HANDLE || handle_dem2==INVALID_HANDLE)
      return INIT_FAILED;
//--- Set descriptions for indicator lines from buffer descriptions of calculation part of created indicators
   indicators.SetPlotLabelFromBuffer(0,handle_dem1,0);
   indicators.SetPlotLabelFromBuffer(1,handle_dem2,0);

//--- Dashboard
//--- Create the panel
   int width=247;
   panel=new CDashboard(1,20,20,width,264,0);
   if(panel==NULL)
     {
      Print("Error. Failed to create panel object");
      return INIT_FAILED;
     }
//--- Set font parameters
   panel.SetFontParams("Calibri",9);
//--- Display the panel with the "Symbol, Timeframe description" header text
   panel.View(Symbol()+", "+StringSubstr(EnumToString(Period()),7));

//--- Create a table with ID 0 to display bar data in it
   panel.CreateNewTable(0);
//--- Draw a table with ID 0 on the panel background
   panel.DrawGrid(0,2,20,6,2,18,width/2-2);

//--- Create a table with ID 1 to display the data of indicator 1
   panel.CreateNewTable(1);
//--- Get the Y2 table coordinate with ID 0 and
//--- set the Y1 coordinate for the table with ID 1
   int y1=panel.TableY2(0)+22;
//--- Draw a table with ID 1 on the panel background
   panel.DrawGrid(1,2,y1,2,2,18,width/2-2);

//--- Create a table with ID 2 to display the data of indicator 2
   panel.CreateNewTable(2);
//--- Get the Y2 coordinate of the table with ID 1 and
//--- set the Y1 coordinate for the table with ID 2
   int y2=panel.TableY2(1)+3;
//--- Draw a table with ID 2 on the background of the dashboard
   panel.DrawGrid(2,2,y2,3,2,18,width/2-2);

//--- Initialize the variable with the index of the mouse cursor bar
   mouse_bar_index=0;
//--- Display the data of the current bar on the panel
   DrawData(mouse_bar_index,TimeCurrent());

//--- Successful initialization
   return(INIT_SUCCEEDED);
  }
//+------------------------------------------------------------------+
//| Custom indicator deinitialization function                       |
//+------------------------------------------------------------------+
void OnDeinit(const int reason)
  {
//--- Delete the timer
   EventKillTimer();
//--- If the panel object exists, delete it
   if(panel!=NULL)
      delete panel;
//--- Delete all comments
   Comment("");
  }
//+------------------------------------------------------------------+
//| Custom indicator iteration function                              |
//+------------------------------------------------------------------+
int OnCalculate(const int rates_total,
                const int prev_calculated,
                const datetime &time[],
                const double &open[],
                const double &high[],
                const double &low[],
                const double &close[],
                const long &tick_volume[],
                const long &volume[],
                const int &spread[])
  {
//--- Number of bars for calculation
   int limit=rates_total-prev_calculated;
//--- If limit > 1, then this is the first calculation or change in the history
   if(limit>1)
     {
      //--- specify all the available history for calculation
      limit=rates_total-1;
      /*
      // If the indicator has any buffers that display other calculations (not multi-indicators),
      // initialize them here with the "empty" value set for these buffers
      */
     }
//--- Calculate all created multi-symbol multi-period indicators
   if(!indicators.Calculate())
      return 0;

//--- Display the bar data under cursor (or current bar if cursor is outside the chart) on the dashboard
   DrawData(mouse_bar_index,time[mouse_bar_index]);

//--- From buffers of calculated indicators, output data to indicator buffers
   if(!indicators.DataToBuffer(NULL,PERIOD_CURRENT,handle_dem1,0,0,limit,BufferDeM1))
      return 0;
   if(!indicators.DataToBuffer(NULL,PERIOD_CURRENT,handle_dem2,0,0,limit,BufferDeM2))
      return 0;

//--- return value of prev_calculated for the next call
   return(rates_total);
  }
//+------------------------------------------------------------------+
//| Timer function                                                   |
//+------------------------------------------------------------------+
void OnTimer()
  {
//--- Call the indicator collection timer
   indicators.OnTimer();
  }
//+------------------------------------------------------------------+
//| ChartEvent function                                              |
//+------------------------------------------------------------------+
void OnChartEvent(const int id,
                  const long &lparam,
                  const double &dparam,
                  const string &sparam)
  {
//--- Handling the panel
//--- Call the panel event handler
   panel.OnChartEvent(id,lparam,dparam,sparam);

//--- If the cursor moves or a click is made on the chart
   if(id==CHARTEVENT_MOUSE_MOVE || id==CHARTEVENT_CLICK)
     {
      //--- Declare the variables to record time and price coordinates in them
      datetime time=0;
      double price=0;
      int wnd=0;
      //--- If the cursor coordinates are converted to date and time
      if(ChartXYToTimePrice(ChartID(),(int)lparam,(int)dparam,wnd,time,price))
        {
         //--- write the bar index where the cursor is located to a global variable
         mouse_bar_index=iBarShift(Symbol(),PERIOD_CURRENT,time);
         //--- Display the bar data under the cursor on the panel
         DrawData(mouse_bar_index,time);
        }
     }

//--- If we received a custom event, display the appropriate message in the journal
   if(id>CHARTEVENT_CUSTOM)
     {
      //--- Here we can implement handling a click on the close button on the panel
      PrintFormat("%s: Event id=%ld, object id (lparam): %lu, event message (sparam): %s",__FUNCTION__,id,lparam,sparam);
     }
  }
//+------------------------------------------------------------------+
//| Display data from the specified timeseries index to the panel    |
//+------------------------------------------------------------------+
void DrawData(const int index,const datetime time)
  {
//--- Declare the variables to receive data in them
   MqlRates rates[1];

//--- Exit if unable to get the bar data by the specified index
   if(CopyRates(Symbol(),PERIOD_CURRENT,index,1,rates)!=1)
      return;

//--- Set font parameters for bar and indicator data headers
   int  size=0;
   uint flags=0;
   uint angle=0;
   string name=panel.FontParams(size,flags,angle);
   panel.SetFontParams(name,9,FW_BOLD);
   panel.DrawText("Bar data ["+(string)index+"]",3,panel.TableY1(0)-16,clrMaroon,panel.Width()-6);
   panel.DrawText("Indicators data ["+(string)index+"]",3,panel.TableY1(1)-16,clrGreen,panel.Width()-6);
//--- Set font parameters for bar and indicator data
   panel.SetFontParams(name,9);

//--- Display the data of the specified bar in table 0 on the panel
   panel.DrawText("Date",  panel.CellX(0,0,0)+2, panel.CellY(0,0,0)+2); panel.DrawText(TimeToString(  rates[0].time,TIME_DATE),     panel.CellX(0,0,1)+2, panel.CellY(0,0,1)+2,clrNONE,90);
   panel.DrawText("Time",  panel.CellX(0,1,0)+2, panel.CellY(0,1,0)+2); panel.DrawText(TimeToString(  rates[0].time,TIME_MINUTES),  panel.CellX(0,1,1)+2, panel.CellY(0,1,1)+2,clrNONE,90);
   panel.DrawText("Open",  panel.CellX(0,2,0)+2, panel.CellY(0,2,0)+2); panel.DrawText(DoubleToString(rates[0].open,Digits()),      panel.CellX(0,2,1)+2, panel.CellY(0,2,1)+2,clrNONE,90);
   panel.DrawText("High",  panel.CellX(0,3,0)+2, panel.CellY(0,3,0)+2); panel.DrawText(DoubleToString(rates[0].high,Digits()),      panel.CellX(0,3,1)+2, panel.CellY(0,3,1)+2,clrNONE,90);
   panel.DrawText("Low",   panel.CellX(0,4,0)+2, panel.CellY(0,4,0)+2); panel.DrawText(DoubleToString(rates[0].low,Digits()),       panel.CellX(0,4,1)+2, panel.CellY(0,4,1)+2,clrNONE,90);
   panel.DrawText("Close", panel.CellX(0,5,0)+2, panel.CellY(0,5,0)+2); panel.DrawText(DoubleToString(rates[0].close,Digits()),     panel.CellX(0,5,1)+2, panel.CellY(0,5,1)+2,clrNONE,90);

//--- Output the data of indicator 1 from the specified bar into table 1
   panel.DrawText(indicators.Title(handle_dem1), panel.CellX(1,0,0)+2, panel.CellY(1,0,0)+2);
   double value1=indicators.GetData(handle_dem1,0,0,index);
   string value_str1=(value1!=EMPTY_VALUE ? DoubleToString(value1,indicators.Digits(handle_dem1)) : " ");
   panel.DrawText(value_str1,panel.CellX(1,0,1)+2,panel.CellY(1,0,1)+2,clrNONE,110);

//--- Display a description of the indicator 1 line state
   panel.DrawText("Line state", panel.CellX(1,1,0)+2, panel.CellY(1,1,0)+2);
   ENUM_LINE_STATE state1=indicators.BufferLineState(Symbol(),PERIOD_CURRENT,handle_dem1,0,0,index);
   panel.DrawText(BufferLineStateDescription(state1),panel.CellX(1,1,1)+2,panel.CellY(1,1,1)+2,clrNONE,110);

//--- Output the data of indicator 2 from the specified bar into table 2
   panel.DrawText(indicators.Title(handle_dem2), panel.CellX(2,0,0)+2, panel.CellY(2,0,0)+2);
   double value2=indicators.GetDataTo(Symbol(),PERIOD_CURRENT,handle_dem2,0,0,index);
   string value_str2=(value2!=EMPTY_VALUE ? DoubleToString(value2,indicators.Digits(handle_dem2)) : " ");
   panel.DrawText(value_str2,panel.CellX(2,0,1)+2,panel.CellY(2,0,1)+2,clrNONE,110);

//--- Display a description of the indicator 2 line state
   panel.DrawText("Line state", panel.CellX(2,1,0)+2, panel.CellY(2,1,0)+2);
   ENUM_LINE_STATE state2=indicators.BufferLineState(Symbol(),PERIOD_CURRENT,handle_dem2,0,0,index);
   panel.DrawText(BufferLineStateDescription(state2),panel.CellX(2,1,1)+2,panel.CellY(2,1,1)+2,clrNONE,110);

//--- Display description of relationship between indicator 1 line relative to indicator 2 line
   double value21=indicators.GetDataTo(Symbol(),PERIOD_CURRENT,handle_dem2,0,0,index+1);
   ENUM_LINE_STATE stateR=indicators.BufferLineStateRelative(Symbol(),PERIOD_CURRENT,handle_dem1,0,0,index,value2,value21);
   string ma1=indicators.Name(handle_dem1);
   string ma2=indicators.Name(handle_dem2);
   string state_relative=
     (
      stateR==LINE_STATE_ABOVE      ? StringFormat("%s1 > %s2",ma1,ma2)   :
      stateR==LINE_STATE_BELOW      ? StringFormat("%s1 < %s2",ma1,ma2)           :
      stateR==LINE_STATE_CROSS_DOWN ? "Top-down crossing"   :
      stateR==LINE_STATE_CROSS_UP   ? "Bottom-up crossing"  :
      BufferLineStateDescription(stateR)
     );
   panel.DrawText(StringFormat("%s1 vs %s2",ma1,ma2), panel.CellX(2,2,0)+2, panel.CellY(2,2,0)+2);
   panel.DrawText(state_relative, panel.CellX(2,2,1)+2, panel.CellY(2,2,1)+2,clrNONE,110);

//--- Redraw the chart to immediately display all changes on the panel
   ChartRedraw(ChartID());
  }
//+------------------------------------------------------------------+
Nach dem Kompilieren und Starten des Indikators auf dem M1-Chart, wobei M5 für die Berechnungen ausgewählt wurde, sehen wir:
Der Indikator Envelopes:
//+------------------------------------------------------------------+
//|                                        TestMSTFEnvelopes.mq5.mq5 |
//|                                  Copyright 2023, MetaQuotes Ltd. |
//|                                             https://www.mql5.com |
//+------------------------------------------------------------------+
#property copyright "Copyright 2023, MetaQuotes Ltd."
#property link      "https://www.mql5.com"
#property version   "1.00"
#property indicator_chart_window
#property indicator_buffers 4
#property indicator_plots   4
//--- enums

//--- plot EnvelopesUp1
#property indicator_label1  "EnvelopesUp1"
#property indicator_type1   DRAW_LINE
#property indicator_color1  clrDodgerBlue
#property indicator_width1  1

//--- plot EnvelopesDown1
#property indicator_label2  "EnvelopesDown1"
#property indicator_type2   DRAW_LINE
#property indicator_color2  clrRed
#property indicator_width2  1

//--- plot EnvelopesUp2
#property indicator_label3  "EnvelopesUp2"
#property indicator_type3   DRAW_LINE
#property indicator_color3  clrDodgerBlue
#property indicator_width3  1

//--- plot EnvelopesDown2
#property indicator_label4  "EnvelopesDown2"
#property indicator_type4   DRAW_LINE
#property indicator_color4  clrRed
#property indicator_width4  1

//--- includes
#include <IndMSTF\IndMSTF.mqh>
#include <Dashboard\Dashboard.mqh>
//--- input parameters
input string               InpSymbol      =  NULL;             /* Symbol                     */ // Moving average symbol
input ENUM_TIMEFRAMES      InpTimeframe   =  PERIOD_CURRENT;   /* Timeframe                  */ // Moving average timeframe
input int                  InpPeriod      =  14;               /* Period                     */ // Calculation period
input ENUM_APPLIED_PRICE   InpPrice       =  PRICE_CLOSE;      /* Applied Price              */ // Price used for calculations
input ENUM_MA_METHOD       InpMethod      =  MODE_SMA;         /* Method                     */ // Moving Average calculation method
input int                  InpShift       =  0;                /* Shift                      */ // Moving average shift
input double               InpDeviation   =  0.1;              /* Deviation                  */ // Deviation
input uchar                InpLineWidth1  =  2;                /* Senior period Line Width   */ // Line width for higher period
input uchar                InpLineWidth2  =  1;                /* Junior period Line Width   */ // Line width for lower period
input bool                 InpAsSeries    =  true;             /* As Series flag             */ // Timeseries flag of indicator buffer arrays

//--- indicator buffers
double         BufferEnvelopesUp1[];
double         BufferEnvelopesDn1[];
double         BufferEnvelopesUp2[];
double         BufferEnvelopesDn2[];
//--- global variables
int handle_envelopes1;
int handle_envelopes2;
CMSTFIndicators indicators;      // An instance of the indicator collection object
//--- variables for the panel
CDashboard *panel=NULL;          // Pointer to the panel object
int         mouse_bar_index;     // Index of the bar the data is taken from
//+------------------------------------------------------------------+
//| Custom indicator initialization function                         |
//+------------------------------------------------------------------+
int OnInit()
  {
//--- Set a timer with an interval of 1 second
   EventSetTimer(1);
//--- Assign the BufferEnvelopesUp1 and BufferEnvelopesDn1 arrays to the plot buffers 0 and 1, respectively
   SetIndexBuffer(0,BufferEnvelopesUp1,INDICATOR_DATA);
   SetIndexBuffer(1,BufferEnvelopesDn1,INDICATOR_DATA);
//--- Assign the BufferEnvelopesUp2 and BufferEnvelopesDn2 arrays to the plot buffers 2 and 3, respectively
   SetIndexBuffer(2,BufferEnvelopesUp2,INDICATOR_DATA);
   SetIndexBuffer(3,BufferEnvelopesDn2,INDICATOR_DATA);
//--- Set the line width
   int w1=0,w2=0;
   if(InpTimeframe>Period())
     {
      w1=InpLineWidth2;
      w2=InpLineWidth1;
     }
   else
     {
      w1=InpLineWidth1;
      w2=InpLineWidth2;
     }
   PlotIndexSetInteger(0,PLOT_LINE_WIDTH,w1);
   PlotIndexSetInteger(1,PLOT_LINE_WIDTH,w1);
   PlotIndexSetInteger(2,PLOT_LINE_WIDTH,w2);
   PlotIndexSetInteger(3,PLOT_LINE_WIDTH,w2);
//--- Set the timeseries flags for the indicator buffer arrays (for testing, to see that there is no difference)
   ArraySetAsSeries(BufferEnvelopesUp1,InpAsSeries);
   ArraySetAsSeries(BufferEnvelopesDn1,InpAsSeries);
   ArraySetAsSeries(BufferEnvelopesUp2,InpAsSeries);
   ArraySetAsSeries(BufferEnvelopesDn2,InpAsSeries);

//--- Create two indicators of the same type
//--- The first one is calculated on the current chart symbol/period, the second - on those specified in the settings
   handle_envelopes1=indicators.AddNewEnvelopes(NULL,PERIOD_CURRENT,InpPeriod,InpShift,InpMethod,InpPrice,InpDeviation);
   handle_envelopes2=indicators.AddNewEnvelopes(InpSymbol,InpTimeframe,InpPeriod,InpShift,InpMethod,InpPrice,InpDeviation);

//--- If failed to create indicator handles, return initialization error
   if(handle_envelopes1==INVALID_HANDLE || handle_envelopes2==INVALID_HANDLE)
      return INIT_FAILED;
//--- Set descriptions for indicator lines from buffer descriptions of calculation part of created indicators
   indicators.SetPlotLabelFromBuffer(0,handle_envelopes1,0);
   indicators.SetPlotLabelFromBuffer(1,handle_envelopes1,1);
   indicators.SetPlotLabelFromBuffer(2,handle_envelopes2,0);
   indicators.SetPlotLabelFromBuffer(3,handle_envelopes2,1);
//--- Set shifts for indicator lines
   indicators.SetPlotShift(0,InpShift);
   indicators.SetPlotShift(1,InpShift);
   indicators.SetPlotShift(2,InpShift);
   indicators.SetPlotShift(3,InpShift);

//--- Dashboard
//--- Create the panel
   int width=301;
   panel=new CDashboard(1,20,20,width,264);
   if(panel==NULL)
     {
      Print("Error. Failed to create panel object");
      return INIT_FAILED;
     }
//--- Set font parameters
   panel.SetFontParams("Calibri",9);
//--- Display the panel with the "Symbol, Timeframe description" header text
   panel.View(Symbol()+", "+StringSubstr(EnumToString(Period()),7));

//--- Create a table with ID 0 to display bar data in it
   panel.CreateNewTable(0);
//--- Draw a table with ID 0 on the panel background
   panel.DrawGrid(0,2,20,6,2,18,width/2-2);

//--- Create a table with ID 1 to display the data of indicator 1
   panel.CreateNewTable(1);
//--- Get the Y2 table coordinate with ID 0 and
//--- set the Y1 coordinate for the table with ID 1
   int y1=panel.TableY2(0)+22;
//--- Draw a table with ID 1 on the panel background
   panel.DrawGrid(1,2,y1,2,2,18,width/2-2);

//--- Create a table with ID 2 to display the data of indicator 2
   panel.CreateNewTable(2);
//--- Get the Y2 coordinate of the table with ID 1 and
//--- set the Y1 coordinate for the table with ID 2
   int y2=panel.TableY2(1)+3;
//--- Draw a table with ID 2 on the background of the dashboard
   panel.DrawGrid(2,2,y2,3,2,18,width/2-2);

//--- Initialize the variable with the index of the mouse cursor bar
   mouse_bar_index=0;
//--- Display the data of the current bar on the panel
   DrawData(mouse_bar_index,TimeCurrent());

//--- Successful initialization
   return(INIT_SUCCEEDED);
  }
//+------------------------------------------------------------------+
//| Custom indicator deinitialization function                       |
//+------------------------------------------------------------------+
void OnDeinit(const int reason)
  {
//--- Delete the timer
   EventKillTimer();
//--- If the panel object exists, delete it
   if(panel!=NULL)
      delete panel;
//--- Delete all comments
   Comment("");
  }
//+------------------------------------------------------------------+
//| Custom indicator iteration function                              |
//+------------------------------------------------------------------+
int OnCalculate(const int rates_total,
                const int prev_calculated,
                const datetime &time[],
                const double &open[],
                const double &high[],
                const double &low[],
                const double &close[],
                const long &tick_volume[],
                const long &volume[],
                const int &spread[])
  {
//--- Number of bars for calculation
   int limit=rates_total-prev_calculated;
//--- If limit > 1, then this is the first calculation or change in the history
   if(limit>1)
     {
      //--- specify all the available history for calculation
      limit=rates_total-1;
      /*
      // If the indicator has any buffers that display other calculations (not multi-indicators),
      // initialize them here with the "empty" value set for these buffers
      */
     }
//--- Calculate all created multi-symbol multi-period indicators
   if(!indicators.Calculate())
      return 0;

//--- Display the bar data under cursor (or current bar if cursor is outside the chart) on the dashboard
   DrawData(mouse_bar_index,time[mouse_bar_index]);

//--- From buffers of calculated indicators, output data to indicator buffers
   if(!indicators.DataToBuffer(NULL,PERIOD_CURRENT,handle_envelopes1,0,0,limit,BufferEnvelopesUp1))
      return 0;
   if(!indicators.DataToBuffer(NULL,PERIOD_CURRENT,handle_envelopes1,1,0,limit,BufferEnvelopesDn1))
      return 0;
   if(!indicators.DataToBuffer(NULL,PERIOD_CURRENT,handle_envelopes2,0,0,limit,BufferEnvelopesUp2))
      return 0;
   if(!indicators.DataToBuffer(NULL,PERIOD_CURRENT,handle_envelopes2,1,0,limit,BufferEnvelopesDn2))
      return 0;

//--- return value of prev_calculated for the next call
   return(rates_total);
  }
//+------------------------------------------------------------------+
//| Timer function                                                   |
//+------------------------------------------------------------------+
void OnTimer()
  {
//--- Call the indicator collection timer
   indicators.OnTimer();
  }
//+------------------------------------------------------------------+
//| ChartEvent function                                              |
//+------------------------------------------------------------------+
void OnChartEvent(const int id,
                  const long &lparam,
                  const double &dparam,
                  const string &sparam)
  {
//--- Handling the panel
//--- Call the panel event handler
   panel.OnChartEvent(id,lparam,dparam,sparam);

//--- If the cursor moves or a click is made on the chart
   if(id==CHARTEVENT_MOUSE_MOVE || id==CHARTEVENT_CLICK)
     {
      //--- Declare the variables to record time and price coordinates in them
      datetime time=0;
      double price=0;
      int wnd=0;
      //--- If the cursor coordinates are converted to date and time
      if(ChartXYToTimePrice(ChartID(),(int)lparam,(int)dparam,wnd,time,price))
        {
         //--- write the bar index where the cursor is located to a global variable
         mouse_bar_index=iBarShift(Symbol(),PERIOD_CURRENT,time);
         //--- Display the bar data under the cursor on the panel
         DrawData(mouse_bar_index,time);
        }
     }

//--- If we received a custom event, display the appropriate message in the journal
   if(id>CHARTEVENT_CUSTOM)
     {
      //--- Here we can implement handling a click on the close button on the panel
      PrintFormat("%s: Event id=%ld, object id (lparam): %lu, event message (sparam): %s",__FUNCTION__,id,lparam,sparam);
     }
  }
//+------------------------------------------------------------------+
//| Display data from the specified timeseries index to the panel    |
//+------------------------------------------------------------------+
void DrawData(const int index,const datetime time)
  {
//--- Declare the variables to receive data in them
   MqlRates rates[1];

//--- Exit if unable to get the bar data by the specified index
   if(CopyRates(Symbol(),PERIOD_CURRENT,index,1,rates)!=1)
      return;

//--- Set font parameters for bar and indicator data headers
   int  size=0;
   uint flags=0;
   uint angle=0;
   string name=panel.FontParams(size,flags,angle);
   panel.SetFontParams(name,9,FW_BOLD);
   panel.DrawText("Bar data ["+(string)index+"]",3,panel.TableY1(0)-16,clrMaroon,panel.Width()-6);
   panel.DrawText("Indicators data ["+(string)index+"]",3,panel.TableY1(1)-16,clrGreen,panel.Width()-6);
//--- Set font parameters for bar and indicator data
   panel.SetFontParams(name,9);

//--- Display the data of the specified bar in table 0 on the panel
   panel.DrawText("Date",  panel.CellX(0,0,0)+2, panel.CellY(0,0,0)+2); panel.DrawText(TimeToString(  rates[0].time,TIME_DATE),     panel.CellX(0,0,1)+2, panel.CellY(0,0,1)+2,clrNONE,90);
   panel.DrawText("Time",  panel.CellX(0,1,0)+2, panel.CellY(0,1,0)+2); panel.DrawText(TimeToString(  rates[0].time,TIME_MINUTES),  panel.CellX(0,1,1)+2, panel.CellY(0,1,1)+2,clrNONE,90);
   panel.DrawText("Open",  panel.CellX(0,2,0)+2, panel.CellY(0,2,0)+2); panel.DrawText(DoubleToString(rates[0].open,Digits()),      panel.CellX(0,2,1)+2, panel.CellY(0,2,1)+2,clrNONE,90);
   panel.DrawText("High",  panel.CellX(0,3,0)+2, panel.CellY(0,3,0)+2); panel.DrawText(DoubleToString(rates[0].high,Digits()),      panel.CellX(0,3,1)+2, panel.CellY(0,3,1)+2,clrNONE,90);
   panel.DrawText("Low",   panel.CellX(0,4,0)+2, panel.CellY(0,4,0)+2); panel.DrawText(DoubleToString(rates[0].low,Digits()),       panel.CellX(0,4,1)+2, panel.CellY(0,4,1)+2,clrNONE,90);
   panel.DrawText("Close", panel.CellX(0,5,0)+2, panel.CellY(0,5,0)+2); panel.DrawText(DoubleToString(rates[0].close,Digits()),     panel.CellX(0,5,1)+2, panel.CellY(0,5,1)+2,clrNONE,90);

//--- Output the data of indicator 1 from the specified bar into table 1
   panel.DrawText(indicators.Title(handle_envelopes1), panel.CellX(1,0,0)+2, panel.CellY(1,0,0)+2);
   double value1=indicators.GetData(handle_envelopes1,0,0,index);
   string value_str1=(value1!=EMPTY_VALUE ? DoubleToString(value1,indicators.Digits(handle_envelopes1)) : " ");
   panel.DrawText(value_str1,panel.CellX(1,0,1)+2,panel.CellY(1,0,1)+2,clrNONE,150);

//--- Display a description of the indicator 1 line state
   panel.DrawText("Line state", panel.CellX(1,1,0)+2, panel.CellY(1,1,0)+2);
   ENUM_LINE_STATE state1=indicators.BufferLineState(Symbol(),PERIOD_CURRENT,handle_envelopes1,0,0,index);
   panel.DrawText(BufferLineStateDescription(state1),panel.CellX(1,1,1)+2,panel.CellY(1,1,1)+2,clrNONE,150);

//--- Output the data of indicator 2 from the specified bar into table 2
   panel.DrawText(indicators.Title(handle_envelopes2), panel.CellX(2,0,0)+2, panel.CellY(2,0,0)+2);
   double value2=indicators.GetDataTo(Symbol(),PERIOD_CURRENT,handle_envelopes2,0,0,index);
   string value_str2=(value2!=EMPTY_VALUE ? DoubleToString(value2,indicators.Digits(handle_envelopes2)) : " ");
   panel.DrawText(value_str2,panel.CellX(2,0,1)+2,panel.CellY(2,0,1)+2,clrNONE,150);

//--- Display a description of the indicator 2 line state
   panel.DrawText("Line state", panel.CellX(2,1,0)+2, panel.CellY(2,1,0)+2);
   ENUM_LINE_STATE state2=indicators.BufferLineState(Symbol(),PERIOD_CURRENT,handle_envelopes2,0,0,index);
   panel.DrawText(BufferLineStateDescription(state2),panel.CellX(2,1,1)+2,panel.CellY(2,1,1)+2,clrNONE,150);

//--- Display description of relationship between indicator 1 line relative to indicator 2 line
   double value21=indicators.GetDataTo(Symbol(),PERIOD_CURRENT,handle_envelopes2,0,0,index+1);
   ENUM_LINE_STATE stateR=indicators.BufferLineStateRelative(Symbol(),PERIOD_CURRENT,handle_envelopes1,0,0,index,value2,value21);
   string ma1=indicators.Name(handle_envelopes1);
   string ma2=indicators.Name(handle_envelopes2);
   string state_relative=
     (
      stateR==LINE_STATE_ABOVE      ? StringFormat("%s1 > %s2",ma1,ma2)   :
      stateR==LINE_STATE_BELOW      ? StringFormat("%s1 < %s2",ma1,ma2)           :
      stateR==LINE_STATE_CROSS_DOWN ? "Top-down crossing"   :
      stateR==LINE_STATE_CROSS_UP   ? "Bottom-up crossing"  :
      BufferLineStateDescription(stateR)
     );
   panel.DrawText(StringFormat("%s1 vs %s2",ma1,ma2), panel.CellX(2,2,0)+2, panel.CellY(2,2,0)+2);
   panel.DrawText(state_relative, panel.CellX(2,2,1)+2, panel.CellY(2,2,1)+2,clrNONE,150);

//--- Redraw the chart to immediately display all changes on the panel
   ChartRedraw(ChartID());
  }
//+------------------------------------------------------------------+
Nach dem Kompilieren und Starten des Indikators auf dem M1-Chart, wobei M5 für die Berechnungen ausgewählt wurde, sehen wir:
Der Indikator Force Index:
//+------------------------------------------------------------------+
//|                                           TestMSTFForceIndex.mq5 |
//|                                  Copyright 2023, MetaQuotes Ltd. |
//|                                             https://www.mql5.com |
//+------------------------------------------------------------------+
#property copyright "Copyright 2023, MetaQuotes Ltd."
#property link      "https://www.mql5.com"
#property version   "1.00"
#property indicator_separate_window
#property indicator_buffers 2
#property indicator_plots   2
//--- enums

//--- plot Force1
#property indicator_label1  "Force1"
#property indicator_type1   DRAW_LINE
#property indicator_color1  clrSeaGreen
#property indicator_style1  STYLE_SOLID
#property indicator_width1  1

//--- plot Force2
#property indicator_label2  "Force2"
#property indicator_type2   DRAW_LINE
#property indicator_color2  clrDodgerBlue
#property indicator_style2  STYLE_SOLID
#property indicator_width2  1

//--- includes
#include <IndMSTF\IndMSTF.mqh>
#include <Dashboard\Dashboard.mqh>
//--- input parameters
input string               InpSymbol      =  NULL;             /* Symbol                     */ // Symbol
input ENUM_TIMEFRAMES      InpTimeframe   =  PERIOD_CURRENT;   /* Timeframe                  */ // Timeframe
input int                  InpPeriod      =  13;               /* Period                     */ // Calculation period
input ENUM_MA_METHOD       InpMethod      =  MODE_SMA;         /* Method                     */ // Calculation method
input ENUM_APPLIED_VOLUME  InpVolume      =  VOLUME_TICK;      /* Applied Volume             */ // Volumes
input uchar                InpLineWidth1  =  2;                /* Senior period Line Width   */ // Line width for higher period
input uchar                InpLineWidth2  =  1;                /* Junior period Line Width   */ // Line width for lower period
input bool                 InpAsSeries    =  true;             /* As Series flag             */ // Timeseries flag of indicator buffer arrays

//--- indicator buffers
double         BufferForce1[];
double         BufferForce2[];
//--- global variables
int handle_force1;
int handle_force2;
CMSTFIndicators indicators;      // An instance of the indicator collection object
//--- variables for the panel
CDashboard *panel=NULL;          // Pointer to the panel object
int         mouse_bar_index;     // Index of the bar the data is taken from
//+------------------------------------------------------------------+
//| Custom indicator initialization function                         |
//+------------------------------------------------------------------+
int OnInit()
  {
//--- Set a timer with an interval of 1 second
   EventSetTimer(1);
//--- Assign the BufferMA1 and BufferMA2 arrays to the plot buffers 0 and 1, respectively
   SetIndexBuffer(0,BufferForce1,INDICATOR_DATA);
   SetIndexBuffer(1,BufferForce2,INDICATOR_DATA);
//--- Set the line width
   int w1=0,w2=0;
   if(InpTimeframe>Period())
     {
      w1=InpLineWidth2;
      w2=InpLineWidth1;
     }
   else
     {
      w1=InpLineWidth1;
      w2=InpLineWidth2;
     }
   PlotIndexSetInteger(0,PLOT_LINE_WIDTH,w1);
   PlotIndexSetInteger(1,PLOT_LINE_WIDTH,w2);
//--- sets indicator shift

//--- Set the timeseries flags for the indicator buffer arrays (for testing, to see that there is no difference)
   ArraySetAsSeries(BufferForce1,InpAsSeries);
   ArraySetAsSeries(BufferForce2,InpAsSeries);

//--- Create two indicators of the same type
//--- The first one is calculated on the current chart symbol/period, the second - on those specified in the settings
   handle_force1=indicators.AddNewForce(NULL,PERIOD_CURRENT,InpPeriod,InpMethod,InpVolume);
   handle_force2=indicators.AddNewForce(InpSymbol,InpTimeframe,InpPeriod,InpMethod,InpVolume);

//--- If failed to create indicator handles, return initialization error
   if(handle_force1==INVALID_HANDLE || handle_force2==INVALID_HANDLE)
      return INIT_FAILED;
//--- Set descriptions for indicator lines from buffer descriptions of calculation part of created indicators
   indicators.SetPlotLabelFromBuffer(0,handle_force1,0);
   indicators.SetPlotLabelFromBuffer(1,handle_force2,0);

//--- Dashboard
//--- Create the panel
   int width=247;
   panel=new CDashboard(1,20,20,width,264,0);
   if(panel==NULL)
     {
      Print("Error. Failed to create panel object");
      return INIT_FAILED;
     }
//--- Set font parameters
   panel.SetFontParams("Calibri",9);
//--- Display the panel with the "Symbol, Timeframe description" header text
   panel.View(Symbol()+", "+StringSubstr(EnumToString(Period()),7));

//--- Create a table with ID 0 to display bar data in it
   panel.CreateNewTable(0);
//--- Draw a table with ID 0 on the panel background
   panel.DrawGrid(0,2,20,6,2,18,width/2-2);

//--- Create a table with ID 1 to display the data of indicator 1
   panel.CreateNewTable(1);
//--- Get the Y2 table coordinate with ID 0 and
//--- set the Y1 coordinate for the table with ID 1
   int y1=panel.TableY2(0)+22;
//--- Draw a table with ID 1 on the panel background
   panel.DrawGrid(1,2,y1,2,2,18,width/2-2);

//--- Create a table with ID 2 to display the data of indicator 2
   panel.CreateNewTable(2);
//--- Get the Y2 coordinate of the table with ID 1 and
//--- set the Y1 coordinate for the table with ID 2
   int y2=panel.TableY2(1)+3;
//--- Draw a table with ID 2 on the background of the dashboard
   panel.DrawGrid(2,2,y2,3,2,18,width/2-2);

//--- Initialize the variable with the index of the mouse cursor bar
   mouse_bar_index=0;
//--- Display the data of the current bar on the panel
   DrawData(mouse_bar_index,TimeCurrent());

//--- Successful initialization
   return(INIT_SUCCEEDED);
  }
//+------------------------------------------------------------------+
//| Custom indicator deinitialization function                       |
//+------------------------------------------------------------------+
void OnDeinit(const int reason)
  {
//--- Delete the timer
   EventKillTimer();
//--- If the panel object exists, delete it
   if(panel!=NULL)
      delete panel;
//--- Delete all comments
   Comment("");
  }
//+------------------------------------------------------------------+
//| Custom indicator iteration function                              |
//+------------------------------------------------------------------+
int OnCalculate(const int rates_total,
                const int prev_calculated,
                const datetime &time[],
                const double &open[],
                const double &high[],
                const double &low[],
                const double &close[],
                const long &tick_volume[],
                const long &volume[],
                const int &spread[])
  {
//--- Number of bars for calculation
   int limit=rates_total-prev_calculated;
//--- If limit > 1, then this is the first calculation or change in the history
   if(limit>1)
     {
      //--- specify all the available history for calculation
      limit=rates_total-1;
      /*
      // If the indicator has any buffers that display other calculations (not multi-indicators),
      // initialize them here with the "empty" value set for these buffers
      */
     }
//--- Calculate all created multi-symbol multi-period indicators
   if(!indicators.Calculate())
      return 0;

//--- Display the bar data under cursor (or current bar if cursor is outside the chart) on the dashboard
   DrawData(mouse_bar_index,time[mouse_bar_index]);

//--- From buffers of calculated indicators, output data to indicator buffers
   if(!indicators.DataToBuffer(NULL,PERIOD_CURRENT,handle_force1,0,0,limit,BufferForce1))
      return 0;
   if(!indicators.DataToBuffer(NULL,PERIOD_CURRENT,handle_force2,0,0,limit,BufferForce2))
      return 0;

//--- return value of prev_calculated for the next call
   return(rates_total);
  }
//+------------------------------------------------------------------+
//| Timer function                                                   |
//+------------------------------------------------------------------+
void OnTimer()
  {
//--- Call the indicator collection timer
   indicators.OnTimer();
  }
//+------------------------------------------------------------------+
//| ChartEvent function                                              |
//+------------------------------------------------------------------+
void OnChartEvent(const int id,
                  const long &lparam,
                  const double &dparam,
                  const string &sparam)
  {
//--- Handling the panel
//--- Call the panel event handler
   panel.OnChartEvent(id,lparam,dparam,sparam);

//--- If the cursor moves or a click is made on the chart
   if(id==CHARTEVENT_MOUSE_MOVE || id==CHARTEVENT_CLICK)
     {
      //--- Declare the variables to record time and price coordinates in them
      datetime time=0;
      double price=0;
      int wnd=0;
      //--- If the cursor coordinates are converted to date and time
      if(ChartXYToTimePrice(ChartID(),(int)lparam,(int)dparam,wnd,time,price))
        {
         //--- write the bar index where the cursor is located to a global variable
         mouse_bar_index=iBarShift(Symbol(),PERIOD_CURRENT,time);
         //--- Display the bar data under the cursor on the panel
         DrawData(mouse_bar_index,time);
        }
     }

//--- If we received a custom event, display the appropriate message in the journal
   if(id>CHARTEVENT_CUSTOM)
     {
      //--- Here we can implement handling a click on the close button on the panel
      PrintFormat("%s: Event id=%ld, object id (lparam): %lu, event message (sparam): %s",__FUNCTION__,id,lparam,sparam);
     }
  }
//+------------------------------------------------------------------+
//| Display data from the specified timeseries index to the panel    |
//+------------------------------------------------------------------+
void DrawData(const int index,const datetime time)
  {
//--- Declare the variables to receive data in them
   MqlRates rates[1];

//--- Exit if unable to get the bar data by the specified index
   if(CopyRates(Symbol(),PERIOD_CURRENT,index,1,rates)!=1)
      return;

//--- Set font parameters for bar and indicator data headers
   int  size=0;
   uint flags=0;
   uint angle=0;
   string name=panel.FontParams(size,flags,angle);
   panel.SetFontParams(name,9,FW_BOLD);
   panel.DrawText("Bar data ["+(string)index+"]",3,panel.TableY1(0)-16,clrMaroon,panel.Width()-6);
   panel.DrawText("Indicators data ["+(string)index+"]",3,panel.TableY1(1)-16,clrGreen,panel.Width()-6);
//--- Set font parameters for bar and indicator data
   panel.SetFontParams(name,9);

//--- Display the data of the specified bar in table 0 on the panel
   panel.DrawText("Date",  panel.CellX(0,0,0)+2, panel.CellY(0,0,0)+2); panel.DrawText(TimeToString(  rates[0].time,TIME_DATE),     panel.CellX(0,0,1)+2, panel.CellY(0,0,1)+2,clrNONE,90);
   panel.DrawText("Time",  panel.CellX(0,1,0)+2, panel.CellY(0,1,0)+2); panel.DrawText(TimeToString(  rates[0].time,TIME_MINUTES),  panel.CellX(0,1,1)+2, panel.CellY(0,1,1)+2,clrNONE,90);
   panel.DrawText("Open",  panel.CellX(0,2,0)+2, panel.CellY(0,2,0)+2); panel.DrawText(DoubleToString(rates[0].open,Digits()),      panel.CellX(0,2,1)+2, panel.CellY(0,2,1)+2,clrNONE,90);
   panel.DrawText("High",  panel.CellX(0,3,0)+2, panel.CellY(0,3,0)+2); panel.DrawText(DoubleToString(rates[0].high,Digits()),      panel.CellX(0,3,1)+2, panel.CellY(0,3,1)+2,clrNONE,90);
   panel.DrawText("Low",   panel.CellX(0,4,0)+2, panel.CellY(0,4,0)+2); panel.DrawText(DoubleToString(rates[0].low,Digits()),       panel.CellX(0,4,1)+2, panel.CellY(0,4,1)+2,clrNONE,90);
   panel.DrawText("Close", panel.CellX(0,5,0)+2, panel.CellY(0,5,0)+2); panel.DrawText(DoubleToString(rates[0].close,Digits()),     panel.CellX(0,5,1)+2, panel.CellY(0,5,1)+2,clrNONE,90);

//--- Output the data of indicator 1 from the specified bar into table 1
   panel.DrawText(indicators.Title(handle_force1), panel.CellX(1,0,0)+2, panel.CellY(1,0,0)+2);
   double value1=indicators.GetData(handle_force1,0,0,index);
   string value_str1=(value1!=EMPTY_VALUE ? DoubleToString(value1,indicators.Digits(handle_force1)) : " ");
   panel.DrawText(value_str1,panel.CellX(1,0,1)+2,panel.CellY(1,0,1)+2,clrNONE,110);

//--- Display a description of the indicator 1 line state
   panel.DrawText("Line state", panel.CellX(1,1,0)+2, panel.CellY(1,1,0)+2);
   ENUM_LINE_STATE state1=indicators.BufferLineState(Symbol(),PERIOD_CURRENT,handle_force1,0,0,index);
   panel.DrawText(BufferLineStateDescription(state1),panel.CellX(1,1,1)+2,panel.CellY(1,1,1)+2,clrNONE,110);

//--- Output the data of indicator 2 from the specified bar into table 2
   panel.DrawText(indicators.Title(handle_force2), panel.CellX(2,0,0)+2, panel.CellY(2,0,0)+2);
   double value2=indicators.GetDataTo(Symbol(),PERIOD_CURRENT,handle_force2,0,0,index);
   string value_str2=(value2!=EMPTY_VALUE ? DoubleToString(value2,indicators.Digits(handle_force2)) : " ");
   panel.DrawText(value_str2,panel.CellX(2,0,1)+2,panel.CellY(2,0,1)+2,clrNONE,110);

//--- Display a description of the indicator 2 line state
   panel.DrawText("Line state", panel.CellX(2,1,0)+2, panel.CellY(2,1,0)+2);
   ENUM_LINE_STATE state2=indicators.BufferLineState(Symbol(),PERIOD_CURRENT,handle_force2,0,0,index);
   panel.DrawText(BufferLineStateDescription(state2),panel.CellX(2,1,1)+2,panel.CellY(2,1,1)+2,clrNONE,110);

//--- Display description of relationship between indicator 1 line relative to indicator 2 line
   double value21=indicators.GetDataTo(Symbol(),PERIOD_CURRENT,handle_force2,0,0,index+1);
   ENUM_LINE_STATE stateR=indicators.BufferLineStateRelative(Symbol(),PERIOD_CURRENT,handle_force1,0,0,index,value2,value21);
   string ma1=indicators.Name(handle_force1);
   string ma2=indicators.Name(handle_force2);
   string state_relative=
     (
      stateR==LINE_STATE_ABOVE      ? StringFormat("%s1 > %s2",ma1,ma2)   :
      stateR==LINE_STATE_BELOW      ? StringFormat("%s1 < %s2",ma1,ma2)           :
      stateR==LINE_STATE_CROSS_DOWN ? "Top-down crossing"   :
      stateR==LINE_STATE_CROSS_UP   ? "Bottom-up crossing"  :
      BufferLineStateDescription(stateR)
     );
   panel.DrawText(StringFormat("%s1 vs %s2",ma1,ma2), panel.CellX(2,2,0)+2, panel.CellY(2,2,0)+2);
   panel.DrawText(state_relative, panel.CellX(2,2,1)+2, panel.CellY(2,2,1)+2,clrNONE,110);

//--- Redraw the chart to immediately display all changes on the panel
   ChartRedraw(ChartID());
  }
//+------------------------------------------------------------------+
Nach dem Kompilieren und Starten des Indikators auf dem M1-Chart, wobei M5 für die Berechnungen ausgewählt wurde, sehen wir:
Der Indikator MACD:
//+------------------------------------------------------------------+
//|                                                 TestMSTFMACD.mq5 |
//|                                  Copyright 2023, MetaQuotes Ltd. |
//|                                             https://www.mql5.com |
//+------------------------------------------------------------------+
#property copyright "Copyright 2023, MetaQuotes Ltd."
#property link      "https://www.mql5.com"
#property version   "1.00"
#property indicator_separate_window
#property indicator_buffers 4
#property indicator_plots   4
//--- enums

//--- plot MACD1
#property indicator_label1  "MACD1"
#property indicator_type1   DRAW_HISTOGRAM
#property indicator_color1  clrGreen
#property indicator_style1  STYLE_SOLID
#property indicator_width1  1

//--- plot Signal1
#property indicator_label2  "Signal1"
#property indicator_type2   DRAW_LINE
#property indicator_color2  clrRed
#property indicator_style2  STYLE_DOT
#property indicator_width2  1

//--- plot MACD2
#property indicator_label3  "MACD2"
#property indicator_type3   DRAW_HISTOGRAM
#property indicator_color3  clrPaleGreen
#property indicator_style3  STYLE_SOLID
#property indicator_width3  1

//--- plot Signal2
#property indicator_label4  "Signal2"
#property indicator_type4   DRAW_LINE
#property indicator_color4  clrOrange
#property indicator_style4  STYLE_DOT
#property indicator_width4  1

//--- includes
#include <IndMSTF\IndMSTF.mqh>
#include <Dashboard\Dashboard.mqh>
//--- input parameters
input string               InpSymbol      =  NULL;             /* Symbol                     */ // Symbol
input ENUM_TIMEFRAMES      InpTimeframe   =  PERIOD_CURRENT;   /* Timeframe                  */ // Timeframe
input int                  InpFastPeriod  =  12;               /* Fast EMA Period            */
input int                  InpSlowPeriod  =  26;               /* Slow EMA Period            */
input int                  InpSignal      =  9;                /* MACD SMA                   */ // Signal line period
input ENUM_APPLIED_PRICE   InpPrice       =  PRICE_CLOSE;      /* Applied Price              */
input uchar                InpLineWidth1  =  2;                /* Senior period Line Width   */ // Line width for higher period
input uchar                InpLineWidth2  =  1;                /* Junior period Line Width   */ // Line width for lower period
input bool                 InpAsSeries    =  true;             /* As Series flag             */ // Timeseries flag of indicator buffer arrays

//--- indicator buffers
double         BufferMACD1[];
double         BufferSig1[];
double         BufferMACD2[];
double         BufferSig2[];
//--- global variables
int macd1;
int macd2;
CMSTFIndicators indicators;      // An instance of the indicator collection object
//--- variables for the panel
CDashboard *panel=NULL;          // Pointer to the panel object
int         mouse_bar_index;     // Index of the bar the data is taken from
//+------------------------------------------------------------------+
//| Custom indicator initialization function                         |
//+------------------------------------------------------------------+
int OnInit()
  {
//--- Set a timer with an interval of 1 second
   EventSetTimer(1);
//--- Assign the BufferMA1 and BufferMA2 arrays to the plot buffers 0 and 1, respectively
   SetIndexBuffer(0,BufferMACD1,INDICATOR_DATA);
   SetIndexBuffer(1,BufferSig1,INDICATOR_DATA);
   SetIndexBuffer(2,BufferMACD2,INDICATOR_DATA);
   SetIndexBuffer(3,BufferSig2,INDICATOR_DATA);
//--- Set the line width
   int w1=0,w2=0;
   if(InpTimeframe>Period())
     {
      w1=InpLineWidth2;
      w2=InpLineWidth1;
     }
   else
     {
      w1=InpLineWidth1;
      w2=InpLineWidth2;
     }
   PlotIndexSetInteger(0,PLOT_LINE_WIDTH,w1);
   PlotIndexSetInteger(1,PLOT_LINE_WIDTH,w1);
   PlotIndexSetInteger(2,PLOT_LINE_WIDTH,w2);
   PlotIndexSetInteger(3,PLOT_LINE_WIDTH,w2);
//--- sets indicator shift

//--- Set the timeseries flags for the indicator buffer arrays (for testing, to see that there is no difference)
   ArraySetAsSeries(BufferMACD1,InpAsSeries);
   ArraySetAsSeries(BufferSig1,InpAsSeries);
   ArraySetAsSeries(BufferMACD2,InpAsSeries);
   ArraySetAsSeries(BufferSig2,InpAsSeries);

//--- Create two indicators of the same type
//--- The first one is calculated on the current chart symbol/period, the second - on those specified in the settings
   macd1=indicators.AddNewMACD(NULL,PERIOD_CURRENT,InpFastPeriod,InpSlowPeriod,InpSignal,InpPrice);
   macd2=indicators.AddNewMACD(InpSymbol,InpTimeframe,InpFastPeriod,InpSlowPeriod,InpSignal,InpPrice);

//--- If failed to create indicator handles, return initialization error
   if(macd1==INVALID_HANDLE || macd2==INVALID_HANDLE)
      return INIT_FAILED;
//--- Set descriptions for indicator lines from buffer descriptions of calculation part of created indicators
   indicators.SetPlotLabelFromBuffer(0,macd1,0);
   indicators.SetPlotLabelFromBuffer(1,macd1,1);
   indicators.SetPlotLabelFromBuffer(2,macd2,0);
   indicators.SetPlotLabelFromBuffer(3,macd2,1);

//--- Dashboard
//--- Create the panel
   int width=301;
   panel=new CDashboard(1,20,20,width,264,0);
   if(panel==NULL)
     {
      Print("Error. Failed to create panel object");
      return INIT_FAILED;
     }
//--- Set font parameters
   panel.SetFontParams("Calibri",9);
//--- Display the panel with the "Symbol, Timeframe description" header text
   panel.View(Symbol()+", "+StringSubstr(EnumToString(Period()),7));

//--- Create a table with ID 0 to display bar data in it
   panel.CreateNewTable(0);
//--- Draw a table with ID 0 on the panel background
   panel.DrawGrid(0,2,20,6,2,18,width/2-2);

//--- Create a table with ID 1 to display the data of indicator 1
   panel.CreateNewTable(1);
//--- Get the Y2 table coordinate with ID 0 and
//--- set the Y1 coordinate for the table with ID 1
   int y1=panel.TableY2(0)+22;
//--- Draw a table with ID 1 on the panel background
   panel.DrawGrid(1,2,y1,2,2,18,width/2-2);

//--- Create a table with ID 2 to display the data of indicator 2
   panel.CreateNewTable(2);
//--- Get the Y2 coordinate of the table with ID 1 and
//--- set the Y1 coordinate for the table with ID 2
   int y2=panel.TableY2(1)+3;
//--- Draw a table with ID 2 on the background of the dashboard
   panel.DrawGrid(2,2,y2,3,2,18,width/2-2);

//--- Initialize the variable with the index of the mouse cursor bar
   mouse_bar_index=0;
//--- Display the data of the current bar on the panel
   DrawData(mouse_bar_index,TimeCurrent());

//--- Successful initialization
   return(INIT_SUCCEEDED);
  }
//+------------------------------------------------------------------+
//| Custom indicator deinitialization function                       |
//+------------------------------------------------------------------+
void OnDeinit(const int reason)
  {
//--- Delete the timer
   EventKillTimer();
//--- If the panel object exists, delete it
   if(panel!=NULL)
      delete panel;
//--- Delete all comments
   Comment("");
  }
//+------------------------------------------------------------------+
//| Custom indicator iteration function                              |
//+------------------------------------------------------------------+
int OnCalculate(const int rates_total,
                const int prev_calculated,
                const datetime &time[],
                const double &open[],
                const double &high[],
                const double &low[],
                const double &close[],
                const long &tick_volume[],
                const long &volume[],
                const int &spread[])
  {
//--- Number of bars for calculation
   int limit=rates_total-prev_calculated;
//--- If limit > 1, then this is the first calculation or change in the history
   if(limit>1)
     {
      //--- specify all the available history for calculation
      limit=rates_total-1;
      /*
      // If the indicator has any buffers that display other calculations (not multi-indicators),
      // initialize them here with the "empty" value set for these buffers
      */
     }
//--- Calculate all created multi-symbol multi-period indicators
   if(!indicators.Calculate())
      return 0;

//--- Display the bar data under cursor (or current bar if cursor is outside the chart) on the dashboard
   DrawData(mouse_bar_index,time[mouse_bar_index]);

//--- From buffers of calculated indicators, output data to indicator buffers
   if(!indicators.DataToBuffer(NULL,PERIOD_CURRENT,macd1,0,0,limit,BufferMACD1))
      return 0;
   if(!indicators.DataToBuffer(NULL,PERIOD_CURRENT,macd1,1,0,limit,BufferSig1))
      return 0;

   if(!indicators.DataToBuffer(NULL,PERIOD_CURRENT,macd2,0,0,limit,BufferMACD2))
      return 0;
   if(!indicators.DataToBuffer(NULL,PERIOD_CURRENT,macd2,1,0,limit,BufferSig2))
      return 0;

//--- return value of prev_calculated for the next call
   return(rates_total);
  }
//+------------------------------------------------------------------+
//| Timer function                                                   |
//+------------------------------------------------------------------+
void OnTimer()
  {
//--- Call the indicator collection timer
   indicators.OnTimer();
  }
//+------------------------------------------------------------------+
//| ChartEvent function                                              |
//+------------------------------------------------------------------+
void OnChartEvent(const int id,
                  const long &lparam,
                  const double &dparam,
                  const string &sparam)
  {
//--- Handling the panel
//--- Call the panel event handler
   panel.OnChartEvent(id,lparam,dparam,sparam);

//--- If the cursor moves or a click is made on the chart
   if(id==CHARTEVENT_MOUSE_MOVE || id==CHARTEVENT_CLICK)
     {
      //--- Declare the variables to record time and price coordinates in them
      datetime time=0;
      double price=0;
      int wnd=0;
      //--- If the cursor coordinates are converted to date and time
      if(ChartXYToTimePrice(ChartID(),(int)lparam,(int)dparam,wnd,time,price))
        {
         //--- write the bar index where the cursor is located to a global variable
         mouse_bar_index=iBarShift(Symbol(),PERIOD_CURRENT,time);
         //--- Display the bar data under the cursor on the panel
         DrawData(mouse_bar_index,time);
        }
     }

//--- If we received a custom event, display the appropriate message in the journal
   if(id>CHARTEVENT_CUSTOM)
     {
      //--- Here we can implement handling a click on the close button on the panel
      PrintFormat("%s: Event id=%ld, object id (lparam): %lu, event message (sparam): %s",__FUNCTION__,id,lparam,sparam);
     }
  }
//+------------------------------------------------------------------+
//| Display data from the specified timeseries index to the panel    |
//+------------------------------------------------------------------+
void DrawData(const int index,const datetime time)
  {
//--- Declare the variables to receive data in them
   MqlRates rates[1];

//--- Exit if unable to get the bar data by the specified index
   if(CopyRates(Symbol(),PERIOD_CURRENT,index,1,rates)!=1)
      return;

//--- Set font parameters for bar and indicator data headers
   int  size=0;
   uint flags=0;
   uint angle=0;
   string name=panel.FontParams(size,flags,angle);
   panel.SetFontParams(name,9,FW_BOLD);
   panel.DrawText("Bar data ["+(string)index+"]",3,panel.TableY1(0)-16,clrMaroon,panel.Width()-6);
   panel.DrawText("Indicators data ["+(string)index+"]",3,panel.TableY1(1)-16,clrGreen,panel.Width()-6);
//--- Set font parameters for bar and indicator data
   panel.SetFontParams(name,9);

//--- Display the data of the specified bar in table 0 on the panel
   panel.DrawText("Date",  panel.CellX(0,0,0)+2, panel.CellY(0,0,0)+2); panel.DrawText(TimeToString(  rates[0].time,TIME_DATE),     panel.CellX(0,0,1)+2, panel.CellY(0,0,1)+2,clrNONE,90);
   panel.DrawText("Time",  panel.CellX(0,1,0)+2, panel.CellY(0,1,0)+2); panel.DrawText(TimeToString(  rates[0].time,TIME_MINUTES),  panel.CellX(0,1,1)+2, panel.CellY(0,1,1)+2,clrNONE,90);
   panel.DrawText("Open",  panel.CellX(0,2,0)+2, panel.CellY(0,2,0)+2); panel.DrawText(DoubleToString(rates[0].open,Digits()),      panel.CellX(0,2,1)+2, panel.CellY(0,2,1)+2,clrNONE,90);
   panel.DrawText("High",  panel.CellX(0,3,0)+2, panel.CellY(0,3,0)+2); panel.DrawText(DoubleToString(rates[0].high,Digits()),      panel.CellX(0,3,1)+2, panel.CellY(0,3,1)+2,clrNONE,90);
   panel.DrawText("Low",   panel.CellX(0,4,0)+2, panel.CellY(0,4,0)+2); panel.DrawText(DoubleToString(rates[0].low,Digits()),       panel.CellX(0,4,1)+2, panel.CellY(0,4,1)+2,clrNONE,90);
   panel.DrawText("Close", panel.CellX(0,5,0)+2, panel.CellY(0,5,0)+2); panel.DrawText(DoubleToString(rates[0].close,Digits()),     panel.CellX(0,5,1)+2, panel.CellY(0,5,1)+2,clrNONE,90);

//--- Output the data of indicator 1 from the specified bar into table 1
   panel.DrawText(indicators.Title(macd1), panel.CellX(1,0,0)+2, panel.CellY(1,0,0)+2);
   double value1=indicators.GetData(macd1,0,0,index);
   string value_str1=(value1!=EMPTY_VALUE ? DoubleToString(value1,indicators.Digits(macd1)) : " ");
   panel.DrawText(value_str1,panel.CellX(1,0,1)+2,panel.CellY(1,0,1)+2,clrNONE,190);

//--- Display a description of the indicator 1 line state
   panel.DrawText("Line state", panel.CellX(1,1,0)+2, panel.CellY(1,1,0)+2);
   ENUM_LINE_STATE state1=indicators.BufferLineState(Symbol(),PERIOD_CURRENT,macd1,0,0,index);
   panel.DrawText(BufferLineStateDescription(state1),panel.CellX(1,1,1)+2,panel.CellY(1,1,1)+2,clrNONE,190);

//--- Output the data of indicator 2 from the specified bar into table 2
   panel.DrawText(indicators.Title(macd2), panel.CellX(2,0,0)+2, panel.CellY(2,0,0)+2);
   double value2=indicators.GetDataTo(Symbol(),PERIOD_CURRENT,macd2,0,0,index);
   string value_str2=(value2!=EMPTY_VALUE ? DoubleToString(value2,indicators.Digits(macd2)) : " ");
   panel.DrawText(value_str2,panel.CellX(2,0,1)+2,panel.CellY(2,0,1)+2,clrNONE,190);

//--- Display a description of the indicator 2 line state
   panel.DrawText("Line state", panel.CellX(2,1,0)+2, panel.CellY(2,1,0)+2);
   ENUM_LINE_STATE state2=indicators.BufferLineState(Symbol(),PERIOD_CURRENT,macd2,0,0,index);
   panel.DrawText(BufferLineStateDescription(state2),panel.CellX(2,1,1)+2,panel.CellY(2,1,1)+2,clrNONE,190);

//--- Display description of relationship between indicator 1 line relative to indicator 2 line
   double value21=indicators.GetDataTo(Symbol(),PERIOD_CURRENT,macd2,0,0,index+1);
   ENUM_LINE_STATE stateR=indicators.BufferLineStateRelative(Symbol(),PERIOD_CURRENT,macd1,0,0,index,value2,value21);
   string ma1=indicators.Name(macd1);
   string ma2=indicators.Name(macd2);
   string state_relative=
     (
      stateR==LINE_STATE_ABOVE      ? StringFormat("%s1 > %s2",ma1,ma2)   :
      stateR==LINE_STATE_BELOW      ? StringFormat("%s1 < %s2",ma1,ma2)           :
      stateR==LINE_STATE_CROSS_DOWN ? "Top-down crossing"   :
      stateR==LINE_STATE_CROSS_UP   ? "Bottom-up crossing"  :
      BufferLineStateDescription(stateR)
     );
   panel.DrawText(StringFormat("%s1 vs %s2",ma1,ma2), panel.CellX(2,2,0)+2, panel.CellY(2,2,0)+2);
   panel.DrawText(state_relative, panel.CellX(2,2,1)+2, panel.CellY(2,2,1)+2,clrNONE,190);

//--- Redraw the chart to immediately display all changes on the panel
   ChartRedraw(ChartID());
  }
//+------------------------------------------------------------------+
Nach dem Kompilieren und Starten des Indikators auf dem M1-Chart, wobei M5 für die Berechnungen ausgewählt wurde, sehen wir:
Der Indikator MA des Oszillator-Indikators:
//+------------------------------------------------------------------+
//|                                       TestMSTFMAofOscillator.mq5 |
//|                                  Copyright 2023, MetaQuotes Ltd. |
//|                                             https://www.mql5.com |
//+------------------------------------------------------------------+
#property copyright "Copyright 2023, MetaQuotes Ltd."
#property link      "https://www.mql5.com"
#property version   "1.00"
#property indicator_separate_window
#property indicator_buffers 2
#property indicator_plots   2
//--- enums

//--- plot OsMA1
#property indicator_label1  "OsMA1"
#property indicator_type1   DRAW_HISTOGRAM
#property indicator_color1  clrSeaGreen
#property indicator_style1  STYLE_SOLID
#property indicator_width1  1

//--- plot OsMA2
#property indicator_label2  "OsMA2"
#property indicator_type2   DRAW_HISTOGRAM
#property indicator_color2  clrDodgerBlue
#property indicator_style2  STYLE_SOLID
#property indicator_width2  1

//--- includes
#include <IndMSTF\IndMSTF.mqh>
#include <Dashboard\Dashboard.mqh>
//--- input parameters
input string               InpSymbol      =  NULL;             /* Symbol                     */ // Symbol
input ENUM_TIMEFRAMES      InpTimeframe   =  PERIOD_CURRENT;   /* Timeframe                  */ // Timeframe
input int                  InpFastPeriod  =  12;               /* Fast MA Period             */ // Fast EMA period
input int                  InpSlowPeriod  =  26;               /* Fast MA Period             */ // Slow EMA period
input int                  InpSignalPeriod=  9;                /* Signal Period              */ // Signal MA period
input ENUM_APPLIED_PRICE   InpPrice       =  PRICE_CLOSE;      /* Applied Price              */
input uchar                InpLineWidth1  =  2;                /* Senior period Line Width   */ // Line width for higher period
input uchar                InpLineWidth2  =  1;                /* Junior period Line Width   */ // Line width for lower period
input bool                 InpAsSeries    =  true;             /* As Series flag             */ // Timeseries flag of indicator buffer arrays

//--- indicator buffers
double         BufferOsMA1[];
double         BufferOsMA2[];
//--- global variables
int handle_osma1;
int handle_osma2;
CMSTFIndicators indicators;      // An instance of the indicator collection object
//--- variables for the panel
CDashboard *panel=NULL;          // Pointer to the panel object
int         mouse_bar_index;     // Index of the bar the data is taken from
//+------------------------------------------------------------------+
//| Custom indicator initialization function                         |
//+------------------------------------------------------------------+
int OnInit()
  {
//--- Set a timer with an interval of 1 second
   EventSetTimer(1);
//--- Assign the BufferMA1 and BufferMA2 arrays to the plot buffers 0 and 1, respectively
   SetIndexBuffer(0,BufferOsMA1,INDICATOR_DATA);
   SetIndexBuffer(1,BufferOsMA2,INDICATOR_DATA);
//--- Set the line width
   int w1=0,w2=0;
   if(InpTimeframe>Period())
     {
      w1=InpLineWidth2;
      w2=InpLineWidth1;
     }
   else
     {
      w1=InpLineWidth1;
      w2=InpLineWidth2;
     }
   PlotIndexSetInteger(0,PLOT_LINE_WIDTH,w1);
   PlotIndexSetInteger(1,PLOT_LINE_WIDTH,w2);
//--- sets indicator shift

//--- Set the timeseries flags for the indicator buffer arrays (for testing, to see that there is no difference)
   ArraySetAsSeries(BufferOsMA1,InpAsSeries);
   ArraySetAsSeries(BufferOsMA2,InpAsSeries);

//--- Create two indicators of the same type
//--- The first one is calculated on the current chart symbol/period, the second - on those specified in the settings
   handle_osma1=indicators.AddNewOsMA(NULL,PERIOD_CURRENT,InpFastPeriod,InpSlowPeriod,InpSignalPeriod,InpPrice);
   handle_osma2=indicators.AddNewOsMA(InpSymbol,InpTimeframe,InpFastPeriod,InpSlowPeriod,InpSignalPeriod,InpPrice);

//--- If failed to create indicator handles, return initialization error
   if(handle_osma1==INVALID_HANDLE || handle_osma2==INVALID_HANDLE)
      return INIT_FAILED;
//--- Set descriptions for indicator lines from buffer descriptions of calculation part of created indicators
   indicators.SetPlotLabelFromBuffer(0,handle_osma1,0);
   indicators.SetPlotLabelFromBuffer(1,handle_osma2,0);

//--- Dashboard
//--- Create the panel
   int width=301;
   panel=new CDashboard(1,20,20,width,264,0);
   if(panel==NULL)
     {
      Print("Error. Failed to create panel object");
      return INIT_FAILED;
     }
//--- Set font parameters
   panel.SetFontParams("Calibri",9);
//--- Display the panel with the "Symbol, Timeframe description" header text
   panel.View(Symbol()+", "+StringSubstr(EnumToString(Period()),7));

//--- Create a table with ID 0 to display bar data in it
   panel.CreateNewTable(0);
//--- Draw a table with ID 0 on the panel background
   panel.DrawGrid(0,2,20,6,2,18,width/2-2);

//--- Create a table with ID 1 to display the data of indicator 1
   panel.CreateNewTable(1);
//--- Get the Y2 table coordinate with ID 0 and
//--- set the Y1 coordinate for the table with ID 1
   int y1=panel.TableY2(0)+22;
//--- Draw a table with ID 1 on the panel background
   panel.DrawGrid(1,2,y1,2,2,18,width/2-2);

//--- Create a table with ID 2 to display the data of indicator 2
   panel.CreateNewTable(2);
//--- Get the Y2 coordinate of the table with ID 1 and
//--- set the Y1 coordinate for the table with ID 2
   int y2=panel.TableY2(1)+3;
//--- Draw a table with ID 2 on the background of the dashboard
   panel.DrawGrid(2,2,y2,3,2,18,width/2-2);

//--- Initialize the variable with the index of the mouse cursor bar
   mouse_bar_index=0;
//--- Display the data of the current bar on the panel
   DrawData(mouse_bar_index,TimeCurrent());

//--- Successful initialization
   return(INIT_SUCCEEDED);
  }
//+------------------------------------------------------------------+
//| Custom indicator deinitialization function                       |
//+------------------------------------------------------------------+
void OnDeinit(const int reason)
  {
//--- Delete the timer
   EventKillTimer();
//--- If the panel object exists, delete it
   if(panel!=NULL)
      delete panel;
//--- Delete all comments
   Comment("");
  }
//+------------------------------------------------------------------+
//| Custom indicator iteration function                              |
//+------------------------------------------------------------------+
int OnCalculate(const int rates_total,
                const int prev_calculated,
                const datetime &time[],
                const double &open[],
                const double &high[],
                const double &low[],
                const double &close[],
                const long &tick_volume[],
                const long &volume[],
                const int &spread[])
  {
//--- Number of bars for calculation
   int limit=rates_total-prev_calculated;
//--- If limit > 1, then this is the first calculation or change in the history
   if(limit>1)
     {
      //--- specify all the available history for calculation
      limit=rates_total-1;
      /*
      // If the indicator has any buffers that display other calculations (not multi-indicators),
      // initialize them here with the "empty" value set for these buffers
      */
     }
//--- Calculate all created multi-symbol multi-period indicators
   if(!indicators.Calculate())
      return 0;

//--- Display the bar data under cursor (or current bar if cursor is outside the chart) on the dashboard
   DrawData(mouse_bar_index,time[mouse_bar_index]);

//--- From buffers of calculated indicators, output data to indicator buffers
   if(!indicators.DataToBuffer(NULL,PERIOD_CURRENT,handle_osma1,0,0,limit,BufferOsMA1))
      return 0;
   if(!indicators.DataToBuffer(NULL,PERIOD_CURRENT,handle_osma2,0,0,limit,BufferOsMA2))
      return 0;

//--- return value of prev_calculated for the next call
   return(rates_total);
  }
//+------------------------------------------------------------------+
//| Timer function                                                   |
//+------------------------------------------------------------------+
void OnTimer()
  {
//--- Call the indicator collection timer
   indicators.OnTimer();
  }
//+------------------------------------------------------------------+
//| ChartEvent function                                              |
//+------------------------------------------------------------------+
void OnChartEvent(const int id,
                  const long &lparam,
                  const double &dparam,
                  const string &sparam)
  {
//--- Handling the panel
//--- Call the panel event handler
   panel.OnChartEvent(id,lparam,dparam,sparam);

//--- If the cursor moves or a click is made on the chart
   if(id==CHARTEVENT_MOUSE_MOVE || id==CHARTEVENT_CLICK)
     {
      //--- Declare the variables to record time and price coordinates in them
      datetime time=0;
      double price=0;
      int wnd=0;
      //--- If the cursor coordinates are converted to date and time
      if(ChartXYToTimePrice(ChartID(),(int)lparam,(int)dparam,wnd,time,price))
        {
         //--- write the bar index where the cursor is located to a global variable
         mouse_bar_index=iBarShift(Symbol(),PERIOD_CURRENT,time);
         //--- Display the bar data under the cursor on the panel
         DrawData(mouse_bar_index,time);
        }
     }

//--- If we received a custom event, display the appropriate message in the journal
   if(id>CHARTEVENT_CUSTOM)
     {
      //--- Here we can implement handling a click on the close button on the panel
      PrintFormat("%s: Event id=%ld, object id (lparam): %lu, event message (sparam): %s",__FUNCTION__,id,lparam,sparam);
     }
  }
//+------------------------------------------------------------------+
//| Display data from the specified timeseries index to the panel    |
//+------------------------------------------------------------------+
void DrawData(const int index,const datetime time)
  {
//--- Declare the variables to receive data in them
   MqlRates rates[1];

//--- Exit if unable to get the bar data by the specified index
   if(CopyRates(Symbol(),PERIOD_CURRENT,index,1,rates)!=1)
      return;

//--- Set font parameters for bar and indicator data headers
   int  size=0;
   uint flags=0;
   uint angle=0;
   string name=panel.FontParams(size,flags,angle);
   panel.SetFontParams(name,9,FW_BOLD);
   panel.DrawText("Bar data ["+(string)index+"]",3,panel.TableY1(0)-16,clrMaroon,panel.Width()-6);
   panel.DrawText("Indicators data ["+(string)index+"]",3,panel.TableY1(1)-16,clrGreen,panel.Width()-6);
//--- Set font parameters for bar and indicator data
   panel.SetFontParams(name,9);

//--- Display the data of the specified bar in table 0 on the panel
   panel.DrawText("Date",  panel.CellX(0,0,0)+2, panel.CellY(0,0,0)+2); panel.DrawText(TimeToString(  rates[0].time,TIME_DATE),     panel.CellX(0,0,1)+2, panel.CellY(0,0,1)+2,clrNONE,90);
   panel.DrawText("Time",  panel.CellX(0,1,0)+2, panel.CellY(0,1,0)+2); panel.DrawText(TimeToString(  rates[0].time,TIME_MINUTES),  panel.CellX(0,1,1)+2, panel.CellY(0,1,1)+2,clrNONE,90);
   panel.DrawText("Open",  panel.CellX(0,2,0)+2, panel.CellY(0,2,0)+2); panel.DrawText(DoubleToString(rates[0].open,Digits()),      panel.CellX(0,2,1)+2, panel.CellY(0,2,1)+2,clrNONE,90);
   panel.DrawText("High",  panel.CellX(0,3,0)+2, panel.CellY(0,3,0)+2); panel.DrawText(DoubleToString(rates[0].high,Digits()),      panel.CellX(0,3,1)+2, panel.CellY(0,3,1)+2,clrNONE,90);
   panel.DrawText("Low",   panel.CellX(0,4,0)+2, panel.CellY(0,4,0)+2); panel.DrawText(DoubleToString(rates[0].low,Digits()),       panel.CellX(0,4,1)+2, panel.CellY(0,4,1)+2,clrNONE,90);
   panel.DrawText("Close", panel.CellX(0,5,0)+2, panel.CellY(0,5,0)+2); panel.DrawText(DoubleToString(rates[0].close,Digits()),     panel.CellX(0,5,1)+2, panel.CellY(0,5,1)+2,clrNONE,90);

//--- Output the data of indicator 1 from the specified bar into table 1
   panel.DrawText(indicators.Title(handle_osma1), panel.CellX(1,0,0)+2, panel.CellY(1,0,0)+2);
   double value1=indicators.GetData(handle_osma1,0,0,index);
   string value_str1=(value1!=EMPTY_VALUE ? DoubleToString(value1,indicators.Digits(handle_osma1)) : " ");
   panel.DrawText(value_str1,panel.CellX(1,0,1)+2,panel.CellY(1,0,1)+2,clrNONE,190);

//--- Display a description of the indicator 1 line state
   panel.DrawText("Line state", panel.CellX(1,1,0)+2, panel.CellY(1,1,0)+2);
   ENUM_LINE_STATE state1=indicators.BufferLineState(Symbol(),PERIOD_CURRENT,handle_osma1,0,0,index);
   panel.DrawText(BufferLineStateDescription(state1),panel.CellX(1,1,1)+2,panel.CellY(1,1,1)+2,clrNONE,190);

//--- Output the data of indicator 2 from the specified bar into table 2
   panel.DrawText(indicators.Title(handle_osma2), panel.CellX(2,0,0)+2, panel.CellY(2,0,0)+2);
   double value2=indicators.GetDataTo(Symbol(),PERIOD_CURRENT,handle_osma2,0,0,index);
   string value_str2=(value2!=EMPTY_VALUE ? DoubleToString(value2,indicators.Digits(handle_osma2)) : " ");
   panel.DrawText(value_str2,panel.CellX(2,0,1)+2,panel.CellY(2,0,1)+2,clrNONE,190);

//--- Display a description of the indicator 2 line state
   panel.DrawText("Line state", panel.CellX(2,1,0)+2, panel.CellY(2,1,0)+2);
   ENUM_LINE_STATE state2=indicators.BufferLineState(Symbol(),PERIOD_CURRENT,handle_osma2,0,0,index);
   panel.DrawText(BufferLineStateDescription(state2),panel.CellX(2,1,1)+2,panel.CellY(2,1,1)+2,clrNONE,190);

//--- Display description of relationship between indicator 1 line relative to indicator 2 line
   double value21=indicators.GetDataTo(Symbol(),PERIOD_CURRENT,handle_osma2,0,0,index+1);
   ENUM_LINE_STATE stateR=indicators.BufferLineStateRelative(Symbol(),PERIOD_CURRENT,handle_osma1,0,0,index,value2,value21);
   string ma1=indicators.Name(handle_osma1);
   string ma2=indicators.Name(handle_osma2);
   string state_relative=
     (
      stateR==LINE_STATE_ABOVE      ? StringFormat("%s1 > %s2",ma1,ma2)   :
      stateR==LINE_STATE_BELOW      ? StringFormat("%s1 < %s2",ma1,ma2)           :
      stateR==LINE_STATE_CROSS_DOWN ? "Top-down crossing"   :
      stateR==LINE_STATE_CROSS_UP   ? "Bottom-up crossing"  :
      BufferLineStateDescription(stateR)
     );
   panel.DrawText(StringFormat("%s1 vs %s2",ma1,ma2), panel.CellX(2,2,0)+2, panel.CellY(2,2,0)+2);
   panel.DrawText(state_relative, panel.CellX(2,2,1)+2, panel.CellY(2,2,1)+2,clrNONE,190);

//--- Redraw the chart to immediately display all changes on the panel
   ChartRedraw(ChartID());
  }
//+------------------------------------------------------------------+
Nach dem Kompilieren und Starten des Indikators auf dem M1-Chart, wobei M5 für die Berechnungen ausgewählt wurde, sehen wir:
Der Indikator Market Facilitation Index:
//+------------------------------------------------------------------+
//|                              TestMSTFMarketFacilitationIndex.mq5 |
//|                                  Copyright 2023, MetaQuotes Ltd. |
//|                                             https://www.mql5.com |
//+------------------------------------------------------------------+
#property copyright "Copyright 2023, MetaQuotes Ltd."
#property link      "https://www.mql5.com"
#property version   "1.00"
#property indicator_separate_window
#property indicator_buffers 4
#property indicator_plots   2
//--- enums

//--- plot AC1
#property indicator_label1  "BWMFI1"
#property indicator_type1   DRAW_COLOR_HISTOGRAM
//#property indicator_color1  clrLime,clrSaddleBrown,clrBlue,clrPink // analog in line 98
#property indicator_style1  STYLE_SOLID
#property indicator_width1  1

//--- plot AC2
#property indicator_label2  "BWMFI2"
#property indicator_type2   DRAW_COLOR_HISTOGRAM
//#property indicator_color2  clrLime,clrSaddleBrown,clrBlue,clrPink // analog in line 99
#property indicator_style2  STYLE_SOLID
#property indicator_width2  1

//--- includes
#include <IndMSTF\IndMSTF.mqh>
#include <Dashboard\Dashboard.mqh>
//--- input parameters
input string               InpSymbol      =  NULL;             /* Symbol                     */ // Symbol
input ENUM_TIMEFRAMES      InpTimeframe   =  PERIOD_CURRENT;   /* Timeframe                  */ // Timeframe
input ENUM_APPLIED_VOLUME  InpVolume      =  VOLUME_TICK;      /* Applied Volume             */ // Used volume
input uchar                InpLineWidth1  =  2;                /* Senior period Line Width   */ // Line width for higher period
input uchar                InpLineWidth2  =  1;                /* Junior period Line Width   */ // Line width for lower period
input bool                 InpAsSeries    =  true;             /* As Series flag             */ // Timeseries flag of indicator buffer arrays

//--- indicator buffers
double         BufferBWMFI1[];
double         BufferClrBWMFI1[];
double         BufferBWMFI2[];
double         BufferClrBWMFI2[];
//--- global variables
int handle_bwmfi1;
int handle_bwmfi2;
CMSTFIndicators indicators;      // An instance of the indicator collection object
//--- variables for the panel
CDashboard *panel=NULL;          // Pointer to the panel object
int         mouse_bar_index;     // Index of the bar the data is taken from
//+------------------------------------------------------------------+
//| Custom indicator initialization function                         |
//+------------------------------------------------------------------+
int OnInit()
  {
//--- Set a timer with an interval of 1 second
   EventSetTimer(1);
//--- Assign arrays BufferBWMFI1 and BufferBWMFI2 to plot buffers 0 and 2, respectively,
//--- and color arrays BufferClrBWMFI1 and BufferClrBWMFI2 to buffers 1 and 3
   SetIndexBuffer(0,BufferBWMFI1,INDICATOR_DATA);
   SetIndexBuffer(1,BufferClrBWMFI1,INDICATOR_COLOR_INDEX);
   SetIndexBuffer(2,BufferBWMFI2,INDICATOR_DATA);
   SetIndexBuffer(3,BufferClrBWMFI2,INDICATOR_COLOR_INDEX);
//--- Set the line width
   int w1=0,w2=0;
   if(InpTimeframe>Period())
     {
      w1=InpLineWidth2;
      w2=InpLineWidth1;
     }
   else
     {
      w1=InpLineWidth1;
      w2=InpLineWidth2;
     }
   PlotIndexSetInteger(0,PLOT_LINE_WIDTH,w1);
   PlotIndexSetInteger(1,PLOT_LINE_WIDTH,w2);
//--- sets indicator shift

//--- Set the timeseries flags for the indicator buffer arrays (for testing, to see that there is no difference)
   ArraySetAsSeries(BufferBWMFI1,InpAsSeries);
   ArraySetAsSeries(BufferClrBWMFI1,InpAsSeries);
   ArraySetAsSeries(BufferBWMFI2,InpAsSeries);
   ArraySetAsSeries(BufferClrBWMFI2,InpAsSeries);

//--- Create two indicators of the same type
//--- The first one is calculated on the current chart symbol/period, the second - on those specified in the settings
   handle_bwmfi1=indicators.AddNewBWMFI(NULL,PERIOD_CURRENT,InpVolume);
   handle_bwmfi2=indicators.AddNewBWMFI(InpSymbol,InpTimeframe,InpVolume);

//--- If failed to create indicator handles, return initialization error
   if(handle_bwmfi1==INVALID_HANDLE || handle_bwmfi2==INVALID_HANDLE)
      return INIT_FAILED;
//--- Set indicator line descriptions from buffer descriptions of calculation part of created indicators
   indicators.SetPlotLabelFromBuffer(0,handle_bwmfi1,0);
   indicators.SetPlotLabelFromBuffer(1,handle_bwmfi2,0);
//--- Set colors for indicator lines from the buffer color set of calculation part of created indicators
   indicators.SetPlotColorsFromBuffer(0,handle_bwmfi1,0);
   indicators.SetPlotColorsFromBuffer(1,handle_bwmfi2,0);

//--- Dashboard
//--- Create the panel
   int width=247;
   panel=new CDashboard(1,20,20,width,264,0);
   if(panel==NULL)
     {
      Print("Error. Failed to create panel object");
      return INIT_FAILED;
     }
//--- Set font parameters
   panel.SetFontParams("Calibri",9);
//--- Display the panel with the "Symbol, Timeframe description" header text
   panel.View(Symbol()+", "+StringSubstr(EnumToString(Period()),7));

//--- Create a table with ID 0 to display bar data in it
   panel.CreateNewTable(0);
//--- Draw a table with ID 0 on the panel background
   panel.DrawGrid(0,2,20,6,2,18,width/2-2);

//--- Create a table with ID 1 to display the data of indicator 1
   panel.CreateNewTable(1);
//--- Get the Y2 table coordinate with ID 0 and
//--- set the Y1 coordinate for the table with ID 1
   int y1=panel.TableY2(0)+22;
//--- Draw a table with ID 1 on the panel background
   panel.DrawGrid(1,2,y1,2,2,18,width/2-2);

//--- Create a table with ID 2 to display the data of indicator 2
   panel.CreateNewTable(2);
//--- Get the Y2 coordinate of the table with ID 1 and
//--- set the Y1 coordinate for the table with ID 2
   int y2=panel.TableY2(1)+3;
//--- Draw a table with ID 2 on the background of the dashboard
   panel.DrawGrid(2,2,y2,3,2,18,width/2-2);

//--- Initialize the variable with the index of the mouse cursor bar
   mouse_bar_index=0;
//--- Display the data of the current bar on the panel
   DrawData(mouse_bar_index,TimeCurrent());

//--- Successful initialization
   return(INIT_SUCCEEDED);
  }
//+------------------------------------------------------------------+
//| Custom indicator deinitialization function                       |
//+------------------------------------------------------------------+
void OnDeinit(const int reason)
  {
//--- Delete the timer
   EventKillTimer();
//--- If the panel object exists, delete it
   if(panel!=NULL)
      delete panel;
//--- Delete all comments
   Comment("");
  }
//+------------------------------------------------------------------+
//| Custom indicator iteration function                              |
//+------------------------------------------------------------------+
int OnCalculate(const int rates_total,
                const int prev_calculated,
                const datetime &time[],
                const double &open[],
                const double &high[],
                const double &low[],
                const double &close[],
                const long &tick_volume[],
                const long &volume[],
                const int &spread[])
  {
//--- Number of bars for calculation
   int limit=rates_total-prev_calculated;
//--- If limit > 1, then this is the first calculation or change in the history
   if(limit>1)
     {
      //--- specify all the available history for calculation
      limit=rates_total-1;
      /*
      // If the indicator has any buffers that display other calculations (not multi-indicators),
      // initialize them here with the "empty" value set for these buffers
      */
     }
//--- Calculate all created multi-symbol multi-period indicators
   if(!indicators.Calculate())
      return 0;

//--- Display the bar data under cursor (or current bar if cursor is outside the chart) on the dashboard
   DrawData(mouse_bar_index,time[mouse_bar_index]);

//--- From buffers of calculated indicators, output data to indicator buffers
   if(!indicators.DataToColorBuffer(NULL,PERIOD_CURRENT,handle_bwmfi1,0,0,limit,BufferBWMFI1,BufferClrBWMFI1))
      return 0;
   if(!indicators.DataToColorBuffer(NULL,PERIOD_CURRENT,handle_bwmfi2,0,0,limit,BufferBWMFI2,BufferClrBWMFI2))
      return 0;

//--- return value of prev_calculated for the next call
   return(rates_total);
  }
//+------------------------------------------------------------------+
//| Timer function                                                   |
//+------------------------------------------------------------------+
void OnTimer()
  {
//--- Call the indicator collection timer
   indicators.OnTimer();
  }
//+------------------------------------------------------------------+
//| ChartEvent function                                              |
//+------------------------------------------------------------------+
void OnChartEvent(const int id,
                  const long &lparam,
                  const double &dparam,
                  const string &sparam)
  {
//--- Handling the panel
//--- Call the panel event handler
   panel.OnChartEvent(id,lparam,dparam,sparam);

//--- If the cursor moves or a click is made on the chart
   if(id==CHARTEVENT_MOUSE_MOVE || id==CHARTEVENT_CLICK)
     {
      //--- Declare the variables to record time and price coordinates in them
      datetime time=0;
      double price=0;
      int wnd=0;
      //--- If the cursor coordinates are converted to date and time
      if(ChartXYToTimePrice(ChartID(),(int)lparam,(int)dparam,wnd,time,price))
        {
         //--- write the bar index where the cursor is located to a global variable
         mouse_bar_index=iBarShift(Symbol(),PERIOD_CURRENT,time);
         //--- Display the bar data under the cursor on the panel
         DrawData(mouse_bar_index,time);
        }
     }

//--- If we received a custom event, display the appropriate message in the journal
   if(id>CHARTEVENT_CUSTOM)
     {
      //--- Here we can implement handling a click on the close button on the panel
      PrintFormat("%s: Event id=%ld, object id (lparam): %lu, event message (sparam): %s",__FUNCTION__,id,lparam,sparam);
     }
  }
//+------------------------------------------------------------------+
//| Display data from the specified timeseries index to the panel    |
//+------------------------------------------------------------------+
void DrawData(const int index,const datetime time)
  {
//--- Declare the variables to receive data in them
   MqlRates rates[1];

//--- Exit if unable to get the bar data by the specified index
   if(CopyRates(Symbol(),PERIOD_CURRENT,index,1,rates)!=1)
      return;

//--- Set font parameters for bar and indicator data headers
   int  size=0;
   uint flags=0;
   uint angle=0;
   string name=panel.FontParams(size,flags,angle);
   panel.SetFontParams(name,9,FW_BOLD);
   panel.DrawText("Bar data ["+(string)index+"]",3,panel.TableY1(0)-16,clrMaroon,panel.Width()-6);
   panel.DrawText("Indicators data ["+(string)index+"]",3,panel.TableY1(1)-16,clrGreen,panel.Width()-6);
//--- Set font parameters for bar and indicator data
   panel.SetFontParams(name,9);

//--- Display the data of the specified bar in table 0 on the panel
   panel.DrawText("Date",  panel.CellX(0,0,0)+2, panel.CellY(0,0,0)+2); panel.DrawText(TimeToString(  rates[0].time,TIME_DATE),     panel.CellX(0,0,1)+2, panel.CellY(0,0,1)+2,clrNONE,90);
   panel.DrawText("Time",  panel.CellX(0,1,0)+2, panel.CellY(0,1,0)+2); panel.DrawText(TimeToString(  rates[0].time,TIME_MINUTES),  panel.CellX(0,1,1)+2, panel.CellY(0,1,1)+2,clrNONE,90);
   panel.DrawText("Open",  panel.CellX(0,2,0)+2, panel.CellY(0,2,0)+2); panel.DrawText(DoubleToString(rates[0].open,Digits()),      panel.CellX(0,2,1)+2, panel.CellY(0,2,1)+2,clrNONE,90);
   panel.DrawText("High",  panel.CellX(0,3,0)+2, panel.CellY(0,3,0)+2); panel.DrawText(DoubleToString(rates[0].high,Digits()),      panel.CellX(0,3,1)+2, panel.CellY(0,3,1)+2,clrNONE,90);
   panel.DrawText("Low",   panel.CellX(0,4,0)+2, panel.CellY(0,4,0)+2); panel.DrawText(DoubleToString(rates[0].low,Digits()),       panel.CellX(0,4,1)+2, panel.CellY(0,4,1)+2,clrNONE,90);
   panel.DrawText("Close", panel.CellX(0,5,0)+2, panel.CellY(0,5,0)+2); panel.DrawText(DoubleToString(rates[0].close,Digits()),     panel.CellX(0,5,1)+2, panel.CellY(0,5,1)+2,clrNONE,90);

//--- Output the data of indicator 1 from the specified bar into table 1
   panel.DrawText(indicators.Title(handle_bwmfi1), panel.CellX(1,0,0)+2, panel.CellY(1,0,0)+2);
   double value1=indicators.GetData(handle_bwmfi1,0,0,index);
   string value_str1=(value1!=EMPTY_VALUE ? DoubleToString(value1,indicators.Digits(handle_bwmfi1)) : " ");
   panel.DrawText(value_str1,panel.CellX(1,0,1)+2,panel.CellY(1,0,1)+2,clrNONE,110);

//--- Display a description of the indicator 1 line state
   panel.DrawText("Line state", panel.CellX(1,1,0)+2, panel.CellY(1,1,0)+2);
   ENUM_LINE_STATE state1=indicators.BufferLineState(Symbol(),PERIOD_CURRENT,handle_bwmfi1,0,0,index);
   panel.DrawText(BufferLineStateDescription(state1),panel.CellX(1,1,1)+2,panel.CellY(1,1,1)+2,clrNONE,110);

//--- Output the data of indicator 2 from the specified bar into table 2
   panel.DrawText(indicators.Title(handle_bwmfi2), panel.CellX(2,0,0)+2, panel.CellY(2,0,0)+2);
   double value2=indicators.GetDataTo(Symbol(),PERIOD_CURRENT,handle_bwmfi2,0,0,index);
   string value_str2=(value2!=EMPTY_VALUE ? DoubleToString(value2,indicators.Digits(handle_bwmfi2)) : " ");
   panel.DrawText(value_str2,panel.CellX(2,0,1)+2,panel.CellY(2,0,1)+2,clrNONE,110);

//--- Display a description of the indicator 2 line state
   panel.DrawText("Line state", panel.CellX(2,1,0)+2, panel.CellY(2,1,0)+2);
   ENUM_LINE_STATE state2=indicators.BufferLineState(Symbol(),PERIOD_CURRENT,handle_bwmfi2,0,0,index);
   panel.DrawText(BufferLineStateDescription(state2),panel.CellX(2,1,1)+2,panel.CellY(2,1,1)+2,clrNONE,110);

//--- Display description of relationship between indicator 1 line relative to indicator 2 line
   double value21=indicators.GetDataTo(Symbol(),PERIOD_CURRENT,handle_bwmfi2,0,0,index+1);
   ENUM_LINE_STATE stateR=indicators.BufferLineStateRelative(Symbol(),PERIOD_CURRENT,handle_bwmfi1,0,0,index,value2,value21);
   string ma1=indicators.Name(handle_bwmfi1);
   string ma2=indicators.Name(handle_bwmfi2);
   string state_relative=
     (
      stateR==LINE_STATE_ABOVE      ? StringFormat("%s1 > %s2",ma1,ma2)   :
      stateR==LINE_STATE_BELOW      ? StringFormat("%s1 < %s2",ma1,ma2)           :
      stateR==LINE_STATE_CROSS_DOWN ? "Top-down crossing"   :
      stateR==LINE_STATE_CROSS_UP   ? "Bottom-up crossing"  :
      BufferLineStateDescription(stateR)
     );
   panel.DrawText(StringFormat("%s1 vs %s2",ma1,ma2), panel.CellX(2,2,0)+2, panel.CellY(2,2,0)+2);
   panel.DrawText(state_relative, panel.CellX(2,2,1)+2, panel.CellY(2,2,1)+2,clrNONE,110);

//--- Redraw the chart to immediately display all changes on the panel
   ChartRedraw(ChartID());
  }
//+------------------------------------------------------------------+
Nach dem Kompilieren und Starten des Indikators auf dem M1-Chart, wobei M5 für die Berechnungen ausgewählt wurde, sehen wir:
Der Indikator Momentum:
//+------------------------------------------------------------------+
//|                                             TestMSTFMomentum.mq5 |
//|                                  Copyright 2023, MetaQuotes Ltd. |
//|                                             https://www.mql5.com |
//+------------------------------------------------------------------+
#property copyright "Copyright 2023, MetaQuotes Ltd."
#property link      "https://www.mql5.com"
#property version   "1.00"
#property indicator_separate_window
#property indicator_buffers 2
#property indicator_plots   2
//--- enums

//--- plot Momentum1
#property indicator_label1  "Momentum1"
#property indicator_type1   DRAW_LINE
#property indicator_color1  clrSeaGreen
#property indicator_style1  STYLE_SOLID
#property indicator_width1  1

//--- plot Momentum2
#property indicator_label2  "Momentum2"
#property indicator_type2   DRAW_LINE
#property indicator_color2  clrDodgerBlue
#property indicator_style2  STYLE_SOLID
#property indicator_width2  1

//--- includes
#include <IndMSTF\IndMSTF.mqh>
#include <Dashboard\Dashboard.mqh>
//--- input parameters
input string               InpSymbol      =  NULL;             /* Symbol                     */ // Symbol
input ENUM_TIMEFRAMES      InpTimeframe   =  PERIOD_CURRENT;   /* Timeframe                  */ // Timeframe
input int                  InpPeriod      =  14;               /* Period                     */ // Calculation period
input ENUM_APPLIED_PRICE   InpPrice       =  PRICE_CLOSE;      /* Applied Price              */
input uchar                InpLineWidth1  =  2;                /* Senior period Line Width   */ // Line width for higher period
input uchar                InpLineWidth2  =  1;                /* Junior period Line Width   */ // Line width for lower period
input bool                 InpAsSeries    =  true;             /* As Series flag             */ // Timeseries flag of indicator buffer arrays

//--- indicator buffers
double         BufferMomentum1[];
double         BufferMomentum2[];
//--- global variables
int handle_mom1;
int handle_mom2;
CMSTFIndicators indicators;      // An instance of the indicator collection object
//--- variables for the panel
CDashboard *panel=NULL;          // Pointer to the panel object
int         mouse_bar_index;     // Index of the bar the data is taken from
//+------------------------------------------------------------------+
//| Custom indicator initialization function                         |
//+------------------------------------------------------------------+
int OnInit()
  {
//--- Set a timer with an interval of 1 second
   EventSetTimer(1);
//--- Assign the BufferMA1 and BufferMA2 arrays to the plot buffers 0 and 1, respectively
   SetIndexBuffer(0,BufferMomentum1,INDICATOR_DATA);
   SetIndexBuffer(1,BufferMomentum2,INDICATOR_DATA);
//--- Set the line width
   int w1=0,w2=0;
   if(InpTimeframe>Period())
     {
      w1=InpLineWidth2;
      w2=InpLineWidth1;
     }
   else
     {
      w1=InpLineWidth1;
      w2=InpLineWidth2;
     }
   PlotIndexSetInteger(0,PLOT_LINE_WIDTH,w1);
   PlotIndexSetInteger(1,PLOT_LINE_WIDTH,w2);
//--- sets indicator shift

//--- Set the timeseries flags for the indicator buffer arrays (for testing, to see that there is no difference)
   ArraySetAsSeries(BufferMomentum1,InpAsSeries);
   ArraySetAsSeries(BufferMomentum2,InpAsSeries);

//--- Create two indicators of the same type
//--- The first one is calculated on the current chart symbol/period, the second - on those specified in the settings
   handle_mom1=indicators.AddNewMomentum(NULL,PERIOD_CURRENT,InpPeriod,InpPrice);
   handle_mom2=indicators.AddNewMomentum(InpSymbol,InpTimeframe,InpPeriod,InpPrice);

//--- If failed to create indicator handles, return initialization error
   if(handle_mom1==INVALID_HANDLE || handle_mom2==INVALID_HANDLE)
      return INIT_FAILED;
//--- Set descriptions for indicator lines from buffer descriptions of calculation part of created indicators
   indicators.SetPlotLabelFromBuffer(0,handle_mom1,0);
   indicators.SetPlotLabelFromBuffer(1,handle_mom2,0);

//--- Dashboard
//--- Create the panel
   int width=317;
   panel=new CDashboard(1,20,20,width,264,0);
   if(panel==NULL)
     {
      Print("Error. Failed to create panel object");
      return INIT_FAILED;
     }
//--- Set font parameters
   panel.SetFontParams("Calibri",9);
//--- Display the panel with the "Symbol, Timeframe description" header text
   panel.View(Symbol()+", "+StringSubstr(EnumToString(Period()),7));

//--- Create a table with ID 0 to display bar data in it
   panel.CreateNewTable(0);
//--- Draw a table with ID 0 on the panel background
   panel.DrawGrid(0,2,20,6,2,18,width/2-2);

//--- Create a table with ID 1 to display the data of indicator 1
   panel.CreateNewTable(1);
//--- Get the Y2 table coordinate with ID 0 and
//--- set the Y1 coordinate for the table with ID 1
   int y1=panel.TableY2(0)+22;
//--- Draw a table with ID 1 on the panel background
   panel.DrawGrid(1,2,y1,2,2,18,width/2-2);

//--- Create a table with ID 2 to display the data of indicator 2
   panel.CreateNewTable(2);
//--- Get the Y2 coordinate of the table with ID 1 and
//--- set the Y1 coordinate for the table with ID 2
   int y2=panel.TableY2(1)+3;
//--- Draw a table with ID 2 on the background of the dashboard
   panel.DrawGrid(2,2,y2,3,2,18,width/2-2);

//--- Initialize the variable with the index of the mouse cursor bar
   mouse_bar_index=0;
//--- Display the data of the current bar on the panel
   DrawData(mouse_bar_index,TimeCurrent());

//--- Successful initialization
   return(INIT_SUCCEEDED);
  }
//+------------------------------------------------------------------+
//| Custom indicator deinitialization function                       |
//+------------------------------------------------------------------+
void OnDeinit(const int reason)
  {
//--- Delete the timer
   EventKillTimer();
//--- If the panel object exists, delete it
   if(panel!=NULL)
      delete panel;
//--- Delete all comments
   Comment("");
  }
//+------------------------------------------------------------------+
//| Custom indicator iteration function                              |
//+------------------------------------------------------------------+
int OnCalculate(const int rates_total,
                const int prev_calculated,
                const datetime &time[],
                const double &open[],
                const double &high[],
                const double &low[],
                const double &close[],
                const long &tick_volume[],
                const long &volume[],
                const int &spread[])
  {
//--- Number of bars for calculation
   int limit=rates_total-prev_calculated;
//--- If limit > 1, then this is the first calculation or change in the history
   if(limit>1)
     {
      //--- specify all the available history for calculation
      limit=rates_total-1;
      /*
      // If the indicator has any buffers that display other calculations (not multi-indicators),
      // initialize them here with the "empty" value set for these buffers
      */
     }
//--- Calculate all created multi-symbol multi-period indicators
   if(!indicators.Calculate())
      return 0;

//--- Display the bar data under cursor (or current bar if cursor is outside the chart) on the dashboard
   DrawData(mouse_bar_index,time[mouse_bar_index]);

//--- From buffers of calculated indicators, output data to indicator buffers
   if(!indicators.DataToBuffer(NULL,PERIOD_CURRENT,handle_mom1,0,0,limit,BufferMomentum1))
      return 0;
   if(!indicators.DataToBuffer(NULL,PERIOD_CURRENT,handle_mom2,0,0,limit,BufferMomentum2))
      return 0;

//--- return value of prev_calculated for the next call
   return(rates_total);
  }
//+------------------------------------------------------------------+
//| Timer function                                                   |
//+------------------------------------------------------------------+
void OnTimer()
  {
//--- Call the indicator collection timer
   indicators.OnTimer();
  }
//+------------------------------------------------------------------+
//| ChartEvent function                                              |
//+------------------------------------------------------------------+
void OnChartEvent(const int id,
                  const long &lparam,
                  const double &dparam,
                  const string &sparam)
  {
//--- Handling the panel
//--- Call the panel event handler
   panel.OnChartEvent(id,lparam,dparam,sparam);

//--- If the cursor moves or a click is made on the chart
   if(id==CHARTEVENT_MOUSE_MOVE || id==CHARTEVENT_CLICK)
     {
      //--- Declare the variables to record time and price coordinates in them
      datetime time=0;
      double price=0;
      int wnd=0;
      //--- If the cursor coordinates are converted to date and time
      if(ChartXYToTimePrice(ChartID(),(int)lparam,(int)dparam,wnd,time,price))
        {
         //--- write the bar index where the cursor is located to a global variable
         mouse_bar_index=iBarShift(Symbol(),PERIOD_CURRENT,time);
         //--- Display the bar data under the cursor on the panel
         DrawData(mouse_bar_index,time);
        }
     }

//--- If we received a custom event, display the appropriate message in the journal
   if(id>CHARTEVENT_CUSTOM)
     {
      //--- Here we can implement handling a click on the close button on the panel
      PrintFormat("%s: Event id=%ld, object id (lparam): %lu, event message (sparam): %s",__FUNCTION__,id,lparam,sparam);
     }
  }
//+------------------------------------------------------------------+
//| Display data from the specified timeseries index to the panel    |
//+------------------------------------------------------------------+
void DrawData(const int index,const datetime time)
  {
//--- Declare the variables to receive data in them
   MqlRates rates[1];

//--- Exit if unable to get the bar data by the specified index
   if(CopyRates(Symbol(),PERIOD_CURRENT,index,1,rates)!=1)
      return;

//--- Set font parameters for bar and indicator data headers
   int  size=0;
   uint flags=0;
   uint angle=0;
   string name=panel.FontParams(size,flags,angle);
   panel.SetFontParams(name,9,FW_BOLD);
   panel.DrawText("Bar data ["+(string)index+"]",3,panel.TableY1(0)-16,clrMaroon,panel.Width()-6);
   panel.DrawText("Indicators data ["+(string)index+"]",3,panel.TableY1(1)-16,clrGreen,panel.Width()-6);
//--- Set font parameters for bar and indicator data
   panel.SetFontParams(name,9);

//--- Display the data of the specified bar in table 0 on the panel
   panel.DrawText("Date",  panel.CellX(0,0,0)+2, panel.CellY(0,0,0)+2); panel.DrawText(TimeToString(  rates[0].time,TIME_DATE),     panel.CellX(0,0,1)+2, panel.CellY(0,0,1)+2,clrNONE,90);
   panel.DrawText("Time",  panel.CellX(0,1,0)+2, panel.CellY(0,1,0)+2); panel.DrawText(TimeToString(  rates[0].time,TIME_MINUTES),  panel.CellX(0,1,1)+2, panel.CellY(0,1,1)+2,clrNONE,90);
   panel.DrawText("Open",  panel.CellX(0,2,0)+2, panel.CellY(0,2,0)+2); panel.DrawText(DoubleToString(rates[0].open,Digits()),      panel.CellX(0,2,1)+2, panel.CellY(0,2,1)+2,clrNONE,90);
   panel.DrawText("High",  panel.CellX(0,3,0)+2, panel.CellY(0,3,0)+2); panel.DrawText(DoubleToString(rates[0].high,Digits()),      panel.CellX(0,3,1)+2, panel.CellY(0,3,1)+2,clrNONE,90);
   panel.DrawText("Low",   panel.CellX(0,4,0)+2, panel.CellY(0,4,0)+2); panel.DrawText(DoubleToString(rates[0].low,Digits()),       panel.CellX(0,4,1)+2, panel.CellY(0,4,1)+2,clrNONE,90);
   panel.DrawText("Close", panel.CellX(0,5,0)+2, panel.CellY(0,5,0)+2); panel.DrawText(DoubleToString(rates[0].close,Digits()),     panel.CellX(0,5,1)+2, panel.CellY(0,5,1)+2,clrNONE,90);

//--- Output the data of indicator 1 from the specified bar into table 1
   panel.DrawText(indicators.Title(handle_mom1), panel.CellX(1,0,0)+2, panel.CellY(1,0,0)+2);
   double value1=indicators.GetData(handle_mom1,0,0,index);
   string value_str1=(value1!=EMPTY_VALUE ? DoubleToString(value1,indicators.Digits(handle_mom1)) : " ");
   panel.DrawText(value_str1,panel.CellX(1,0,1)+2,panel.CellY(1,0,1)+2,clrNONE,190);

//--- Display a description of the indicator 1 line state
   panel.DrawText("Line state", panel.CellX(1,1,0)+2, panel.CellY(1,1,0)+2);
   ENUM_LINE_STATE state1=indicators.BufferLineState(Symbol(),PERIOD_CURRENT,handle_mom1,0,0,index);
   panel.DrawText(BufferLineStateDescription(state1),panel.CellX(1,1,1)+2,panel.CellY(1,1,1)+2,clrNONE,190);

//--- Output the data of indicator 2 from the specified bar into table 2
   panel.DrawText(indicators.Title(handle_mom2), panel.CellX(2,0,0)+2, panel.CellY(2,0,0)+2);
   double value2=indicators.GetDataTo(Symbol(),PERIOD_CURRENT,handle_mom2,0,0,index);
   string value_str2=(value2!=EMPTY_VALUE ? DoubleToString(value2,indicators.Digits(handle_mom2)) : " ");
   panel.DrawText(value_str2,panel.CellX(2,0,1)+2,panel.CellY(2,0,1)+2,clrNONE,190);

//--- Display a description of the indicator 2 line state
   panel.DrawText("Line state", panel.CellX(2,1,0)+2, panel.CellY(2,1,0)+2);
   ENUM_LINE_STATE state2=indicators.BufferLineState(Symbol(),PERIOD_CURRENT,handle_mom2,0,0,index);
   panel.DrawText(BufferLineStateDescription(state2),panel.CellX(2,1,1)+2,panel.CellY(2,1,1)+2,clrNONE,190);

//--- Display description of relationship between indicator 1 line relative to indicator 2 line
   double value21=indicators.GetDataTo(Symbol(),PERIOD_CURRENT,handle_mom2,0,0,index+1);
   ENUM_LINE_STATE stateR=indicators.BufferLineStateRelative(Symbol(),PERIOD_CURRENT,handle_mom1,0,0,index,value2,value21);
   string ma1=indicators.Name(handle_mom1);
   string ma2=indicators.Name(handle_mom2);
   string state_relative=
     (
      stateR==LINE_STATE_ABOVE      ? StringFormat("%s1 > %s2",ma1,ma2)   :
      stateR==LINE_STATE_BELOW      ? StringFormat("%s1 < %s2",ma1,ma2)           :
      stateR==LINE_STATE_CROSS_DOWN ? "Top-down crossing"   :
      stateR==LINE_STATE_CROSS_UP   ? "Bottom-up crossing"  :
      BufferLineStateDescription(stateR)
     );
   panel.DrawText(StringFormat("%s1 vs %s2",ma1,ma2), panel.CellX(2,2,0)+2, panel.CellY(2,2,0)+2);
   panel.DrawText(state_relative, panel.CellX(2,2,1)+2, panel.CellY(2,2,1)+2,clrNONE,190);

//--- Redraw the chart to immediately display all changes on the panel
   ChartRedraw(ChartID());
  }
//+------------------------------------------------------------------+
Nach dem Kompilieren und Starten des Indikators auf dem M1-Chart, wobei M5 für die Berechnungen ausgewählt wurde, sehen wir:
Der Indikator Money Flow Index:
//+------------------------------------------------------------------+
//|                                       TestMSTFMoneyFlowIndex.mq5 |
//|                                  Copyright 2023, MetaQuotes Ltd. |
//|                                             https://www.mql5.com |
//+------------------------------------------------------------------+
#property copyright "Copyright 2023, MetaQuotes Ltd."
#property link      "https://www.mql5.com"
#property version   "1.00"
#property indicator_separate_window
#property indicator_buffers 2
#property indicator_plots   2
//--- enums

//--- plot MFI1
#property indicator_label1  "MFI1"
#property indicator_type1   DRAW_LINE
#property indicator_color1  clrDodgerBlue
#property indicator_style1  STYLE_SOLID
#property indicator_width1  1

//--- plot MFI2
#property indicator_label2  "MFI2"
#property indicator_type2   DRAW_LINE
#property indicator_color2  clrRed
#property indicator_style2  STYLE_SOLID
#property indicator_width2  1

//--- includes
#include <IndMSTF\IndMSTF.mqh>
#include <Dashboard\Dashboard.mqh>
//--- input parameters
input string               InpSymbol      =  NULL;             /* Symbol                     */ // Symbol
input ENUM_TIMEFRAMES      InpTimeframe   =  PERIOD_CURRENT;   /* Timeframe                  */ // Timeframe
input int                  InpPeriod      =  14;               /* Period                     */ // Calculation period
input ENUM_APPLIED_VOLUME  InpVolume      =  VOLUME_TICK;      /* Applied Volume             */ // Volume used for calculations
input uchar                InpLineWidth1  =  2;                /* Senior period Line Width   */ // Line width for higher period
input uchar                InpLineWidth2  =  1;                /* Junior period Line Width   */ // Line width for lower period
input bool                 InpAsSeries    =  true;             /* As Series flag             */ // Timeseries flag of indicator buffer arrays

//--- indicator buffers
double         BufferMFI1[];
double         BufferMFI2[];
//--- global variables
int handle_mfi1;
int handle_mfi2;
CMSTFIndicators indicators;      // An instance of the indicator collection object
//--- variables for the panel
CDashboard *panel=NULL;          // Pointer to the panel object
int         mouse_bar_index;     // Index of the bar the data is taken from
//+------------------------------------------------------------------+
//| Custom indicator initialization function                         |
//+------------------------------------------------------------------+
int OnInit()
  {
//--- Set a timer with an interval of 1 second
   EventSetTimer(1);
//--- Assign the BufferMA1 and BufferMA2 arrays to the plot buffers 0 and 1, respectively
   SetIndexBuffer(0,BufferMFI1,INDICATOR_DATA);
   SetIndexBuffer(1,BufferMFI2,INDICATOR_DATA);
//--- Set the line width
   int w1=0,w2=0;
   if(InpTimeframe>Period())
     {
      w1=InpLineWidth2;
      w2=InpLineWidth1;
     }
   else
     {
      w1=InpLineWidth1;
      w2=InpLineWidth2;
     }
   PlotIndexSetInteger(0,PLOT_LINE_WIDTH,w1);
   PlotIndexSetInteger(1,PLOT_LINE_WIDTH,w2);
//--- sets indicator shift

//--- Set the timeseries flags for the indicator buffer arrays (for testing, to see that there is no difference)
   ArraySetAsSeries(BufferMFI1,InpAsSeries);
   ArraySetAsSeries(BufferMFI2,InpAsSeries);

//--- Create two indicators of the same type
//--- The first one is calculated on the current chart symbol/period, the second - on those specified in the settings
   handle_mfi1=indicators.AddNewMFI(NULL,PERIOD_CURRENT,InpPeriod,InpVolume);
   handle_mfi2=indicators.AddNewMFI(InpSymbol,InpTimeframe,InpPeriod,InpVolume);

//--- If failed to create indicator handles, return initialization error
   if(handle_mfi1==INVALID_HANDLE || handle_mfi2==INVALID_HANDLE)
      return INIT_FAILED;
//--- Set descriptions for indicator lines from buffer descriptions of calculation part of created indicators
   indicators.SetPlotLabelFromBuffer(0,handle_mfi1,0);
   indicators.SetPlotLabelFromBuffer(1,handle_mfi2,0);

//--- Dashboard
//--- Create the panel
   int width=237;
   panel=new CDashboard(1,20,20,width,264,0);
   if(panel==NULL)
     {
      Print("Error. Failed to create panel object");
      return INIT_FAILED;
     }
//--- Set font parameters
   panel.SetFontParams("Calibri",9);
//--- Display the panel with the "Symbol, Timeframe description" header text
   panel.View(Symbol()+", "+StringSubstr(EnumToString(Period()),7));

//--- Create a table with ID 0 to display bar data in it
   panel.CreateNewTable(0);
//--- Draw a table with ID 0 on the panel background
   panel.DrawGrid(0,2,20,6,2,18,width/2-2);

//--- Create a table with ID 1 to display the data of indicator 1
   panel.CreateNewTable(1);
//--- Get the Y2 table coordinate with ID 0 and
//--- set the Y1 coordinate for the table with ID 1
   int y1=panel.TableY2(0)+22;
//--- Draw a table with ID 1 on the panel background
   panel.DrawGrid(1,2,y1,2,2,18,width/2-2);

//--- Create a table with ID 2 to display the data of indicator 2
   panel.CreateNewTable(2);
//--- Get the Y2 coordinate of the table with ID 1 and
//--- set the Y1 coordinate for the table with ID 2
   int y2=panel.TableY2(1)+3;
//--- Draw a table with ID 2 on the background of the dashboard
   panel.DrawGrid(2,2,y2,3,2,18,width/2-2);

//--- Initialize the variable with the index of the mouse cursor bar
   mouse_bar_index=0;
//--- Display the data of the current bar on the panel
   DrawData(mouse_bar_index,TimeCurrent());

//--- Successful initialization
   return(INIT_SUCCEEDED);
  }
//+------------------------------------------------------------------+
//| Custom indicator deinitialization function                       |
//+------------------------------------------------------------------+
void OnDeinit(const int reason)
  {
//--- Delete the timer
   EventKillTimer();
//--- If the panel object exists, delete it
   if(panel!=NULL)
      delete panel;
//--- Delete all comments
   Comment("");
  }
//+------------------------------------------------------------------+
//| Custom indicator iteration function                              |
//+------------------------------------------------------------------+
int OnCalculate(const int rates_total,
                const int prev_calculated,
                const datetime &time[],
                const double &open[],
                const double &high[],
                const double &low[],
                const double &close[],
                const long &tick_volume[],
                const long &volume[],
                const int &spread[])
  {
//--- Number of bars for calculation
   int limit=rates_total-prev_calculated;
//--- If limit > 1, then this is the first calculation or change in the history
   if(limit>1)
     {
      //--- specify all the available history for calculation
      limit=rates_total-1;
      /*
      // If the indicator has any buffers that display other calculations (not multi-indicators),
      // initialize them here with the "empty" value set for these buffers
      */
     }
//--- Calculate all created multi-symbol multi-period indicators
   if(!indicators.Calculate())
      return 0;

//--- Display the bar data under cursor (or current bar if cursor is outside the chart) on the dashboard
   DrawData(mouse_bar_index,time[mouse_bar_index]);

//--- From buffers of calculated indicators, output data to indicator buffers
   if(!indicators.DataToBuffer(NULL,PERIOD_CURRENT,handle_mfi1,0,0,limit,BufferMFI1))
      return 0;
   if(!indicators.DataToBuffer(NULL,PERIOD_CURRENT,handle_mfi2,0,0,limit,BufferMFI2))
      return 0;

//--- return value of prev_calculated for the next call
   return(rates_total);
  }
//+------------------------------------------------------------------+
//| Timer function                                                   |
//+------------------------------------------------------------------+
void OnTimer()
  {
//--- Call the indicator collection timer
   indicators.OnTimer();
  }
//+------------------------------------------------------------------+
//| ChartEvent function                                              |
//+------------------------------------------------------------------+
void OnChartEvent(const int id,
                  const long &lparam,
                  const double &dparam,
                  const string &sparam)
  {
//--- Handling the panel
//--- Call the panel event handler
   panel.OnChartEvent(id,lparam,dparam,sparam);

//--- If the cursor moves or a click is made on the chart
   if(id==CHARTEVENT_MOUSE_MOVE || id==CHARTEVENT_CLICK)
     {
      //--- Declare the variables to record time and price coordinates in them
      datetime time=0;
      double price=0;
      int wnd=0;
      //--- If the cursor coordinates are converted to date and time
      if(ChartXYToTimePrice(ChartID(),(int)lparam,(int)dparam,wnd,time,price))
        {
         //--- write the bar index where the cursor is located to a global variable
         mouse_bar_index=iBarShift(Symbol(),PERIOD_CURRENT,time);
         //--- Display the bar data under the cursor on the panel
         DrawData(mouse_bar_index,time);
        }
     }

//--- If we received a custom event, display the appropriate message in the journal
   if(id>CHARTEVENT_CUSTOM)
     {
      //--- Here we can implement handling a click on the close button on the panel
      PrintFormat("%s: Event id=%ld, object id (lparam): %lu, event message (sparam): %s",__FUNCTION__,id,lparam,sparam);
     }
  }
//+------------------------------------------------------------------+
//| Display data from the specified timeseries index to the panel    |
//+------------------------------------------------------------------+
void DrawData(const int index,const datetime time)
  {
//--- Declare the variables to receive data in them
   MqlRates rates[1];

//--- Exit if unable to get the bar data by the specified index
   if(CopyRates(Symbol(),PERIOD_CURRENT,index,1,rates)!=1)
      return;

//--- Set font parameters for bar and indicator data headers
   int  size=0;
   uint flags=0;
   uint angle=0;
   string name=panel.FontParams(size,flags,angle);
   panel.SetFontParams(name,9,FW_BOLD);
   panel.DrawText("Bar data ["+(string)index+"]",3,panel.TableY1(0)-16,clrMaroon,panel.Width()-6);
   panel.DrawText("Indicators data ["+(string)index+"]",3,panel.TableY1(1)-16,clrGreen,panel.Width()-6);
//--- Set font parameters for bar and indicator data
   panel.SetFontParams(name,9);

//--- Display the data of the specified bar in table 0 on the panel
   panel.DrawText("Date",  panel.CellX(0,0,0)+2, panel.CellY(0,0,0)+2); panel.DrawText(TimeToString(  rates[0].time,TIME_DATE),     panel.CellX(0,0,1)+2, panel.CellY(0,0,1)+2,clrNONE,90);
   panel.DrawText("Time",  panel.CellX(0,1,0)+2, panel.CellY(0,1,0)+2); panel.DrawText(TimeToString(  rates[0].time,TIME_MINUTES),  panel.CellX(0,1,1)+2, panel.CellY(0,1,1)+2,clrNONE,90);
   panel.DrawText("Open",  panel.CellX(0,2,0)+2, panel.CellY(0,2,0)+2); panel.DrawText(DoubleToString(rates[0].open,Digits()),      panel.CellX(0,2,1)+2, panel.CellY(0,2,1)+2,clrNONE,90);
   panel.DrawText("High",  panel.CellX(0,3,0)+2, panel.CellY(0,3,0)+2); panel.DrawText(DoubleToString(rates[0].high,Digits()),      panel.CellX(0,3,1)+2, panel.CellY(0,3,1)+2,clrNONE,90);
   panel.DrawText("Low",   panel.CellX(0,4,0)+2, panel.CellY(0,4,0)+2); panel.DrawText(DoubleToString(rates[0].low,Digits()),       panel.CellX(0,4,1)+2, panel.CellY(0,4,1)+2,clrNONE,90);
   panel.DrawText("Close", panel.CellX(0,5,0)+2, panel.CellY(0,5,0)+2); panel.DrawText(DoubleToString(rates[0].close,Digits()),     panel.CellX(0,5,1)+2, panel.CellY(0,5,1)+2,clrNONE,90);

//--- Output the data of indicator 1 from the specified bar into table 1
   panel.DrawText(indicators.Title(handle_mfi1), panel.CellX(1,0,0)+2, panel.CellY(1,0,0)+2);
   double value1=indicators.GetData(handle_mfi1,0,0,index);
   string value_str1=(value1!=EMPTY_VALUE ? DoubleToString(value1,indicators.Digits(handle_mfi1)) : " ");
   panel.DrawText(value_str1,panel.CellX(1,0,1)+2,panel.CellY(1,0,1)+2,clrNONE,110);

//--- Display a description of the indicator 1 line state
   panel.DrawText("Line state", panel.CellX(1,1,0)+2, panel.CellY(1,1,0)+2);
   ENUM_LINE_STATE state1=indicators.BufferLineState(Symbol(),PERIOD_CURRENT,handle_mfi1,0,0,index);
   panel.DrawText(BufferLineStateDescription(state1),panel.CellX(1,1,1)+2,panel.CellY(1,1,1)+2,clrNONE,110);

//--- Output the data of indicator 2 from the specified bar into table 2
   panel.DrawText(indicators.Title(handle_mfi2), panel.CellX(2,0,0)+2, panel.CellY(2,0,0)+2);
   double value2=indicators.GetDataTo(Symbol(),PERIOD_CURRENT,handle_mfi2,0,0,index);
   string value_str2=(value2!=EMPTY_VALUE ? DoubleToString(value2,indicators.Digits(handle_mfi2)) : " ");
   panel.DrawText(value_str2,panel.CellX(2,0,1)+2,panel.CellY(2,0,1)+2,clrNONE,110);

//--- Display a description of the indicator 2 line state
   panel.DrawText("Line state", panel.CellX(2,1,0)+2, panel.CellY(2,1,0)+2);
   ENUM_LINE_STATE state2=indicators.BufferLineState(Symbol(),PERIOD_CURRENT,handle_mfi2,0,0,index);
   panel.DrawText(BufferLineStateDescription(state2),panel.CellX(2,1,1)+2,panel.CellY(2,1,1)+2,clrNONE,110);

//--- Display description of relationship between indicator 1 line relative to indicator 2 line
   double value21=indicators.GetDataTo(Symbol(),PERIOD_CURRENT,handle_mfi2,0,0,index+1);
   ENUM_LINE_STATE stateR=indicators.BufferLineStateRelative(Symbol(),PERIOD_CURRENT,handle_mfi1,0,0,index,value2,value21);
   string ma1=indicators.Name(handle_mfi1);
   string ma2=indicators.Name(handle_mfi2);
   string state_relative=
     (
      stateR==LINE_STATE_ABOVE      ? StringFormat("%s1 > %s2",ma1,ma2)   :
      stateR==LINE_STATE_BELOW      ? StringFormat("%s1 < %s2",ma1,ma2)           :
      stateR==LINE_STATE_CROSS_DOWN ? "Top-down crossing"   :
      stateR==LINE_STATE_CROSS_UP   ? "Bottom-up crossing"  :
      BufferLineStateDescription(stateR)
     );
   panel.DrawText(StringFormat("%s1 vs %s2",ma1,ma2), panel.CellX(2,2,0)+2, panel.CellY(2,2,0)+2);
   panel.DrawText(state_relative, panel.CellX(2,2,1)+2, panel.CellY(2,2,1)+2,clrNONE,110);

//--- Redraw the chart to immediately display all changes on the panel
   ChartRedraw(ChartID());
  }
//+------------------------------------------------------------------+
Nach dem Kompilieren und Starten des Indikators auf dem M1-Chart, wobei M5 für die Berechnungen ausgewählt wurde, sehen wir:
Der Indikator der Gleitende Durchschnitte:
//+------------------------------------------------------------------+
//|                                       TestMSTFMovingAverages.mq5 |
//|                                  Copyright 2023, MetaQuotes Ltd. |
//|                                             https://www.mql5.com |
//+------------------------------------------------------------------+
#property copyright "Copyright 2023, MetaQuotes Ltd."
#property link      "https://www.mql5.com"
#property version   "1.00"
#property indicator_chart_window
#property indicator_buffers 2
#property indicator_plots   2
//--- enums
enum ENUM_USED_MA
  {
   USED_MA_AMA    =  IND_AMA,    // Adaptive Moving Average
   USED_MA_DEMA   =  IND_DEMA,   // Double Exponential Moving Average
   USED_MA_FRAMA  =  IND_FRAMA,  // Fractal Adaptive Moving Average
   USED_MA_MA     =  IND_MA,     // Moving Average
   USED_MA_TEMA   =  IND_TEMA,   // Triple Exponential Moving Average
   USED_MA_VIDYA  =  IND_VIDYA,  // Variable Index Dynamic Average
  };
//--- plot MA1
#property indicator_label1  "MA1"
#property indicator_type1   DRAW_LINE
#property indicator_color1  clrDodgerBlue
#property indicator_style1  STYLE_SOLID
#property indicator_width1  1

//--- plot MA2
#property indicator_label2  "MA2"
#property indicator_type2   DRAW_LINE
#property indicator_color2  clrRed
#property indicator_style2  STYLE_SOLID
#property indicator_width2  1

//--- includes
#include <IndMSTF\IndMSTF.mqh>
#include <Dashboard\Dashboard.mqh>
//--- input parameters
input ENUM_USED_MA         InpIndicator   =  USED_MA_MA;       /* Used MA        */ // Type of moving average to use
input string               InpSymbol      =  NULL;             /* Symbol         */ // Moving average symbol
input ENUM_TIMEFRAMES      InpTimeframe   =  PERIOD_CURRENT;   /* Timeframe      */ // Moving average timeframe
input ENUM_APPLIED_PRICE   InpPrice       =  PRICE_CLOSE;      /* Applied Price  */ // Price used for MA calculation
input ENUM_MA_METHOD       InpMethod      =  MODE_SMA;         /* MA Method      */ // Moving Average calculation method
input int                  InpShift       =  0;                /* MA Shift       */ // Moving average shift
input bool                 InpAsSeries    =  true;             /* As Series flag */ // Timeseries flag of indicator buffer arrays

//--- indicator buffers
double         BufferMA1[];
double         BufferMA2[];
//--- global variables
int handle_ma1;
int handle_ma2;
CMSTFIndicators indicators;      // An instance of the indicator collection object
//--- variables for the panel
CDashboard *panel=NULL;          // Pointer to the panel object
int         mouse_bar_index;     // Index of the bar the data is taken from
//+------------------------------------------------------------------+
//| Custom indicator initialization function                         |
//+------------------------------------------------------------------+
int OnInit()
  {
//--- Set a timer with an interval of 1 second
   EventSetTimer(1);
//--- Assign the BufferMA1 and BufferMA2 arrays to the plot buffers 0 and 1, respectively
   SetIndexBuffer(0,BufferMA1,INDICATOR_DATA);
   SetIndexBuffer(1,BufferMA2,INDICATOR_DATA);
//--- sets indicator shift
   //PlotIndexSetInteger(0,PLOT_SHIFT,InpShift);   // analog in line 116
   //PlotIndexSetInteger(1,PLOT_SHIFT,InpShift);   // analog in line 117
//--- Set the timeseries flags for the indicator buffer arrays (for testing, to see that there is no difference)
   ArraySetAsSeries(BufferMA1,InpAsSeries);
   ArraySetAsSeries(BufferMA2,InpAsSeries);

//--- For different indicators, the dashboard width will be individual (due to the number of parameters in the description)
   int width=0;
//--- According on the indicator selected in the settings, create two indicators of the same type
//--- The first one is calculated on the current chart symbol/period, the second - on those specified in the settings
   switch(InpIndicator)
     {
      case USED_MA_AMA     :
         handle_ma1=indicators.AddNewAMA(NULL,PERIOD_CURRENT,9,2,30,InpShift);
         handle_ma2=indicators.AddNewAMA(InpSymbol,InpTimeframe,9,2,30,InpShift);
         width=269;
        break;
      case USED_MA_DEMA    :
         handle_ma1=indicators.AddNewDEMA(NULL,PERIOD_CURRENT,14,InpShift,InpPrice);
         handle_ma2=indicators.AddNewDEMA(InpSymbol,InpTimeframe,14,InpShift,InpPrice);
         width=255;
        break;
      case USED_MA_FRAMA   :
         handle_ma1=indicators.AddNewFrAMA(NULL,PERIOD_CURRENT,14,InpShift,InpPrice);
         handle_ma2=indicators.AddNewFrAMA(InpSymbol,InpTimeframe,14,InpShift,InpPrice);
         width=259;
        break;
      case USED_MA_TEMA    :
         handle_ma1=indicators.AddNewTEMA(NULL,PERIOD_CURRENT,14,InpShift,InpPrice);
         handle_ma2=indicators.AddNewTEMA(InpSymbol,InpTimeframe,14,InpShift,InpPrice);
         width=253;
        break;
      case USED_MA_VIDYA   :
         handle_ma1=indicators.AddNewVIDyA(NULL,PERIOD_CURRENT,9,12,InpShift,InpPrice);
         handle_ma2=indicators.AddNewVIDyA(InpSymbol,InpTimeframe,9,12,InpShift,InpPrice);
         width=267;
        break;
      default:
         handle_ma1=indicators.AddNewMA(NULL,PERIOD_CURRENT,10,InpShift,InpMethod,InpPrice);
         handle_ma2=indicators.AddNewMA(InpSymbol,InpTimeframe,10,InpShift,InpMethod,InpPrice);
         width=231;
        break;
     }
//--- If failed to create indicator handles, return initialization error
   if(handle_ma1==INVALID_HANDLE || handle_ma2==INVALID_HANDLE)
      return INIT_FAILED;
//--- Set descriptions for indicator lines from buffer descriptions of calculation part of created indicators
   indicators.SetPlotLabelFromBuffer(0,handle_ma1,0);
   indicators.SetPlotLabelFromBuffer(1,handle_ma2,0);
//--- Set shifts for indicator lines
   indicators.SetPlotShift(0,InpShift);
   indicators.SetPlotShift(1,InpShift);

//--- Dashboard
//--- Create the panel
   panel=new CDashboard(1,20,20,width,264);
   if(panel==NULL)
     {
      Print("Error. Failed to create panel object");
      return INIT_FAILED;
     }
//--- Set font parameters
   panel.SetFontParams("Calibri",9);
//--- Display the panel with the "Symbol, Timeframe description" header text
   panel.View(Symbol()+", "+StringSubstr(EnumToString(Period()),7));

//--- Create a table with ID 0 to display bar data in it
   panel.CreateNewTable(0);
//--- Draw a table with ID 0 on the panel background
   panel.DrawGrid(0,2,20,6,2,18,width/2-2);

//--- Create a table with ID 1 to display the data of indicator 1
   panel.CreateNewTable(1);
//--- Get the Y2 table coordinate with ID 0 and
//--- set the Y1 coordinate for the table with ID 1
   int y1=panel.TableY2(0)+22;
//--- Draw a table with ID 1 on the panel background
   panel.DrawGrid(1,2,y1,2,2,18,width/2-2);

//--- Create a table with ID 2 to display the data of indicator 2
   panel.CreateNewTable(2);
//--- Get the Y2 coordinate of the table with ID 1 and
//--- set the Y1 coordinate for the table with ID 2
   int y2=panel.TableY2(1)+3;
//--- Draw a table with ID 2 on the background of the dashboard
   panel.DrawGrid(2,2,y2,3,2,18,width/2-2);

//--- Initialize the variable with the index of the mouse cursor bar
   mouse_bar_index=0;
//--- Display the data of the current bar on the panel
   DrawData(mouse_bar_index,TimeCurrent());

//--- Successful initialization
   return(INIT_SUCCEEDED);
  }
//+------------------------------------------------------------------+
//| Custom indicator deinitialization function                       |
//+------------------------------------------------------------------+
void OnDeinit(const int reason)
  {
//--- Delete the timer
   EventKillTimer();
//--- If the panel object exists, delete it
   if(panel!=NULL)
      delete panel;
//--- Delete all comments
   Comment("");
  }
//+------------------------------------------------------------------+
//| Custom indicator iteration function                              |
//+------------------------------------------------------------------+
int OnCalculate(const int rates_total,
                const int prev_calculated,
                const datetime &time[],
                const double &open[],
                const double &high[],
                const double &low[],
                const double &close[],
                const long &tick_volume[],
                const long &volume[],
                const int &spread[])
  {
//--- Number of bars for calculation
   int limit=rates_total-prev_calculated;
//--- If limit > 1, then this is the first calculation or change in the history
   if(limit>1)
     {
      //--- specify all the available history for calculation
      limit=rates_total-1;
      /*
      // If the indicator has any buffers that display other calculations (not multi-indicators),
      // initialize them here with the "empty" value set for these buffers
      */
     }
//--- Calculate all created multi-symbol multi-period indicators
   if(!indicators.Calculate())
      return 0;

//--- Display the bar data under cursor (or current bar if cursor is outside the chart) on the dashboard
   if(mouse_bar_index>WRONG_VALUE && mouse_bar_index<rates_total)
      DrawData(mouse_bar_index,time[mouse_bar_index]);

//--- From buffers of calculated indicators, output data to indicator buffers
   if(!indicators.DataToBuffer(NULL,PERIOD_CURRENT,handle_ma1,0,0,limit,BufferMA1))
      return 0;
   if(!indicators.DataToBuffer(NULL,PERIOD_CURRENT,handle_ma2,0,0,limit,BufferMA2))
      return 0;

//--- return value of prev_calculated for the next call
   return(rates_total);
  }
//+------------------------------------------------------------------+
//| Timer function                                                   |
//+------------------------------------------------------------------+
void OnTimer()
  {
//--- Call the indicator collection timer
   indicators.OnTimer();
  }
//+------------------------------------------------------------------+
//| ChartEvent function                                              |
//+------------------------------------------------------------------+
void OnChartEvent(const int id,
                  const long &lparam,
                  const double &dparam,
                  const string &sparam)
  {
//--- Handling the panel
//--- Call the panel event handler
   panel.OnChartEvent(id,lparam,dparam,sparam);

//--- If the cursor moves or a click is made on the chart
   if(id==CHARTEVENT_MOUSE_MOVE || id==CHARTEVENT_CLICK)
     {
      //--- Declare the variables to record time and price coordinates in them
      datetime time=0;
      double price=0;
      int wnd=0;
      //--- If the cursor coordinates are converted to date and time
      if(ChartXYToTimePrice(ChartID(),(int)lparam,(int)dparam,wnd,time,price))
        {
         //--- write the bar index where the cursor is located to a global variable
         mouse_bar_index=iBarShift(Symbol(),PERIOD_CURRENT,time);
         //--- Display the bar data under the cursor on the panel
         DrawData(mouse_bar_index,time);
        }
     }

//--- If we received a custom event, display the appropriate message in the journal
   if(id>CHARTEVENT_CUSTOM)
     {
      //--- Here we can implement handling a click on the close button on the panel
      PrintFormat("%s: Event id=%ld, object id (lparam): %lu, event message (sparam): %s",__FUNCTION__,id,lparam,sparam);
     }
  }
//+------------------------------------------------------------------+
//| Display data from the specified timeseries index to the panel    |
//+------------------------------------------------------------------+
void DrawData(const int index,const datetime time)
  {
//--- Declare the variables to receive data in them
   MqlRates rates[1];

//--- Exit if unable to get the bar data by the specified index
   if(CopyRates(Symbol(),PERIOD_CURRENT,index,1,rates)!=1)
      return;

//--- Set font parameters for bar and indicator data headers
   int  size=0;
   uint flags=0;
   uint angle=0;
   string name=panel.FontParams(size,flags,angle);
   panel.SetFontParams(name,9,FW_BOLD);
   panel.DrawText("Bar data ["+(string)index+"]",3,panel.TableY1(0)-16,clrMaroon,panel.Width()-6);
   panel.DrawText("Indicators data ["+(string)index+"]",3,panel.TableY1(1)-16,clrGreen,panel.Width()-6);
//--- Set font parameters for bar and indicator data
   panel.SetFontParams(name,9);

//--- Display the data of the specified bar in table 0 on the panel
   panel.DrawText("Date",  panel.CellX(0,0,0)+2, panel.CellY(0,0,0)+2); panel.DrawText(TimeToString(  rates[0].time,TIME_DATE),     panel.CellX(0,0,1)+2, panel.CellY(0,0,1)+2,clrNONE,90);
   panel.DrawText("Time",  panel.CellX(0,1,0)+2, panel.CellY(0,1,0)+2); panel.DrawText(TimeToString(  rates[0].time,TIME_MINUTES),  panel.CellX(0,1,1)+2, panel.CellY(0,1,1)+2,clrNONE,90);
   panel.DrawText("Open",  panel.CellX(0,2,0)+2, panel.CellY(0,2,0)+2); panel.DrawText(DoubleToString(rates[0].open,Digits()),      panel.CellX(0,2,1)+2, panel.CellY(0,2,1)+2,clrNONE,90);
   panel.DrawText("High",  panel.CellX(0,3,0)+2, panel.CellY(0,3,0)+2); panel.DrawText(DoubleToString(rates[0].high,Digits()),      panel.CellX(0,3,1)+2, panel.CellY(0,3,1)+2,clrNONE,90);
   panel.DrawText("Low",   panel.CellX(0,4,0)+2, panel.CellY(0,4,0)+2); panel.DrawText(DoubleToString(rates[0].low,Digits()),       panel.CellX(0,4,1)+2, panel.CellY(0,4,1)+2,clrNONE,90);
   panel.DrawText("Close", panel.CellX(0,5,0)+2, panel.CellY(0,5,0)+2); panel.DrawText(DoubleToString(rates[0].close,Digits()),     panel.CellX(0,5,1)+2, panel.CellY(0,5,1)+2,clrNONE,90);

//--- Output the data of indicator 1 from the specified bar into table 1
   panel.DrawText(indicators.Title(handle_ma1), panel.CellX(1,0,0)+2, panel.CellY(1,0,0)+2);
   double value1=indicators.GetData(handle_ma1,0,0,index);
   string value_str1=(value1!=EMPTY_VALUE ? DoubleToString(value1,indicators.Digits(handle_ma1)) : " ");
   panel.DrawText(value_str1,panel.CellX(1,0,1)+2,panel.CellY(1,0,1)+2,clrNONE,110);

//--- Display a description of the indicator 1 line state
   panel.DrawText("Line state", panel.CellX(1,1,0)+2, panel.CellY(1,1,0)+2);
   ENUM_LINE_STATE state1=indicators.BufferLineState(Symbol(),PERIOD_CURRENT,handle_ma1,0,0,index);
   panel.DrawText(BufferLineStateDescription(state1),panel.CellX(1,1,1)+2,panel.CellY(1,1,1)+2,clrNONE,110);

//--- Output the data of indicator 2 from the specified bar into table 2
   panel.DrawText(indicators.Title(handle_ma2), panel.CellX(2,0,0)+2, panel.CellY(2,0,0)+2);
   double value2=indicators.GetDataTo(Symbol(),PERIOD_CURRENT,handle_ma2,0,0,index);
   string value_str2=(value2!=EMPTY_VALUE ? DoubleToString(value2,indicators.Digits(handle_ma2)) : " ");
   panel.DrawText(value_str2,panel.CellX(2,0,1)+2,panel.CellY(2,0,1)+2,clrNONE,110);

//--- Display a description of the indicator 2 line state
   panel.DrawText("Line state", panel.CellX(2,1,0)+2, panel.CellY(2,1,0)+2);
   ENUM_LINE_STATE state2=indicators.BufferLineState(Symbol(),PERIOD_CURRENT,handle_ma2,0,0,index);
   panel.DrawText(BufferLineStateDescription(state2),panel.CellX(2,1,1)+2,panel.CellY(2,1,1)+2,clrNONE,110);

//--- Display description of relationship between indicator 1 line relative to indicator 2 line
   double value21=indicators.GetDataTo(Symbol(),PERIOD_CURRENT,handle_ma2,0,0,index+1);
   ENUM_LINE_STATE stateR=indicators.BufferLineStateRelative(Symbol(),PERIOD_CURRENT,handle_ma1,0,0,index,value2,value21);
   string ma1=indicators.Name(handle_ma1);
   string ma2=indicators.Name(handle_ma2);
   string state_relative=
     (
      stateR==LINE_STATE_ABOVE      ? StringFormat("%s1 > %s2",ma1,ma2)   :
      stateR==LINE_STATE_BELOW      ? StringFormat("%s1 < %s2",ma1,ma2)           :
      stateR==LINE_STATE_CROSS_DOWN ? "Top-down crossing"   :
      stateR==LINE_STATE_CROSS_UP   ? "Bottom-up crossing"  :
      BufferLineStateDescription(stateR)
     );
   panel.DrawText(StringFormat("%s1 vs %s2",ma1,ma2), panel.CellX(2,2,0)+2, panel.CellY(2,2,0)+2);
   panel.DrawText(state_relative, panel.CellX(2,2,1)+2, panel.CellY(2,2,1)+2,clrNONE,110);

//--- Redraw the chart to immediately display all changes on the panel
   ChartRedraw(ChartID());
  }
//+------------------------------------------------------------------+
Nach dem Kompilieren und Starten des Indikators auf dem M1-Chart, wobei M5 für die Berechnungen ausgewählt wurde, sehen wir:
Der Indikator On Balance Volume:
//+------------------------------------------------------------------+
//|                                      TestMSTFOnBalanceVolume.mq5 |
//|                                  Copyright 2023, MetaQuotes Ltd. |
//|                                             https://www.mql5.com |
//+------------------------------------------------------------------+
#property copyright "Copyright 2023, MetaQuotes Ltd."
#property link      "https://www.mql5.com"
#property version   "1.00"
#property indicator_separate_window
#property indicator_buffers 1
#property indicator_plots   1
//--- enums

//--- plot OBV1
#property indicator_label1  "OBV1"
#property indicator_type1   DRAW_LINE
#property indicator_color1  clrDodgerBlue
#property indicator_style1  STYLE_SOLID
#property indicator_width1  1

//--- includes
#include <IndMSTF\IndMSTF.mqh>
#include <Dashboard\Dashboard.mqh>
//--- input parameters
input string               InpSymbol      =  NULL;             /* Symbol                     */ // Symbol
input ENUM_TIMEFRAMES      InpTimeframe   =  PERIOD_CURRENT;   /* Timeframe                  */ // Timeframe
input ENUM_APPLIED_VOLUME  InpVolume      =  VOLUME_TICK;      /* Applied Volume             */ // Volume used for calculations
input uchar                InpLineWidth1  =  2;                /* Senior period Line Width   */ // Line width for higher period
input uchar                InpLineWidth2  =  1;                /* Junior period Line Width   */ // Line width for lower period
input bool                 InpAsSeries    =  true;             /* As Series flag             */ // Timeseries flag of indicator buffer arrays

//--- indicator buffers
double         BufferOBV[];
//--- global variables
int handle_obv;
CMSTFIndicators indicators;      // An instance of the indicator collection object
//--- variables for the panel
CDashboard *panel=NULL;          // Pointer to the panel object
int         mouse_bar_index;     // Index of the bar the data is taken from
//+------------------------------------------------------------------+
//| Custom indicator initialization function                         |
//+------------------------------------------------------------------+
int OnInit()
  {
//--- Set a timer with an interval of 1 second
   EventSetTimer(1);
//--- Assign the BufferMA1 and BufferMA2 arrays to the plot buffers 0 and 1, respectively
   SetIndexBuffer(0,BufferOBV,INDICATOR_DATA);
//--- Set the line width
   int w1=0,w2=0;
   if(InpTimeframe>Period())
     {
      w1=InpLineWidth2;
      w2=InpLineWidth1;
     }
   else
     {
      w1=InpLineWidth1;
      w2=InpLineWidth2;
     }
   PlotIndexSetInteger(0,PLOT_LINE_WIDTH,w1);
   PlotIndexSetInteger(1,PLOT_LINE_WIDTH,w2);
//--- sets indicator shift

//--- Set the timeseries flags for the indicator buffer arrays (for testing, to see that there is no difference)
   ArraySetAsSeries(BufferOBV,InpAsSeries);

//--- Create two indicators of the same type
//--- The first one is calculated on the current chart symbol/period, the second - on those specified in the settings
   handle_obv=indicators.AddNewOBV(InpSymbol,InpTimeframe,InpVolume);

//--- If failed to create indicator handles, return initialization error
   if(handle_obv==INVALID_HANDLE)
      return INIT_FAILED;
//--- Set descriptions for indicator lines from buffer descriptions of calculation part of created indicators
   indicators.SetPlotLabelFromBuffer(0,handle_obv,0);

//--- Dashboard
//--- Create the panel
   int width=237;
   panel=new CDashboard(1,20,20,width,264,0);
   if(panel==NULL)
     {
      Print("Error. Failed to create panel object");
      return INIT_FAILED;
     }
//--- Set font parameters
   panel.SetFontParams("Calibri",9);
//--- Display the panel with the "Symbol, Timeframe description" header text
   panel.View(Symbol()+", "+StringSubstr(EnumToString(Period()),7));

//--- Create a table with ID 0 to display bar data in it
   panel.CreateNewTable(0);
//--- Draw a table with ID 0 on the panel background
   panel.DrawGrid(0,2,20,6,2,18,width/2-2);

//--- Create a table with ID 1 to display the data of indicator 1
   panel.CreateNewTable(1);
//--- Get the Y2 table coordinate with ID 0 and
//--- set the Y1 coordinate for the table with ID 1
   int y1=panel.TableY2(0)+22;
//--- Draw a table with ID 1 on the panel background
   panel.DrawGrid(1,2,y1,2,2,18,width/2-2);

//--- Create a table with ID 2 to display the data of indicator 2
   panel.CreateNewTable(2);
//--- Get the Y2 coordinate of the table with ID 1 and
//--- set the Y1 coordinate for the table with ID 2
   int y2=panel.TableY2(1)+3;
//--- Draw a table with ID 2 on the background of the dashboard
   panel.DrawGrid(2,2,y2,3,2,18,width/2-2);

//--- Initialize the variable with the index of the mouse cursor bar
   mouse_bar_index=0;
//--- Display the data of the current bar on the panel
   DrawData(mouse_bar_index,TimeCurrent());

//--- Successful initialization
   return(INIT_SUCCEEDED);
  }
//+------------------------------------------------------------------+
//| Custom indicator deinitialization function                       |
//+------------------------------------------------------------------+
void OnDeinit(const int reason)
  {
//--- Delete the timer
   EventKillTimer();
//--- If the panel object exists, delete it
   if(panel!=NULL)
      delete panel;
//--- Delete all comments
   Comment("");
  }
//+------------------------------------------------------------------+
//| Custom indicator iteration function                              |
//+------------------------------------------------------------------+
int OnCalculate(const int rates_total,
                const int prev_calculated,
                const datetime &time[],
                const double &open[],
                const double &high[],
                const double &low[],
                const double &close[],
                const long &tick_volume[],
                const long &volume[],
                const int &spread[])
  {
//--- Number of bars for calculation
   int limit=rates_total-prev_calculated;
//--- If limit > 1, then this is the first calculation or change in the history
   if(limit>1)
     {
      //--- specify all the available history for calculation
      limit=rates_total-1;
      /*
      // If the indicator has any buffers that display other calculations (not multi-indicators),
      // initialize them here with the "empty" value set for these buffers
      */
     }
//--- Calculate all created multi-symbol multi-period indicators
   if(!indicators.Calculate())
      return 0;

//--- Display the bar data under cursor (or current bar if cursor is outside the chart) on the dashboard
   DrawData(mouse_bar_index,time[mouse_bar_index]);

//--- From buffers of calculated indicators, output data to indicator buffers
   if(!indicators.DataToBuffer(NULL,PERIOD_CURRENT,handle_obv,0,0,limit,BufferOBV))
      return 0;

//--- return value of prev_calculated for the next call
   return(rates_total);
  }
//+------------------------------------------------------------------+
//| Timer function                                                   |
//+------------------------------------------------------------------+
void OnTimer()
  {
//--- Call the indicator collection timer
   indicators.OnTimer();
  }
//+------------------------------------------------------------------+
//| ChartEvent function                                              |
//+------------------------------------------------------------------+
void OnChartEvent(const int id,
                  const long &lparam,
                  const double &dparam,
                  const string &sparam)
  {
//--- Handling the panel
//--- Call the panel event handler
   panel.OnChartEvent(id,lparam,dparam,sparam);

//--- If the cursor moves or a click is made on the chart
   if(id==CHARTEVENT_MOUSE_MOVE || id==CHARTEVENT_CLICK)
     {
      //--- Declare the variables to record time and price coordinates in them
      datetime time=0;
      double price=0;
      int wnd=0;
      //--- If the cursor coordinates are converted to date and time
      if(ChartXYToTimePrice(ChartID(),(int)lparam,(int)dparam,wnd,time,price))
        {
         //--- write the bar index where the cursor is located to a global variable
         mouse_bar_index=iBarShift(Symbol(),PERIOD_CURRENT,time);
         //--- Display the bar data under the cursor on the panel
         DrawData(mouse_bar_index,time);
        }
     }

//--- If we received a custom event, display the appropriate message in the journal
   if(id>CHARTEVENT_CUSTOM)
     {
      //--- Here we can implement handling a click on the close button on the panel
      PrintFormat("%s: Event id=%ld, object id (lparam): %lu, event message (sparam): %s",__FUNCTION__,id,lparam,sparam);
     }
  }
//+------------------------------------------------------------------+
//| Display data from the specified timeseries index to the panel    |
//+------------------------------------------------------------------+
void DrawData(const int index,const datetime time)
  {
//--- Declare the variables to receive data in them
   MqlRates rates[1];

//--- Exit if unable to get the bar data by the specified index
   if(CopyRates(Symbol(),PERIOD_CURRENT,index,1,rates)!=1)
      return;

//--- Set font parameters for bar and indicator data headers
   int  size=0;
   uint flags=0;
   uint angle=0;
   string name=panel.FontParams(size,flags,angle);
   panel.SetFontParams(name,9,FW_BOLD);
   panel.DrawText("Bar data ["+(string)index+"]",3,panel.TableY1(0)-16,clrMaroon,panel.Width()-6);
   panel.DrawText("Indicators data ["+(string)index+"]",3,panel.TableY1(1)-16,clrGreen,panel.Width()-6);
//--- Set font parameters for bar and indicator data
   panel.SetFontParams(name,9);

//--- Display the data of the specified bar in table 0 on the panel
   panel.DrawText("Date",  panel.CellX(0,0,0)+2, panel.CellY(0,0,0)+2); panel.DrawText(TimeToString(  rates[0].time,TIME_DATE),     panel.CellX(0,0,1)+2, panel.CellY(0,0,1)+2,clrNONE,90);
   panel.DrawText("Time",  panel.CellX(0,1,0)+2, panel.CellY(0,1,0)+2); panel.DrawText(TimeToString(  rates[0].time,TIME_MINUTES),  panel.CellX(0,1,1)+2, panel.CellY(0,1,1)+2,clrNONE,90);
   panel.DrawText("Open",  panel.CellX(0,2,0)+2, panel.CellY(0,2,0)+2); panel.DrawText(DoubleToString(rates[0].open,Digits()),      panel.CellX(0,2,1)+2, panel.CellY(0,2,1)+2,clrNONE,90);
   panel.DrawText("High",  panel.CellX(0,3,0)+2, panel.CellY(0,3,0)+2); panel.DrawText(DoubleToString(rates[0].high,Digits()),      panel.CellX(0,3,1)+2, panel.CellY(0,3,1)+2,clrNONE,90);
   panel.DrawText("Low",   panel.CellX(0,4,0)+2, panel.CellY(0,4,0)+2); panel.DrawText(DoubleToString(rates[0].low,Digits()),       panel.CellX(0,4,1)+2, panel.CellY(0,4,1)+2,clrNONE,90);
   panel.DrawText("Close", panel.CellX(0,5,0)+2, panel.CellY(0,5,0)+2); panel.DrawText(DoubleToString(rates[0].close,Digits()),     panel.CellX(0,5,1)+2, panel.CellY(0,5,1)+2,clrNONE,90);

//--- Output the data of indicator 1 from the specified bar into table 1
   panel.DrawText(indicators.Title(handle_obv), panel.CellX(1,0,0)+2, panel.CellY(1,0,0)+2);
   double value1=indicators.GetData(handle_obv,0,0,index);
   string value_str1=(value1!=EMPTY_VALUE ? DoubleToString(value1,indicators.Digits(handle_obv)) : " ");
   panel.DrawText(value_str1,panel.CellX(1,0,1)+2,panel.CellY(1,0,1)+2,clrNONE,110);

//--- Display a description of the indicator 1 line state
   panel.DrawText("Line state", panel.CellX(1,1,0)+2, panel.CellY(1,1,0)+2);
   ENUM_LINE_STATE state1=indicators.BufferLineState(Symbol(),PERIOD_CURRENT,handle_obv,0,0,index);
   panel.DrawText(BufferLineStateDescription(state1),panel.CellX(1,1,1)+2,panel.CellY(1,1,1)+2,clrNONE,110);

//--- Redraw the chart to immediately display all changes on the panel
   ChartRedraw(ChartID());
  }
//+------------------------------------------------------------------+
Nach dem Kompilieren und Starten des Indikators auf dem M1-Chart, wobei M5 für die Berechnungen ausgewählt wurde, sehen wir:
Der Indikator Parabolic SAR:
//+------------------------------------------------------------------+
//|                                         TestMSTFParabolicSAR.mq5 |
//|                                  Copyright 2023, MetaQuotes Ltd. |
//|                                             https://www.mql5.com |
//+------------------------------------------------------------------+
#property copyright "Copyright 2023, MetaQuotes Ltd."
#property link      "https://www.mql5.com"
#property version   "1.00"
#property indicator_chart_window
#property indicator_buffers 2
#property indicator_plots   2
//--- enums

//--- plot PSAR1
#property indicator_label1  "PSAR1"
#property indicator_type1   DRAW_ARROW
#property indicator_color1  clrDodgerBlue
#property indicator_style1  STYLE_SOLID
#property indicator_width1  1

//--- plot MA2
#property indicator_label2  "PSAR2"
#property indicator_type2   DRAW_ARROW
#property indicator_color2  clrRed
#property indicator_style2  STYLE_SOLID
#property indicator_width2  1

//--- includes
#include <IndMSTF\IndMSTF.mqh>
#include <Dashboard\Dashboard.mqh>
//--- input parameters
input string               InpSymbol      =  NULL;             /* Symbol                        */ // Moving Average symbol
input ENUM_TIMEFRAMES      InpTimeframe   =  PERIOD_CURRENT;   /* Timeframe                     */ // Moving Average timeframe
input uchar                InpArrowCode1  =  158;              /* SAR Senior period Arrow Code  */ // Arrow code for Parabolic SAR 1
input uchar                InpArrowCode2  =  159;              /* SAR Junior period Arrow Code  */ // Arrow code for Parabolic SAR 2
input bool                 InpAsSeries    =  true;             /* As Series flag                */ // Timeseries flag of indicator buffer arrays

//--- indicator buffers
double         BufferPSAR1[];
double         BufferPSAR2[];
//--- global variables
int handle_psar1;
int handle_psar2;
CMSTFIndicators indicators;      // An instance of the indicator collection object
//--- variables for the panel
CDashboard *panel=NULL;          // Pointer to the panel object
int         mouse_bar_index;     // Index of the bar the data is taken from
//+------------------------------------------------------------------+
//| Custom indicator initialization function                         |
//+------------------------------------------------------------------+
int OnInit()
  {
//--- Set a timer with an interval of 1 second
   EventSetTimer(1);
//--- Assign the BufferMA1 and BufferMA2 arrays to the plot buffers 0 and 1, respectively
   SetIndexBuffer(0,BufferPSAR1,INDICATOR_DATA);
   SetIndexBuffer(1,BufferPSAR2,INDICATOR_DATA);
//--- Define the symbol code from the Wingdings font to draw in PLOT_ARROW
//--- Higher period is drawn with the first arrow code, the lower one with the second
   uchar code1=InpArrowCode1;
   uchar code2=InpArrowCode2;
   if(InpTimeframe>Period())
     {
      code1=InpArrowCode1;
      code2=InpArrowCode2;
     }
   else
     {
      code1=InpArrowCode2;
      code2=InpArrowCode1;
     }
   PlotIndexSetInteger(0,PLOT_ARROW,code1);
   PlotIndexSetInteger(1,PLOT_ARROW,code2);
//--- sets indicator shift

//--- Set the timeseries flags for the indicator buffer arrays (for testing, to see that there is no difference)
   ArraySetAsSeries(BufferPSAR1,InpAsSeries);
   ArraySetAsSeries(BufferPSAR2,InpAsSeries);

//--- Create two indicators of the same type
//--- The first one is calculated on the current chart symbol/period, the second - on those specified in the settings
   handle_psar1=indicators.AddNewSAR(NULL,PERIOD_CURRENT);
   handle_psar2=indicators.AddNewSAR(InpSymbol,InpTimeframe);

//--- If failed to create indicator handles, return initialization error
   if(handle_psar1==INVALID_HANDLE || handle_psar2==INVALID_HANDLE)
      return INIT_FAILED;
//--- Set descriptions for indicator lines from buffer descriptions of calculation part of created indicators
   indicators.SetPlotLabelFromBuffer(0,handle_psar1,0);
   indicators.SetPlotLabelFromBuffer(1,handle_psar2,0);

//--- Dashboard
//--- Create the panel
   int width=290;
   panel=new CDashboard(1,20,20,width,264);
   if(panel==NULL)
     {
      Print("Error. Failed to create panel object");
      return INIT_FAILED;
     }
//--- Set font parameters
   panel.SetFontParams("Calibri",9);
//--- Display the panel with the "Symbol, Timeframe description" header text
   panel.View(Symbol()+", "+StringSubstr(EnumToString(Period()),7));

//--- Create a table with ID 0 to display bar data in it
   panel.CreateNewTable(0);
//--- Draw a table with ID 0 on the panel background
   panel.DrawGrid(0,2,20,6,2,18,width/2-2);

//--- Create a table with ID 1 to display the data of indicator 1
   panel.CreateNewTable(1);
//--- Get the Y2 table coordinate with ID 0 and
//--- set the Y1 coordinate for the table with ID 1
   int y1=panel.TableY2(0)+22;
//--- Draw a table with ID 1 on the panel background
   panel.DrawGrid(1,2,y1,2,2,18,width/2-2);

//--- Create a table with ID 2 to display the data of indicator 2
   panel.CreateNewTable(2);
//--- Get the Y2 coordinate of the table with ID 1 and
//--- set the Y1 coordinate for the table with ID 2
   int y2=panel.TableY2(1)+3;
//--- Draw a table with ID 2 on the background of the dashboard
   panel.DrawGrid(2,2,y2,3,2,18,width/2-2);

//--- Initialize the variable with the index of the mouse cursor bar
   mouse_bar_index=0;
//--- Display the data of the current bar on the panel
   DrawData(mouse_bar_index,TimeCurrent());

//--- Successful initialization
   return(INIT_SUCCEEDED);
  }
//+------------------------------------------------------------------+
//| Custom indicator deinitialization function                       |
//+------------------------------------------------------------------+
void OnDeinit(const int reason)
  {
//--- Delete the timer
   EventKillTimer();
//--- If the panel object exists, delete it
   if(panel!=NULL)
      delete panel;
//--- Delete all comments
   Comment("");
  }
//+------------------------------------------------------------------+
//| Custom indicator iteration function                              |
//+------------------------------------------------------------------+
int OnCalculate(const int rates_total,
                const int prev_calculated,
                const datetime &time[],
                const double &open[],
                const double &high[],
                const double &low[],
                const double &close[],
                const long &tick_volume[],
                const long &volume[],
                const int &spread[])
  {
//--- Number of bars for calculation
   int limit=rates_total-prev_calculated;
//--- If limit > 1, then this is the first calculation or change in the history
   if(limit>1)
     {
      //--- specify all the available history for calculation
      limit=rates_total-1;
      /*
      // If the indicator has any buffers that display other calculations (not multi-indicators),
      // initialize them here with the "empty" value set for these buffers
      */
     }
//--- Calculate all created multi-symbol multi-period indicators
   if(!indicators.Calculate())
      return 0;

//--- Display the bar data under cursor (or current bar if cursor is outside the chart) on the dashboard
   DrawData(mouse_bar_index,time[mouse_bar_index]);

//--- From buffers of calculated indicators, output data to indicator buffers
   if(!indicators.DataToBuffer(NULL,PERIOD_CURRENT,handle_psar1,0,0,limit,BufferPSAR1))
      return 0;
   if(!indicators.DataToBuffer(NULL,PERIOD_CURRENT,handle_psar2,0,0,limit,BufferPSAR2))
      return 0;

//--- return value of prev_calculated for the next call
   return(rates_total);
  }
//+------------------------------------------------------------------+
//| Timer function                                                   |
//+------------------------------------------------------------------+
void OnTimer()
  {
//--- Call the indicator collection timer
   indicators.OnTimer();
  }
//+------------------------------------------------------------------+
//| ChartEvent function                                              |
//+------------------------------------------------------------------+
void OnChartEvent(const int id,
                  const long &lparam,
                  const double &dparam,
                  const string &sparam)
  {
//--- Handling the panel
//--- Call the panel event handler
   panel.OnChartEvent(id,lparam,dparam,sparam);

//--- If the cursor moves or a click is made on the chart
   if(id==CHARTEVENT_MOUSE_MOVE || id==CHARTEVENT_CLICK)
     {
      //--- Declare the variables to record time and price coordinates in them
      datetime time=0;
      double price=0;
      int wnd=0;
      //--- If the cursor coordinates are converted to date and time
      if(ChartXYToTimePrice(ChartID(),(int)lparam,(int)dparam,wnd,time,price))
        {
         //--- write the bar index where the cursor is located to a global variable
         mouse_bar_index=iBarShift(Symbol(),PERIOD_CURRENT,time);
         //--- Display the bar data under the cursor on the panel
         DrawData(mouse_bar_index,time);
        }
     }

//--- If we received a custom event, display the appropriate message in the journal
   if(id>CHARTEVENT_CUSTOM)
     {
      //--- Here we can implement handling a click on the close button on the panel
      PrintFormat("%s: Event id=%ld, object id (lparam): %lu, event message (sparam): %s",__FUNCTION__,id,lparam,sparam);
     }
  }
//+------------------------------------------------------------------+
//| Display data from the specified timeseries index to the panel    |
//+------------------------------------------------------------------+
void DrawData(const int index,const datetime time)
  {
//--- Declare the variables to receive data in them
   MqlRates rates[1];

//--- Exit if unable to get the bar data by the specified index
   if(CopyRates(Symbol(),PERIOD_CURRENT,index,1,rates)!=1)
      return;

//--- Set font parameters for bar and indicator data headers
   int  size=0;
   uint flags=0;
   uint angle=0;
   string name=panel.FontParams(size,flags,angle);
   panel.SetFontParams(name,9,FW_BOLD);
   panel.DrawText("Bar data ["+(string)index+"]",3,panel.TableY1(0)-16,clrMaroon,panel.Width()-6);
   panel.DrawText("Indicators data ["+(string)index+"]",3,panel.TableY1(1)-16,clrGreen,panel.Width()-6);
//--- Set font parameters for bar and indicator data
   panel.SetFontParams(name,9);

//--- Display the data of the specified bar in table 0 on the panel
   panel.DrawText("Date",  panel.CellX(0,0,0)+2, panel.CellY(0,0,0)+2); panel.DrawText(TimeToString(  rates[0].time,TIME_DATE),     panel.CellX(0,0,1)+2, panel.CellY(0,0,1)+2,clrNONE,90);
   panel.DrawText("Time",  panel.CellX(0,1,0)+2, panel.CellY(0,1,0)+2); panel.DrawText(TimeToString(  rates[0].time,TIME_MINUTES),  panel.CellX(0,1,1)+2, panel.CellY(0,1,1)+2,clrNONE,90);
   panel.DrawText("Open",  panel.CellX(0,2,0)+2, panel.CellY(0,2,0)+2); panel.DrawText(DoubleToString(rates[0].open,Digits()),      panel.CellX(0,2,1)+2, panel.CellY(0,2,1)+2,clrNONE,90);
   panel.DrawText("High",  panel.CellX(0,3,0)+2, panel.CellY(0,3,0)+2); panel.DrawText(DoubleToString(rates[0].high,Digits()),      panel.CellX(0,3,1)+2, panel.CellY(0,3,1)+2,clrNONE,90);
   panel.DrawText("Low",   panel.CellX(0,4,0)+2, panel.CellY(0,4,0)+2); panel.DrawText(DoubleToString(rates[0].low,Digits()),       panel.CellX(0,4,1)+2, panel.CellY(0,4,1)+2,clrNONE,90);
   panel.DrawText("Close", panel.CellX(0,5,0)+2, panel.CellY(0,5,0)+2); panel.DrawText(DoubleToString(rates[0].close,Digits()),     panel.CellX(0,5,1)+2, panel.CellY(0,5,1)+2,clrNONE,90);

//--- Output the data of indicator 1 from the specified bar into table 1
   panel.DrawText(indicators.Title(handle_psar1), panel.CellX(1,0,0)+2, panel.CellY(1,0,0)+2);
   double value1=indicators.GetData(handle_psar1,0,0,index);
   string value_str1=(value1!=EMPTY_VALUE ? DoubleToString(value1,indicators.Digits(handle_psar1)) : " ");
   panel.DrawText(value_str1,panel.CellX(1,0,1)+2,panel.CellY(1,0,1)+2,clrNONE,110);

//--- Display a description of the indicator 1 line state
   panel.DrawText("Line state", panel.CellX(1,1,0)+2, panel.CellY(1,1,0)+2);
   ENUM_LINE_STATE state1=indicators.BufferLineState(Symbol(),PERIOD_CURRENT,handle_psar1,0,0,index);
   panel.DrawText(BufferLineStateDescription(state1),panel.CellX(1,1,1)+2,panel.CellY(1,1,1)+2,clrNONE,110);

//--- Output the data of indicator 2 from the specified bar into table 2
   panel.DrawText(indicators.Title(handle_psar2), panel.CellX(2,0,0)+2, panel.CellY(2,0,0)+2);
   double value2=indicators.GetDataTo(Symbol(),PERIOD_CURRENT,handle_psar2,0,0,index);
   string value_str2=(value2!=EMPTY_VALUE ? DoubleToString(value2,indicators.Digits(handle_psar2)) : " ");
   panel.DrawText(value_str2,panel.CellX(2,0,1)+2,panel.CellY(2,0,1)+2,clrNONE,110);

//--- Display a description of the indicator 2 line state
   panel.DrawText("Line state", panel.CellX(2,1,0)+2, panel.CellY(2,1,0)+2);
   ENUM_LINE_STATE state2=indicators.BufferLineState(Symbol(),PERIOD_CURRENT,handle_psar2,0,0,index);
   panel.DrawText(BufferLineStateDescription(state2),panel.CellX(2,1,1)+2,panel.CellY(2,1,1)+2,clrNONE,110);

//--- Display description of relationship between indicator 1 line relative to indicator 2 line
   double value21=indicators.GetDataTo(Symbol(),PERIOD_CURRENT,handle_psar2,0,0,index+1);
   ENUM_LINE_STATE stateR=indicators.BufferLineStateRelative(Symbol(),PERIOD_CURRENT,handle_psar1,0,0,index,value2,value21);
   string ma1=indicators.Name(handle_psar1);
   string ma2=indicators.Name(handle_psar2);
   string state_relative=
     (
      stateR==LINE_STATE_ABOVE      ? StringFormat("%s1 > %s2",ma1,ma2)   :
      stateR==LINE_STATE_BELOW      ? StringFormat("%s1 < %s2",ma1,ma2)           :
      stateR==LINE_STATE_CROSS_DOWN ? "Top-down crossing"   :
      stateR==LINE_STATE_CROSS_UP   ? "Bottom-up crossing"  :
      BufferLineStateDescription(stateR)
     );
   panel.DrawText(StringFormat("%s1 vs %s2",ma1,ma2), panel.CellX(2,2,0)+2, panel.CellY(2,2,0)+2);
   panel.DrawText(state_relative, panel.CellX(2,2,1)+2, panel.CellY(2,2,1)+2,clrNONE,110);

//--- Redraw the chart to immediately display all changes on the panel
   ChartRedraw(ChartID());
  }
//+------------------------------------------------------------------+
Nach dem Kompilieren und Starten des Indikators auf dem M1-Chart, wobei M5 für die Berechnungen ausgewählt wurde, sehen wir:
Der Indikator Relative Strength Index:
//+------------------------------------------------------------------+
//|                                TestMSTFRelativeStrengthIndex.mq5 |
//|                                  Copyright 2023, MetaQuotes Ltd. |
//|                                             https://www.mql5.com |
//+------------------------------------------------------------------+
#property copyright "Copyright 2023, MetaQuotes Ltd."
#property link      "https://www.mql5.com"
#property version   "1.00"
#property indicator_separate_window
#property indicator_buffers 2
#property indicator_plots   2
//--- enums

//--- plot RSI1
#property indicator_label1  "RSI1"
#property indicator_type1   DRAW_LINE
#property indicator_color1  clrSeaGreen
#property indicator_style1  STYLE_SOLID
#property indicator_width1  1

//--- plot RSI2
#property indicator_label2  "RSI2"
#property indicator_type2   DRAW_LINE
#property indicator_color2  clrDodgerBlue
#property indicator_style2  STYLE_SOLID
#property indicator_width2  1

//--- includes
#include <IndMSTF\IndMSTF.mqh>
#include <Dashboard\Dashboard.mqh>
//--- input parameters
input string               InpSymbol      =  NULL;             /* Symbol                     */ // Symbol
input ENUM_TIMEFRAMES      InpTimeframe   =  PERIOD_CURRENT;   /* Timeframe                  */ // Timeframe
input int                  InpPeriod      =  14;               /* Period                     */ // Calculation period
input ENUM_APPLIED_PRICE   InpPrice       =  PRICE_CLOSE;      /* Applied Price              */
input uchar                InpLineWidth1  =  2;                /* Senior period Line Width   */ // Line width for higher period
input uchar                InpLineWidth2  =  1;                /* Junior period Line Width   */ // Line width for lower period
input bool                 InpAsSeries    =  true;             /* As Series flag             */ // Timeseries flag of indicator buffer arrays

//--- indicator buffers
double         BufferRSI1[];
double         BufferRSI2[];
//--- global variables
int handle_rsi1;
int handle_rsi2;
CMSTFIndicators indicators;      // An instance of the indicator collection object
//--- variables for the panel
CDashboard *panel=NULL;          // Pointer to the panel object
int         mouse_bar_index;     // Index of the bar the data is taken from
//+------------------------------------------------------------------+
//| Custom indicator initialization function                         |
//+------------------------------------------------------------------+
int OnInit()
  {
//--- Set a timer with an interval of 1 second
   EventSetTimer(1);
//--- Assign the BufferMA1 and BufferMA2 arrays to the plot buffers 0 and 1, respectively
   SetIndexBuffer(0,BufferRSI1,INDICATOR_DATA);
   SetIndexBuffer(1,BufferRSI2,INDICATOR_DATA);
//--- Set the line width
   int w1=0,w2=0;
   if(InpTimeframe>Period())
     {
      w1=InpLineWidth2;
      w2=InpLineWidth1;
     }
   else
     {
      w1=InpLineWidth1;
      w2=InpLineWidth2;
     }
   PlotIndexSetInteger(0,PLOT_LINE_WIDTH,w1);
   PlotIndexSetInteger(1,PLOT_LINE_WIDTH,w2);
//--- sets indicator shift

//--- Set the timeseries flags for the indicator buffer arrays (for testing, to see that there is no difference)
   ArraySetAsSeries(BufferRSI1,InpAsSeries);
   ArraySetAsSeries(BufferRSI2,InpAsSeries);

//--- Create two indicators of the same type
//--- The first one is calculated on the current chart symbol/period, the second - on those specified in the settings
   handle_rsi1=indicators.AddNewRSI(NULL,PERIOD_CURRENT,InpPeriod,InpPrice);
   handle_rsi2=indicators.AddNewRSI(InpSymbol,InpTimeframe,InpPeriod,InpPrice);

//--- If failed to create indicator handles, return initialization error
   if(handle_rsi1==INVALID_HANDLE || handle_rsi2==INVALID_HANDLE)
      return INIT_FAILED;
//--- Set descriptions for indicator lines from buffer descriptions of calculation part of created indicators
   indicators.SetPlotLabelFromBuffer(0,handle_rsi1,0);
   indicators.SetPlotLabelFromBuffer(1,handle_rsi2,0);

//--- Dashboard
//--- Create the panel
   int width=231;
   panel=new CDashboard(1,20,20,width,264,0);
   if(panel==NULL)
     {
      Print("Error. Failed to create panel object");
      return INIT_FAILED;
     }
//--- Set font parameters
   panel.SetFontParams("Calibri",9);
//--- Display the panel with the "Symbol, Timeframe description" header text
   panel.View(Symbol()+", "+StringSubstr(EnumToString(Period()),7));

//--- Create a table with ID 0 to display bar data in it
   panel.CreateNewTable(0);
//--- Draw a table with ID 0 on the panel background
   panel.DrawGrid(0,2,20,6,2,18,width/2-2);

//--- Create a table with ID 1 to display the data of indicator 1
   panel.CreateNewTable(1);
//--- Get the Y2 table coordinate with ID 0 and
//--- set the Y1 coordinate for the table with ID 1
   int y1=panel.TableY2(0)+22;
//--- Draw a table with ID 1 on the panel background
   panel.DrawGrid(1,2,y1,2,2,18,width/2-2);

//--- Create a table with ID 2 to display the data of indicator 2
   panel.CreateNewTable(2);
//--- Get the Y2 coordinate of the table with ID 1 and
//--- set the Y1 coordinate for the table with ID 2
   int y2=panel.TableY2(1)+3;
//--- Draw a table with ID 2 on the background of the dashboard
   panel.DrawGrid(2,2,y2,3,2,18,width/2-2);

//--- Initialize the variable with the index of the mouse cursor bar
   mouse_bar_index=0;
//--- Display the data of the current bar on the panel
   DrawData(mouse_bar_index,TimeCurrent());

//--- Successful initialization
   return(INIT_SUCCEEDED);
  }
//+------------------------------------------------------------------+
//| Custom indicator deinitialization function                       |
//+------------------------------------------------------------------+
void OnDeinit(const int reason)
  {
//--- Delete the timer
   EventKillTimer();
//--- If the panel object exists, delete it
   if(panel!=NULL)
      delete panel;
//--- Delete all comments
   Comment("");
  }
//+------------------------------------------------------------------+
//| Custom indicator iteration function                              |
//+------------------------------------------------------------------+
int OnCalculate(const int rates_total,
                const int prev_calculated,
                const datetime &time[],
                const double &open[],
                const double &high[],
                const double &low[],
                const double &close[],
                const long &tick_volume[],
                const long &volume[],
                const int &spread[])
  {
//--- Number of bars for calculation
   int limit=rates_total-prev_calculated;
//--- If limit > 1, then this is the first calculation or change in the history
   if(limit>1)
     {
      //--- specify all the available history for calculation
      limit=rates_total-1;
      /*
      // If the indicator has any buffers that display other calculations (not multi-indicators),
      // initialize them here with the "empty" value set for these buffers
      */
     }
//--- Calculate all created multi-symbol multi-period indicators
   if(!indicators.Calculate())
      return 0;

//--- Display the bar data under cursor (or current bar if cursor is outside the chart) on the dashboard
   DrawData(mouse_bar_index,time[mouse_bar_index]);

//--- From buffers of calculated indicators, output data to indicator buffers
   if(!indicators.DataToBuffer(NULL,PERIOD_CURRENT,handle_rsi1,0,0,limit,BufferRSI1))
      return 0;
   if(!indicators.DataToBuffer(NULL,PERIOD_CURRENT,handle_rsi2,0,0,limit,BufferRSI2))
      return 0;

//--- return value of prev_calculated for the next call
   return(rates_total);
  }
//+------------------------------------------------------------------+
//| Timer function                                                   |
//+------------------------------------------------------------------+
void OnTimer()
  {
//--- Call the indicator collection timer
   indicators.OnTimer();
  }
//+------------------------------------------------------------------+
//| ChartEvent function                                              |
//+------------------------------------------------------------------+
void OnChartEvent(const int id,
                  const long &lparam,
                  const double &dparam,
                  const string &sparam)
  {
//--- Handling the panel
//--- Call the panel event handler
   panel.OnChartEvent(id,lparam,dparam,sparam);

//--- If the cursor moves or a click is made on the chart
   if(id==CHARTEVENT_MOUSE_MOVE || id==CHARTEVENT_CLICK)
     {
      //--- Declare the variables to record time and price coordinates in them
      datetime time=0;
      double price=0;
      int wnd=0;
      //--- If the cursor coordinates are converted to date and time
      if(ChartXYToTimePrice(ChartID(),(int)lparam,(int)dparam,wnd,time,price))
        {
         //--- write the bar index where the cursor is located to a global variable
         mouse_bar_index=iBarShift(Symbol(),PERIOD_CURRENT,time);
         //--- Display the bar data under the cursor on the panel
         DrawData(mouse_bar_index,time);
        }
     }

//--- If we received a custom event, display the appropriate message in the journal
   if(id>CHARTEVENT_CUSTOM)
     {
      //--- Here we can implement handling a click on the close button on the panel
      PrintFormat("%s: Event id=%ld, object id (lparam): %lu, event message (sparam): %s",__FUNCTION__,id,lparam,sparam);
     }
  }
//+------------------------------------------------------------------+
//| Display data from the specified timeseries index to the panel    |
//+------------------------------------------------------------------+
void DrawData(const int index,const datetime time)
  {
//--- Declare the variables to receive data in them
   MqlRates rates[1];

//--- Exit if unable to get the bar data by the specified index
   if(CopyRates(Symbol(),PERIOD_CURRENT,index,1,rates)!=1)
      return;

//--- Set font parameters for bar and indicator data headers
   int  size=0;
   uint flags=0;
   uint angle=0;
   string name=panel.FontParams(size,flags,angle);
   panel.SetFontParams(name,9,FW_BOLD);
   panel.DrawText("Bar data ["+(string)index+"]",3,panel.TableY1(0)-16,clrMaroon,panel.Width()-6);
   panel.DrawText("Indicators data ["+(string)index+"]",3,panel.TableY1(1)-16,clrGreen,panel.Width()-6);
//--- Set font parameters for bar and indicator data
   panel.SetFontParams(name,9);

//--- Display the data of the specified bar in table 0 on the panel
   panel.DrawText("Date",  panel.CellX(0,0,0)+2, panel.CellY(0,0,0)+2); panel.DrawText(TimeToString(  rates[0].time,TIME_DATE),     panel.CellX(0,0,1)+2, panel.CellY(0,0,1)+2,clrNONE,90);
   panel.DrawText("Time",  panel.CellX(0,1,0)+2, panel.CellY(0,1,0)+2); panel.DrawText(TimeToString(  rates[0].time,TIME_MINUTES),  panel.CellX(0,1,1)+2, panel.CellY(0,1,1)+2,clrNONE,90);
   panel.DrawText("Open",  panel.CellX(0,2,0)+2, panel.CellY(0,2,0)+2); panel.DrawText(DoubleToString(rates[0].open,Digits()),      panel.CellX(0,2,1)+2, panel.CellY(0,2,1)+2,clrNONE,90);
   panel.DrawText("High",  panel.CellX(0,3,0)+2, panel.CellY(0,3,0)+2); panel.DrawText(DoubleToString(rates[0].high,Digits()),      panel.CellX(0,3,1)+2, panel.CellY(0,3,1)+2,clrNONE,90);
   panel.DrawText("Low",   panel.CellX(0,4,0)+2, panel.CellY(0,4,0)+2); panel.DrawText(DoubleToString(rates[0].low,Digits()),       panel.CellX(0,4,1)+2, panel.CellY(0,4,1)+2,clrNONE,90);
   panel.DrawText("Close", panel.CellX(0,5,0)+2, panel.CellY(0,5,0)+2); panel.DrawText(DoubleToString(rates[0].close,Digits()),     panel.CellX(0,5,1)+2, panel.CellY(0,5,1)+2,clrNONE,90);

//--- Output the data of indicator 1 from the specified bar into table 1
   panel.DrawText(indicators.Title(handle_rsi1), panel.CellX(1,0,0)+2, panel.CellY(1,0,0)+2);
   double value1=indicators.GetData(handle_rsi1,0,0,index);
   string value_str1=(value1!=EMPTY_VALUE ? DoubleToString(value1,indicators.Digits(handle_rsi1)) : " ");
   panel.DrawText(value_str1,panel.CellX(1,0,1)+2,panel.CellY(1,0,1)+2,clrNONE,190);

//--- Display a description of the indicator 1 line state
   panel.DrawText("Line state", panel.CellX(1,1,0)+2, panel.CellY(1,1,0)+2);
   ENUM_LINE_STATE state1=indicators.BufferLineState(Symbol(),PERIOD_CURRENT,handle_rsi1,0,0,index);
   panel.DrawText(BufferLineStateDescription(state1),panel.CellX(1,1,1)+2,panel.CellY(1,1,1)+2,clrNONE,190);

//--- Output the data of indicator 2 from the specified bar into table 2
   panel.DrawText(indicators.Title(handle_rsi2), panel.CellX(2,0,0)+2, panel.CellY(2,0,0)+2);
   double value2=indicators.GetDataTo(Symbol(),PERIOD_CURRENT,handle_rsi2,0,0,index);
   string value_str2=(value2!=EMPTY_VALUE ? DoubleToString(value2,indicators.Digits(handle_rsi2)) : " ");
   panel.DrawText(value_str2,panel.CellX(2,0,1)+2,panel.CellY(2,0,1)+2,clrNONE,190);

//--- Display a description of the indicator 2 line state
   panel.DrawText("Line state", panel.CellX(2,1,0)+2, panel.CellY(2,1,0)+2);
   ENUM_LINE_STATE state2=indicators.BufferLineState(Symbol(),PERIOD_CURRENT,handle_rsi2,0,0,index);
   panel.DrawText(BufferLineStateDescription(state2),panel.CellX(2,1,1)+2,panel.CellY(2,1,1)+2,clrNONE,190);

//--- Display description of relationship between indicator 1 line relative to indicator 2 line
   double value21=indicators.GetDataTo(Symbol(),PERIOD_CURRENT,handle_rsi2,0,0,index+1);
   ENUM_LINE_STATE stateR=indicators.BufferLineStateRelative(Symbol(),PERIOD_CURRENT,handle_rsi1,0,0,index,value2,value21);
   string ma1=indicators.Name(handle_rsi1);
   string ma2=indicators.Name(handle_rsi2);
   string state_relative=
     (
      stateR==LINE_STATE_ABOVE      ? StringFormat("%s1 > %s2",ma1,ma2)   :
      stateR==LINE_STATE_BELOW      ? StringFormat("%s1 < %s2",ma1,ma2)           :
      stateR==LINE_STATE_CROSS_DOWN ? "Top-down crossing"   :
      stateR==LINE_STATE_CROSS_UP   ? "Bottom-up crossing"  :
      BufferLineStateDescription(stateR)
     );
   panel.DrawText(StringFormat("%s1 vs %s2",ma1,ma2), panel.CellX(2,2,0)+2, panel.CellY(2,2,0)+2);
   panel.DrawText(state_relative, panel.CellX(2,2,1)+2, panel.CellY(2,2,1)+2,clrNONE,190);

//--- Redraw the chart to immediately display all changes on the panel
   ChartRedraw(ChartID());
  }
//+------------------------------------------------------------------+
Nach dem Kompilieren und Starten des Indikators auf dem M1-Chart, wobei M5 für die Berechnungen ausgewählt wurde, sehen wir:
Der Indikator Relative Vigor Index:
//+------------------------------------------------------------------+
//|                                   TestMSTFRelativeVigorIndex.mq5 |
//|                                  Copyright 2023, MetaQuotes Ltd. |
//|                                             https://www.mql5.com |
//+------------------------------------------------------------------+
#property copyright "Copyright 2023, MetaQuotes Ltd."
#property link      "https://www.mql5.com"
#property version   "1.00"
#property indicator_separate_window
#property indicator_buffers 4
#property indicator_plots   4
//--- enums

//--- plot RVI1
#property indicator_label1  "RVI1"
#property indicator_type1   DRAW_LINE
#property indicator_color1  clrSeaGreen
#property indicator_style1  STYLE_SOLID
#property indicator_width1  1

//--- plot Signal1
#property indicator_label2  "Signal1"
#property indicator_type2   DRAW_LINE
#property indicator_color2  clrOrangeRed
#property indicator_style2  STYLE_SOLID
#property indicator_width2  1

//--- plot RVI2
#property indicator_label3  "RVI2"
#property indicator_type3   DRAW_LINE
#property indicator_color3  clrGreen
#property indicator_style3  STYLE_SOLID
#property indicator_width3  1

//--- plot Signal2
#property indicator_label4  "Signal2"
#property indicator_type4   DRAW_LINE
#property indicator_color4  clrRed
#property indicator_style4  STYLE_SOLID
#property indicator_width4  1

//--- includes
#include <IndMSTF\IndMSTF.mqh>
#include <Dashboard\Dashboard.mqh>
//--- input parameters
input string               InpSymbol      =  NULL;             /* Symbol                     */ // Symbol
input ENUM_TIMEFRAMES      InpTimeframe   =  PERIOD_CURRENT;   /* Timeframe                  */ // Timeframe
input int                  InpPeriod      =  10;               /* Period                     */ // Calculation period
input uchar                InpLineWidth1  =  2;                /* Senior period Line Width   */ // Line width for higher period
input uchar                InpLineWidth2  =  1;                /* Junior period Line Width   */ // Line width for lower period
input bool                 InpAsSeries    =  true;             /* As Series flag             */ // Timeseries flag of indicator buffer arrays

//--- indicator buffers
double         BufferRVI1[];
double         BufferSig1[];
double         BufferRVI2[];
double         BufferSig2[];
//--- global variables
int handle_rvi1;
int handle_rvi2;
CMSTFIndicators indicators;      // An instance of the indicator collection object
//--- variables for the panel
CDashboard *panel=NULL;          // Pointer to the panel object
int         mouse_bar_index;     // Index of the bar the data is taken from
//+------------------------------------------------------------------+
//| Custom indicator initialization function                         |
//+------------------------------------------------------------------+
int OnInit()
  {
//--- Set a timer with an interval of 1 second
   EventSetTimer(1);
//--- Assign the BufferMA1 and BufferMA2 arrays to the plot buffers 0 and 1, respectively
   SetIndexBuffer(0,BufferRVI1,INDICATOR_DATA);
   SetIndexBuffer(1,BufferSig1,INDICATOR_DATA);
   SetIndexBuffer(2,BufferRVI2,INDICATOR_DATA);
   SetIndexBuffer(3,BufferSig2,INDICATOR_DATA);
//--- Set the line width
   int w1=0,w2=0;
   if(InpTimeframe>Period())
     {
      w1=InpLineWidth2;
      w2=InpLineWidth1;
     }
   else
     {
      w1=InpLineWidth1;
      w2=InpLineWidth2;
     }
   PlotIndexSetInteger(0,PLOT_LINE_WIDTH,w1);
   PlotIndexSetInteger(1,PLOT_LINE_WIDTH,w1);
   PlotIndexSetInteger(2,PLOT_LINE_WIDTH,w2);
   PlotIndexSetInteger(3,PLOT_LINE_WIDTH,w2);
//--- sets indicator shift

//--- Set the timeseries flags for the indicator buffer arrays (for testing, to see that there is no difference)
   ArraySetAsSeries(BufferRVI1,InpAsSeries);
   ArraySetAsSeries(BufferSig1,InpAsSeries);
   ArraySetAsSeries(BufferRVI2,InpAsSeries);
   ArraySetAsSeries(BufferSig2,InpAsSeries);

//--- Create two indicators of the same type
//--- The first one is calculated on the current chart symbol/period, the second - on those specified in the settings
   handle_rvi1=indicators.AddNewRVI(NULL,PERIOD_CURRENT,InpPeriod);
   handle_rvi2=indicators.AddNewRVI(InpSymbol,InpTimeframe,InpPeriod);

//--- If failed to create indicator handles, return initialization error
   if(handle_rvi1==INVALID_HANDLE || handle_rvi2==INVALID_HANDLE)
      return INIT_FAILED;
//--- Set descriptions for indicator lines from buffer descriptions of calculation part of created indicators
   indicators.SetPlotLabelFromBuffer(0,handle_rvi1,0);
   indicators.SetPlotLabelFromBuffer(1,handle_rvi1,1);
   indicators.SetPlotLabelFromBuffer(2,handle_rvi2,0);
   indicators.SetPlotLabelFromBuffer(3,handle_rvi2,1);

//--- Dashboard
//--- Create the panel
   int width=231;
   panel=new CDashboard(1,20,20,width,264,0);
   if(panel==NULL)
     {
      Print("Error. Failed to create panel object");
      return INIT_FAILED;
     }
//--- Set font parameters
   panel.SetFontParams("Calibri",9);
//--- Display the panel with the "Symbol, Timeframe description" header text
   panel.View(Symbol()+", "+StringSubstr(EnumToString(Period()),7));

//--- Create a table with ID 0 to display bar data in it
   panel.CreateNewTable(0);
//--- Draw a table with ID 0 on the panel background
   panel.DrawGrid(0,2,20,6,2,18,width/2-2);

//--- Create a table with ID 1 to display the data of indicator 1
   panel.CreateNewTable(1);
//--- Get the Y2 table coordinate with ID 0 and
//--- set the Y1 coordinate for the table with ID 1
   int y1=panel.TableY2(0)+22;
//--- Draw a table with ID 1 on the panel background
   panel.DrawGrid(1,2,y1,2,2,18,width/2-2);

//--- Create a table with ID 2 to display the data of indicator 2
   panel.CreateNewTable(2);
//--- Get the Y2 coordinate of the table with ID 1 and
//--- set the Y1 coordinate for the table with ID 2
   int y2=panel.TableY2(1)+3;
//--- Draw a table with ID 2 on the background of the dashboard
   panel.DrawGrid(2,2,y2,3,2,18,width/2-2);

//--- Initialize the variable with the index of the mouse cursor bar
   mouse_bar_index=0;
//--- Display the data of the current bar on the panel
   DrawData(mouse_bar_index,TimeCurrent());

//--- Successful initialization
   return(INIT_SUCCEEDED);
  }
//+------------------------------------------------------------------+
//| Custom indicator deinitialization function                       |
//+------------------------------------------------------------------+
void OnDeinit(const int reason)
  {
//--- Delete the timer
   EventKillTimer();
//--- If the panel object exists, delete it
   if(panel!=NULL)
      delete panel;
//--- Delete all comments
   Comment("");
  }
//+------------------------------------------------------------------+
//| Custom indicator iteration function                              |
//+------------------------------------------------------------------+
int OnCalculate(const int rates_total,
                const int prev_calculated,
                const datetime &time[],
                const double &open[],
                const double &high[],
                const double &low[],
                const double &close[],
                const long &tick_volume[],
                const long &volume[],
                const int &spread[])
  {
//--- Number of bars for calculation
   int limit=rates_total-prev_calculated;
//--- If limit > 1, then this is the first calculation or change in the history
   if(limit>1)
     {
      //--- specify all the available history for calculation
      limit=rates_total-1;
      /*
      // If the indicator has any buffers that display other calculations (not multi-indicators),
      // initialize them here with the "empty" value set for these buffers
      */
     }
//--- Calculate all created multi-symbol multi-period indicators
   if(!indicators.Calculate())
      return 0;

//--- Display the bar data under cursor (or current bar if cursor is outside the chart) on the dashboard
   DrawData(mouse_bar_index,time[mouse_bar_index]);

//--- From buffers of calculated indicators, output data to indicator buffers
   if(!indicators.DataToBuffer(NULL,PERIOD_CURRENT,handle_rvi1,0,0,limit,BufferRVI1))
      return 0;
   if(!indicators.DataToBuffer(NULL,PERIOD_CURRENT,handle_rvi1,1,0,limit,BufferSig1))
      return 0;

   if(!indicators.DataToBuffer(NULL,PERIOD_CURRENT,handle_rvi2,0,0,limit,BufferRVI2))
      return 0;
   if(!indicators.DataToBuffer(NULL,PERIOD_CURRENT,handle_rvi2,1,0,limit,BufferSig2))
      return 0;

//--- return value of prev_calculated for the next call
   return(rates_total);
  }
//+------------------------------------------------------------------+
//| Timer function                                                   |
//+------------------------------------------------------------------+
void OnTimer()
  {
//--- Call the indicator collection timer
   indicators.OnTimer();
  }
//+------------------------------------------------------------------+
//| ChartEvent function                                              |
//+------------------------------------------------------------------+
void OnChartEvent(const int id,
                  const long &lparam,
                  const double &dparam,
                  const string &sparam)
  {
//--- Handling the panel
//--- Call the panel event handler
   panel.OnChartEvent(id,lparam,dparam,sparam);

//--- If the cursor moves or a click is made on the chart
   if(id==CHARTEVENT_MOUSE_MOVE || id==CHARTEVENT_CLICK)
     {
      //--- Declare the variables to record time and price coordinates in them
      datetime time=0;
      double price=0;
      int wnd=0;
      //--- If the cursor coordinates are converted to date and time
      if(ChartXYToTimePrice(ChartID(),(int)lparam,(int)dparam,wnd,time,price))
        {
         //--- write the bar index where the cursor is located to a global variable
         mouse_bar_index=iBarShift(Symbol(),PERIOD_CURRENT,time);
         //--- Display the bar data under the cursor on the panel
         DrawData(mouse_bar_index,time);
        }
     }

//--- If we received a custom event, display the appropriate message in the journal
   if(id>CHARTEVENT_CUSTOM)
     {
      //--- Here we can implement handling a click on the close button on the panel
      PrintFormat("%s: Event id=%ld, object id (lparam): %lu, event message (sparam): %s",__FUNCTION__,id,lparam,sparam);
     }
  }
//+------------------------------------------------------------------+
//| Display data from the specified timeseries index to the panel    |
//+------------------------------------------------------------------+
void DrawData(const int index,const datetime time)
  {
//--- Declare the variables to receive data in them
   MqlRates rates[1];

//--- Exit if unable to get the bar data by the specified index
   if(CopyRates(Symbol(),PERIOD_CURRENT,index,1,rates)!=1)
      return;

//--- Set font parameters for bar and indicator data headers
   int  size=0;
   uint flags=0;
   uint angle=0;
   string name=panel.FontParams(size,flags,angle);
   panel.SetFontParams(name,9,FW_BOLD);
   panel.DrawText("Bar data ["+(string)index+"]",3,panel.TableY1(0)-16,clrMaroon,panel.Width()-6);
   panel.DrawText("Indicators data ["+(string)index+"]",3,panel.TableY1(1)-16,clrGreen,panel.Width()-6);
//--- Set font parameters for bar and indicator data
   panel.SetFontParams(name,9);

//--- Display the data of the specified bar in table 0 on the panel
   panel.DrawText("Date",  panel.CellX(0,0,0)+2, panel.CellY(0,0,0)+2); panel.DrawText(TimeToString(  rates[0].time,TIME_DATE),     panel.CellX(0,0,1)+2, panel.CellY(0,0,1)+2,clrNONE,90);
   panel.DrawText("Time",  panel.CellX(0,1,0)+2, panel.CellY(0,1,0)+2); panel.DrawText(TimeToString(  rates[0].time,TIME_MINUTES),  panel.CellX(0,1,1)+2, panel.CellY(0,1,1)+2,clrNONE,90);
   panel.DrawText("Open",  panel.CellX(0,2,0)+2, panel.CellY(0,2,0)+2); panel.DrawText(DoubleToString(rates[0].open,Digits()),      panel.CellX(0,2,1)+2, panel.CellY(0,2,1)+2,clrNONE,90);
   panel.DrawText("High",  panel.CellX(0,3,0)+2, panel.CellY(0,3,0)+2); panel.DrawText(DoubleToString(rates[0].high,Digits()),      panel.CellX(0,3,1)+2, panel.CellY(0,3,1)+2,clrNONE,90);
   panel.DrawText("Low",   panel.CellX(0,4,0)+2, panel.CellY(0,4,0)+2); panel.DrawText(DoubleToString(rates[0].low,Digits()),       panel.CellX(0,4,1)+2, panel.CellY(0,4,1)+2,clrNONE,90);
   panel.DrawText("Close", panel.CellX(0,5,0)+2, panel.CellY(0,5,0)+2); panel.DrawText(DoubleToString(rates[0].close,Digits()),     panel.CellX(0,5,1)+2, panel.CellY(0,5,1)+2,clrNONE,90);

//--- Output the data of indicator 1 from the specified bar into table 1
   panel.DrawText(indicators.Title(handle_rvi1), panel.CellX(1,0,0)+2, panel.CellY(1,0,0)+2);
   double value1=indicators.GetData(handle_rvi1,0,0,index);
   string value_str1=(value1!=EMPTY_VALUE ? DoubleToString(value1,indicators.Digits(handle_rvi1)) : " ");
   panel.DrawText(value_str1,panel.CellX(1,0,1)+2,panel.CellY(1,0,1)+2,clrNONE,190);

//--- Display a description of the indicator 1 line state
   panel.DrawText("Line state", panel.CellX(1,1,0)+2, panel.CellY(1,1,0)+2);
   ENUM_LINE_STATE state1=indicators.BufferLineState(Symbol(),PERIOD_CURRENT,handle_rvi1,0,0,index);
   panel.DrawText(BufferLineStateDescription(state1),panel.CellX(1,1,1)+2,panel.CellY(1,1,1)+2,clrNONE,190);

//--- Output the data of indicator 2 from the specified bar into table 2
   panel.DrawText(indicators.Title(handle_rvi2), panel.CellX(2,0,0)+2, panel.CellY(2,0,0)+2);
   double value2=indicators.GetDataTo(Symbol(),PERIOD_CURRENT,handle_rvi2,0,0,index);
   string value_str2=(value2!=EMPTY_VALUE ? DoubleToString(value2,indicators.Digits(handle_rvi2)) : " ");
   panel.DrawText(value_str2,panel.CellX(2,0,1)+2,panel.CellY(2,0,1)+2,clrNONE,190);

//--- Display a description of the indicator 2 line state
   panel.DrawText("Line state", panel.CellX(2,1,0)+2, panel.CellY(2,1,0)+2);
   ENUM_LINE_STATE state2=indicators.BufferLineState(Symbol(),PERIOD_CURRENT,handle_rvi2,0,0,index);
   panel.DrawText(BufferLineStateDescription(state2),panel.CellX(2,1,1)+2,panel.CellY(2,1,1)+2,clrNONE,190);

//--- Display description of relationship between indicator 1 line relative to indicator 2 line
   double value21=indicators.GetDataTo(Symbol(),PERIOD_CURRENT,handle_rvi2,0,0,index+1);
   ENUM_LINE_STATE stateR=indicators.BufferLineStateRelative(Symbol(),PERIOD_CURRENT,handle_rvi1,0,0,index,value2,value21);
   string ma1=indicators.Name(handle_rvi1);
   string ma2=indicators.Name(handle_rvi2);
   string state_relative=
     (
      stateR==LINE_STATE_ABOVE      ? StringFormat("%s1 > %s2",ma1,ma2)   :
      stateR==LINE_STATE_BELOW      ? StringFormat("%s1 < %s2",ma1,ma2)           :
      stateR==LINE_STATE_CROSS_DOWN ? "Top-down crossing"   :
      stateR==LINE_STATE_CROSS_UP   ? "Bottom-up crossing"  :
      BufferLineStateDescription(stateR)
     );
   panel.DrawText(StringFormat("%s1 vs %s2",ma1,ma2), panel.CellX(2,2,0)+2, panel.CellY(2,2,0)+2);
   panel.DrawText(state_relative, panel.CellX(2,2,1)+2, panel.CellY(2,2,1)+2,clrNONE,190);

//--- Redraw the chart to immediately display all changes on the panel
   ChartRedraw(ChartID());
  }
//+------------------------------------------------------------------+
Nach dem Kompilieren und Starten des Indikators auf dem M1-Chart, wobei M5 für die Berechnungen ausgewählt wurde, sehen wir:
Der Indikator Standard Deviation:
//+------------------------------------------------------------------+
//|                                         TestMSTFStdDeviation.mq5 |
//|                                  Copyright 2023, MetaQuotes Ltd. |
//|                                             https://www.mql5.com |
//+------------------------------------------------------------------+
#property copyright "Copyright 2023, MetaQuotes Ltd."
#property link      "https://www.mql5.com"
#property version   "1.00"
#property indicator_separate_window
#property indicator_buffers 2
#property indicator_plots   2
//--- enums

//--- plot StdDev1
#property indicator_label1  "StdDev1"
#property indicator_type1   DRAW_LINE
#property indicator_color1  clrDodgerBlue
#property indicator_style1  STYLE_SOLID
#property indicator_width1  1

//--- plot StdDev2
#property indicator_label2  "StdDev2"
#property indicator_type2   DRAW_LINE
#property indicator_color2  clrRed
#property indicator_style2  STYLE_SOLID
#property indicator_width2  1

//--- includes
#include <IndMSTF\IndMSTF.mqh>
#include <Dashboard\Dashboard.mqh>
//--- input parameters
input string               InpSymbol      =  NULL;             /* Symbol                     */ // Symbol
input ENUM_TIMEFRAMES      InpTimeframe   =  PERIOD_CURRENT;   /* Timeframe                  */ // Timeframe
input int                  InpPeriod      =  20;               /* Period                     */ // Calculation period
input int                  InpShift       =  0;                /* Shift                      */ // Horizontal shift
input ENUM_MA_METHOD       InpMethod      =  MODE_SMA;         /* Method                     */ // Deviation
input ENUM_APPLIED_PRICE   InpPrice       =  PRICE_CLOSE;      /* Applied Price              */ // Price used for calculations
input uchar                InpLineWidth1  =  2;                /* Senior period Line Width   */ // Line width for higher period
input uchar                InpLineWidth2  =  1;                /* Junior period Line Width   */ // Line width for lower period
input bool                 InpAsSeries    =  true;             /* As Series flag             */ // Timeseries flag of indicator buffer arrays

//--- indicator buffers
double         BufferStdDev1[];
double         BufferStdDev2[];
//--- global variables
int handle_stddev1;
int handle_stddev2;
CMSTFIndicators indicators;      // An instance of the indicator collection object
//--- variables for the panel
CDashboard *panel=NULL;          // Pointer to the panel object
int         mouse_bar_index;     // Index of the bar the data is taken from
//+------------------------------------------------------------------+
//| Custom indicator initialization function                         |
//+------------------------------------------------------------------+
int OnInit()
  {
//--- Set a timer with an interval of 1 second
   EventSetTimer(1);
//--- Assign the BufferMA1 and BufferMA2 arrays to the plot buffers 0 and 1, respectively
   SetIndexBuffer(0,BufferStdDev1,INDICATOR_DATA);
   SetIndexBuffer(1,BufferStdDev2,INDICATOR_DATA);
//--- Set the line width
   int w1=0,w2=0;
   if(InpTimeframe>Period())
     {
      w1=InpLineWidth2;
      w2=InpLineWidth1;
     }
   else
     {
      w1=InpLineWidth1;
      w2=InpLineWidth2;
     }
   PlotIndexSetInteger(0,PLOT_LINE_WIDTH,w1);
   PlotIndexSetInteger(1,PLOT_LINE_WIDTH,w2);
//--- sets indicator shift

//--- Set the timeseries flags for the indicator buffer arrays (for testing, to see that there is no difference)
   ArraySetAsSeries(BufferStdDev1,InpAsSeries);
   ArraySetAsSeries(BufferStdDev2,InpAsSeries);

//--- Create two indicators of the same type
//--- The first one is calculated on the current chart symbol/period, the second - on those specified in the settings
   handle_stddev1=indicators.AddNewStdDev(NULL,PERIOD_CURRENT,InpPeriod,InpShift,InpMethod,InpPrice);
   handle_stddev2=indicators.AddNewStdDev(InpSymbol,InpTimeframe,InpPeriod,InpShift,InpMethod,InpPrice);

//--- If failed to create indicator handles, return initialization error
   if(handle_stddev1==INVALID_HANDLE || handle_stddev2==INVALID_HANDLE)
      return INIT_FAILED;
//--- Set descriptions for indicator lines from buffer descriptions of calculation part of created indicators
   indicators.SetPlotLabelFromBuffer(0,handle_stddev1,0);
   indicators.SetPlotLabelFromBuffer(1,handle_stddev2,0);

//--- Dashboard
//--- Create the panel
   int width=290;
   panel=new CDashboard(1,20,20,width,264,0);
   if(panel==NULL)
     {
      Print("Error. Failed to create panel object");
      return INIT_FAILED;
     }
//--- Set font parameters
   panel.SetFontParams("Calibri",9);
//--- Display the panel with the "Symbol, Timeframe description" header text
   panel.View(Symbol()+", "+StringSubstr(EnumToString(Period()),7));

//--- Create a table with ID 0 to display bar data in it
   panel.CreateNewTable(0);
//--- Draw a table with ID 0 on the panel background
   panel.DrawGrid(0,2,20,6,2,18,width/2-2);

//--- Create a table with ID 1 to display the data of indicator 1
   panel.CreateNewTable(1);
//--- Get the Y2 table coordinate with ID 0 and
//--- set the Y1 coordinate for the table with ID 1
   int y1=panel.TableY2(0)+22;
//--- Draw a table with ID 1 on the panel background
   panel.DrawGrid(1,2,y1,2,2,18,width/2-2);

//--- Create a table with ID 2 to display the data of indicator 2
   panel.CreateNewTable(2);
//--- Get the Y2 coordinate of the table with ID 1 and
//--- set the Y1 coordinate for the table with ID 2
   int y2=panel.TableY2(1)+3;
//--- Draw a table with ID 2 on the background of the dashboard
   panel.DrawGrid(2,2,y2,3,2,18,width/2-2);

//--- Initialize the variable with the index of the mouse cursor bar
   mouse_bar_index=0;
//--- Display the data of the current bar on the panel
   DrawData(mouse_bar_index,TimeCurrent());

//--- Successful initialization
   return(INIT_SUCCEEDED);
  }
//+------------------------------------------------------------------+
//| Custom indicator deinitialization function                       |
//+------------------------------------------------------------------+
void OnDeinit(const int reason)
  {
//--- Delete the timer
   EventKillTimer();
//--- If the panel object exists, delete it
   if(panel!=NULL)
      delete panel;
//--- Delete all comments
   Comment("");
  }
//+------------------------------------------------------------------+
//| Custom indicator iteration function                              |
//+------------------------------------------------------------------+
int OnCalculate(const int rates_total,
                const int prev_calculated,
                const datetime &time[],
                const double &open[],
                const double &high[],
                const double &low[],
                const double &close[],
                const long &tick_volume[],
                const long &volume[],
                const int &spread[])
  {
//--- Number of bars for calculation
   int limit=rates_total-prev_calculated;
//--- If limit > 1, then this is the first calculation or change in the history
   if(limit>1)
     {
      //--- specify all the available history for calculation
      limit=rates_total-1;
      /*
      // If the indicator has any buffers that display other calculations (not multi-indicators),
      // initialize them here with the "empty" value set for these buffers
      */
     }
//--- Calculate all created multi-symbol multi-period indicators
   if(!indicators.Calculate())
      return 0;

//--- Display the bar data under cursor (or current bar if cursor is outside the chart) on the dashboard
   DrawData(mouse_bar_index,time[mouse_bar_index]);

//--- From buffers of calculated indicators, output data to indicator buffers
   if(!indicators.DataToBuffer(NULL,PERIOD_CURRENT,handle_stddev1,0,0,limit,BufferStdDev1))
      return 0;
   if(!indicators.DataToBuffer(NULL,PERIOD_CURRENT,handle_stddev2,0,0,limit,BufferStdDev2))
      return 0;

//--- return value of prev_calculated for the next call
   return(rates_total);
  }
//+------------------------------------------------------------------+
//| Timer function                                                   |
//+------------------------------------------------------------------+
void OnTimer()
  {
//--- Call the indicator collection timer
   indicators.OnTimer();
  }
//+------------------------------------------------------------------+
//| ChartEvent function                                              |
//+------------------------------------------------------------------+
void OnChartEvent(const int id,
                  const long &lparam,
                  const double &dparam,
                  const string &sparam)
  {
//--- Handling the panel
//--- Call the panel event handler
   panel.OnChartEvent(id,lparam,dparam,sparam);

//--- If the cursor moves or a click is made on the chart
   if(id==CHARTEVENT_MOUSE_MOVE || id==CHARTEVENT_CLICK)
     {
      //--- Declare the variables to record time and price coordinates in them
      datetime time=0;
      double price=0;
      int wnd=0;
      //--- If the cursor coordinates are converted to date and time
      if(ChartXYToTimePrice(ChartID(),(int)lparam,(int)dparam,wnd,time,price))
        {
         //--- write the bar index where the cursor is located to a global variable
         mouse_bar_index=iBarShift(Symbol(),PERIOD_CURRENT,time);
         //--- Display the bar data under the cursor on the panel
         DrawData(mouse_bar_index,time);
        }
     }

//--- If we received a custom event, display the appropriate message in the journal
   if(id>CHARTEVENT_CUSTOM)
     {
      //--- Here we can implement handling a click on the close button on the panel
      PrintFormat("%s: Event id=%ld, object id (lparam): %lu, event message (sparam): %s",__FUNCTION__,id,lparam,sparam);
     }
  }
//+------------------------------------------------------------------+
//| Display data from the specified timeseries index to the panel    |
//+------------------------------------------------------------------+
void DrawData(const int index,const datetime time)
  {
//--- Declare the variables to receive data in them
   MqlRates rates[1];

//--- Exit if unable to get the bar data by the specified index
   if(CopyRates(Symbol(),PERIOD_CURRENT,index,1,rates)!=1)
      return;

//--- Set font parameters for bar and indicator data headers
   int  size=0;
   uint flags=0;
   uint angle=0;
   string name=panel.FontParams(size,flags,angle);
   panel.SetFontParams(name,9,FW_BOLD);
   panel.DrawText("Bar data ["+(string)index+"]",3,panel.TableY1(0)-16,clrMaroon,panel.Width()-6);
   panel.DrawText("Indicators data ["+(string)index+"]",3,panel.TableY1(1)-16,clrGreen,panel.Width()-6);
//--- Set font parameters for bar and indicator data
   panel.SetFontParams(name,9);

//--- Display the data of the specified bar in table 0 on the panel
   panel.DrawText("Date",  panel.CellX(0,0,0)+2, panel.CellY(0,0,0)+2); panel.DrawText(TimeToString(  rates[0].time,TIME_DATE),     panel.CellX(0,0,1)+2, panel.CellY(0,0,1)+2,clrNONE,90);
   panel.DrawText("Time",  panel.CellX(0,1,0)+2, panel.CellY(0,1,0)+2); panel.DrawText(TimeToString(  rates[0].time,TIME_MINUTES),  panel.CellX(0,1,1)+2, panel.CellY(0,1,1)+2,clrNONE,90);
   panel.DrawText("Open",  panel.CellX(0,2,0)+2, panel.CellY(0,2,0)+2); panel.DrawText(DoubleToString(rates[0].open,Digits()),      panel.CellX(0,2,1)+2, panel.CellY(0,2,1)+2,clrNONE,90);
   panel.DrawText("High",  panel.CellX(0,3,0)+2, panel.CellY(0,3,0)+2); panel.DrawText(DoubleToString(rates[0].high,Digits()),      panel.CellX(0,3,1)+2, panel.CellY(0,3,1)+2,clrNONE,90);
   panel.DrawText("Low",   panel.CellX(0,4,0)+2, panel.CellY(0,4,0)+2); panel.DrawText(DoubleToString(rates[0].low,Digits()),       panel.CellX(0,4,1)+2, panel.CellY(0,4,1)+2,clrNONE,90);
   panel.DrawText("Close", panel.CellX(0,5,0)+2, panel.CellY(0,5,0)+2); panel.DrawText(DoubleToString(rates[0].close,Digits()),     panel.CellX(0,5,1)+2, panel.CellY(0,5,1)+2,clrNONE,90);

//--- Output the data of indicator 1 from the specified bar into table 1
   panel.DrawText(indicators.Title(handle_stddev1), panel.CellX(1,0,0)+2, panel.CellY(1,0,0)+2);
   double value1=indicators.GetData(handle_stddev1,0,0,index);
   string value_str1=(value1!=EMPTY_VALUE ? DoubleToString(value1,indicators.Digits(handle_stddev1)) : " ");
   panel.DrawText(value_str1,panel.CellX(1,0,1)+2,panel.CellY(1,0,1)+2,clrNONE,110);

//--- Display a description of the indicator 1 line state
   panel.DrawText("Line state", panel.CellX(1,1,0)+2, panel.CellY(1,1,0)+2);
   ENUM_LINE_STATE state1=indicators.BufferLineState(Symbol(),PERIOD_CURRENT,handle_stddev1,0,0,index);
   panel.DrawText(BufferLineStateDescription(state1),panel.CellX(1,1,1)+2,panel.CellY(1,1,1)+2,clrNONE,110);

//--- Output the data of indicator 2 from the specified bar into table 2
   panel.DrawText(indicators.Title(handle_stddev2), panel.CellX(2,0,0)+2, panel.CellY(2,0,0)+2);
   double value2=indicators.GetDataTo(Symbol(),PERIOD_CURRENT,handle_stddev2,0,0,index);
   string value_str2=(value2!=EMPTY_VALUE ? DoubleToString(value2,indicators.Digits(handle_stddev2)) : " ");
   panel.DrawText(value_str2,panel.CellX(2,0,1)+2,panel.CellY(2,0,1)+2,clrNONE,110);

//--- Display a description of the indicator 2 line state
   panel.DrawText("Line state", panel.CellX(2,1,0)+2, panel.CellY(2,1,0)+2);
   ENUM_LINE_STATE state2=indicators.BufferLineState(Symbol(),PERIOD_CURRENT,handle_stddev2,0,0,index);
   panel.DrawText(BufferLineStateDescription(state2),panel.CellX(2,1,1)+2,panel.CellY(2,1,1)+2,clrNONE,110);

//--- Display description of relationship between indicator 1 line relative to indicator 2 line
   double value21=indicators.GetDataTo(Symbol(),PERIOD_CURRENT,handle_stddev2,0,0,index+1);
   ENUM_LINE_STATE stateR=indicators.BufferLineStateRelative(Symbol(),PERIOD_CURRENT,handle_stddev1,0,0,index,value2,value21);
   string ma1=indicators.Name(handle_stddev1);
   string ma2=indicators.Name(handle_stddev2);
   string state_relative=
     (
      stateR==LINE_STATE_ABOVE      ? StringFormat("%s1 > %s2",ma1,ma2)   :
      stateR==LINE_STATE_BELOW      ? StringFormat("%s1 < %s2",ma1,ma2)           :
      stateR==LINE_STATE_CROSS_DOWN ? "Top-down crossing"   :
      stateR==LINE_STATE_CROSS_UP   ? "Bottom-up crossing"  :
      BufferLineStateDescription(stateR)
     );
   panel.DrawText(StringFormat("%s1 vs %s2",ma1,ma2), panel.CellX(2,2,0)+2, panel.CellY(2,2,0)+2);
   panel.DrawText(state_relative, panel.CellX(2,2,1)+2, panel.CellY(2,2,1)+2,clrNONE,110);

//--- Redraw the chart to immediately display all changes on the panel
   ChartRedraw(ChartID());
  }
//+------------------------------------------------------------------+
Nach dem Kompilieren und Starten des Indikators auf dem M1-Chart, wobei M5 für die Berechnungen ausgewählt wurde, sehen wir:
Der Indikator Stochastic Oscillator:
//+------------------------------------------------------------------+
//|                                 TestMSTFStochasticOdcillator.mq5 |
//|                                  Copyright 2023, MetaQuotes Ltd. |
//|                                             https://www.mql5.com |
//+------------------------------------------------------------------+
#property copyright "Copyright 2023, MetaQuotes Ltd."
#property link      "https://www.mql5.com"
#property version   "1.00"
#property indicator_separate_window
#property indicator_buffers 4
#property indicator_plots   4
//--- enums

//--- plot RVI1
#property indicator_label1  "RVI1"
#property indicator_type1   DRAW_LINE
#property indicator_color1  clrSeaGreen
#property indicator_style1  STYLE_SOLID
#property indicator_width1  1

//--- plot Signal1
#property indicator_label2  "Signal1"
#property indicator_type2   DRAW_LINE
#property indicator_color2  clrOrangeRed
#property indicator_style2  STYLE_SOLID
#property indicator_width2  1

//--- plot RVI2
#property indicator_label3  "RVI2"
#property indicator_type3   DRAW_LINE
#property indicator_color3  clrGreen
#property indicator_style3  STYLE_SOLID
#property indicator_width3  1

//--- plot Signal2
#property indicator_label4  "Signal2"
#property indicator_type4   DRAW_LINE
#property indicator_color4  clrRed
#property indicator_style4  STYLE_SOLID
#property indicator_width4  1

//--- includes
#include <IndMSTF\IndMSTF.mqh>
#include <Dashboard\Dashboard.mqh>
//--- input parameters
input string               InpSymbol      =  NULL;             /* Symbol                     */ // Symbol
input ENUM_TIMEFRAMES      InpTimeframe   =  PERIOD_CURRENT;   /* Timeframe                  */ // Timeframe
input int                  InpKPeriod     =  5;                /* %K Period                  */
input int                  InpDPeriod     =  3;                /* %D Period                  */
input int                  InpSlowing     =  3;                /* Slowing                    */
input ENUM_STO_PRICE       InpPrice       =  STO_LOWHIGH;      /* Applied Price              */
input ENUM_MA_METHOD       InpMethod      =  MODE_SMA;         /* Method                     */ // Calculation method
input uchar                InpLineWidth1  =  2;                /* Senior period Line Width   */ // Line width for higher period
input uchar                InpLineWidth2  =  1;                /* Junior period Line Width   */ // Line width for lower period
input bool                 InpAsSeries    =  true;             /* As Series flag             */ // Timeseries flag of indicator buffer arrays

//--- indicator buffers
double         BufferStoch1[];
double         BufferSig1[];
double         BufferStoch2[];
double         BufferSig2[];
//--- global variables
int handle_stoch1;
int handle_stoch2;
CMSTFIndicators indicators;      // An instance of the indicator collection object
//--- variables for the panel
CDashboard *panel=NULL;          // Pointer to the panel object
int         mouse_bar_index;     // Index of the bar the data is taken from
//+------------------------------------------------------------------+
//| Custom indicator initialization function                         |
//+------------------------------------------------------------------+
int OnInit()
  {
//--- Set a timer with an interval of 1 second
   EventSetTimer(1);
//--- Assign the BufferMA1 and BufferMA2 arrays to the plot buffers 0 and 1, respectively
   SetIndexBuffer(0,BufferStoch1,INDICATOR_DATA);
   SetIndexBuffer(1,BufferSig1,INDICATOR_DATA);
   SetIndexBuffer(2,BufferStoch2,INDICATOR_DATA);
   SetIndexBuffer(3,BufferSig2,INDICATOR_DATA);
//--- Set the line width
   int w1=0,w2=0;
   if(InpTimeframe>Period())
     {
      w1=InpLineWidth2;
      w2=InpLineWidth1;
     }
   else
     {
      w1=InpLineWidth1;
      w2=InpLineWidth2;
     }
   PlotIndexSetInteger(0,PLOT_LINE_WIDTH,w1);
   PlotIndexSetInteger(1,PLOT_LINE_WIDTH,w1);
   PlotIndexSetInteger(2,PLOT_LINE_WIDTH,w2);
   PlotIndexSetInteger(3,PLOT_LINE_WIDTH,w2);
//--- sets indicator shift

//--- Set the timeseries flags for the indicator buffer arrays (for testing, to see that there is no difference)
   ArraySetAsSeries(BufferStoch1,InpAsSeries);
   ArraySetAsSeries(BufferSig1,InpAsSeries);
   ArraySetAsSeries(BufferStoch2,InpAsSeries);
   ArraySetAsSeries(BufferSig2,InpAsSeries);

//--- Create two indicators of the same type
//--- The first one is calculated on the current chart symbol/period, the second - on those specified in the settings
   handle_stoch1=indicators.AddNewStochastic(NULL,PERIOD_CURRENT,InpKPeriod,InpDPeriod,InpSlowing,InpMethod,InpPrice);
   handle_stoch2=indicators.AddNewStochastic(InpSymbol,InpTimeframe,InpKPeriod,InpDPeriod,InpSlowing,InpMethod,InpPrice);

//--- If failed to create indicator handles, return initialization error
   if(handle_stoch1==INVALID_HANDLE || handle_stoch2==INVALID_HANDLE)
      return INIT_FAILED;
//--- Set descriptions for indicator lines from buffer descriptions of calculation part of created indicators
   indicators.SetPlotLabelFromBuffer(0,handle_stoch1,0);
   indicators.SetPlotLabelFromBuffer(1,handle_stoch1,1);
   indicators.SetPlotLabelFromBuffer(2,handle_stoch2,0);
   indicators.SetPlotLabelFromBuffer(3,handle_stoch2,1);

//--- Dashboard
//--- Create the panel
   int width=271;
   panel=new CDashboard(1,20,20,width,264,0);
   if(panel==NULL)
     {
      Print("Error. Failed to create panel object");
      return INIT_FAILED;
     }
//--- Set font parameters
   panel.SetFontParams("Calibri",9);
//--- Display the panel with the "Symbol, Timeframe description" header text
   panel.View(Symbol()+", "+StringSubstr(EnumToString(Period()),7));

//--- Create a table with ID 0 to display bar data in it
   panel.CreateNewTable(0);
//--- Draw a table with ID 0 on the panel background
   panel.DrawGrid(0,2,20,6,2,18,width/2-2);

//--- Create a table with ID 1 to display the data of indicator 1
   panel.CreateNewTable(1);
//--- Get the Y2 table coordinate with ID 0 and
//--- set the Y1 coordinate for the table with ID 1
   int y1=panel.TableY2(0)+22;
//--- Draw a table with ID 1 on the panel background
   panel.DrawGrid(1,2,y1,2,2,18,width/2-2);

//--- Create a table with ID 2 to display the data of indicator 2
   panel.CreateNewTable(2);
//--- Get the Y2 coordinate of the table with ID 1 and
//--- set the Y1 coordinate for the table with ID 2
   int y2=panel.TableY2(1)+3;
//--- Draw a table with ID 2 on the background of the dashboard
   panel.DrawGrid(2,2,y2,3,2,18,width/2-2);

//--- Initialize the variable with the index of the mouse cursor bar
   mouse_bar_index=0;
//--- Display the data of the current bar on the panel
   DrawData(mouse_bar_index,TimeCurrent());

//--- Successful initialization
   return(INIT_SUCCEEDED);
  }
//+------------------------------------------------------------------+
//| Custom indicator deinitialization function                       |
//+------------------------------------------------------------------+
void OnDeinit(const int reason)
  {
//--- Delete the timer
   EventKillTimer();
//--- If the panel object exists, delete it
   if(panel!=NULL)
      delete panel;
//--- Delete all comments
   Comment("");
  }
//+------------------------------------------------------------------+
//| Custom indicator iteration function                              |
//+------------------------------------------------------------------+
int OnCalculate(const int rates_total,
                const int prev_calculated,
                const datetime &time[],
                const double &open[],
                const double &high[],
                const double &low[],
                const double &close[],
                const long &tick_volume[],
                const long &volume[],
                const int &spread[])
  {
//--- Number of bars for calculation
   int limit=rates_total-prev_calculated;
//--- If limit > 1, then this is the first calculation or change in the history
   if(limit>1)
     {
      //--- specify all the available history for calculation
      limit=rates_total-1;
      /*
      // If the indicator has any buffers that display other calculations (not multi-indicators),
      // initialize them here with the "empty" value set for these buffers
      */
     }
//--- Calculate all created multi-symbol multi-period indicators
   if(!indicators.Calculate())
      return 0;

//--- Display the bar data under cursor (or current bar if cursor is outside the chart) on the dashboard
   DrawData(mouse_bar_index,time[mouse_bar_index]);

//--- From buffers of calculated indicators, output data to indicator buffers
   if(!indicators.DataToBuffer(NULL,PERIOD_CURRENT,handle_stoch1,0,0,limit,BufferStoch1))
      return 0;
   if(!indicators.DataToBuffer(NULL,PERIOD_CURRENT,handle_stoch1,1,0,limit,BufferSig1))
      return 0;

   if(!indicators.DataToBuffer(NULL,PERIOD_CURRENT,handle_stoch2,0,0,limit,BufferStoch2))
      return 0;
   if(!indicators.DataToBuffer(NULL,PERIOD_CURRENT,handle_stoch2,1,0,limit,BufferSig2))
      return 0;

//--- return value of prev_calculated for the next call
   return(rates_total);
  }
//+------------------------------------------------------------------+
//| Timer function                                                   |
//+------------------------------------------------------------------+
void OnTimer()
  {
//--- Call the indicator collection timer
   indicators.OnTimer();
  }
//+------------------------------------------------------------------+
//| ChartEvent function                                              |
//+------------------------------------------------------------------+
void OnChartEvent(const int id,
                  const long &lparam,
                  const double &dparam,
                  const string &sparam)
  {
//--- Handling the panel
//--- Call the panel event handler
   panel.OnChartEvent(id,lparam,dparam,sparam);

//--- If the cursor moves or a click is made on the chart
   if(id==CHARTEVENT_MOUSE_MOVE || id==CHARTEVENT_CLICK)
     {
      //--- Declare the variables to record time and price coordinates in them
      datetime time=0;
      double price=0;
      int wnd=0;
      //--- If the cursor coordinates are converted to date and time
      if(ChartXYToTimePrice(ChartID(),(int)lparam,(int)dparam,wnd,time,price))
        {
         //--- write the bar index where the cursor is located to a global variable
         mouse_bar_index=iBarShift(Symbol(),PERIOD_CURRENT,time);
         //--- Display the bar data under the cursor on the panel
         DrawData(mouse_bar_index,time);
        }
     }

//--- If we received a custom event, display the appropriate message in the journal
   if(id>CHARTEVENT_CUSTOM)
     {
      //--- Here we can implement handling a click on the close button on the panel
      PrintFormat("%s: Event id=%ld, object id (lparam): %lu, event message (sparam): %s",__FUNCTION__,id,lparam,sparam);
     }
  }
//+------------------------------------------------------------------+
//| Display data from the specified timeseries index to the panel    |
//+------------------------------------------------------------------+
void DrawData(const int index,const datetime time)
  {
//--- Declare the variables to receive data in them
   MqlRates rates[1];

//--- Exit if unable to get the bar data by the specified index
   if(CopyRates(Symbol(),PERIOD_CURRENT,index,1,rates)!=1)
      return;

//--- Set font parameters for bar and indicator data headers
   int  size=0;
   uint flags=0;
   uint angle=0;
   string name=panel.FontParams(size,flags,angle);
   panel.SetFontParams(name,9,FW_BOLD);
   panel.DrawText("Bar data ["+(string)index+"]",3,panel.TableY1(0)-16,clrMaroon,panel.Width()-6);
   panel.DrawText("Indicators data ["+(string)index+"]",3,panel.TableY1(1)-16,clrGreen,panel.Width()-6);
//--- Set font parameters for bar and indicator data
   panel.SetFontParams(name,9);

//--- Display the data of the specified bar in table 0 on the panel
   panel.DrawText("Date",  panel.CellX(0,0,0)+2, panel.CellY(0,0,0)+2); panel.DrawText(TimeToString(  rates[0].time,TIME_DATE),     panel.CellX(0,0,1)+2, panel.CellY(0,0,1)+2,clrNONE,90);
   panel.DrawText("Time",  panel.CellX(0,1,0)+2, panel.CellY(0,1,0)+2); panel.DrawText(TimeToString(  rates[0].time,TIME_MINUTES),  panel.CellX(0,1,1)+2, panel.CellY(0,1,1)+2,clrNONE,90);
   panel.DrawText("Open",  panel.CellX(0,2,0)+2, panel.CellY(0,2,0)+2); panel.DrawText(DoubleToString(rates[0].open,Digits()),      panel.CellX(0,2,1)+2, panel.CellY(0,2,1)+2,clrNONE,90);
   panel.DrawText("High",  panel.CellX(0,3,0)+2, panel.CellY(0,3,0)+2); panel.DrawText(DoubleToString(rates[0].high,Digits()),      panel.CellX(0,3,1)+2, panel.CellY(0,3,1)+2,clrNONE,90);
   panel.DrawText("Low",   panel.CellX(0,4,0)+2, panel.CellY(0,4,0)+2); panel.DrawText(DoubleToString(rates[0].low,Digits()),       panel.CellX(0,4,1)+2, panel.CellY(0,4,1)+2,clrNONE,90);
   panel.DrawText("Close", panel.CellX(0,5,0)+2, panel.CellY(0,5,0)+2); panel.DrawText(DoubleToString(rates[0].close,Digits()),     panel.CellX(0,5,1)+2, panel.CellY(0,5,1)+2,clrNONE,90);

//--- Output the data of indicator 1 from the specified bar into table 1
   panel.DrawText(indicators.Title(handle_stoch1), panel.CellX(1,0,0)+2, panel.CellY(1,0,0)+2);
   double value1=indicators.GetData(handle_stoch1,0,0,index);
   string value_str1=(value1!=EMPTY_VALUE ? DoubleToString(value1,indicators.Digits(handle_stoch1)) : " ");
   panel.DrawText(value_str1,panel.CellX(1,0,1)+2,panel.CellY(1,0,1)+2,clrNONE,190);

//--- Display a description of the indicator 1 line state
   panel.DrawText("Line state", panel.CellX(1,1,0)+2, panel.CellY(1,1,0)+2);
   ENUM_LINE_STATE state1=indicators.BufferLineState(Symbol(),PERIOD_CURRENT,handle_stoch1,0,0,index);
   panel.DrawText(BufferLineStateDescription(state1),panel.CellX(1,1,1)+2,panel.CellY(1,1,1)+2,clrNONE,190);

//--- Output the data of indicator 2 from the specified bar into table 2
   panel.DrawText(indicators.Title(handle_stoch2), panel.CellX(2,0,0)+2, panel.CellY(2,0,0)+2);
   double value2=indicators.GetDataTo(Symbol(),PERIOD_CURRENT,handle_stoch2,0,0,index);
   string value_str2=(value2!=EMPTY_VALUE ? DoubleToString(value2,indicators.Digits(handle_stoch2)) : " ");
   panel.DrawText(value_str2,panel.CellX(2,0,1)+2,panel.CellY(2,0,1)+2,clrNONE,190);

//--- Display a description of the indicator 2 line state
   panel.DrawText("Line state", panel.CellX(2,1,0)+2, panel.CellY(2,1,0)+2);
   ENUM_LINE_STATE state2=indicators.BufferLineState(Symbol(),PERIOD_CURRENT,handle_stoch2,0,0,index);
   panel.DrawText(BufferLineStateDescription(state2),panel.CellX(2,1,1)+2,panel.CellY(2,1,1)+2,clrNONE,190);

//--- Display description of relationship between indicator 1 line relative to indicator 2 line
   double value21=indicators.GetDataTo(Symbol(),PERIOD_CURRENT,handle_stoch2,0,0,index+1);
   ENUM_LINE_STATE stateR=indicators.BufferLineStateRelative(Symbol(),PERIOD_CURRENT,handle_stoch1,0,0,index,value2,value21);
   string ma1=indicators.Name(handle_stoch1);
   string ma2=indicators.Name(handle_stoch2);
   string state_relative=
     (
      stateR==LINE_STATE_ABOVE      ? StringFormat("%s1 > %s2",ma1,ma2)   :
      stateR==LINE_STATE_BELOW      ? StringFormat("%s1 < %s2",ma1,ma2)           :
      stateR==LINE_STATE_CROSS_DOWN ? "Top-down crossing"   :
      stateR==LINE_STATE_CROSS_UP   ? "Bottom-up crossing"  :
      BufferLineStateDescription(stateR)
     );
   panel.DrawText(StringFormat("%s1 vs %s2",ma1,ma2), panel.CellX(2,2,0)+2, panel.CellY(2,2,0)+2);
   panel.DrawText(state_relative, panel.CellX(2,2,1)+2, panel.CellY(2,2,1)+2,clrNONE,190);

//--- Redraw the chart to immediately display all changes on the panel
   ChartRedraw(ChartID());
  }
//+------------------------------------------------------------------+
Nach dem Kompilieren und Starten des Indikators auf dem M1-Chart, wobei M5 für die Berechnungen ausgewählt wurde, sehen wir:
Der Indikator Triple Exponential Average:
//+------------------------------------------------------------------+
//|                             TestMSTFTripleExponentialAverage.mq5 |
//|                                  Copyright 2023, MetaQuotes Ltd. |
//|                                             https://www.mql5.com |
//+------------------------------------------------------------------+
#property copyright "Copyright 2023, MetaQuotes Ltd."
#property link      "https://www.mql5.com"
#property version   "1.00"
#property indicator_separate_window
#property indicator_buffers 2
#property indicator_plots   2
//--- enums

//--- plot TRIX1
#property indicator_label1  "TRIX1"
#property indicator_type1   DRAW_LINE
#property indicator_color1  clrRed
#property indicator_style1  STYLE_SOLID
#property indicator_width1  1

//--- plot TRIX2
#property indicator_label2  "TRIX2"
#property indicator_type2   DRAW_LINE
#property indicator_color2  clrDodgerBlue
#property indicator_style2  STYLE_SOLID
#property indicator_width2  1

//--- includes
#include <IndMSTF\IndMSTF.mqh>
#include <Dashboard\Dashboard.mqh>
//--- input parameters
input string               InpSymbol      =  NULL;             /* Symbol                     */ // Symbol
input ENUM_TIMEFRAMES      InpTimeframe   =  PERIOD_CURRENT;   /* Timeframe                  */ // Timeframe
input int                  InpPeriod      =  13;               /* Period                     */ // Calculation period
input ENUM_APPLIED_PRICE   InpPrice       =  PRICE_CLOSE;      /* Applied Price              */
input uchar                InpLineWidth1  =  2;                /* Senior period Line Width   */ // Line width for higher period
input uchar                InpLineWidth2  =  1;                /* Junior period Line Width   */ // Line width for lower period
input bool                 InpAsSeries    =  true;             /* As Series flag             */ // Timeseries flag of indicator buffer arrays

//--- indicator buffers
double         BufferTRIX1[];
double         BufferTRIX2[];
//--- global variables
int handle_trix1;
int handle_trix2;
CMSTFIndicators indicators;      // An instance of the indicator collection object
//--- variables for the panel
CDashboard *panel=NULL;          // Pointer to the panel object
int         mouse_bar_index;     // Index of the bar the data is taken from
//+------------------------------------------------------------------+
//| Custom indicator initialization function                         |
//+------------------------------------------------------------------+
int OnInit()
  {
//--- Set a timer with an interval of 1 second
   EventSetTimer(1);
//--- Assign the BufferMA1 and BufferMA2 arrays to the plot buffers 0 and 1, respectively
   SetIndexBuffer(0,BufferTRIX1,INDICATOR_DATA);
   SetIndexBuffer(1,BufferTRIX2,INDICATOR_DATA);
//--- Set the line width
   int w1=0,w2=0;
   if(InpTimeframe>Period())
     {
      w1=InpLineWidth2;
      w2=InpLineWidth1;
     }
   else
     {
      w1=InpLineWidth1;
      w2=InpLineWidth2;
     }
   PlotIndexSetInteger(0,PLOT_LINE_WIDTH,w1);
   PlotIndexSetInteger(1,PLOT_LINE_WIDTH,w2);
//--- sets indicator shift

//--- Set the timeseries flags for the indicator buffer arrays (for testing, to see that there is no difference)
   ArraySetAsSeries(BufferTRIX1,InpAsSeries);
   ArraySetAsSeries(BufferTRIX2,InpAsSeries);

//--- Create two indicators of the same type
//--- The first one is calculated on the current chart symbol/period, the second - on those specified in the settings
   handle_trix1=indicators.AddNewTriX(NULL,PERIOD_CURRENT,InpPeriod,InpPrice);
   handle_trix2=indicators.AddNewTriX(InpSymbol,InpTimeframe,InpPeriod,InpPrice);

//--- If failed to create indicator handles, return initialization error
   if(handle_trix1==INVALID_HANDLE || handle_trix2==INVALID_HANDLE)
      return INIT_FAILED;
//--- Set descriptions for indicator lines from buffer descriptions of calculation part of created indicators
   indicators.SetPlotLabelFromBuffer(0,handle_trix1,0);
   indicators.SetPlotLabelFromBuffer(1,handle_trix2,0);

//--- Dashboard
//--- Create the panel
   int width=247;
   panel=new CDashboard(1,20,20,width,264,0);
   if(panel==NULL)
     {
      Print("Error. Failed to create panel object");
      return INIT_FAILED;
     }
//--- Set font parameters
   panel.SetFontParams("Calibri",9);
//--- Display the panel with the "Symbol, Timeframe description" header text
   panel.View(Symbol()+", "+StringSubstr(EnumToString(Period()),7));

//--- Create a table with ID 0 to display bar data in it
   panel.CreateNewTable(0);
//--- Draw a table with ID 0 on the panel background
   panel.DrawGrid(0,2,20,6,2,18,width/2-2);

//--- Create a table with ID 1 to display the data of indicator 1
   panel.CreateNewTable(1);
//--- Get the Y2 table coordinate with ID 0 and
//--- set the Y1 coordinate for the table with ID 1
   int y1=panel.TableY2(0)+22;
//--- Draw a table with ID 1 on the panel background
   panel.DrawGrid(1,2,y1,2,2,18,width/2-2);

//--- Create a table with ID 2 to display the data of indicator 2
   panel.CreateNewTable(2);
//--- Get the Y2 coordinate of the table with ID 1 and
//--- set the Y1 coordinate for the table with ID 2
   int y2=panel.TableY2(1)+3;
//--- Draw a table with ID 2 on the background of the dashboard
   panel.DrawGrid(2,2,y2,3,2,18,width/2-2);

//--- Initialize the variable with the index of the mouse cursor bar
   mouse_bar_index=0;
//--- Display the data of the current bar on the panel
   DrawData(mouse_bar_index,TimeCurrent());

//--- Successful initialization
   return(INIT_SUCCEEDED);
  }
//+------------------------------------------------------------------+
//| Custom indicator deinitialization function                       |
//+------------------------------------------------------------------+
void OnDeinit(const int reason)
  {
//--- Delete the timer
   EventKillTimer();
//--- If the panel object exists, delete it
   if(panel!=NULL)
      delete panel;
//--- Delete all comments
   Comment("");
  }
//+------------------------------------------------------------------+
//| Custom indicator iteration function                              |
//+------------------------------------------------------------------+
int OnCalculate(const int rates_total,
                const int prev_calculated,
                const datetime &time[],
                const double &open[],
                const double &high[],
                const double &low[],
                const double &close[],
                const long &tick_volume[],
                const long &volume[],
                const int &spread[])
  {
//--- Number of bars for calculation
   int limit=rates_total-prev_calculated;
//--- If limit > 1, then this is the first calculation or change in the history
   if(limit>1)
     {
      //--- specify all the available history for calculation
      limit=rates_total-1;
      /*
      // If the indicator has any buffers that display other calculations (not multi-indicators),
      // initialize them here with the "empty" value set for these buffers
      */
     }
//--- Calculate all created multi-symbol multi-period indicators
   if(!indicators.Calculate())
      return 0;

//--- Display the bar data under cursor (or current bar if cursor is outside the chart) on the dashboard
   DrawData(mouse_bar_index,time[mouse_bar_index]);

//--- From buffers of calculated indicators, output data to indicator buffers
   if(!indicators.DataToBuffer(NULL,PERIOD_CURRENT,handle_trix1,0,0,limit,BufferTRIX1))
      return 0;
   if(!indicators.DataToBuffer(NULL,PERIOD_CURRENT,handle_trix2,0,0,limit,BufferTRIX2))
      return 0;

//--- return value of prev_calculated for the next call
   return(rates_total);
  }
//+------------------------------------------------------------------+
//| Timer function                                                   |
//+------------------------------------------------------------------+
void OnTimer()
  {
//--- Call the indicator collection timer
   indicators.OnTimer();
  }
//+------------------------------------------------------------------+
//| ChartEvent function                                              |
//+------------------------------------------------------------------+
void OnChartEvent(const int id,
                  const long &lparam,
                  const double &dparam,
                  const string &sparam)
  {
//--- Handling the panel
//--- Call the panel event handler
   panel.OnChartEvent(id,lparam,dparam,sparam);

//--- If the cursor moves or a click is made on the chart
   if(id==CHARTEVENT_MOUSE_MOVE || id==CHARTEVENT_CLICK)
     {
      //--- Declare the variables to record time and price coordinates in them
      datetime time=0;
      double price=0;
      int wnd=0;
      //--- If the cursor coordinates are converted to date and time
      if(ChartXYToTimePrice(ChartID(),(int)lparam,(int)dparam,wnd,time,price))
        {
         //--- write the bar index where the cursor is located to a global variable
         mouse_bar_index=iBarShift(Symbol(),PERIOD_CURRENT,time);
         //--- Display the bar data under the cursor on the panel
         DrawData(mouse_bar_index,time);
        }
     }

//--- If we received a custom event, display the appropriate message in the journal
   if(id>CHARTEVENT_CUSTOM)
     {
      //--- Here we can implement handling a click on the close button on the panel
      PrintFormat("%s: Event id=%ld, object id (lparam): %lu, event message (sparam): %s",__FUNCTION__,id,lparam,sparam);
     }
  }
//+------------------------------------------------------------------+
//| Display data from the specified timeseries index to the panel    |
//+------------------------------------------------------------------+
void DrawData(const int index,const datetime time)
  {
//--- Declare the variables to receive data in them
   MqlRates rates[1];

//--- Exit if unable to get the bar data by the specified index
   if(CopyRates(Symbol(),PERIOD_CURRENT,index,1,rates)!=1)
      return;

//--- Set font parameters for bar and indicator data headers
   int  size=0;
   uint flags=0;
   uint angle=0;
   string name=panel.FontParams(size,flags,angle);
   panel.SetFontParams(name,9,FW_BOLD);
   panel.DrawText("Bar data ["+(string)index+"]",3,panel.TableY1(0)-16,clrMaroon,panel.Width()-6);
   panel.DrawText("Indicators data ["+(string)index+"]",3,panel.TableY1(1)-16,clrGreen,panel.Width()-6);
//--- Set font parameters for bar and indicator data
   panel.SetFontParams(name,9);

//--- Display the data of the specified bar in table 0 on the panel
   panel.DrawText("Date",  panel.CellX(0,0,0)+2, panel.CellY(0,0,0)+2); panel.DrawText(TimeToString(  rates[0].time,TIME_DATE),     panel.CellX(0,0,1)+2, panel.CellY(0,0,1)+2,clrNONE,90);
   panel.DrawText("Time",  panel.CellX(0,1,0)+2, panel.CellY(0,1,0)+2); panel.DrawText(TimeToString(  rates[0].time,TIME_MINUTES),  panel.CellX(0,1,1)+2, panel.CellY(0,1,1)+2,clrNONE,90);
   panel.DrawText("Open",  panel.CellX(0,2,0)+2, panel.CellY(0,2,0)+2); panel.DrawText(DoubleToString(rates[0].open,Digits()),      panel.CellX(0,2,1)+2, panel.CellY(0,2,1)+2,clrNONE,90);
   panel.DrawText("High",  panel.CellX(0,3,0)+2, panel.CellY(0,3,0)+2); panel.DrawText(DoubleToString(rates[0].high,Digits()),      panel.CellX(0,3,1)+2, panel.CellY(0,3,1)+2,clrNONE,90);
   panel.DrawText("Low",   panel.CellX(0,4,0)+2, panel.CellY(0,4,0)+2); panel.DrawText(DoubleToString(rates[0].low,Digits()),       panel.CellX(0,4,1)+2, panel.CellY(0,4,1)+2,clrNONE,90);
   panel.DrawText("Close", panel.CellX(0,5,0)+2, panel.CellY(0,5,0)+2); panel.DrawText(DoubleToString(rates[0].close,Digits()),     panel.CellX(0,5,1)+2, panel.CellY(0,5,1)+2,clrNONE,90);

//--- Output the data of indicator 1 from the specified bar into table 1
   panel.DrawText(indicators.Title(handle_trix1), panel.CellX(1,0,0)+2, panel.CellY(1,0,0)+2);
   double value1=indicators.GetData(handle_trix1,0,0,index);
   string value_str1=(value1!=EMPTY_VALUE ? DoubleToString(value1,indicators.Digits(handle_trix1)) : " ");
   panel.DrawText(value_str1,panel.CellX(1,0,1)+2,panel.CellY(1,0,1)+2,clrNONE,110);

//--- Display a description of the indicator 1 line state
   panel.DrawText("Line state", panel.CellX(1,1,0)+2, panel.CellY(1,1,0)+2);
   ENUM_LINE_STATE state1=indicators.BufferLineState(Symbol(),PERIOD_CURRENT,handle_trix1,0,0,index);
   panel.DrawText(BufferLineStateDescription(state1),panel.CellX(1,1,1)+2,panel.CellY(1,1,1)+2,clrNONE,110);

//--- Output the data of indicator 2 from the specified bar into table 2
   panel.DrawText(indicators.Title(handle_trix2), panel.CellX(2,0,0)+2, panel.CellY(2,0,0)+2);
   double value2=indicators.GetDataTo(Symbol(),PERIOD_CURRENT,handle_trix2,0,0,index);
   string value_str2=(value2!=EMPTY_VALUE ? DoubleToString(value2,indicators.Digits(handle_trix2)) : " ");
   panel.DrawText(value_str2,panel.CellX(2,0,1)+2,panel.CellY(2,0,1)+2,clrNONE,110);

//--- Display a description of the indicator 2 line state
   panel.DrawText("Line state", panel.CellX(2,1,0)+2, panel.CellY(2,1,0)+2);
   ENUM_LINE_STATE state2=indicators.BufferLineState(Symbol(),PERIOD_CURRENT,handle_trix2,0,0,index);
   panel.DrawText(BufferLineStateDescription(state2),panel.CellX(2,1,1)+2,panel.CellY(2,1,1)+2,clrNONE,110);

//--- Display description of relationship between indicator 1 line relative to indicator 2 line
   double value21=indicators.GetDataTo(Symbol(),PERIOD_CURRENT,handle_trix2,0,0,index+1);
   ENUM_LINE_STATE stateR=indicators.BufferLineStateRelative(Symbol(),PERIOD_CURRENT,handle_trix1,0,0,index,value2,value21);
   string ma1=indicators.Name(handle_trix1);
   string ma2=indicators.Name(handle_trix2);
   string state_relative=
     (
      stateR==LINE_STATE_ABOVE      ? StringFormat("%s1 > %s2",ma1,ma2)   :
      stateR==LINE_STATE_BELOW      ? StringFormat("%s1 < %s2",ma1,ma2)           :
      stateR==LINE_STATE_CROSS_DOWN ? "Top-down crossing"   :
      stateR==LINE_STATE_CROSS_UP   ? "Bottom-up crossing"  :
      BufferLineStateDescription(stateR)
     );
   panel.DrawText(StringFormat("%s1 vs %s2",ma1,ma2), panel.CellX(2,2,0)+2, panel.CellY(2,2,0)+2);
   panel.DrawText(state_relative, panel.CellX(2,2,1)+2, panel.CellY(2,2,1)+2,clrNONE,110);

//--- Redraw the chart to immediately display all changes on the panel
   ChartRedraw(ChartID());
  }
//+------------------------------------------------------------------+
Nach dem Kompilieren und Starten des Indikators auf dem M1-Chart, wobei M5 für die Berechnungen ausgewählt wurde, sehen wir:
Der Indikator der Volumina:
//+------------------------------------------------------------------+
//|                                              TestMSTFVolumes.mq5 |
//|                                  Copyright 2023, MetaQuotes Ltd. |
//|                                             https://www.mql5.com |
//+------------------------------------------------------------------+
#property copyright "Copyright 2023, MetaQuotes Ltd."
#property link      "https://www.mql5.com"
#property version   "1.00"
#property indicator_separate_window
#property indicator_buffers 4
#property indicator_plots   2
//--- enums

//--- plot AC1
#property indicator_label1  "Volumes1"
#property indicator_type1   DRAW_COLOR_HISTOGRAM
//#property indicator_color1  clrGreen,clrRed // analog in line 98
#property indicator_style1  STYLE_SOLID
#property indicator_width1  1

//--- plot AC2
#property indicator_label2  "Volumes2"
#property indicator_type2   DRAW_COLOR_HISTOGRAM
//#property indicator_color2  clrGreen,clrRed // analog in line 99
#property indicator_style2  STYLE_SOLID
#property indicator_width2  1

//--- includes
#include <IndMSTF\IndMSTF.mqh>
#include <Dashboard\Dashboard.mqh>
//--- input parameters
input string               InpSymbol      =  NULL;             /* Symbol                     */ // Symbol
input ENUM_TIMEFRAMES      InpTimeframe   =  PERIOD_CURRENT;   /* Timeframe                  */ // Timeframe
input ENUM_APPLIED_VOLUME  InpVolume      =  VOLUME_TICK;      /* Applied Volume             */ // Used volume
input uchar                InpLineWidth1  =  2;                /* Senior period Line Width   */ // Line width for higher period
input uchar                InpLineWidth2  =  1;                /* Junior period Line Width   */ // Line width for lower period
input bool                 InpAsSeries    =  true;             /* As Series flag             */ // Timeseries flag of indicator buffer arrays

//--- indicator buffers
double         BufferVolumes1[];
double         BufferClrVolumes1[];
double         BufferVolumes2[];
double         BufferClrVolumes2[];
//--- global variables
int handle_volumes1;
int handle_volumes2;
CMSTFIndicators indicators;      // An instance of the indicator collection object
//--- variables for the panel
CDashboard *panel=NULL;          // Pointer to the panel object
int         mouse_bar_index;     // Index of the bar the data is taken from
//+------------------------------------------------------------------+
//| Custom indicator initialization function                         |
//+------------------------------------------------------------------+
int OnInit()
  {
//--- Set a timer with an interval of 1 second
   EventSetTimer(1);
//--- Assign arrays BufferVolumes1 and BufferVolumes2 to plot buffers 0 and 2, respectively,
//--- and color arrays BufferClrVolumes1 and BufferClrVolumes2 to buffers 1 and 3
   SetIndexBuffer(0,BufferVolumes1,INDICATOR_DATA);
   SetIndexBuffer(1,BufferClrVolumes1,INDICATOR_COLOR_INDEX);
   SetIndexBuffer(2,BufferVolumes2,INDICATOR_DATA);
   SetIndexBuffer(3,BufferClrVolumes2,INDICATOR_COLOR_INDEX);
//--- Set the line width
   int w1=0,w2=0;
   if(InpTimeframe>Period())
     {
      w1=InpLineWidth2;
      w2=InpLineWidth1;
     }
   else
     {
      w1=InpLineWidth1;
      w2=InpLineWidth2;
     }
   PlotIndexSetInteger(0,PLOT_LINE_WIDTH,w1);
   PlotIndexSetInteger(1,PLOT_LINE_WIDTH,w2);
//--- sets indicator shift

//--- Set the timeseries flags for the indicator buffer arrays (for testing, to see that there is no difference)
   ArraySetAsSeries(BufferVolumes1,InpAsSeries);
   ArraySetAsSeries(BufferClrVolumes1,InpAsSeries);
   ArraySetAsSeries(BufferVolumes2,InpAsSeries);
   ArraySetAsSeries(BufferClrVolumes2,InpAsSeries);

//--- Create two indicators of the same type
//--- The first one is calculated on the current chart symbol/period, the second - on those specified in the settings
   handle_volumes1=indicators.AddNewVolumes(NULL,PERIOD_CURRENT,InpVolume);
   handle_volumes2=indicators.AddNewVolumes(InpSymbol,InpTimeframe,InpVolume);

//--- If failed to create indicator handles, return initialization error
   if(handle_volumes1==INVALID_HANDLE || handle_volumes2==INVALID_HANDLE)
      return INIT_FAILED;
//--- Set indicator line descriptions from buffer descriptions of calculation part of created indicators
   indicators.SetPlotLabelFromBuffer(0,handle_volumes1,0);
   indicators.SetPlotLabelFromBuffer(1,handle_volumes2,0);
//--- Set colors for indicator lines from the buffer color set of calculation part of created indicators
   indicators.SetPlotColorsFromBuffer(0,handle_volumes1,0);
   indicators.SetPlotColorsFromBuffer(1,handle_volumes2,0);

//--- Dashboard
//--- Create the panel
   int width=267;
   panel=new CDashboard(1,20,20,width,264,0);
   if(panel==NULL)
     {
      Print("Error. Failed to create panel object");
      return INIT_FAILED;
     }
//--- Set font parameters
   panel.SetFontParams("Calibri",9);
//--- Display the panel with the "Symbol, Timeframe description" header text
   panel.View(Symbol()+", "+StringSubstr(EnumToString(Period()),7));

//--- Create a table with ID 0 to display bar data in it
   panel.CreateNewTable(0);
//--- Draw a table with ID 0 on the panel background
   panel.DrawGrid(0,2,20,6,2,18,width/2-2);

//--- Create a table with ID 1 to display the data of indicator 1
   panel.CreateNewTable(1);
//--- Get the Y2 table coordinate with ID 0 and
//--- set the Y1 coordinate for the table with ID 1
   int y1=panel.TableY2(0)+22;
//--- Draw a table with ID 1 on the panel background
   panel.DrawGrid(1,2,y1,2,2,18,width/2-2);

//--- Create a table with ID 2 to display the data of indicator 2
   panel.CreateNewTable(2);
//--- Get the Y2 coordinate of the table with ID 1 and
//--- set the Y1 coordinate for the table with ID 2
   int y2=panel.TableY2(1)+3;
//--- Draw a table with ID 2 on the background of the dashboard
   panel.DrawGrid(2,2,y2,3,2,18,width/2-2);

//--- Initialize the variable with the index of the mouse cursor bar
   mouse_bar_index=0;
//--- Display the data of the current bar on the panel
   DrawData(mouse_bar_index,TimeCurrent());

//--- Successful initialization
   return(INIT_SUCCEEDED);
  }
//+------------------------------------------------------------------+
//| Custom indicator deinitialization function                       |
//+------------------------------------------------------------------+
void OnDeinit(const int reason)
  {
//--- Delete the timer
   EventKillTimer();
//--- If the panel object exists, delete it
   if(panel!=NULL)
      delete panel;
//--- Delete all comments
   Comment("");
  }
//+------------------------------------------------------------------+
//| Custom indicator iteration function                              |
//+------------------------------------------------------------------+
int OnCalculate(const int rates_total,
                const int prev_calculated,
                const datetime &time[],
                const double &open[],
                const double &high[],
                const double &low[],
                const double &close[],
                const long &tick_volume[],
                const long &volume[],
                const int &spread[])
  {
//--- Number of bars for calculation
   int limit=rates_total-prev_calculated;
//--- If limit > 1, then this is the first calculation or change in the history
   if(limit>1)
     {
      //--- specify all the available history for calculation
      limit=rates_total-1;
      /*
      // If the indicator has any buffers that display other calculations (not multi-indicators),
      // initialize them here with the "empty" value set for these buffers
      */
     }
//--- Calculate all created multi-symbol multi-period indicators
   if(!indicators.Calculate())
      return 0;

//--- Display the bar data under cursor (or current bar if cursor is outside the chart) on the dashboard
   DrawData(mouse_bar_index,time[mouse_bar_index]);

//--- From buffers of calculated indicators, output data to indicator buffers
   if(!indicators.DataToColorBuffer(NULL,PERIOD_CURRENT,handle_volumes1,0,0,limit,BufferVolumes1,BufferClrVolumes1))
      return 0;
   if(!indicators.DataToColorBuffer(NULL,PERIOD_CURRENT,handle_volumes2,0,0,limit,BufferVolumes2,BufferClrVolumes2))
      return 0;

//--- return value of prev_calculated for the next call
   return(rates_total);
  }
//+------------------------------------------------------------------+
//| Timer function                                                   |
//+------------------------------------------------------------------+
void OnTimer()
  {
//--- Call the indicator collection timer
   indicators.OnTimer();
  }
//+------------------------------------------------------------------+
//| ChartEvent function                                              |
//+------------------------------------------------------------------+
void OnChartEvent(const int id,
                  const long &lparam,
                  const double &dparam,
                  const string &sparam)
  {
//--- Handling the panel
//--- Call the panel event handler
   panel.OnChartEvent(id,lparam,dparam,sparam);

//--- If the cursor moves or a click is made on the chart
   if(id==CHARTEVENT_MOUSE_MOVE || id==CHARTEVENT_CLICK)
     {
      //--- Declare the variables to record time and price coordinates in them
      datetime time=0;
      double price=0;
      int wnd=0;
      //--- If the cursor coordinates are converted to date and time
      if(ChartXYToTimePrice(ChartID(),(int)lparam,(int)dparam,wnd,time,price))
        {
         //--- write the bar index where the cursor is located to a global variable
         mouse_bar_index=iBarShift(Symbol(),PERIOD_CURRENT,time);
         //--- Display the bar data under the cursor on the panel
         DrawData(mouse_bar_index,time);
        }
     }

//--- If we received a custom event, display the appropriate message in the journal
   if(id>CHARTEVENT_CUSTOM)
     {
      //--- Here we can implement handling a click on the close button on the panel
      PrintFormat("%s: Event id=%ld, object id (lparam): %lu, event message (sparam): %s",__FUNCTION__,id,lparam,sparam);
     }
  }
//+------------------------------------------------------------------+
//| Display data from the specified timeseries index to the panel    |
//+------------------------------------------------------------------+
void DrawData(const int index,const datetime time)
  {
//--- Declare the variables to receive data in them
   MqlRates rates[1];

//--- Exit if unable to get the bar data by the specified index
   if(CopyRates(Symbol(),PERIOD_CURRENT,index,1,rates)!=1)
      return;

//--- Set font parameters for bar and indicator data headers
   int  size=0;
   uint flags=0;
   uint angle=0;
   string name=panel.FontParams(size,flags,angle);
   panel.SetFontParams(name,9,FW_BOLD);
   panel.DrawText("Bar data ["+(string)index+"]",3,panel.TableY1(0)-16,clrMaroon,panel.Width()-6);
   panel.DrawText("Indicators data ["+(string)index+"]",3,panel.TableY1(1)-16,clrGreen,panel.Width()-6);
//--- Set font parameters for bar and indicator data
   panel.SetFontParams(name,9);

//--- Display the data of the specified bar in table 0 on the panel
   panel.DrawText("Date",  panel.CellX(0,0,0)+2, panel.CellY(0,0,0)+2); panel.DrawText(TimeToString(  rates[0].time,TIME_DATE),     panel.CellX(0,0,1)+2, panel.CellY(0,0,1)+2,clrNONE,90);
   panel.DrawText("Time",  panel.CellX(0,1,0)+2, panel.CellY(0,1,0)+2); panel.DrawText(TimeToString(  rates[0].time,TIME_MINUTES),  panel.CellX(0,1,1)+2, panel.CellY(0,1,1)+2,clrNONE,90);
   panel.DrawText("Open",  panel.CellX(0,2,0)+2, panel.CellY(0,2,0)+2); panel.DrawText(DoubleToString(rates[0].open,Digits()),      panel.CellX(0,2,1)+2, panel.CellY(0,2,1)+2,clrNONE,90);
   panel.DrawText("High",  panel.CellX(0,3,0)+2, panel.CellY(0,3,0)+2); panel.DrawText(DoubleToString(rates[0].high,Digits()),      panel.CellX(0,3,1)+2, panel.CellY(0,3,1)+2,clrNONE,90);
   panel.DrawText("Low",   panel.CellX(0,4,0)+2, panel.CellY(0,4,0)+2); panel.DrawText(DoubleToString(rates[0].low,Digits()),       panel.CellX(0,4,1)+2, panel.CellY(0,4,1)+2,clrNONE,90);
   panel.DrawText("Close", panel.CellX(0,5,0)+2, panel.CellY(0,5,0)+2); panel.DrawText(DoubleToString(rates[0].close,Digits()),     panel.CellX(0,5,1)+2, panel.CellY(0,5,1)+2,clrNONE,90);

//--- Output the data of indicator 1 from the specified bar into table 1
   panel.DrawText(indicators.Title(handle_volumes1), panel.CellX(1,0,0)+2, panel.CellY(1,0,0)+2);
   double value1=indicators.GetData(handle_volumes1,0,0,index);
   string value_str1=(value1!=EMPTY_VALUE ? DoubleToString(value1,indicators.Digits(handle_volumes1)) : " ");
   panel.DrawText(value_str1,panel.CellX(1,0,1)+2,panel.CellY(1,0,1)+2,clrNONE,120);

//--- Display a description of the indicator 1 line state
   panel.DrawText("Line state", panel.CellX(1,1,0)+2, panel.CellY(1,1,0)+2);
   ENUM_LINE_STATE state1=indicators.BufferLineState(Symbol(),PERIOD_CURRENT,handle_volumes1,0,0,index);
   panel.DrawText(BufferLineStateDescription(state1),panel.CellX(1,1,1)+2,panel.CellY(1,1,1)+2,clrNONE,120);

//--- Output the data of indicator 2 from the specified bar into table 2
   panel.DrawText(indicators.Title(handle_volumes2), panel.CellX(2,0,0)+2, panel.CellY(2,0,0)+2);
   double value2=indicators.GetDataTo(Symbol(),PERIOD_CURRENT,handle_volumes2,0,0,index);
   string value_str2=(value2!=EMPTY_VALUE ? DoubleToString(value2,indicators.Digits(handle_volumes2)) : " ");
   panel.DrawText(value_str2,panel.CellX(2,0,1)+2,panel.CellY(2,0,1)+2,clrNONE,120);

//--- Display a description of the indicator 2 line state
   panel.DrawText("Line state", panel.CellX(2,1,0)+2, panel.CellY(2,1,0)+2);
   ENUM_LINE_STATE state2=indicators.BufferLineState(Symbol(),PERIOD_CURRENT,handle_volumes2,0,0,index);
   panel.DrawText(BufferLineStateDescription(state2),panel.CellX(2,1,1)+2,panel.CellY(2,1,1)+2,clrNONE,120);

//--- Display description of relationship between indicator 1 line relative to indicator 2 line
   double value21=indicators.GetDataTo(Symbol(),PERIOD_CURRENT,handle_volumes2,0,0,index+1);
   ENUM_LINE_STATE stateR=indicators.BufferLineStateRelative(Symbol(),PERIOD_CURRENT,handle_volumes1,0,0,index,value2,value21);
   string ma1=indicators.Name(handle_volumes1);
   string ma2=indicators.Name(handle_volumes2);
   string state_relative=
     (
      stateR==LINE_STATE_ABOVE      ? StringFormat("%s1 > %s2",ma1,ma2)   :
      stateR==LINE_STATE_BELOW      ? StringFormat("%s1 < %s2",ma1,ma2)           :
      stateR==LINE_STATE_CROSS_DOWN ? "Top-down crossing"   :
      stateR==LINE_STATE_CROSS_UP   ? "Bottom-up crossing"  :
      BufferLineStateDescription(stateR)
     );
   panel.DrawText(StringFormat("%s1 vs %s2",ma1,ma2), panel.CellX(2,2,0)+2, panel.CellY(2,2,0)+2);
   panel.DrawText(state_relative, panel.CellX(2,2,1)+2, panel.CellY(2,2,1)+2,clrNONE,120);

//--- Redraw the chart to immediately display all changes on the panel
   ChartRedraw(ChartID());
  }
//+------------------------------------------------------------------+
Nach dem Kompilieren und Starten des Indikators auf dem M1-Chart, wobei M5 für die Berechnungen ausgewählt wurde, sehen wir:
Der Indikator Williams Percent Range:
//+------------------------------------------------------------------+
//|                                 TestMSTFWilliamsPercentRange.mq5 |
//|                                  Copyright 2023, MetaQuotes Ltd. |
//|                                             https://www.mql5.com |
//+------------------------------------------------------------------+
#property copyright "Copyright 2023, MetaQuotes Ltd."
#property link      "https://www.mql5.com"
#property version   "1.00"
#property indicator_separate_window
#property indicator_buffers 2
#property indicator_plots   2
//--- enums

//--- plot WPR1
#property indicator_label1  "WPR1"
#property indicator_type1   DRAW_LINE
#property indicator_color1  clrRed
#property indicator_style1  STYLE_SOLID
#property indicator_width1  1

//--- plot WPR2
#property indicator_label2  "WPR2"
#property indicator_type2   DRAW_LINE
#property indicator_color2  clrDodgerBlue
#property indicator_style2  STYLE_SOLID
#property indicator_width2  1

//--- includes
#include <IndMSTF\IndMSTF.mqh>
#include <Dashboard\Dashboard.mqh>
//--- input parameters
input string               InpSymbol      =  NULL;             /* Symbol                     */ // Symbol
input ENUM_TIMEFRAMES      InpTimeframe   =  PERIOD_CURRENT;   /* Timeframe                  */ // Timeframe
input int                  InpPeriod      =  14;               /* Period                     */ // Calculation period
input uchar                InpLineWidth1  =  2;                /* Senior period Line Width   */ // Line width for higher period
input uchar                InpLineWidth2  =  1;                /* Junior period Line Width   */ // Line width for lower period
input bool                 InpAsSeries    =  true;             /* As Series flag             */ // Timeseries flag of indicator buffer arrays

//--- indicator buffers
double         BufferWPR1[];
double         BufferWPR2[];
//--- global variables
int handle_wpr1;
int handle_wpr2;
CMSTFIndicators indicators;      // An instance of the indicator collection object
//--- variables for the panel
CDashboard *panel=NULL;          // Pointer to the panel object
int         mouse_bar_index;     // Index of the bar the data is taken from
//+------------------------------------------------------------------+
//| Custom indicator initialization function                         |
//+------------------------------------------------------------------+
int OnInit()
  {
//--- Set a timer with an interval of 1 second
   EventSetTimer(1);
//--- Assign the BufferMA1 and BufferMA2 arrays to the plot buffers 0 and 1, respectively
   SetIndexBuffer(0,BufferWPR1,INDICATOR_DATA);
   SetIndexBuffer(1,BufferWPR2,INDICATOR_DATA);
//--- Set the line width
   int w1=0,w2=0;
   if(InpTimeframe>Period())
     {
      w1=InpLineWidth2;
      w2=InpLineWidth1;
     }
   else
     {
      w1=InpLineWidth1;
      w2=InpLineWidth2;
     }
   PlotIndexSetInteger(0,PLOT_LINE_WIDTH,w1);
   PlotIndexSetInteger(1,PLOT_LINE_WIDTH,w2);
//--- sets indicator shift

//--- Set the timeseries flags for the indicator buffer arrays (for testing, to see that there is no difference)
   ArraySetAsSeries(BufferWPR1,InpAsSeries);
   ArraySetAsSeries(BufferWPR2,InpAsSeries);

//--- Create two indicators of the same type
//--- The first one is calculated on the current chart symbol/period, the second - on those specified in the settings
   handle_wpr1=indicators.AddNewWPR(NULL,PERIOD_CURRENT,InpPeriod);
   handle_wpr2=indicators.AddNewWPR(InpSymbol,InpTimeframe,InpPeriod);

//--- If failed to create indicator handles, return initialization error
   if(handle_wpr1==INVALID_HANDLE || handle_wpr2==INVALID_HANDLE)
      return INIT_FAILED;
//--- Set descriptions for indicator lines from buffer descriptions of calculation part of created indicators
   indicators.SetPlotLabelFromBuffer(0,handle_wpr1,0);
   indicators.SetPlotLabelFromBuffer(1,handle_wpr2,0);

//--- Dashboard
//--- Create the panel
   int width=231;
   panel=new CDashboard(1,20,20,width,264,0);
   if(panel==NULL)
     {
      Print("Error. Failed to create panel object");
      return INIT_FAILED;
     }
//--- Set font parameters
   panel.SetFontParams("Calibri",9);
//--- Display the panel with the "Symbol, Timeframe description" header text
   panel.View(Symbol()+", "+StringSubstr(EnumToString(Period()),7));

//--- Create a table with ID 0 to display bar data in it
   panel.CreateNewTable(0);
//--- Draw a table with ID 0 on the panel background
   panel.DrawGrid(0,2,20,6,2,18,width/2-2);

//--- Create a table with ID 1 to display the data of indicator 1
   panel.CreateNewTable(1);
//--- Get the Y2 table coordinate with ID 0 and
//--- set the Y1 coordinate for the table with ID 1
   int y1=panel.TableY2(0)+22;
//--- Draw a table with ID 1 on the panel background
   panel.DrawGrid(1,2,y1,2,2,18,width/2-2);

//--- Create a table with ID 2 to display the data of indicator 2
   panel.CreateNewTable(2);
//--- Get the Y2 coordinate of the table with ID 1 and
//--- set the Y1 coordinate for the table with ID 2
   int y2=panel.TableY2(1)+3;
//--- Draw a table with ID 2 on the background of the dashboard
   panel.DrawGrid(2,2,y2,3,2,18,width/2-2);

//--- Initialize the variable with the index of the mouse cursor bar
   mouse_bar_index=0;
//--- Display the data of the current bar on the panel
   DrawData(mouse_bar_index,TimeCurrent());

//--- Successful initialization
   return(INIT_SUCCEEDED);
  }
//+------------------------------------------------------------------+
//| Custom indicator deinitialization function                       |
//+------------------------------------------------------------------+
void OnDeinit(const int reason)
  {
//--- Delete the timer
   EventKillTimer();
//--- If the panel object exists, delete it
   if(panel!=NULL)
      delete panel;
//--- Delete all comments
   Comment("");
  }
//+------------------------------------------------------------------+
//| Custom indicator iteration function                              |
//+------------------------------------------------------------------+
int OnCalculate(const int rates_total,
                const int prev_calculated,
                const datetime &time[],
                const double &open[],
                const double &high[],
                const double &low[],
                const double &close[],
                const long &tick_volume[],
                const long &volume[],
                const int &spread[])
  {
//--- Number of bars for calculation
   int limit=rates_total-prev_calculated;
//--- If limit > 1, then this is the first calculation or change in the history
   if(limit>1)
     {
      //--- specify all the available history for calculation
      limit=rates_total-1;
      /*
      // If the indicator has any buffers that display other calculations (not multi-indicators),
      // initialize them here with the "empty" value set for these buffers
      */
     }
//--- Calculate all created multi-symbol multi-period indicators
   if(!indicators.Calculate())
      return 0;

//--- Display the bar data under cursor (or current bar if cursor is outside the chart) on the dashboard
   DrawData(mouse_bar_index,time[mouse_bar_index]);

//--- From buffers of calculated indicators, output data to indicator buffers
   if(!indicators.DataToBuffer(NULL,PERIOD_CURRENT,handle_wpr1,0,0,limit,BufferWPR1))
      return 0;
   if(!indicators.DataToBuffer(NULL,PERIOD_CURRENT,handle_wpr2,0,0,limit,BufferWPR2))
      return 0;

//--- return value of prev_calculated for the next call
   return(rates_total);
  }
//+------------------------------------------------------------------+
//| Timer function                                                   |
//+------------------------------------------------------------------+
void OnTimer()
  {
//--- Call the indicator collection timer
   indicators.OnTimer();
  }
//+------------------------------------------------------------------+
//| ChartEvent function                                              |
//+------------------------------------------------------------------+
void OnChartEvent(const int id,
                  const long &lparam,
                  const double &dparam,
                  const string &sparam)
  {
//--- Handling the panel
//--- Call the panel event handler
   panel.OnChartEvent(id,lparam,dparam,sparam);

//--- If the cursor moves or a click is made on the chart
   if(id==CHARTEVENT_MOUSE_MOVE || id==CHARTEVENT_CLICK)
     {
      //--- Declare the variables to record time and price coordinates in them
      datetime time=0;
      double price=0;
      int wnd=0;
      //--- If the cursor coordinates are converted to date and time
      if(ChartXYToTimePrice(ChartID(),(int)lparam,(int)dparam,wnd,time,price))
        {
         //--- write the bar index where the cursor is located to a global variable
         mouse_bar_index=iBarShift(Symbol(),PERIOD_CURRENT,time);
         //--- Display the bar data under the cursor on the panel
         DrawData(mouse_bar_index,time);
        }
     }

//--- If we received a custom event, display the appropriate message in the journal
   if(id>CHARTEVENT_CUSTOM)
     {
      //--- Here we can implement handling a click on the close button on the panel
      PrintFormat("%s: Event id=%ld, object id (lparam): %lu, event message (sparam): %s",__FUNCTION__,id,lparam,sparam);
     }
  }
//+------------------------------------------------------------------+
//| Display data from the specified timeseries index to the panel    |
//+------------------------------------------------------------------+
void DrawData(const int index,const datetime time)
  {
//--- Declare the variables to receive data in them
   MqlRates rates[1];

//--- Exit if unable to get the bar data by the specified index
   if(CopyRates(Symbol(),PERIOD_CURRENT,index,1,rates)!=1)
      return;

//--- Set font parameters for bar and indicator data headers
   int  size=0;
   uint flags=0;
   uint angle=0;
   string name=panel.FontParams(size,flags,angle);
   panel.SetFontParams(name,9,FW_BOLD);
   panel.DrawText("Bar data ["+(string)index+"]",3,panel.TableY1(0)-16,clrMaroon,panel.Width()-6);
   panel.DrawText("Indicators data ["+(string)index+"]",3,panel.TableY1(1)-16,clrGreen,panel.Width()-6);
//--- Set font parameters for bar and indicator data
   panel.SetFontParams(name,9);

//--- Display the data of the specified bar in table 0 on the panel
   panel.DrawText("Date",  panel.CellX(0,0,0)+2, panel.CellY(0,0,0)+2); panel.DrawText(TimeToString(  rates[0].time,TIME_DATE),     panel.CellX(0,0,1)+2, panel.CellY(0,0,1)+2,clrNONE,90);
   panel.DrawText("Time",  panel.CellX(0,1,0)+2, panel.CellY(0,1,0)+2); panel.DrawText(TimeToString(  rates[0].time,TIME_MINUTES),  panel.CellX(0,1,1)+2, panel.CellY(0,1,1)+2,clrNONE,90);
   panel.DrawText("Open",  panel.CellX(0,2,0)+2, panel.CellY(0,2,0)+2); panel.DrawText(DoubleToString(rates[0].open,Digits()),      panel.CellX(0,2,1)+2, panel.CellY(0,2,1)+2,clrNONE,90);
   panel.DrawText("High",  panel.CellX(0,3,0)+2, panel.CellY(0,3,0)+2); panel.DrawText(DoubleToString(rates[0].high,Digits()),      panel.CellX(0,3,1)+2, panel.CellY(0,3,1)+2,clrNONE,90);
   panel.DrawText("Low",   panel.CellX(0,4,0)+2, panel.CellY(0,4,0)+2); panel.DrawText(DoubleToString(rates[0].low,Digits()),       panel.CellX(0,4,1)+2, panel.CellY(0,4,1)+2,clrNONE,90);
   panel.DrawText("Close", panel.CellX(0,5,0)+2, panel.CellY(0,5,0)+2); panel.DrawText(DoubleToString(rates[0].close,Digits()),     panel.CellX(0,5,1)+2, panel.CellY(0,5,1)+2,clrNONE,90);

//--- Output the data of indicator 1 from the specified bar into table 1
   panel.DrawText(indicators.Title(handle_wpr1), panel.CellX(1,0,0)+2, panel.CellY(1,0,0)+2);
   double value1=indicators.GetData(handle_wpr1,0,0,index);
   string value_str1=(value1!=EMPTY_VALUE ? DoubleToString(value1,indicators.Digits(handle_wpr1)) : " ");
   panel.DrawText(value_str1,panel.CellX(1,0,1)+2,panel.CellY(1,0,1)+2,clrNONE,110);

//--- Display a description of the indicator 1 line state
   panel.DrawText("Line state", panel.CellX(1,1,0)+2, panel.CellY(1,1,0)+2);
   ENUM_LINE_STATE state1=indicators.BufferLineState(Symbol(),PERIOD_CURRENT,handle_wpr1,0,0,index);
   panel.DrawText(BufferLineStateDescription(state1),panel.CellX(1,1,1)+2,panel.CellY(1,1,1)+2,clrNONE,110);

//--- Output the data of indicator 2 from the specified bar into table 2
   panel.DrawText(indicators.Title(handle_wpr2), panel.CellX(2,0,0)+2, panel.CellY(2,0,0)+2);
   double value2=indicators.GetDataTo(Symbol(),PERIOD_CURRENT,handle_wpr2,0,0,index);
   string value_str2=(value2!=EMPTY_VALUE ? DoubleToString(value2,indicators.Digits(handle_wpr2)) : " ");
   panel.DrawText(value_str2,panel.CellX(2,0,1)+2,panel.CellY(2,0,1)+2,clrNONE,110);

//--- Display a description of the indicator 2 line state
   panel.DrawText("Line state", panel.CellX(2,1,0)+2, panel.CellY(2,1,0)+2);
   ENUM_LINE_STATE state2=indicators.BufferLineState(Symbol(),PERIOD_CURRENT,handle_wpr2,0,0,index);
   panel.DrawText(BufferLineStateDescription(state2),panel.CellX(2,1,1)+2,panel.CellY(2,1,1)+2,clrNONE,110);

//--- Display description of relationship between indicator 1 line relative to indicator 2 line
   double value21=indicators.GetDataTo(Symbol(),PERIOD_CURRENT,handle_wpr2,0,0,index+1);
   ENUM_LINE_STATE stateR=indicators.BufferLineStateRelative(Symbol(),PERIOD_CURRENT,handle_wpr1,0,0,index,value2,value21);
   string ma1=indicators.Name(handle_wpr1);
   string ma2=indicators.Name(handle_wpr2);
   string state_relative=
     (
      stateR==LINE_STATE_ABOVE      ? StringFormat("%s1 > %s2",ma1,ma2)   :
      stateR==LINE_STATE_BELOW      ? StringFormat("%s1 < %s2",ma1,ma2)           :
      stateR==LINE_STATE_CROSS_DOWN ? "Top-down crossing"   :
      stateR==LINE_STATE_CROSS_UP   ? "Bottom-up crossing"  :
      BufferLineStateDescription(stateR)
     );
   panel.DrawText(StringFormat("%s1 vs %s2",ma1,ma2), panel.CellX(2,2,0)+2, panel.CellY(2,2,0)+2);
   panel.DrawText(state_relative, panel.CellX(2,2,1)+2, panel.CellY(2,2,1)+2,clrNONE,110);

//--- Redraw the chart to immediately display all changes on the panel
   ChartRedraw(ChartID());
  }
//+------------------------------------------------------------------+
Nach dem Kompilieren und Starten des Indikators auf dem M1-Chart, wobei M5 für die Berechnungen ausgewählt wurde, sehen wir:
Schlussfolgerung
Es sind noch nicht alle Standardindikatoren erstellt worden, und dieses Konzept funktioniert nicht für alle Zeichenstile. Als Nächstes werden wir andere Zeichenstile und andere Indikatoren implementieren. Leider ist es nicht immer möglich, einen Indikator, der mit nicht aktuellen Symbol- und Zeitrahmendaten berechnet wird, sofort zu berechnen und zu zeichnen. Manchmal muss man den Zeitrahmen des Charts wechseln. In diesem Fall ist der Indikator selbst und sein Berechnungsteil bereits für die gesamte verfügbare Historie berechnet, aber CopyBuffer() gibt bei fehlenden Daten -1 zurück. Der Fehler wurde zuvor nicht beobachtet. Bisher konnte dieses Problem nicht gelöst werden: Das einzige, was hilft, ist das Umschalten des Zeitrahmens des Charts, damit CopyBuffer() die vorhandenen und bereits berechneten Indikatordaten kopieren kann.
Übersetzt aus dem Russischen von MetaQuotes Ltd.
Originalartikel: https://www.mql5.com/ru/articles/13824
Warnung: Alle Rechte sind von MetaQuotes Ltd. vorbehalten. Kopieren oder Vervielfältigen untersagt.
Dieser Artikel wurde von einem Nutzer der Website verfasst und gibt dessen persönliche Meinung wieder. MetaQuotes Ltd übernimmt keine Verantwortung für die Richtigkeit der dargestellten Informationen oder für Folgen, die sich aus der Anwendung der beschriebenen Lösungen, Strategien oder Empfehlungen ergeben.

- Freie Handelsapplikationen
- Über 8.000 Signale zum Kopieren
- Wirtschaftsnachrichten für die Lage an den Finanzmärkte
Sie stimmen der Website-Richtlinie und den Nutzungsbedingungen zu.
Warum, wofür sind diese sechs Dateien? Was ist da drin, wohin gehen sie, wofür sind sie da?
Es sollten nur zwei sein - der benutzerdefinierte Indikator, aus dem der Multi erstellt wird, und der Multi selbst.
Es sind zwei und es gibt zwei eine Test_Custom.mq528 kb ist ein benutzerdefinierter Indikator. Test_Indi_MSMT.mq521 kb ist der Indikator selbst. INDI_MSMT_!.mqh475 kb ist eine Bibliothek, Sie können darauf verzichten, es ist Ihre Quelle! Und die zweite Datei ist die gleiche, nur mit farbigen Puffern...
Warum, wofür sind diese sechs Dateien? Was ist da drin, wohin gehen sie, wofür sind sie da?
Es sollten nur zwei sein - der benutzerdefinierte Indikator, aus dem der Multi erstellt wird, und der Multi selbst.
Jetzt verstehe ich, warum die Themen hier entweder tot oder halbtot sind! Es gibt eine hysterische Reaktion auf Fragen, wie bei einem Kind in der Kinderspielzeugabteilung! Hilfe ist hier nicht zu erwarten! Imho würde ich schreiben, Das obige ist für persönliche Zwecke geschrieben! Ich beantworte keine Fragen! Und Sie müssten nicht so tun, als wären Sie ein Narr.... OKAY! Ich verstehe! Ich werde es selbst tun, ich bin in dieser Angelegenheit nicht eingeschränkt!
Vielleicht ist die Antwort in früheren Artikeln, zum Beispiel Vorbereitung von Multisymbol-Multiperioden-Indikatoren
Denn auf einmal mit Multisymbol-Multiperioden anzufangen, erscheint mir zu abrupt.
Man muss vom Einfachen zum Komplexen übergehen.
Jetzt verstehe ich, warum die Themen hier entweder tot oder halbtot sind! Hysterische Reaktionen auf Fragen, wie bei einem Kind in der Kinderspielzeugabteilung! Hier wird keine Hilfe erwartet!
Versuchen Sie, es anhand der Beispiele zu verstehen. Ich bin sicher, dass es möglich ist, da der Artikel eine detaillierte Beschreibung der Codes enthält.
Natürlich werde ich... Es ist kein schlechter Artikel! Es ist eine Schande, dass Menschen nicht auf die gleiche Weise behandelt werden! Es ist eine Schande, komm schon!