
Fertige Vorlagen für die Verwendung von Indikatoren in Expert Advisors (Teil 1): Oszillatoren

Inhalt
- Einführung
- Average True Range
- Bears Power
- Bulls Power
- Chaikin Oscillator
- Commodity Channel Index
- DeMarker
- Force Index
- MACD
- Momentum
- Gleitender Durchschnitt als Oszillator
- RSI (Relative Strength Index)
- Relative Vigor Index
- Stochastik Oszillator
- Dreifacher exponentieller Durchschnitt
- Williams' Percent Range
- Schlussfolgerung
Einführung
Die Verwendung von Indikatoren in eine EA und das Abrufen von Daten aus dem Indikatorpuffer in dem EA ist eine recht einfache Aufgabe, auch wenn sie ein ständiges Durchsuchen von Referenzmaterialien erfordert. Wir müssen uns alle Parameter merken, die an die Funktion zur Erstellung des Indikators übergeben werden, einige von ihnen als EA-Eingaben formalisieren, Gültigkeitsprüfungen einführen usw. Um Daten zu erhalten, müssen wir Funktionen schreiben, die die erforderlichen Daten aus der gewünschten Leiste zurückgeben. All dies erfordert Zeit für den Zugriff auf die Hilfe, die Eingabe der erforderlichen Variablen in den EA, das Schreiben von Funktionen für den Empfang und die Überwachung von Daten zur Bestimmung von Signalen usw.
Der Zweck dieses Artikels ist es, Vorlagen für das Einbinden von Indikatoren in den EAs zu erstellen. Schauen wir uns die Indikatoren der Kategorie Oszillatoren, ihre Eingangsvariablen, die Erstellung eines Indikator-Handles und die Beschaffung der erforderlichen Daten an. Für jeder Indikator werden wir folgende Merkmale angeben:
- Beispielhafte Eingaben,
- Initialisierung der Eingaben und Erstellung eines Handles,
- Deinitialisierung
- Abrufen der Daten der angegebenen Indikatorlinie gemäß dem angegebenen Zeitreihenindex,
- Überwachung der Werte der empfangenen Daten in Bezug zur Position der Linie im Verhältnis zu einem beliebigen Pegel.
Unter dem Position der Linie verstehen wir ihr Aussehen und ihre Form:
- Aufwärtsrichtung (Wert 2 ist kleiner oder gleich dem Wert 1, und Wert 1 ist kleiner als Wert 0),
- Abwärtsrichtung (Wert 2 ist größer oder gleich Wert 1, und Wert 1 ist größer als Wert 0),
- Umkehrung nach oben (Wert 2 ist größer als Wert 1, und Wert 1 ist kleiner als Wert 0),
- Umkehrung nach unten (Wert 2 ist kleiner als Wert 1, und Wert 1 ist größer als Wert 0),
- Aufwärtsstopp (Wert 2 ist kleiner oder gleich Wert 1, und Wert 1 ist gleich Wert 0),
- Abwärtsstopp (Wert 2 ist größer oder gleich Wert 1, und Wert 1 ist gleich Wert 0),
- Undefinierter Zustand (nicht beabsichtigte Zustände)
Unter dem Zustand der Linie in Bezug auf einen beliebigen Level verstehen wir:
- Über dem Wert (der Linienwert ist größer als der Wert des Levels)
- Unter dem Wert (der Linienwert ist kleiner als der Wert des Levels)
- Überschreiten des Wertes nach oben (Wert 1 ist kleiner oder gleich dem Levelwert auf Balken 1, und Wert 0 ist größer als der Levelwert auf Balken 0)
- Überschreiten des Wertes nach unten (Wert 1 ist größer oder gleich dem Levelwert auf Balken 1, und Wert 0 ist kleiner als der Levelwert auf Balken 0)
- Berühren des Wertes von unten (Wert 1 ist kleiner als der Levelwert auf Balken 1, und Wert 0 ist gleich dem Levelwert auf Balken 0)
- Berühren des Wertes von oben (Wert 1 ist größer als der Levelwert auf Balken 1, und Wert 0 ist gleich dem Levelwert auf Balken 0)
- Gleicher Wert (die Linienwerte auf Balken 1 und 0 sind gleich dem Levelwert auf Balken 1 und 0)
Diese Bedingungen reichen völlig aus, um den Zustand der Linie (ihre Form oder Gestalt auf zwei Segmenten zwischen dem 2., dem 1. und dem Nullstrich) und die Schnittpunkte mit anderen Indikatorlinien oder horizontalen Levels zu bestimmen.
Um diese Zustände zu kontrollieren, werden wir universelle Funktionen implementieren, die für alle Indikatoren gelten. Genau wie die Funktion zum Abrufen von Daten aus dem Indikatorpuffer wird sie für alle Indikatoren gleich sein.
Alle Beispiele und Codes, die in diesem Artikel angeboten werden, sind vollständige Codeblöcke. Sie können in nutzerdefinierten Programmen verwendet werden, wie sie sind.
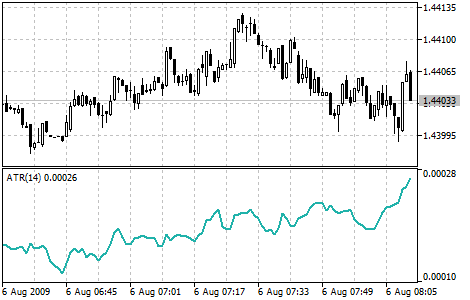
Average True Range
True Range Technischer Indikator (ATR) zeigt die Marktvolatilität an. Er wurde eingeführt von Welles Wilder in seinem Buch „New concepts in technical trading systems“. Dieser Indikator wird seitdem als Komponente mehrerer anderer Indikatoren und Handelssysteme genutzt.
Average True Range (durchschnittlicher wahrer Bereich) kann oft ein Hoch erreichen bei Tiefpunkten des Markts nach einem krassen Abfall, wenn bspw. Panikverkäufe stattfinden. Tiefe Werte des Indikators stehen typischerweise für Seitwärtsbewegungen des Charts über einen längeren Zeitraum, z.B. bei einer Marktkonsolidierung. Er kann nach den gleichen Regeln wie andere Volatilitätsindikatoren interpretiert werden. Average True Range kann nach den gleichen Prinzipien anderer Volatilitätsindikatoren interpretiert werden. Die Vorhersage mit diesem Indikator ist wie folgt möglich: Je höher der Wert des Indikators, desto höher die Wahrscheinlichkeit eines Trendwechsels; je schwächer der Wert, desto schwächer ist die Trendbewegung.
True Range ist der größte der folgenden drei Werte:
- Differenz zwischen aktuellem Hoch und Tief;
- Differenz zwischen vorherigen Schlusskurs und aktuellem Hoch;
- Differenz zwischen vorherigen Schlusskurs und aktuellem Tief.
Der ATR ist ein Durchschnitt der Werte „True Range“ in diesem Bereich.
Parameter
Der Indikator hat nur einen einstellbaren Parameter: die Glättungslänge des gleitenden Durchschnitts. Der Standardwert ist 14.
Vereinbaren wir, dass alle Indikatoreingaben als anpassbare EA-Parameter angegeben werden.
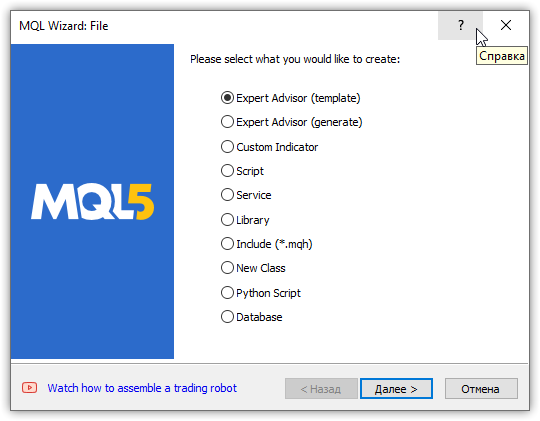
Erstellen einer leeren EA-Vorlage:
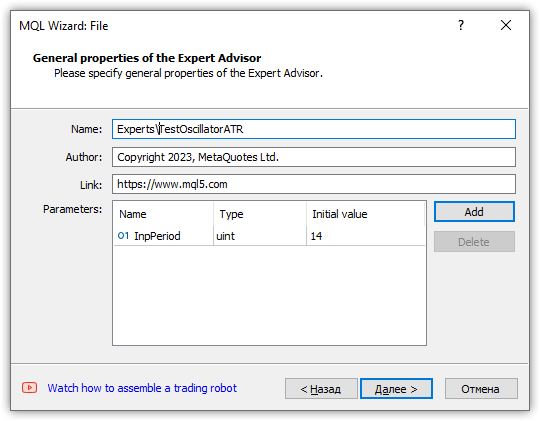
Geben Sie den Namen und den Eingabeparameter ein:
Wählen Sie den Timer „OnTimer“ und die Ereignisbehandlung „OnChartEvent“ aus den Optionen aus:
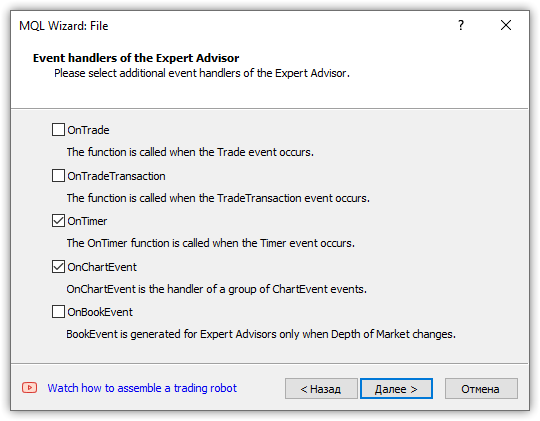
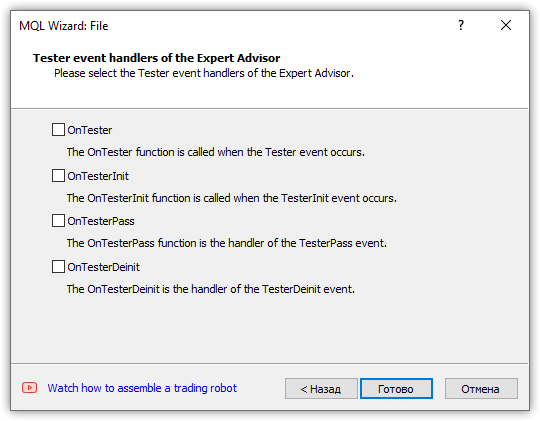
und klicken Sie auf Fertigstellen. Wir erhalten eine leere EA-Vorlage:
//+------------------------------------------------------------------+
//|                                            TestOscillatorATR.mq5 |
//|                                  Copyright 2023, MetaQuotes Ltd. |
//|                                             https://www.mql5.com |
//+------------------------------------------------------------------+
#property copyright "Copyright 2023, MetaQuotes Ltd."
#property link      "https://www.mql5.com"
#property version   "1.00"
//--- input parameters
input uint     InpPeriod=14;
//+------------------------------------------------------------------+
//| Expert initialization function                                   |
//+------------------------------------------------------------------+
int OnInit()
  {
//--- create timer
   EventSetTimer(60);

//---
   return(INIT_SUCCEEDED);
  }
//+------------------------------------------------------------------+
//| Expert deinitialization function                                 |
//+------------------------------------------------------------------+
void OnDeinit(const int reason)
  {
//--- destroy timer
   EventKillTimer();

  }
//+------------------------------------------------------------------+
//| Expert tick function                                             |
//+------------------------------------------------------------------+
void OnTick()
  {
//---

  }
//+------------------------------------------------------------------+
//| Timer function                                                   |
//+------------------------------------------------------------------+
void OnTimer()
  {
//---

  }
//+------------------------------------------------------------------+
//| ChartEvent function                                              |
//+------------------------------------------------------------------+
void OnChartEvent(const int id,
                  const long &lparam,
                  const double &dparam,
                  const string &sparam)
  {
//---

  }
//+------------------------------------------------------------------+
Wir werden den Code nur auf dem globalen Level eingeben: Variablen und Funktionen. In OnInit() und OnDeinit() legen wir die Initialisierung und Steuerung der Indikatorparameter sowie die Erstellung und Löschung des Indikator-Handles fest. Der Test-EA wird ein Dashboard verwenden, das die vom Indikator empfangenen Daten mit einer Beschreibung der Indikatorlinienzustände anzeigt. Die Ereignisbehandlung des EAs OnChartEvent() setzt nur Ereignisse für die Arbeit mit dem Panel um. Mit anderen Worten, um den Indikator im EA vollständig zu handhaben, müssen wir nur Beispiele für erstellte Variablen, ihre Initialisierung, die Erstellung und Löschung eines Indikator-Handles und allgemeine Funktionen für den Empfang von Daten aus einem beliebigen Indikatorpuffer verwenden. Alles andere in den Beispielen ist nur die Arbeit mit dem Panel.
Wir fügen eine Beschreibung des Eingabeparameters und der globalen Variablen für die Erstellung eines Indikators und die Arbeit mit ihm hinzu:
//--- input parameters
input uint  InpPeriod   =  14;   /* ATR Period  */
//--- global variables
int      handle=INVALID_HANDLE;  // Indicator handle
int      period=0;               // ATR calculation period
int      ind_digits=0;           // Number of decimal places in the indicator values
string   ind_title;              // Indicator description
Im vorherigen Artikel haben wir das Dashboard für die Verwendung in Indikatoren und EAs erstellt. Die Klasse wurde nun leicht modifiziert, sodass es möglich ist, eine beliebige Anzahl von Namensschildern zur Anzeige verschiedener Daten zu erstellen. Wir werden die vorgenommenen Änderungen hier nicht beschreiben, aber wir werden später darauf zurückkommen. In den folgenden Artikeln werden wir die vorgenommenen Änderungen und Verbesserungen kurz beschreiben. Um die EAs in diesem Artikel zu testen, sollte sich die Panel-Klassendatei in \MQL5\Include\Dashboard\Dashboard.mqh befinden. Die Datei mit dem Quellcode der Panel-Klassen ist dem Artikel zusammen mit den Test-EA-Dateien beigefügt.
Wir binden die Dashboard-Datei in den EA-Code ein und setzen die globalen Variablen für die Arbeit mit dem Dashboard:
#property copyright "Copyright 2023, MetaQuotes Ltd."
#property link      "https://www.mql5.com"
#property version   "1.00"
//--- includes
#include <Dashboard\Dashboard.mqh>
//--- input parameters
input uint  InpPeriod   =  14;   /* ATR Period  */
//--- global variables
int      handle=INVALID_HANDLE;  // Indicator handle
int      period=0;               // ATR calculation period
int      ind_digits=0;           // Number of decimal places in the indicator values
string   ind_title;              // Indicator description
//--- variables for the panel
int      mouse_bar_index;        // Index of the bar the data is taken from
CDashboard *panel=NULL;          // Pointer to the panel object
Oben haben wir mögliche Optionen zur Klassifizierung des Zustands der Indikatorlinie untersucht. Ich glaube, am bequemsten ist es, eine Enumeration mit allen möglichen Optionen zu erstellen und das Ergebnis der Funktion, die den Zustand der Indikatorlinie bestimmt, in einer Variablen vom Typ dieser Enumeration zu erhalten. Legen wir eine solche Enumeration im globalen Bereich an und erhalten als Ergebnis die folgende Kopfzeile:
#property copyright "Copyright 2023, MetaQuotes Ltd."
#property link      "https://www.mql5.com"
#property version   "1.00"
//--- includes
#include <Dashboard\Dashboard.mqh>
//--- enums
enum ENUM_LINE_STATE
  {
   LINE_STATE_NONE,        // Undefined state
   LINE_STATE_UP,          // Upward
   LINE_STATE_DOWN,        // Downward
   LINE_STATE_TURN_UP,     // Upward reversal
   LINE_STATE_TURN_DOWN,   // Downward reversal
   LINE_STATE_STOP_UP,     // Upward stop
   LINE_STATE_STOP_DOWN,   // Downward stop
   LINE_STATE_ABOVE,       // Above value
   LINE_STATE_UNDER,       // Below value
   LINE_STATE_CROSS_UP,    // Crossing value upwards
   LINE_STATE_CROSS_DOWN,  // Crossing value downwards
   LINE_STATE_TOUCH_BELOW, // Touching value from below
   LINE_STATE_TOUCH_ABOVE, // Touch value from above
   LINE_STATE_EQUALS,      // Equal to value
  };
//--- input parameters
input uint  InpPeriod   =  14;   /* ATR Period  */
//--- global variables
int      handle=INVALID_HANDLE;  // Indicator handle
int      period=0;               // ATR calculation period
int      ind_digits=0;           // Number of decimal places in the indicator values
string   ind_title;              // Indicator description
//--- variables for the panel
int      mouse_bar_index;        // Index of the bar the data is taken from
CDashboard *panel=NULL;          // Pointer to the panel object
Als Nächstes müssen wir die Werte der Eingänge überprüfen und gegebenenfalls anpassen.
Initialisierung
Bei allen Indikatoren wird bei der Eingabe von Null der Standardwert der Periodenlängen gesetzt. Der EA sollte dasselbe Verhalten an den Tag legen, d. h. wenn wir den Wert für die Glättungslänge auf Null setzen, erstellt der EA einen Indikator, der sich nicht von dem Standardindikator unterscheidet, dessen Periodenlänge ebenfalls auf Null gesetzt wurde. In diesem Fall sollte es der Standardwert für beide Indikatoren werden. Außerdem werden einige Indikatoren nicht berechnet, wenn ein Wert in der Periode eingegeben wird. Mit anderen Worten, ihre Mindestdauer beträgt zwei Jahre. Jeder Indikator hat eine unterschiedliche Anzahl von Nachkommastellen. Auch das sollten wir berücksichtigen. Bei allen in diesem Artikel veröffentlichten Vorlagen werden alle Nuancen berücksichtigt. Alle Kontrollen sind bereits durchgeführt worden und werden korrekt gehandhabt. Sie müssen nur den Code aus dem Artikel in den Code Ihres EAs kopieren und ihn verwenden.
OnInit() des EAs mit dem Setzen der Werte der Indikatorvariablen und dem Erstellen des Indikator-Handles:
//+------------------------------------------------------------------+
//| Expert initialization function                                   |
//+------------------------------------------------------------------+
int OnInit()
  {
//--- create timer
   EventSetTimer(60);

//--- Indicator
//--- Set and adjust the calculation period if necessary
   period=int(InpPeriod<1 ? 14 : InpPeriod);
//--- Set the indicator name and the number of decimal places
   ind_title=StringFormat("ATR(%lu)",period);
   ind_digits=Digits();
//--- Create indicator handle
   ResetLastError();
   handle=iATR(Symbol(),PERIOD_CURRENT,period);
   if(handle==INVALID_HANDLE)
     {
      PrintFormat("%s: Failed to create indicator handle %s. Error %ld",__FUNCTION__,ind_title,GetLastError());
      return INIT_FAILED;
     }

//--- Successful initialization
   return(INIT_SUCCEEDED);
  }
//+------------------------------------------------------------------+
Wir fügen den Codeblock in OnInit() ein, um das Dashboard im EA zu verwenden. Infolgedessen sieht der vollständige Handler-Code wie folgt aus (Erstellung des Indikators und Erstellung des Panels):
//+------------------------------------------------------------------+
//| Expert initialization function                                   |
//+------------------------------------------------------------------+
int OnInit()
  {
//--- create timer
   EventSetTimer(60);

//--- Indicator
//--- Set and adjust the calculation period if necessary
   period=int(InpPeriod<1 ? 14 : InpPeriod);
//--- Set the indicator name and the number of decimal places
   ind_title=StringFormat("ATR(%lu)",period);
   ind_digits=Digits();
//--- Create indicator handle
   ResetLastError();
   handle=iATR(Symbol(),PERIOD_CURRENT,period);
   if(handle==INVALID_HANDLE)
     {
      PrintFormat("%s: Failed to create indicator handle %s. Error %ld",__FUNCTION__,ind_title,GetLastError());
      return INIT_FAILED;
     }

//--- Dashboard
//--- Create the panel
   panel=new CDashboard(1,20,20,199,225);
   if(panel==NULL)
     {
      Print("Error. Failed to create panel object");
      return INIT_FAILED;
     }
//--- Set font parameters
   panel.SetFontParams("Calibri",9);
//--- Display the panel with the "Symbol, Timeframe description" header text
   panel.View(Symbol()+", "+StringSubstr(EnumToString(Period()),7));
//--- Create a table with ID 0 to display bar data in it
   panel.CreateNewTable(0);
//--- Draw a table with ID 0 on the panel background
   panel.DrawGrid(0,2,20,6,2,18,97);

//--- Create a table with ID 1 to display indicator data in it
   panel.CreateNewTable(1);
//--- Get the Y2 table coordinate with ID 0 and
//--- set the Y1 coordinate for the table with ID 1
   int y1=panel.TableY2(0)+22;
//--- Draw a table with ID 1 on the panel background
   panel.DrawGrid(1,2,y1,3,2,18,97);

//--- Display tabular data in the journal
   panel.GridPrint(0,2);
   panel.GridPrint(1,2);
//--- Initialize the variable with the index of the mouse cursor bar
   mouse_bar_index=0;
//--- Display the data of the current bar on the panel
   DrawData(mouse_bar_index,TimeCurrent());

//--- Successful initialization
   return(INIT_SUCCEEDED);
  }
Wir benötigen nur den hervorgehobenen Code, um den Indikator zu erstellen. Hier und in den folgenden Test-EAs in diesem Artikel wird das Panel erstellt, um die Daten, die wir vom Indikator erhalten, visuell darzustellen.
Deinitialisierung
In OnDeinit() des EAs müssen wir das Handle des erstellten Indikators freigeben:
//+------------------------------------------------------------------+
//| Expert deinitialization function                                 |
//+------------------------------------------------------------------+
void OnDeinit(const int reason)
  {
//--- destroy timer
   EventKillTimer();

//--- Release handle of the indicator
   ResetLastError();
   if(!IndicatorRelease(handle))
      PrintFormat("%s: IndicatorRelease failed. Error %ld",__FUNCTION__,GetLastError());
//--- Clear all comments on the chart
   Comment("");
  }
Wenn das Panel verwendet wird, sollte das erstellte Panel-Objekt gelöscht werden:
//+------------------------------------------------------------------+
//| Expert deinitialization function                                 |
//+------------------------------------------------------------------+
void OnDeinit(const int reason)
  {
//--- destroy timer
   EventKillTimer();

//--- Release handle of the indicator
   ResetLastError();
   if(!IndicatorRelease(handle))
      PrintFormat("%s: IndicatorRelease failed. Error %ld",__FUNCTION__,GetLastError());
//--- Clear all comments on the chart
   Comment("");

//--- If the panel object exists, delete it
   if(panel!=NULL)
      delete panel;
  }
Abrufen von Daten
Um Daten aus dem Indikatorpuffer zu erhalten, müssen wir die Funktion CopyBuffer() verwenden. Die Funktion empfängt die Daten des angegebenen Indikatorpuffers in der angegebenen Menge in das Array ‚buffer‘.
Es gibt drei Möglichkeiten, Daten zu erhalten:
Zugriff über die Ausgangsposition und die Anzahl der benötigten Elemente:
int  CopyBuffer(
   int       indicator_handle,     // indicator handle
   int       buffer_num,           // indicator buffer index
   int       start_pos,            // starting point
   int       count,                // amount to copy
   double    buffer[]              // array the data to be copied to
   );
Zugang über das Startdatum und die Anzahl der erforderlichen Elemente:
int  CopyBuffer(
   int       indicator_handle,     // indicator handle
   int       buffer_num,           // indicator buffer index
   datetime  start_time,           // starting date
   int       count,                // amount to copy
   double    buffer[]              // array the data to be copied to
   );
Zugang zu den Anfangs- und Enddaten des gewünschten Zeitraums:
int  CopyBuffer(
   int       indicator_handle,     // indicator handle
   int       buffer_num,           // indicator buffer index
   datetime  start_time,           // starting date
   datetime  stop_time,            // end time
   double    buffer[]              // array the data to be copied to
   );
Wir werden die erste Option für die Datenbeschaffung verwenden — nach Balkenindex.
Die Funktion erhält das erforderlichen Indikator-Handle, den Bar-Index und den Indikator-Puffer-Index und gibt den Wert zurück, der von der angegebenen Indikator-Linie am angegebenen Bar-Index erhalten wurde, oder EMPTY_VALUE, wenn der Datenabruf fehlschlägt:
//+------------------------------------------------------------------+
//| Return the indicator data on the specified bar                   |
//+------------------------------------------------------------------+
double IndicatorValue(const int ind_handle,const int index,const int buffer_num)
  {
   double array[1]={0};
   ResetLastError();
   if(CopyBuffer(ind_handle,buffer_num,index,1,array)!=1)
     {
      PrintFormat("%s: CopyBuffer failed. Error %ld",__FUNCTION__,GetLastError());
      return EMPTY_VALUE;
     }
   return array[0];
  }
Es ist erwähnenswert, dass die Funktion CopyBuffer() nicht nur einen Wert von einem Balken auf einmal abrufen kann, sondern auch den angegebenen Bereich von Indikatorlinienwerten. Diese Funktion wird hier nicht verwendet, um die Überwachung des Zustands der Indikatorlinie nicht dadurch zu erschweren, dass der sich ergebende Wertebereich irgendwo im Speicher abgelegt wird und dann die erforderlichen Werte daraus auf der Grundlage von Verschiebungen ab dem angegebenen Index berechnet werden. Hier ist alles einfacher: Wir erhalten den Wert am angegebenen Index und einen weiteren Wert zum Vergleich mit dem ersten. Sie ist einfacher und bequemer in Bezug auf die Funktionsvielfalt.
Die Funktion, die den Zustand der Indikatorlinie zurückgibt:
//+------------------------------------------------------------------+
//| Return the state of the indicator line                           |
//+------------------------------------------------------------------+
ENUM_LINE_STATE LineState(const int ind_handle,const int index,const int buffer_num)
  {
//--- Get the values of the indicator line with the shift (0,1,2) relative to the passed index
   const double value0=IndicatorValue(ind_handle,index,  buffer_num);
   const double value1=IndicatorValue(ind_handle,index+1,buffer_num);
   const double value2=IndicatorValue(ind_handle,index+2,buffer_num);
//--- If at least one of the values could not be obtained, return an undefined value
   if(value0==EMPTY_VALUE || value1==EMPTY_VALUE || value2==EMPTY_VALUE)
      return LINE_STATE_NONE;
//--- Line upward reversal (value2>value1 && value0>value1)
   if(NormalizeDouble(value2-value1,ind_digits)>0 && NormalizeDouble(value0-value1,ind_digits)>0)
      return LINE_STATE_TURN_UP;
//--- Line upward direction (value2<=value1 && value0>value1)
   else if(NormalizeDouble(value2-value1,ind_digits)<=0 && NormalizeDouble(value0-value1,ind_digits)>0)
      return LINE_STATE_UP;
//--- Line upward stop (value2<=value1 && value0==value1)
   else if(NormalizeDouble(value2-value1,ind_digits)<=0 && NormalizeDouble(value0-value1,ind_digits)==0)
      return LINE_STATE_STOP_UP;
//--- Line downward reversal (value2<value1 && value0<value1)
   if(NormalizeDouble(value2-value1,ind_digits)<0 && NormalizeDouble(value0-value1,ind_digits)<0)
      return LINE_STATE_TURN_DOWN;
//--- Line downward direction (value2>=value1 && value0<value1)
   else if(NormalizeDouble(value2-value1,ind_digits)>=0 && NormalizeDouble(value0-value1,ind_digits)<0)
      return LINE_STATE_DOWN;
//--- Line downward stop (value2>=value1 && value0==value1)
   else if(NormalizeDouble(value2-value1,ind_digits)>=0 && NormalizeDouble(value0-value1,ind_digits)==0)
      return LINE_STATE_STOP_DOWN;
//--- Undefined state
   return LINE_STATE_NONE;
  }
Hier erhalten wir die Werte der Indikatorlinie aus drei Balken — aus dem aktuellen und den beiden vorherigen. Dies ist ausreichend, um eine einfache linienförmige Konfiguration zu erhalten. Der Funktion wird der Index des äußersten rechten Balkens von drei übergeben (z. B. mit dem Index 15). Die Balken 17, 16 und 15 werden verwendet, um den Zustand der Linie in diesem Fall zu berechnen. Da wir hier mit reellen Zahlen arbeiten, verwenden wir die normierte Differenz zweier Werte und vergleichen sie mit Null, um die Werte der einzelnen Balken zu vergleichen.
Die Funktion, die den Zustand der Anzeigelinie in Bezug auf das angegebene Niveau zurückgibt:
//+------------------------------------------------------------------+
//| Return the state of the line relative to the specified level     |
//+------------------------------------------------------------------+
ENUM_LINE_STATE LineStateRelative(const int ind_handle,const int index,const int buffer_num,const double level0,const double level1=EMPTY_VALUE)
  {
//--- Get the values of the indicator line with the shift (0,1) relative to the passed index
   const double value0=IndicatorValue(ind_handle,index,  buffer_num);
   const double value1=IndicatorValue(ind_handle,index+1,buffer_num);
//--- If at least one of the values could not be obtained, return an undefined value
   if(value0==EMPTY_VALUE || value1==EMPTY_VALUE)
      return LINE_STATE_NONE;
//--- Define the second level to compare
   double level=(level1==EMPTY_VALUE ? level0 : level1);
//--- The line is below the level (value1<level && value0<level0)
   if(NormalizeDouble(value1-level,ind_digits)<0 && NormalizeDouble(value0-level0,ind_digits)<0)
      return LINE_STATE_UNDER;
//--- The line is above the level (value1>level && value0>level0)
   if(NormalizeDouble(value1-level,ind_digits)>0 && NormalizeDouble(value0-level0,ind_digits)>0)
      return LINE_STATE_ABOVE;
//--- The line crossed the level upwards (value1<=level && value0>level0)
   if(NormalizeDouble(value1-level,ind_digits)<=0 && NormalizeDouble(value0-level0,ind_digits)>0)
      return LINE_STATE_CROSS_UP;
//--- The line crossed the level downwards (value1>=level && value0<level0)
   if(NormalizeDouble(value1-level,ind_digits)>=0 && NormalizeDouble(value0-level0,ind_digits)<0)
      return LINE_STATE_CROSS_DOWN;
//--- The line touched the level from below (value1<level0 && value0==level0)
   if(NormalizeDouble(value1-level,ind_digits)<0 && NormalizeDouble(value0-level0,ind_digits)==0)
      return LINE_STATE_TOUCH_BELOW;
//--- The line touched the level from above (value1>level0 && value0==level0)
   if(NormalizeDouble(value1-level,ind_digits)>0 && NormalizeDouble(value0-level0,ind_digits)==0)
      return LINE_STATE_TOUCH_BELOW;
//--- Line is equal to the level value (value1==level0 && value0==level0)
   if(NormalizeDouble(value1-level,ind_digits)==0 && NormalizeDouble(value0-level0,ind_digits)==0)
      return LINE_STATE_EQUALS;
//--- Undefined state
   return LINE_STATE_NONE;
  }
Die Funktion prüft das Verhältnis zwischen zwei Werten der Indikatorlinie auf zwei benachbarten Balken mit dem in den Parametern übergebenen Niveau. Die Parameter geben den Index des rechten der beiden Balken an, aus denen die Werte der Indikatorlinie entnommen werden, sowie den Levelwert, mit dem die Werte der beiden Balken verglichen werden müssen, um ihre Beziehung zu ermitteln.
Wenn wir die Beziehung zum horizontalen Level benötigen, muss diese im Parameter level0 übergeben werden. Der zweite level1-Parameter ist standardmäßig auf EMPTY_VALUE eingestellt, was bedeutet, dass die Werte von beiden Indikatorlinie von zwei benachbarten Balken mit nur einem Wert verglichen werden, der an level0 übergeben wird (der Balken bei Index+1 wird mit dem level0-Wert verglichen und der Balken bei Index wird mit level0 verglichen).
Erhält level1 einen anderen Wert als EMPTY_VALUE, wird jeder der beiden Indikatorbalken mit zwei entsprechenden Werten in level1 und level0 verglichen (der Balken bei index+1 wird mit dem Wert von level1 verglichen, und der Balken bei Index wird mit level0 verglichen). So kann die Indikatorlinie mit einer anderen Linie desselben oder eines anderen Indikators verglichen werden, um ihre Beziehungen, insbesondere Schnittpunkte, zu ermitteln.
Um Beschreibungen der identifizierten Zustände und Beziehungen der Indikatorlinie anzuzeigen, schreiben wir die Funktion, die eine Beschreibung des Zustands der Indikatorlinie zurückgibt:
//+------------------------------------------------------------------+
//| Return the indicator line state description                      |
//+------------------------------------------------------------------+
string LineStateDescription(const ENUM_LINE_STATE state)
  {
   switch(state)
     {
      case LINE_STATE_UP         :  return "Up";
      case LINE_STATE_STOP_UP    :  return "Stop Up";
      case LINE_STATE_TURN_UP    :  return "Turn Up";
      case LINE_STATE_DOWN       :  return "Down";
      case LINE_STATE_STOP_DOWN  :  return "Stop Down";
      case LINE_STATE_TURN_DOWN  :  return "Turn Down";
      case LINE_STATE_ABOVE      :  return "Above level";
      case LINE_STATE_UNDER      :  return "Under level";
      case LINE_STATE_CROSS_UP   :  return "Crossing Up";
      case LINE_STATE_CROSS_DOWN :  return "Crossing Down";
      case LINE_STATE_TOUCH_BELOW:  return "Touch from Below";
      case LINE_STATE_TOUCH_ABOVE:  return "Touch from Above";
      case LINE_STATE_EQUALS     :  return "Equals";
      default                    :  return "Unknown";
     }
  }
Die drei oben genannten Funktionen können in EAs verwendet werden, um Daten von beliebigen Indikatoren zu empfangen und deren Status und relative Position zu steuern.
Im Folgenden gibt es ein Beispiel dafür, wie wir Daten von einem Indikator empfangen und Datenbeschreibungen anzeigen können. Erstellen wir eine EA-Funktion erstellen, die die vom Indikator erhaltenen Daten auf dem Dashboard anzeigt:
//+------------------------------------------------------------------+
//| Display data from the specified timeseries index to the panel    |
//+------------------------------------------------------------------+
void DrawData(const int index,const datetime time)
  {
//--- Declare the variables to receive data in them
   MqlTick  tick={0};
   MqlRates rates[1];

//--- Exit if unable to get the current prices
   if(!SymbolInfoTick(Symbol(),tick))
      return;
//--- Exit if unable to get the bar data by the specified index
   if(CopyRates(Symbol(),PERIOD_CURRENT,index,1,rates)!=1)
      return;

//--- Set font parameters for bar and indicator data headers
   int  size=0;
   uint flags=0;
   uint angle=0;
   string name=panel.FontParams(size,flags,angle);
   panel.SetFontParams(name,9,FW_BOLD);
   panel.DrawText("Bar data ["+(string)index+"]",3,panel.TableY1(0)-16,clrMaroon,panel.Width()-6);
   panel.DrawText("Indicator data ["+(string)index+"]",3,panel.TableY1(1)-16,clrGreen,panel.Width()-6);
//--- Set font parameters for bar and indicator data
   panel.SetFontParams(name,9);

//--- Display the data of the specified bar in table 0 on the panel
   panel.DrawText("Date",  panel.CellX(0,0,0)+2, panel.CellY(0,0,0)+2); panel.DrawText(TimeToString(  rates[0].time,TIME_DATE),     panel.CellX(0,0,1)+2, panel.CellY(0,0,1)+2,clrNONE,90);
   panel.DrawText("Time",  panel.CellX(0,1,0)+2, panel.CellY(0,1,0)+2); panel.DrawText(TimeToString(  rates[0].time,TIME_MINUTES),  panel.CellX(0,1,1)+2, panel.CellY(0,1,1)+2,clrNONE,90);
   panel.DrawText("Open",  panel.CellX(0,2,0)+2, panel.CellY(0,2,0)+2); panel.DrawText(DoubleToString(rates[0].open,Digits()),      panel.CellX(0,2,1)+2, panel.CellY(0,2,1)+2,clrNONE,90);
   panel.DrawText("High",  panel.CellX(0,3,0)+2, panel.CellY(0,3,0)+2); panel.DrawText(DoubleToString(rates[0].high,Digits()),      panel.CellX(0,3,1)+2, panel.CellY(0,3,1)+2,clrNONE,90);
   panel.DrawText("Low",   panel.CellX(0,4,0)+2, panel.CellY(0,4,0)+2); panel.DrawText(DoubleToString(rates[0].low,Digits()),       panel.CellX(0,4,1)+2, panel.CellY(0,4,1)+2,clrNONE,90);
   panel.DrawText("Close", panel.CellX(0,5,0)+2, panel.CellY(0,5,0)+2); panel.DrawText(DoubleToString(rates[0].close,Digits()),     panel.CellX(0,5,1)+2, panel.CellY(0,5,1)+2,clrNONE,90);

//--- Display the indicator data from the specified bar on the panel in table 1
   panel.DrawText(ind_title, panel.CellX(1,0,0)+2, panel.CellY(1,0,0)+2);
   double value=IndicatorValue(handle,index,0);
   string value_str=(value!=EMPTY_VALUE ? DoubleToString(value,ind_digits) : "");
   panel.DrawText(value_str,panel.CellX(1,0,1)+2,panel.CellY(1,0,1)+2,clrNONE,90);

//--- Display a description of the indicator line state
   panel.DrawText("Line state", panel.CellX(1,1,0)+2, panel.CellY(1,1,0)+2);
   ENUM_LINE_STATE state=LineState(handle,index,0);
   panel.DrawText(LineStateDescription(state),panel.CellX(1,1,1)+2,panel.CellY(1,1,1)+2,clrNONE,90);

//--- Redraw the chart to immediately display all changes on the panel
   ChartRedraw(ChartID());
  }
Eine ähnliche Funktion wurde bereits in den Beispielen des vorherigen Artikels bei der Erstellung des Dashboards verwendet. In diesem Fall werden die Daten des Balkens, auf dem sich der Cursor befindet, auf der ersten Tafel angezeigt, während die Daten des Indikators und der Zustand seiner Linie auf der zweiten Tafel angezeigt werden.
Damit das Panel funktioniert, müssen wir den Code in die Ereignisbehandlung OnChartEvent() einfügen:
//+------------------------------------------------------------------+
//| ChartEvent function                                              |
//+------------------------------------------------------------------+
void OnChartEvent(const int id,
                  const long &lparam,
                  const double &dparam,
                  const string &sparam)
  {
//--- Handling the panel
//--- Call the panel event handler
   panel.OnChartEvent(id,lparam,dparam,sparam);

//--- If the cursor moves or a click is made on the chart
   if(id==CHARTEVENT_MOUSE_MOVE || id==CHARTEVENT_CLICK)
     {
      //--- Declare the variables to record time and price coordinates in them
      datetime time=0;
      double price=0;
      int wnd=0;
      //--- If the cursor coordinates are converted to date and time
      if(ChartXYToTimePrice(ChartID(),(int)lparam,(int)dparam,wnd,time,price))
        {
         //--- write the bar index where the cursor is located to a global variable
         mouse_bar_index=iBarShift(Symbol(),PERIOD_CURRENT,time);
         //--- Display the bar data under the cursor on the panel
         DrawData(mouse_bar_index,time);
        }
     }

//--- If we received a custom event, display the appropriate message in the journal
   if(id>CHARTEVENT_CUSTOM)
     {
      //--- Here we can implement handling a click on the close button on the panel
      PrintFormat("%s: Event id=%ld, object id (lparam): %lu, event message (sparam): %s",__FUNCTION__,id,lparam,sparam);
     }
  }
Wir haben uns die Logik des Handlers bereits im vorherigen Artikel angesehen. Hier verwenden wir sie „wie sie ist“.
Wenn wir nun den EA kompilieren und ihn auf einem Chart mit Standardparametern ausführen (nachdem wir zuvor den ATR-Indikator ebenfalls mit Standardparametern zum Chart hinzugefügt haben), sehen wir ein Dashboard, in dem sich die Daten ändern, während sich der Cursor über den Chart bewegt:
Sie können den TestOscillatorATR.mq5 Test EA in den an den Artikel angehängten Dateien ansehen.
Bears Power
Der Handel ist ein stetiger Kampf zwischen Käufern (Bulls), die die Preise nach oben treiben und Verkäufern (Bears), die die Preise nach unten treiben. Je nachdem welche Richtung gewonnen hat, endet der Preis des Tages höher oder tiefer als der Vortages-Schlusskurs. Zwischenergebnisse, der höchste und niedrigste Preis, erlaubt die Beurteilung wie sich der Kampf verschiebt im Laufe des Tages.
Es ist wichtig die Bears Power Balance abzuschätzen, da Änderungen eine mögliche Trendumkehr signalisieren. Diese Aufgabe kann mit dem Oszillator Bears Power gelöst werden, der von Alexander Elder entwickelt und in seinem Buch „Trading for a Living“ beschrieben wurde. Elder entwickelte den Indikator auf Basis der folgenden Prinzipien:
- Moving Average ist eine Preis-Abstimmung zwischen Käufern und Verkäufern über eine bestimmte Periode,
- der niedrigste Preis zeigt die maximale Kraft (power) der Verkäufer innerhalb des Tages.
Unter diesen Prämissen entwickelte Elder Bears Power als Differenz zwischen dem niedrigsten Kurs und dem gleitenden 13-Perioden-DurchschnittExponentieller Gleitender Durchschnitt (LOW — ЕМА).
Dieser Indikator wird am besten mit einem Trend Indikator verwendet (meist Gleitender Durchschnitt):
- Wenn der Trend Indikator aufwärts zeigt und der Bears Power Index unter Null liegt, aber wächst, ist dies ein Kauf-Signal;
- Eine Divergenz der Tiefpunkte des Indikators ist wünschenswert für dieses Signal.
Parameter
Der Indikator hat einen konfigurierbaren Parameter — den Berechnungszeitraum. Der Standardwert ist 13.
Fügen wir nun Parameter und Variablen für die Arbeit mit dem Indikator in den Code ein:
//+------------------------------------------------------------------+
//|                                          TestOscillatorBears.mq5 |
//|                                  Copyright 2023, MetaQuotes Ltd. |
//|                                             https://www.mql5.com |
//+------------------------------------------------------------------+
#property copyright "Copyright 2023, MetaQuotes Ltd."
#property link      "https://www.mql5.com"
#property version   "1.00"
//--- enums
enum ENUM_LINE_STATE
  {
   LINE_STATE_NONE,        // Undefined state
   LINE_STATE_UP,          // Upward
   LINE_STATE_DOWN,        // Downward
   LINE_STATE_TURN_UP,     // Upward reversal
   LINE_STATE_TURN_DOWN,   // Downward reversal
   LINE_STATE_STOP_UP,     // Upward stop
   LINE_STATE_STOP_DOWN,   // Downward stop
   LINE_STATE_ABOVE,       // Above value
   LINE_STATE_UNDER,       // Below value
   LINE_STATE_CROSS_UP,    // Crossing value upwards
   LINE_STATE_CROSS_DOWN,  // Crossing value downwards
   LINE_STATE_TOUCH_BELOW, // Touching value from below
   LINE_STATE_TOUCH_ABOVE, // Touch value from above
   LINE_STATE_EQUALS,      // Equal to value
  };
//--- input parameters
input uint  InpPeriod   =  13;   /* Bears Power Period   */
//--- global variables
int      handle=INVALID_HANDLE;  // Indicator handle
int      period=0;               // Bears Power calculation period
int      ind_digits=0;           // Number of decimal places in the indicator values
string   ind_title;              // Indicator description
Wenn wir das Panel verwenden, schließen wir die Dashboard-Klassendatei ein und fügen die Variablen für die Arbeit mit dem Panel hinzu:
//+------------------------------------------------------------------+
//|                                          TestOscillatorBears.mq5 |
//|                                  Copyright 2023, MetaQuotes Ltd. |
//|                                             https://www.mql5.com |
//+------------------------------------------------------------------+
#property copyright "Copyright 2023, MetaQuotes Ltd."
#property link      "https://www.mql5.com"
#property version   "1.00"
//--- includes
#include <Dashboard\Dashboard.mqh>
//--- enums
enum ENUM_LINE_STATE
  {
   LINE_STATE_NONE,        // Undefined state
   LINE_STATE_UP,          // Upward
   LINE_STATE_DOWN,        // Downward
   LINE_STATE_TURN_UP,     // Upward reversal
   LINE_STATE_TURN_DOWN,   // Downward reversal
   LINE_STATE_STOP_UP,     // Upward stop
   LINE_STATE_STOP_DOWN,   // Downward stop
   LINE_STATE_ABOVE,       // Above value
   LINE_STATE_UNDER,       // Below value
   LINE_STATE_CROSS_UP,    // Crossing value upwards
   LINE_STATE_CROSS_DOWN,  // Crossing value downwards
   LINE_STATE_TOUCH_BELOW, // Touching value from below
   LINE_STATE_TOUCH_ABOVE, // Touch value from above
   LINE_STATE_EQUALS,      // Equal to value
  };
//--- input parameters
input uint  InpPeriod   =  13;   /* Bears Power Period   */
//--- global variables
int      handle=INVALID_HANDLE;  // Indicator handle
int      period=0;               // Bears Power calculation period
int      ind_digits=0;           // Number of decimal places in the indicator values
string   ind_title;              // Indicator description
//--- variables for the panel
int      mouse_bar_index;        // Index of the bar the data is taken from
CDashboard *panel=NULL;          // Pointer to the panel object
Initialisierung
In OnInit() initialisieren und justieren wir die Eingaben des Indikators und erstellen sein Handle:
//+------------------------------------------------------------------+
//| Expert initialization function                                   |
//+------------------------------------------------------------------+
int OnInit()
  {
//--- create timer
   EventSetTimer(60);

//--- Indicator
//--- Set and adjust the calculation period if necessary
   period=int(InpPeriod<1 ? 13 : InpPeriod);
//--- Set the indicator name and the number of decimal places
   ind_title=StringFormat("Bears(%lu)",period);
   ind_digits=Digits()+1;
//--- Create indicator handle
   ResetLastError();
   handle=iBearsPower(Symbol(),PERIOD_CURRENT,period);
   if(handle==INVALID_HANDLE)
     {
      PrintFormat("%s: Failed to create indicator handle %s. Error %ld",__FUNCTION__,ind_title,GetLastError());
      return INIT_FAILED;
     }

//--- Successful initialization
   return(INIT_SUCCEEDED);
  }
Wenn der EA die Verwendung des Dashboards vorsieht, erstellen wir es hier:
//+------------------------------------------------------------------+
//| Expert initialization function                                   |
//+------------------------------------------------------------------+
int OnInit()
  {
//--- create timer
   EventSetTimer(60);

//--- Indicator
//--- Set and adjust the calculation period if necessary
   period=int(InpPeriod<1 ? 13 : InpPeriod);
//--- Set the indicator name and the number of decimal places
   ind_title=StringFormat("Bears(%lu)",period);
   ind_digits=Digits()+1;
//--- Create indicator handle
   ResetLastError();
   handle=iBearsPower(Symbol(),PERIOD_CURRENT,period);
   if(handle==INVALID_HANDLE)
     {
      PrintFormat("%s: Failed to create indicator handle %s. Error %ld",__FUNCTION__,ind_title,GetLastError());
      return INIT_FAILED;
     }

//--- Dashboard
//--- Create the panel
   panel=new CDashboard(1,20,20,199,225);
   if(panel==NULL)
     {
      Print("Error. Failed to create panel object");
      return INIT_FAILED;
     }
//--- Set font parameters
   panel.SetFontParams("Calibri",9);
//--- Display the panel with the "Symbol, Timeframe description" header text
   panel.View(Symbol()+", "+StringSubstr(EnumToString(Period()),7));
//--- Create a table with ID 0 to display bar data in it
   panel.CreateNewTable(0);
//--- Draw a table with ID 0 on the panel background
   panel.DrawGrid(0,2,20,6,2,18,97);

//--- Create a table with ID 1 to display indicator data in it
   panel.CreateNewTable(1);
//--- Get the Y2 table coordinate with ID 0 and
//--- set the Y1 coordinate for the table with ID 1
   int y1=panel.TableY2(0)+22;
//--- Draw a table with ID 1 on the panel background
   panel.DrawGrid(1,2,y1,3,2,18,97);

//--- Display tabular data in the journal
   panel.GridPrint(0,2);
   panel.GridPrint(1,2);
//--- Initialize the variable with the index of the mouse cursor bar
   mouse_bar_index=0;
//--- Display the data of the current bar on the panel
   DrawData(mouse_bar_index,TimeCurrent());

//--- Successful initialization
   return(INIT_SUCCEEDED);
  }
Deinitialisierung
In OnDeinit() geben wir das Handle im EA wieder frei:
//+------------------------------------------------------------------+
//| Expert deinitialization function                                 |
//+------------------------------------------------------------------+
void OnDeinit(const int reason)
  {
//--- destroy timer
   EventKillTimer();

//--- Release handle of the indicator
   ResetLastError();
   if(!IndicatorRelease(handle))
      PrintFormat("%s: IndicatorRelease failed. Error %ld",__FUNCTION__,GetLastError());
//--- Clear all comments on the chart
   Comment("");
  }
Wenn der EA das Panel verwendet, entfernen wir hier auch das erstellte Panel-Klassenobjekt:
//+------------------------------------------------------------------+
//| Expert deinitialization function                                 |
//+------------------------------------------------------------------+
void OnDeinit(const int reason)
  {
//--- destroy timer
   EventKillTimer();

//--- Release handle of the indicator
   ResetLastError();
   if(!IndicatorRelease(handle))
      PrintFormat("%s: IndicatorRelease failed. Error %ld",__FUNCTION__,GetLastError());
//--- Clear all comments on the chart
   Comment("");

//--- If the panel object exists, delete it
   if(panel!=NULL)
      delete panel;
  }
Abrufen von Daten
Wir haben bereits die gemeinsamen Funktionen für alle Indikatoren implementiert, um Daten aus ihnen abzurufen:
//+------------------------------------------------------------------+
//| Return the indicator data on the specified bar                   |
//+------------------------------------------------------------------+
double IndicatorValue(const int ind_handle,const int index,const int buffer_num)
  {
   double array[1]={0};
   ResetLastError();
   if(CopyBuffer(ind_handle,buffer_num,index,1,array)!=1)
     {
      PrintFormat("%s: CopyBuffer failed. Error %ld",__FUNCTION__,GetLastError());
      return EMPTY_VALUE;
     }
   return array[0];
  }
//+------------------------------------------------------------------+
//| Return the state of the indicator line                           |
//+------------------------------------------------------------------+
ENUM_LINE_STATE LineState(const int ind_handle,const int index,const int buffer_num)
  {
//--- Get the values of the indicator line with the shift (0,1,2) relative to the passed index
   const double value0=IndicatorValue(ind_handle,index,  buffer_num);
   const double value1=IndicatorValue(ind_handle,index+1,buffer_num);
   const double value2=IndicatorValue(ind_handle,index+2,buffer_num);
//--- If at least one of the values could not be obtained, return an undefined value
   if(value0==EMPTY_VALUE || value1==EMPTY_VALUE || value2==EMPTY_VALUE)
      return LINE_STATE_NONE;
//--- Line upward reversal (value2>value1 && value0>value1)
   if(NormalizeDouble(value2-value1,ind_digits)>0 && NormalizeDouble(value0-value1,ind_digits)>0)
      return LINE_STATE_TURN_UP;
//--- Line upward direction (value2<=value1 && value0>value1)
   else if(NormalizeDouble(value2-value1,ind_digits)<=0 && NormalizeDouble(value0-value1,ind_digits)>0)
      return LINE_STATE_UP;
//--- Line upward stop (value2<=value1 && value0==value1)
   else if(NormalizeDouble(value2-value1,ind_digits)<=0 && NormalizeDouble(value0-value1,ind_digits)==0)
      return LINE_STATE_STOP_UP;
//--- Line downward reversal (value2<value1 && value0<value1)
   if(NormalizeDouble(value2-value1,ind_digits)<0 && NormalizeDouble(value0-value1,ind_digits)<0)
      return LINE_STATE_TURN_DOWN;
//--- Line downward direction (value2>=value1 && value0<value1)
   else if(NormalizeDouble(value2-value1,ind_digits)>=0 && NormalizeDouble(value0-value1,ind_digits)<0)
      return LINE_STATE_DOWN;
//--- Line downward stop (value2>=value1 && value0==value1)
   else if(NormalizeDouble(value2-value1,ind_digits)>=0 && NormalizeDouble(value0-value1,ind_digits)==0)
      return LINE_STATE_STOP_DOWN;
//--- Undefined state
   return LINE_STATE_NONE;
  }
//+------------------------------------------------------------------+
//| Return the state of the line relative to the specified level     |
//+------------------------------------------------------------------+
ENUM_LINE_STATE LineStateRelative(const int ind_handle,const int index,const int buffer_num,const double level0,const double level1=EMPTY_VALUE)
  {
//--- Get the values of the indicator line with the shift (0,1) relative to the passed index
   const double value0=IndicatorValue(ind_handle,index,  buffer_num);
   const double value1=IndicatorValue(ind_handle,index+1,buffer_num);
//--- If at least one of the values could not be obtained, return an undefined value
   if(value0==EMPTY_VALUE || value1==EMPTY_VALUE)
      return LINE_STATE_NONE;
//--- Define the second level to compare
   double level=(level1==EMPTY_VALUE ? level0 : level1);
//--- The line is below the level (value1<level && value0<level0)
   if(NormalizeDouble(value1-level,ind_digits)<0 && NormalizeDouble(value0-level0,ind_digits)<0)
      return LINE_STATE_UNDER;
//--- The line is above the level (value1>level && value0>level0)
   if(NormalizeDouble(value1-level,ind_digits)>0 && NormalizeDouble(value0-level0,ind_digits)>0)
      return LINE_STATE_ABOVE;
//--- The line crossed the level upwards (value1<=level && value0>level0)
   if(NormalizeDouble(value1-level,ind_digits)<=0 && NormalizeDouble(value0-level0,ind_digits)>0)
      return LINE_STATE_CROSS_UP;
//--- The line crossed the level downwards (value1>=level && value0<level0)
   if(NormalizeDouble(value1-level,ind_digits)>=0 && NormalizeDouble(value0-level0,ind_digits)<0)
      return LINE_STATE_CROSS_DOWN;
//--- The line touched the level from below (value1<level0 && value0==level0)
   if(NormalizeDouble(value1-level,ind_digits)<0 && NormalizeDouble(value0-level0,ind_digits)==0)
      return LINE_STATE_TOUCH_BELOW;
//--- The line touched the level from above (value1>level0 && value0==level0)
   if(NormalizeDouble(value1-level,ind_digits)>0 && NormalizeDouble(value0-level0,ind_digits)==0)
      return LINE_STATE_TOUCH_BELOW;
//--- Line is equal to the level value (value1==level0 && value0==level0)
   if(NormalizeDouble(value1-level,ind_digits)==0 && NormalizeDouble(value0-level0,ind_digits)==0)
      return LINE_STATE_EQUALS;
//--- Undefined state
   return LINE_STATE_NONE;
  }
//+------------------------------------------------------------------+
//| Return the indicator line state description                      |
//+------------------------------------------------------------------+
string LineStateDescription(const ENUM_LINE_STATE state)
  {
   switch(state)
     {
      case LINE_STATE_UP         :  return "Up";
      case LINE_STATE_STOP_UP    :  return "Stop Up";
      case LINE_STATE_TURN_UP    :  return "Turn Up";
      case LINE_STATE_DOWN       :  return "Down";
      case LINE_STATE_STOP_DOWN  :  return "Stop Down";
      case LINE_STATE_TURN_DOWN  :  return "Turn Down";
      case LINE_STATE_ABOVE      :  return "Above level";
      case LINE_STATE_UNDER      :  return "Under level";
      case LINE_STATE_CROSS_UP   :  return "Crossing Up";
      case LINE_STATE_CROSS_DOWN :  return "Crossing Down";
      case LINE_STATE_TOUCH_BELOW:  return "Touch from Below";
      case LINE_STATE_TOUCH_ABOVE:  return "Touch from Above";
      case LINE_STATE_EQUALS     :  return "Equals";
      default                    :  return "Unknown";
     }
  }
Alle Beispiele werden hier unverändert übernommen.
Wenn der EA ein Dashboard verwendet, werden wir die Funktion implementieren, die die vom Indikator empfangenen Daten auf dem Dashboard anzeigt:
//+------------------------------------------------------------------+
//| Display data from the specified timeseries index to the panel    |
//+------------------------------------------------------------------+
void DrawData(const int index,const datetime time)
  {
//--- Declare the variables to receive data in them
   MqlTick  tick={0};
   MqlRates rates[1];

//--- Exit if unable to get the current prices
   if(!SymbolInfoTick(Symbol(),tick))
      return;
//--- Exit if unable to get the bar data by the specified index
   if(CopyRates(Symbol(),PERIOD_CURRENT,index,1,rates)!=1)
      return;

//--- Set font parameters for bar and indicator data headers
   int  size=0;
   uint flags=0;
   uint angle=0;
   string name=panel.FontParams(size,flags,angle);
   panel.SetFontParams(name,9,FW_BOLD);
   panel.DrawText("Bar data ["+(string)index+"]",3,panel.TableY1(0)-16,clrMaroon,panel.Width()-6);
   panel.DrawText("Indicator data ["+(string)index+"]",3,panel.TableY1(1)-16,clrGreen,panel.Width()-6);
//--- Set font parameters for bar and indicator data
   panel.SetFontParams(name,9);

//--- Display the data of the specified bar in table 0 on the panel
   panel.DrawText("Date",  panel.CellX(0,0,0)+2, panel.CellY(0,0,0)+2); panel.DrawText(TimeToString(  rates[0].time,TIME_DATE),     panel.CellX(0,0,1)+2, panel.CellY(0,0,1)+2,clrNONE,90);
   panel.DrawText("Time",  panel.CellX(0,1,0)+2, panel.CellY(0,1,0)+2); panel.DrawText(TimeToString(  rates[0].time,TIME_MINUTES),  panel.CellX(0,1,1)+2, panel.CellY(0,1,1)+2,clrNONE,90);
   panel.DrawText("Open",  panel.CellX(0,2,0)+2, panel.CellY(0,2,0)+2); panel.DrawText(DoubleToString(rates[0].open,Digits()),      panel.CellX(0,2,1)+2, panel.CellY(0,2,1)+2,clrNONE,90);
   panel.DrawText("High",  panel.CellX(0,3,0)+2, panel.CellY(0,3,0)+2); panel.DrawText(DoubleToString(rates[0].high,Digits()),      panel.CellX(0,3,1)+2, panel.CellY(0,3,1)+2,clrNONE,90);
   panel.DrawText("Low",   panel.CellX(0,4,0)+2, panel.CellY(0,4,0)+2); panel.DrawText(DoubleToString(rates[0].low,Digits()),       panel.CellX(0,4,1)+2, panel.CellY(0,4,1)+2,clrNONE,90);
   panel.DrawText("Close", panel.CellX(0,5,0)+2, panel.CellY(0,5,0)+2); panel.DrawText(DoubleToString(rates[0].close,Digits()),     panel.CellX(0,5,1)+2, panel.CellY(0,5,1)+2,clrNONE,90);

//--- Display the indicator data from the specified bar on the panel in table 1
   panel.DrawText(ind_title, panel.CellX(1,0,0)+2, panel.CellY(1,0,0)+2);
   double value=IndicatorValue(handle,index,0);
   string value_str=(value!=EMPTY_VALUE ? DoubleToString(value,ind_digits) : "");
   panel.DrawText(value_str,panel.CellX(1,0,1)+2,panel.CellY(1,0,1)+2,clrNONE,90);

//--- Display a description of the indicator line state
   panel.DrawText("Line state", panel.CellX(1,1,0)+2, panel.CellY(1,1,0)+2);
   ENUM_LINE_STATE state=LineState(handle,index,0);
//--- The label color changes depending on the value of the line above/below zero
   color clr=(value<0 ? clrRed : value>0 ? clrBlue : clrNONE);
   panel.DrawText(LineStateDescription(state),panel.CellX(1,1,1)+2,panel.CellY(1,1,1)+2,clr,90);

//--- Redraw the chart to immediately display all changes on the panel
   ChartRedraw(ChartID());
  }
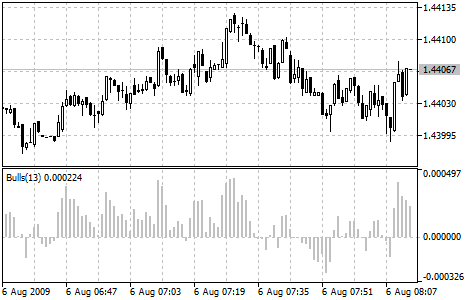
Da die Signale des Indikators von der Lage der Linie im Verhältnis zum Nullpunkt abhängen, werden wir positive und negative Werte des Indikators im Dashboard hervorheben.
Wir schreiben in der Ereignisbehandlung des EAs OnChartEvent() den Code für die Arbeit mit Panel-Ereignissen und die Angabe des Index des Balkens, über dem sich der Cursor befindet:
//+------------------------------------------------------------------+
//| ChartEvent function                                              |
//+------------------------------------------------------------------+
void OnChartEvent(const int id,
                  const long &lparam,
                  const double &dparam,
                  const string &sparam)
  {
//--- Handling the panel
//--- Call the panel event handler
   panel.OnChartEvent(id,lparam,dparam,sparam);

//--- If the cursor moves or a click is made on the chart
   if(id==CHARTEVENT_MOUSE_MOVE || id==CHARTEVENT_CLICK)
     {
      //--- Declare the variables to record time and price coordinates in them
      datetime time=0;
      double price=0;
      int wnd=0;
      //--- If the cursor coordinates are converted to date and time
      if(ChartXYToTimePrice(ChartID(),(int)lparam,(int)dparam,wnd,time,price))
        {
         //--- write the bar index where the cursor is located to a global variable
         mouse_bar_index=iBarShift(Symbol(),PERIOD_CURRENT,time);
         //--- Display the bar data under the cursor on the panel
         DrawData(mouse_bar_index,time);
        }
     }

//--- If we received a custom event, display the appropriate message in the journal
   if(id>CHARTEVENT_CUSTOM)
     {
      //--- Here we can implement handling a click on the close button on the panel
      PrintFormat("%s: Event id=%ld, object id (lparam): %lu, event message (sparam): %s",__FUNCTION__,id,lparam,sparam);
     }
  }
Kompilieren Sie den EA und führen Sie ihn auf dem Chart mit Standardwerten aus. Vergewissern Sie sich, dass Sie den Indikator mit denselben Parametern zum Chart hinzugefügt haben:
Die EA-Datei „TestOscillatorBears.mq5“ ist unten angehängt.
Bulls Power
Der Handel ist ein stetiger Kampf zwischen Käufern (Bulls), die die Preise nach oben treiben und Verkäufern (Bears), die die Preise nach unten treiben. Je nachdem welche Richtung gewonnen hat, endet der Preis des Tages höher oder tiefer als der Vortages-Schlusskurs. Zwischenergebnisse, der höchste und niedrigste Preis, erlaubt die Beurteilung wie sich der Kampf verschiebt im Laufe des Tages.
Es ist wichtig die Bulls Power Balance abzuschätzen, da Änderungen eine mögliche Trendumkehr signalisieren. Diese Aufgabe kann mit dem Oszillator Bulls Power gelöst werden, der von Alexander Elder entwickelt und in seinem Buch „Trading for a Living“ beschrieben wurde. Elder entwickelte den Indikator auf Basis der folgenden Prinzipien:
- Der Gleitende Durchschnitt ist eine Preis-Abstimmung zwischen Käufern und Verkäufern über eine bestimmte Periode.
- Der höchste Preis zeigt die maximale Käufer Power innerhalb des Tages.
Unter diesen Prämissen entwickelte Elder Bulls Power als Differenz zwischen dem höchsten Kurs und dem Exponentiellen Gleitenden Durchschnitt (HIGH — ЕМА) mit einer Periodenlänge von 13.
Dieser Indikator wird am besten mit einem Trend Indikator verwendet (meist Gleitender Durchschnitt):
- Wenn der Trend Indikator abwärts zeigt und der Bulls Power Index über Null liegt, aber fällt, ist dies ein Verkauf-Signal;
- Eine Divergenz der Hochs des Indikators ist wünschenswert für dieses Signal.
Parameter
Der Indikator hat einen einstellbaren Parameter — die Glättungslänge. Der Standardwert ist 13.
Die Liste der Eingabe- und globalen Variablen zur Verwendung im EA:
//+------------------------------------------------------------------+
//|                                          TestOscillatorBulls.mq5 |
//|                                  Copyright 2023, MetaQuotes Ltd. |
//|                                             https://www.mql5.com |
//+------------------------------------------------------------------+
#property copyright "Copyright 2023, MetaQuotes Ltd."
#property link      "https://www.mql5.com"
#property version   "1.00"
//--- enums
enum ENUM_LINE_STATE
  {
   LINE_STATE_NONE,        // Undefined state
   LINE_STATE_UP,          // Upward
   LINE_STATE_DOWN,        // Downward
   LINE_STATE_TURN_UP,     // Upward reversal
   LINE_STATE_TURN_DOWN,   // Downward reversal
   LINE_STATE_STOP_UP,     // Upward stop
   LINE_STATE_STOP_DOWN,   // Downward stop
   LINE_STATE_ABOVE,       // Above value
   LINE_STATE_UNDER,       // Below value
   LINE_STATE_CROSS_UP,    // Crossing value upwards
   LINE_STATE_CROSS_DOWN,  // Crossing value downwards
   LINE_STATE_TOUCH_BELOW, // Touching value from below
   LINE_STATE_TOUCH_ABOVE, // Touch value from above
   LINE_STATE_EQUALS,      // Equal to value
  };
//--- input parameters
input uint  InpPeriod   =  13;   /* Bulls Power Period   */
//--- global variables
int      handle=INVALID_HANDLE;  // Indicator handle
int      period=0;               // Bulls Power calculation period
int      ind_digits=0;           // Number of decimal places in the indicator values
string   ind_title;              // Indicator description
Bei der Verwendung des Dashboards wird die Klassendatei des Panels eingebunden und die Variablen für die Arbeit mit dem Panel werden hinzugefügt:
//+------------------------------------------------------------------+
//|                                          TestOscillatorBulls.mq5 |
//|                                  Copyright 2023, MetaQuotes Ltd. |
//|                                             https://www.mql5.com |
//+------------------------------------------------------------------+
#property copyright "Copyright 2023, MetaQuotes Ltd."
#property link      "https://www.mql5.com"
#property version   "1.00"
//--- includes
#include <Dashboard\Dashboard.mqh>
//--- enums
enum ENUM_LINE_STATE
  {
   LINE_STATE_NONE,        // Undefined state
   LINE_STATE_UP,          // Upward
   LINE_STATE_DOWN,        // Downward
   LINE_STATE_TURN_UP,     // Upward reversal
   LINE_STATE_TURN_DOWN,   // Downward reversal
   LINE_STATE_STOP_UP,     // Upward stop
   LINE_STATE_STOP_DOWN,   // Downward stop
   LINE_STATE_ABOVE,       // Above value
   LINE_STATE_UNDER,       // Below value
   LINE_STATE_CROSS_UP,    // Crossing value upwards
   LINE_STATE_CROSS_DOWN,  // Crossing value downwards
   LINE_STATE_TOUCH_BELOW, // Touching value from below
   LINE_STATE_TOUCH_ABOVE, // Touch value from above
   LINE_STATE_EQUALS,      // Equal to value
  };
//--- input parameters
input uint  InpPeriod   =  13;   /* Bulls Power Period   */
//--- global variables
int      handle=INVALID_HANDLE;  // Indicator handle
int      period=0;               // Bulls Power calculation period
int      ind_digits=0;           // Number of decimal places in the indicator values
string   ind_title;              // Indicator description
//--- variables for the panel
int      mouse_bar_index;        // Index of the bar the data is taken from
CDashboard *panel=NULL;          // Pointer to the panel object
Initialisierung
OnInit() für die Initialisierung der Indikatorparameter und die Erstellung seines Handles:
//+------------------------------------------------------------------+
//| Expert initialization function                                   |
//+------------------------------------------------------------------+
int OnInit()
  {
//--- create timer
   EventSetTimer(60);

//--- Indicator
//--- Set and adjust the calculation period if necessary
   period=int(InpPeriod<1 ? 13 : InpPeriod);
//--- Set the indicator name and the number of decimal places
   ind_title=StringFormat("Bulls(%lu)",period);
   ind_digits=Digits()+1;
//--- Create indicator handle
   ResetLastError();
   handle=iBullsPower(Symbol(),PERIOD_CURRENT,period);
   if(handle==INVALID_HANDLE)
     {
      PrintFormat("%s: Failed to create indicator handle %s. Error %ld",__FUNCTION__,ind_title,GetLastError());
      return INIT_FAILED;
     }

//--- Successful initialization
   return(INIT_SUCCEEDED);
  }
Das Panel wird bei Verwendung des Dashboards erstellt:
//+------------------------------------------------------------------+
//| Expert initialization function                                   |
//+------------------------------------------------------------------+
int OnInit()
  {
//--- create timer
   EventSetTimer(60);

//--- Indicator
//--- Set and adjust the calculation period if necessary
   period=int(InpPeriod<1 ? 13 : InpPeriod);
//--- Set the indicator name and the number of decimal places
   ind_title=StringFormat("Bulls(%lu)",period);
   ind_digits=Digits()+1;
//--- Create indicator handle
   ResetLastError();
   handle=iBullsPower(Symbol(),PERIOD_CURRENT,period);
   if(handle==INVALID_HANDLE)
     {
      PrintFormat("%s: Failed to create indicator handle %s. Error %ld",__FUNCTION__,ind_title,GetLastError());
      return INIT_FAILED;
     }

//--- Dashboard
//--- Create the panel
   panel=new CDashboard(1,20,20,199,225);
   if(panel==NULL)
     {
      Print("Error. Failed to create panel object");
      return INIT_FAILED;
     }
//--- Set font parameters
   panel.SetFontParams("Calibri",9);
//--- Display the panel with the "Symbol, Timeframe description" header text
   panel.View(Symbol()+", "+StringSubstr(EnumToString(Period()),7));
//--- Create a table with ID 0 to display bar data in it
   panel.CreateNewTable(0);
//--- Draw a table with ID 0 on the panel background
   panel.DrawGrid(0,2,20,6,2,18,97);

//--- Create a table with ID 1 to display indicator data in it
   panel.CreateNewTable(1);
//--- Get the Y2 table coordinate with ID 0 and
//--- set the Y1 coordinate for the table with ID 1
   int y1=panel.TableY2(0)+22;
//--- Draw a table with ID 1 on the panel background
   panel.DrawGrid(1,2,y1,3,2,18,97);

//--- Display tabular data in the journal
   panel.GridPrint(0,2);
   panel.GridPrint(1,2);
//--- Initialize the variable with the index of the mouse cursor bar
   mouse_bar_index=0;
//--- Display the data of the current bar on the panel
   DrawData(mouse_bar_index,TimeCurrent());

//--- Successful initialization
   return(INIT_SUCCEEDED);
  }
Deinitialisierung
In OnDeinit() geben wir das Handle im EA wieder frei:
//+------------------------------------------------------------------+
//| Expert deinitialization function                                 |
//+------------------------------------------------------------------+
void OnDeinit(const int reason)
  {
//--- destroy timer
   EventKillTimer();

//--- Release handle of the indicator
   ResetLastError();
   if(!IndicatorRelease(handle))
      PrintFormat("%s: IndicatorRelease failed. Error %ld",__FUNCTION__,GetLastError());
//--- Clear all comments on the chart
   Comment("");
  }
Das erstellte Dashboard-Objekt wird bei der Verwendung des Dashboards entfernt:
//+------------------------------------------------------------------+
//| Expert deinitialization function                                 |
//+------------------------------------------------------------------+
void OnDeinit(const int reason)
  {
//--- destroy timer
   EventKillTimer();

//--- Release handle of the indicator
   ResetLastError();
   if(!IndicatorRelease(handle))
      PrintFormat("%s: IndicatorRelease failed. Error %ld",__FUNCTION__,GetLastError());
//--- Clear all comments on the chart
   Comment("");

//--- If the panel object exists, delete it
   if(panel!=NULL)
      delete panel;
  }
Abrufen von Daten
Allgemeine Funktionen zum Abrufen von Daten über das Indikatorhandle:
//+------------------------------------------------------------------+
//| Return the indicator data on the specified bar                   |
//+------------------------------------------------------------------+
double IndicatorValue(const int ind_handle,const int index,const int buffer_num)
  {
   double array[1]={0};
   ResetLastError();
   if(CopyBuffer(ind_handle,buffer_num,index,1,array)!=1)
     {
      PrintFormat("%s: CopyBuffer failed. Error %ld",__FUNCTION__,GetLastError());
      return EMPTY_VALUE;
     }
   return array[0];
  }
//+------------------------------------------------------------------+
//| Return the state of the indicator line                           |
//+------------------------------------------------------------------+
ENUM_LINE_STATE LineState(const int ind_handle,const int index,const int buffer_num)
  {
//--- Get the values of the indicator line with the shift (0,1,2) relative to the passed index
   const double value0=IndicatorValue(ind_handle,index,  buffer_num);
   const double value1=IndicatorValue(ind_handle,index+1,buffer_num);
   const double value2=IndicatorValue(ind_handle,index+2,buffer_num);
//--- If at least one of the values could not be obtained, return an undefined value
   if(value0==EMPTY_VALUE || value1==EMPTY_VALUE || value2==EMPTY_VALUE)
      return LINE_STATE_NONE;
//--- Line upward reversal (value2>value1 && value0>value1)
   if(NormalizeDouble(value2-value1,ind_digits)>0 && NormalizeDouble(value0-value1,ind_digits)>0)
      return LINE_STATE_TURN_UP;
//--- Line upward direction (value2<=value1 && value0>value1)
   else if(NormalizeDouble(value2-value1,ind_digits)<=0 && NormalizeDouble(value0-value1,ind_digits)>0)
      return LINE_STATE_UP;
//--- Line upward stop (value2<=value1 && value0==value1)
   else if(NormalizeDouble(value2-value1,ind_digits)<=0 && NormalizeDouble(value0-value1,ind_digits)==0)
      return LINE_STATE_STOP_UP;
//--- Line downward reversal (value2<value1 && value0<value1)
   if(NormalizeDouble(value2-value1,ind_digits)<0 && NormalizeDouble(value0-value1,ind_digits)<0)
      return LINE_STATE_TURN_DOWN;
//--- Line downward direction (value2>=value1 && value0<value1)
   else if(NormalizeDouble(value2-value1,ind_digits)>=0 && NormalizeDouble(value0-value1,ind_digits)<0)
      return LINE_STATE_DOWN;
//--- Line downward stop (value2>=value1 && value0==value1)
   else if(NormalizeDouble(value2-value1,ind_digits)>=0 && NormalizeDouble(value0-value1,ind_digits)==0)
      return LINE_STATE_STOP_DOWN;
//--- Undefined state
   return LINE_STATE_NONE;
  }
//+------------------------------------------------------------------+
//| Return the state of the line relative to the specified level     |
//+------------------------------------------------------------------+
ENUM_LINE_STATE LineStateRelative(const int ind_handle,const int index,const int buffer_num,const double level0,const double level1=EMPTY_VALUE)
  {
//--- Get the values of the indicator line with the shift (0,1) relative to the passed index
   const double value0=IndicatorValue(ind_handle,index,  buffer_num);
   const double value1=IndicatorValue(ind_handle,index+1,buffer_num);
//--- If at least one of the values could not be obtained, return an undefined value
   if(value0==EMPTY_VALUE || value1==EMPTY_VALUE)
      return LINE_STATE_NONE;
//--- Define the second level to compare
   double level=(level1==EMPTY_VALUE ? level0 : level1);
//--- The line is below the level (value1<level && value0<level0)
   if(NormalizeDouble(value1-level,ind_digits)<0 && NormalizeDouble(value0-level0,ind_digits)<0)
      return LINE_STATE_UNDER;
//--- The line is above the level (value1>level && value0>level0)
   if(NormalizeDouble(value1-level,ind_digits)>0 && NormalizeDouble(value0-level0,ind_digits)>0)
      return LINE_STATE_ABOVE;
//--- The line crossed the level upwards (value1<=level && value0>level0)
   if(NormalizeDouble(value1-level,ind_digits)<=0 && NormalizeDouble(value0-level0,ind_digits)>0)
      return LINE_STATE_CROSS_UP;
//--- The line crossed the level downwards (value1>=level && value0<level0)
   if(NormalizeDouble(value1-level,ind_digits)>=0 && NormalizeDouble(value0-level0,ind_digits)<0)
      return LINE_STATE_CROSS_DOWN;
//--- The line touched the level from below (value1<level0 && value0==level0)
   if(NormalizeDouble(value1-level,ind_digits)<0 && NormalizeDouble(value0-level0,ind_digits)==0)
      return LINE_STATE_TOUCH_BELOW;
//--- The line touched the level from above (value1>level0 && value0==level0)
   if(NormalizeDouble(value1-level,ind_digits)>0 && NormalizeDouble(value0-level0,ind_digits)==0)
      return LINE_STATE_TOUCH_BELOW;
//--- Line is equal to the level value (value1==level0 && value0==level0)
   if(NormalizeDouble(value1-level,ind_digits)==0 && NormalizeDouble(value0-level0,ind_digits)==0)
      return LINE_STATE_EQUALS;
//--- Undefined state
   return LINE_STATE_NONE;
  }
//+------------------------------------------------------------------+
//| Return the indicator line state description                      |
//+------------------------------------------------------------------+
string LineStateDescription(const ENUM_LINE_STATE state)
  {
   switch(state)
     {
      case LINE_STATE_UP         :  return "Up";
      case LINE_STATE_STOP_UP    :  return "Stop Up";
      case LINE_STATE_TURN_UP    :  return "Turn Up";
      case LINE_STATE_DOWN       :  return "Down";
      case LINE_STATE_STOP_DOWN  :  return "Stop Down";
      case LINE_STATE_TURN_DOWN  :  return "Turn Down";
      case LINE_STATE_ABOVE      :  return "Above level";
      case LINE_STATE_UNDER      :  return "Under level";
      case LINE_STATE_CROSS_UP   :  return "Crossing Up";
      case LINE_STATE_CROSS_DOWN :  return "Crossing Down";
      case LINE_STATE_TOUCH_BELOW:  return "Touch from Below";
      case LINE_STATE_TOUCH_ABOVE:  return "Touch from Above";
      case LINE_STATE_EQUALS     :  return "Equals";
      default                    :  return "Unknown";
     }
  }
Wenn wir das Dashboard verwenden, werden die Daten mit Hilfe der Funktion auf dem Bedienfeld angezeigt:
//+------------------------------------------------------------------+
//| Display data from the specified timeseries index to the panel    |
//+------------------------------------------------------------------+
void DrawData(const int index,const datetime time)
  {
//--- Declare the variables to receive data in them
   MqlTick  tick={0};
   MqlRates rates[1];

//--- Exit if unable to get the current prices
   if(!SymbolInfoTick(Symbol(),tick))
      return;
//--- Exit if unable to get the bar data by the specified index
   if(CopyRates(Symbol(),PERIOD_CURRENT,index,1,rates)!=1)
      return;

//--- Set font parameters for bar and indicator data headers
   int  size=0;
   uint flags=0;
   uint angle=0;
   string name=panel.FontParams(size,flags,angle);
   panel.SetFontParams(name,9,FW_BOLD);
   panel.DrawText("Bar data ["+(string)index+"]",3,panel.TableY1(0)-16,clrMaroon,panel.Width()-6);
   panel.DrawText("Indicator data ["+(string)index+"]",3,panel.TableY1(1)-16,clrGreen,panel.Width()-6);
//--- Set font parameters for bar and indicator data
   panel.SetFontParams(name,9);

//--- Display the data of the specified bar in table 0 on the panel
   panel.DrawText("Date",  panel.CellX(0,0,0)+2, panel.CellY(0,0,0)+2); panel.DrawText(TimeToString(  rates[0].time,TIME_DATE),     panel.CellX(0,0,1)+2, panel.CellY(0,0,1)+2,clrNONE,90);
   panel.DrawText("Time",  panel.CellX(0,1,0)+2, panel.CellY(0,1,0)+2); panel.DrawText(TimeToString(  rates[0].time,TIME_MINUTES),  panel.CellX(0,1,1)+2, panel.CellY(0,1,1)+2,clrNONE,90);
   panel.DrawText("Open",  panel.CellX(0,2,0)+2, panel.CellY(0,2,0)+2); panel.DrawText(DoubleToString(rates[0].open,Digits()),      panel.CellX(0,2,1)+2, panel.CellY(0,2,1)+2,clrNONE,90);
   panel.DrawText("High",  panel.CellX(0,3,0)+2, panel.CellY(0,3,0)+2); panel.DrawText(DoubleToString(rates[0].high,Digits()),      panel.CellX(0,3,1)+2, panel.CellY(0,3,1)+2,clrNONE,90);
   panel.DrawText("Low",   panel.CellX(0,4,0)+2, panel.CellY(0,4,0)+2); panel.DrawText(DoubleToString(rates[0].low,Digits()),       panel.CellX(0,4,1)+2, panel.CellY(0,4,1)+2,clrNONE,90);
   panel.DrawText("Close", panel.CellX(0,5,0)+2, panel.CellY(0,5,0)+2); panel.DrawText(DoubleToString(rates[0].close,Digits()),     panel.CellX(0,5,1)+2, panel.CellY(0,5,1)+2,clrNONE,90);

//--- Display the indicator data from the specified bar on the panel in table 1
   panel.DrawText(ind_title, panel.CellX(1,0,0)+2, panel.CellY(1,0,0)+2);
   double value=IndicatorValue(handle,index,0);
   string value_str=(value!=EMPTY_VALUE ? DoubleToString(value,ind_digits) : "");
   panel.DrawText(value_str,panel.CellX(1,0,1)+2,panel.CellY(1,0,1)+2,clrNONE,90);

//--- Display a description of the indicator line state
   panel.DrawText("Line state", panel.CellX(1,1,0)+2, panel.CellY(1,1,0)+2);
   ENUM_LINE_STATE state=LineState(handle,index,0);
//--- The label color changes depending on the value of the line above/below zero
   color clr=(value<0 ? clrRed : value>0 ? clrBlue : clrNONE);
   panel.DrawText(LineStateDescription(state),panel.CellX(1,1,1)+2,panel.CellY(1,1,1)+2,clr,90);

//--- Redraw the chart to immediately display all changes on the panel
   ChartRedraw(ChartID());
  }
Außerdem wird die Ereignisbehandlung des Panel von OnChartEvent() aufgerufen, und die Ereignisse für den Empfang des Balkenindex unter dem Cursor werden behandelt:
//+------------------------------------------------------------------+
//| ChartEvent function                                              |
//+------------------------------------------------------------------+
void OnChartEvent(const int id,
                  const long &lparam,
                  const double &dparam,
                  const string &sparam)
  {
//--- Handling the panel
//--- Call the panel event handler
   panel.OnChartEvent(id,lparam,dparam,sparam);

//--- If the cursor moves or a click is made on the chart
   if(id==CHARTEVENT_MOUSE_MOVE || id==CHARTEVENT_CLICK)
     {
      //--- Declare the variables to record time and price coordinates in them
      datetime time=0;
      double price=0;
      int wnd=0;
      //--- If the cursor coordinates are converted to date and time
      if(ChartXYToTimePrice(ChartID(),(int)lparam,(int)dparam,wnd,time,price))
        {
         //--- write the bar index where the cursor is located to a global variable
         mouse_bar_index=iBarShift(Symbol(),PERIOD_CURRENT,time);
         //--- Display the bar data under the cursor on the panel
         DrawData(mouse_bar_index,time);
        }
     }

//--- If we received a custom event, display the appropriate message in the journal
   if(id>CHARTEVENT_CUSTOM)
     {
      //--- Here we can implement handling a click on the close button on the panel
      PrintFormat("%s: Event id=%ld, object id (lparam): %lu, event message (sparam): %s",__FUNCTION__,id,lparam,sparam);
     }
  }
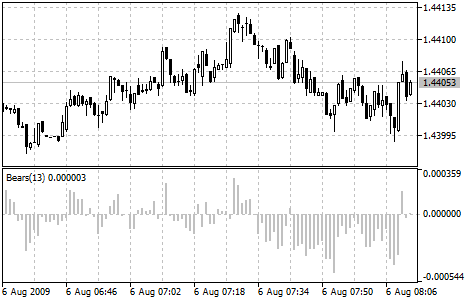
Nachdem wir den EA kompiliert und auf dem Chart gestartet haben, können wir den Status der Indikatorlinie auf dem Panel überwachen:
Die EA-Datei „TestOscillatorBulls.mq5“ ist unten angehängt.
Chaikin Oscillator
Der Chaikin Oszillator (CHO) ist die Differenz der gleitenden Durchschnitte von Accumulation/Distribution.
„Das Konzept dieses Oszillators basiert auf den folgenden drei Thesen. Erstens: Wenn eine Aktie oder ein Index höher schließt, als es im Laufe des Tages stand (mit dem Durchschnitt [max+min]/2) bedeutet dies, dass es ein Tag mit Accumulation (Zunahme) war. Je näher der Schlusskurs am Maximum ist, desto stärker war die Zunahme. Umgekehrt, wenn der Schlusskurs niedriger als das Durchschnittslevel des Tages ist, bedeutet dies, das es eine Distribution gab. Je näher der Schlusskurs am Minimum ist, desto stärker war die Distribution.
Zweitens: Stabiles Preis-Wachstum wird begleitet von steigenden Handelsvolumen und einer starken Zunahme des Volumens. Das Volumen ist wie ein Brennstoff, der den Markt steigen lässt. Lässt das Volumen nach, zeigt dies, das das Wachstum nicht weiter gehen kann, weil der Brennstoff ausgeht.
Umgekehrt, bei einem Abfall des Preises, gibt es normalerweise geringe Volumen und endet in Panik-Verkäufen von institutionellen Investoren. Zuerst sehen wir einen Anstieg des Volumen, dann einen Abfall des Preises inkl. reduziertem Volumen und schlussendlich, wenn der Markt nahe am Tiefpunkt ist, kommt es wieder zu einer Zunahme.
Drittens: Mit Chaikins Oszillator können wir das Volumen des Geldes zurückverfolgen. Die Dynamiken des Volumens und des Preises erlauben das Finden von Hochs und Tiefs des Marktes, sowohl kurz- als auch mittelfristig.
Da es keine fehlerfreien Methoden der technischen Analyse gibt, empfiehlt es sich, diesen Oszillator in Verbindung mit anderen technischen Indikatoren zu verwenden. Die Zuverlässigkeit der kurz- und mittelfristigen Handelssignale wird höher sein, wenn wir z. B. Envelopes auf der Grundlage des gleitenden 21-Tage-Durchschnitts und eines beliebigen überkauften/überverkauften Oszillators zusammen mit dem Chaikin-Oszillator verwenden.
Das stärkste Signal tritt auf, wenn die Preise ein Maximum oder Minimum Level erreichen (insbesondere im überkauften oder überverkauften Bereich), aber Chaikin's Oscillator kann vorherige Extrempunkte nicht überschreiten und dreht um.
- Signale die in die Richtung des Mittelfristigen Trends zeigen, sind stärker als Signale, die in die andere Richtung zeigen.
- Der Fakt alleine, dass ein Oszillator ein Hoch- oder Tiefpunkt bildet, bedeutet nicht, dass der Preis auch die entsprechende Richtung einschlagen wird. Dieses Ereignis wird als unbedeutend angesehen.
Einen anderen Weg der Nutzung ist die Beobachtung einer Richtungsänderung als Signal für Kauf oder Verkauf, jedoch nur, wenn es mit einer Richtungsänderung des Preises einhergeht. Wenn bspw. eine Aktie über das 90-Tage Moving Average steigt und der Oszillator im negativen Bereich eine Richtungsänderung nach oben vollzieht, kann dies als Kaufsignal betrachtet werden.
Umgekehrt gilt das gleiche für Verkaufssignale. Der Preis muss sich unter dem 90 Tage Moving Average befinden und der Oszillator eine Richtungsänderung nach unten vornimmt im positiven Bereich.“
Parameter
Die Anzeige hat vier konfigurierte Parameter:
- Verwendete Volumes, Standard — Tickvolumen,
- Schnelle MA-Berechnungslänge, Standard — 3,
- Langsame MA-Berechnungslänge, Standard — 10,
- Berechnungsmethode, Standard — EMA.
Eingabe- und globale Variablen für die Verwendung des Indikators im EA:
//+------------------------------------------------------------------+
//|                                            TestOscillatorCHO.mq5 |
//|                                  Copyright 2023, MetaQuotes Ltd. |
//|                                             https://www.mql5.com |
//+------------------------------------------------------------------+
#property copyright "Copyright 2023, MetaQuotes Ltd."
#property link      "https://www.mql5.com"
#property version   "1.00"
//--- enums
enum ENUM_LINE_STATE
  {
   LINE_STATE_NONE,        // Undefined state
   LINE_STATE_UP,          // Upward
   LINE_STATE_DOWN,        // Downward
   LINE_STATE_TURN_UP,     // Upward reversal
   LINE_STATE_TURN_DOWN,   // Downward reversal
   LINE_STATE_STOP_UP,     // Upward stop
   LINE_STATE_STOP_DOWN,   // Downward stop
   LINE_STATE_ABOVE,       // Above value
   LINE_STATE_UNDER,       // Below value
   LINE_STATE_CROSS_UP,    // Crossing value upwards
   LINE_STATE_CROSS_DOWN,  // Crossing value downwards
   LINE_STATE_TOUCH_BELOW, // Touching value from below
   LINE_STATE_TOUCH_ABOVE, // Touch value from above
   LINE_STATE_EQUALS,      // Equal to value
  };
//--- input parameters
input uint                 InpPeriodFast  =  3;             /* CHO Fast MA Period   */
input uint                 InpPeriodSlow  =  10;            /* CHO Slow MA Period   */
input ENUM_MA_METHOD       InpMethod      =  MODE_EMA;      /* Method */
input ENUM_APPLIED_VOLUME  InpAppliedVol  =  VOLUME_TICK;   /* Applied Volume       */
//--- global variables
int      handle=INVALID_HANDLE;  // Indicator handle
int      period_fast=0;          // Fast moving average calculation period
int      period_slow=0;          // Slow moving average calculation period
int      ind_digits=0;           // Number of decimal places in the indicator values
string   ind_title;              // Indicator description
Bei der Verwendung des Dashboards wird die Klassendatei des Panels eingebunden und die Variablen für die Arbeit mit dem Panel werden hinzugefügt:
//+------------------------------------------------------------------+
//|                                            TestOscillatorCHO.mq5 |
//|                                  Copyright 2023, MetaQuotes Ltd. |
//|                                             https://www.mql5.com |
//+------------------------------------------------------------------+
#property copyright "Copyright 2023, MetaQuotes Ltd."
#property link      "https://www.mql5.com"
#property version   "1.00"
//--- includes
#include <Dashboard\Dashboard.mqh>
//--- enums
enum ENUM_LINE_STATE
  {
   LINE_STATE_NONE,        // Undefined state
   LINE_STATE_UP,          // Upward
   LINE_STATE_DOWN,        // Downward
   LINE_STATE_TURN_UP,     // Upward reversal
   LINE_STATE_TURN_DOWN,   // Downward reversal
   LINE_STATE_STOP_UP,     // Upward stop
   LINE_STATE_STOP_DOWN,   // Downward stop
   LINE_STATE_ABOVE,       // Above value
   LINE_STATE_UNDER,       // Below value
   LINE_STATE_CROSS_UP,    // Crossing value upwards
   LINE_STATE_CROSS_DOWN,  // Crossing value downwards
   LINE_STATE_TOUCH_BELOW, // Touching value from below
   LINE_STATE_TOUCH_ABOVE, // Touch value from above
   LINE_STATE_EQUALS,      // Equal to value
  };
//--- input parameters
input uint                 InpPeriodFast  =  3;             /* CHO Fast MA Period   */
input uint                 InpPeriodSlow  =  10;            /* CHO Slow MA Period   */
input ENUM_MA_METHOD       InpMethod      =  MODE_EMA;      /* Method */
input ENUM_APPLIED_VOLUME  InpAppliedVol  =  VOLUME_TICK;   /* Applied Volume       */
//--- global variables
int      handle=INVALID_HANDLE;  // Indicator handle
int      period_fast=0;          // Fast moving average calculation period
int      period_slow=0;          // Slow moving average calculation period
int      ind_digits=0;           // Number of decimal places in the indicator values
string   ind_title;              // Indicator description
//--- variables for the panel
int      mouse_bar_index;        // Index of the bar the data is taken from
CDashboard *panel=NULL;          // Pointer to the panel object
Initialisierung
OnInit() für die Initialisierung der Indikatorparameter und die Erstellung seines Handles:
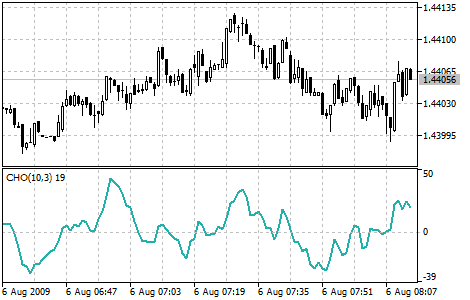
//+------------------------------------------------------------------+
//| Expert initialization function                                   |
//+------------------------------------------------------------------+
int OnInit()
  {
//--- create timer
   EventSetTimer(60);

//--- Indicator
//--- Set and adjust the calculation period if necessary
   period_fast=int(InpPeriodFast<1 ? 3  : InpPeriodFast);
   period_slow=int(InpPeriodSlow<1 ? 10 : InpPeriodSlow);
//--- Set the indicator name and the number of decimal places
   ind_title=StringFormat("CHO(%lu,%lu)",period_slow,period_fast);
   ind_digits=0;
//--- Create indicator handle
   ResetLastError();
   handle=iChaikin(Symbol(),PERIOD_CURRENT,period_fast,period_slow,InpMethod,InpAppliedVol);
   if(handle==INVALID_HANDLE)
     {
      PrintFormat("%s: Failed to create indicator handle %s. Error %ld",__FUNCTION__,ind_title,GetLastError());
      return INIT_FAILED;
     }

//--- Successful initialization
   return(INIT_SUCCEEDED);
  }
Das Panel wird bei Verwendung des Dashboards erstellt:
//+------------------------------------------------------------------+
//| Expert initialization function                                   |
//+------------------------------------------------------------------+
int OnInit()
  {
//--- create timer
   EventSetTimer(60);

//--- Indicator
//--- Set and adjust the calculation period if necessary
   period_fast=int(InpPeriodFast<1 ? 3  : InpPeriodFast);
   period_slow=int(InpPeriodSlow<1 ? 10 : InpPeriodSlow);
//--- Set the indicator name and the number of decimal places
   ind_title=StringFormat("CHO(%lu,%lu)",period_slow,period_fast);
   ind_digits=0;
//--- Create indicator handle
   ResetLastError();
   handle=iChaikin(Symbol(),PERIOD_CURRENT,period_fast,period_slow,InpMethod,InpAppliedVol);
   if(handle==INVALID_HANDLE)
     {
      PrintFormat("%s: Failed to create indicator handle %s. Error %ld",__FUNCTION__,ind_title,GetLastError());
      return INIT_FAILED;
     }

//--- Dashboard
//--- Create the panel
   panel=new CDashboard(1,20,20,199,225);
   if(panel==NULL)
     {
      Print("Error. Failed to create panel object");
      return INIT_FAILED;
     }
//--- Set font parameters
   panel.SetFontParams("Calibri",9);
//--- Display the panel with the "Symbol, Timeframe description" header text
   panel.View(Symbol()+", "+StringSubstr(EnumToString(Period()),7));
//--- Create a table with ID 0 to display bar data in it
   panel.CreateNewTable(0);
//--- Draw a table with ID 0 on the panel background
   panel.DrawGrid(0,2,20,6,2,18,97);

//--- Create a table with ID 1 to display indicator data in it
   panel.CreateNewTable(1);
//--- Get the Y2 table coordinate with ID 0 and
//--- set the Y1 coordinate for the table with ID 1
   int y1=panel.TableY2(0)+22;
//--- Draw a table with ID 1 on the panel background
   panel.DrawGrid(1,2,y1,3,2,18,97);

//--- Display tabular data in the journal
   panel.GridPrint(0,2);
   panel.GridPrint(1,2);
//--- Initialize the variable with the index of the mouse cursor bar
   mouse_bar_index=0;
//--- Display the data of the current bar on the panel
   DrawData(mouse_bar_index,TimeCurrent());

//--- Successful initialization
   return(INIT_SUCCEEDED);
  }
Deinitialisierung
In OnDeinit() geben wir das Handle im EA wieder frei:
//+------------------------------------------------------------------+
//| Expert deinitialization function                                 |
//+------------------------------------------------------------------+
void OnDeinit(const int reason)
  {
//--- destroy timer
   EventKillTimer();

//--- Release handle of the indicator
   ResetLastError();
   if(!IndicatorRelease(handle))
      PrintFormat("%s: IndicatorRelease failed. Error %ld",__FUNCTION__,GetLastError());
//--- Clear all comments on the chart
   Comment("");
  }
Das erstellte Dashboard-Objekt wird bei der Verwendung des Dashboards entfernt:
//+------------------------------------------------------------------+
//| Expert deinitialization function                                 |
//+------------------------------------------------------------------+
void OnDeinit(const int reason)
  {
//--- destroy timer
   EventKillTimer();

//--- Release handle of the indicator
   ResetLastError();
   if(!IndicatorRelease(handle))
      PrintFormat("%s: IndicatorRelease failed. Error %ld",__FUNCTION__,GetLastError());
//--- Clear all comments on the chart
   Comment("");

//--- If the panel object exists, delete it
   if(panel!=NULL)
      delete panel;
  }
Abrufen von Daten
Allgemeine Funktionen zum Abrufen von Daten über das Indikatorhandle:
//+------------------------------------------------------------------+
//| Return the indicator data on the specified bar                   |
//+------------------------------------------------------------------+
double IndicatorValue(const int ind_handle,const int index,const int buffer_num)
  {
   double array[1]={0};
   ResetLastError();
   if(CopyBuffer(ind_handle,buffer_num,index,1,array)!=1)
     {
      PrintFormat("%s: CopyBuffer failed. Error %ld",__FUNCTION__,GetLastError());
      return EMPTY_VALUE;
     }
   return array[0];
  }
//+------------------------------------------------------------------+
//| Return the state of the indicator line                           |
//+------------------------------------------------------------------+
ENUM_LINE_STATE LineState(const int ind_handle,const int index,const int buffer_num)
  {
//--- Get the values of the indicator line with the shift (0,1,2) relative to the passed index
   const double value0=IndicatorValue(ind_handle,index,  buffer_num);
   const double value1=IndicatorValue(ind_handle,index+1,buffer_num);
   const double value2=IndicatorValue(ind_handle,index+2,buffer_num);
//--- If at least one of the values could not be obtained, return an undefined value
   if(value0==EMPTY_VALUE || value1==EMPTY_VALUE || value2==EMPTY_VALUE)
      return LINE_STATE_NONE;
//--- Line upward reversal (value2>value1 && value0>value1)
   if(NormalizeDouble(value2-value1,ind_digits)>0 && NormalizeDouble(value0-value1,ind_digits)>0)
      return LINE_STATE_TURN_UP;
//--- Line upward direction (value2<=value1 && value0>value1)
   else if(NormalizeDouble(value2-value1,ind_digits)<=0 && NormalizeDouble(value0-value1,ind_digits)>0)
      return LINE_STATE_UP;
//--- Line upward stop (value2<=value1 && value0==value1)
   else if(NormalizeDouble(value2-value1,ind_digits)<=0 && NormalizeDouble(value0-value1,ind_digits)==0)
      return LINE_STATE_STOP_UP;
//--- Line downward reversal (value2<value1 && value0<value1)
   if(NormalizeDouble(value2-value1,ind_digits)<0 && NormalizeDouble(value0-value1,ind_digits)<0)
      return LINE_STATE_TURN_DOWN;
//--- Line downward direction (value2>=value1 && value0<value1)
   else if(NormalizeDouble(value2-value1,ind_digits)>=0 && NormalizeDouble(value0-value1,ind_digits)<0)
      return LINE_STATE_DOWN;
//--- Line downward stop (value2>=value1 && value0==value1)
   else if(NormalizeDouble(value2-value1,ind_digits)>=0 && NormalizeDouble(value0-value1,ind_digits)==0)
      return LINE_STATE_STOP_DOWN;
//--- Undefined state
   return LINE_STATE_NONE;
  }
//+------------------------------------------------------------------+
//| Return the state of the line relative to the specified level     |
//+------------------------------------------------------------------+
ENUM_LINE_STATE LineStateRelative(const int ind_handle,const int index,const int buffer_num,const double level0,const double level1=EMPTY_VALUE)
  {
//--- Get the values of the indicator line with the shift (0,1) relative to the passed index
   const double value0=IndicatorValue(ind_handle,index,  buffer_num);
   const double value1=IndicatorValue(ind_handle,index+1,buffer_num);
//--- If at least one of the values could not be obtained, return an undefined value
   if(value0==EMPTY_VALUE || value1==EMPTY_VALUE)
      return LINE_STATE_NONE;
//--- Define the second level to compare
   double level=(level1==EMPTY_VALUE ? level0 : level1);
//--- The line is below the level (value1<level && value0<level0)
   if(NormalizeDouble(value1-level,ind_digits)<0 && NormalizeDouble(value0-level0,ind_digits)<0)
      return LINE_STATE_UNDER;
//--- The line is above the level (value1>level && value0>level0)
   if(NormalizeDouble(value1-level,ind_digits)>0 && NormalizeDouble(value0-level0,ind_digits)>0)
      return LINE_STATE_ABOVE;
//--- The line crossed the level upwards (value1<=level && value0>level0)
   if(NormalizeDouble(value1-level,ind_digits)<=0 && NormalizeDouble(value0-level0,ind_digits)>0)
      return LINE_STATE_CROSS_UP;
//--- The line crossed the level downwards (value1>=level && value0<level0)
   if(NormalizeDouble(value1-level,ind_digits)>=0 && NormalizeDouble(value0-level0,ind_digits)<0)
      return LINE_STATE_CROSS_DOWN;
//--- The line touched the level from below (value1<level0 && value0==level0)
   if(NormalizeDouble(value1-level,ind_digits)<0 && NormalizeDouble(value0-level0,ind_digits)==0)
      return LINE_STATE_TOUCH_BELOW;
//--- The line touched the level from above (value1>level0 && value0==level0)
   if(NormalizeDouble(value1-level,ind_digits)>0 && NormalizeDouble(value0-level0,ind_digits)==0)
      return LINE_STATE_TOUCH_BELOW;
//--- Line is equal to the level value (value1==level0 && value0==level0)
   if(NormalizeDouble(value1-level,ind_digits)==0 && NormalizeDouble(value0-level0,ind_digits)==0)
      return LINE_STATE_EQUALS;
//--- Undefined state
   return LINE_STATE_NONE;
  }
//+------------------------------------------------------------------+
//| Return the indicator line state description                      |
//+------------------------------------------------------------------+
string LineStateDescription(const ENUM_LINE_STATE state)
  {
   switch(state)
     {
      case LINE_STATE_UP         :  return "Up";
      case LINE_STATE_STOP_UP    :  return "Stop Up";
      case LINE_STATE_TURN_UP    :  return "Turn Up";
      case LINE_STATE_DOWN       :  return "Down";
      case LINE_STATE_STOP_DOWN  :  return "Stop Down";
      case LINE_STATE_TURN_DOWN  :  return "Turn Down";
      case LINE_STATE_ABOVE      :  return "Above level";
      case LINE_STATE_UNDER      :  return "Under level";
      case LINE_STATE_CROSS_UP   :  return "Crossing Up";
      case LINE_STATE_CROSS_DOWN :  return "Crossing Down";
      case LINE_STATE_TOUCH_BELOW:  return "Touch from Below";
      case LINE_STATE_TOUCH_ABOVE:  return "Touch from Above";
      case LINE_STATE_EQUALS     :  return "Equals";
      default                    :  return "Unknown";
     }
  }
Wenn wir das Dashboard verwenden, werden die Daten mit Hilfe der Funktion auf dem Bedienfeld angezeigt:
//+------------------------------------------------------------------+
//| Display data from the specified timeseries index to the panel    |
//+------------------------------------------------------------------+
void DrawData(const int index,const datetime time)
  {
//--- Declare the variables to receive data in them
   MqlTick  tick={0};
   MqlRates rates[1];

//--- Exit if unable to get the current prices
   if(!SymbolInfoTick(Symbol(),tick))
      return;
//--- Exit if unable to get the bar data by the specified index
   if(CopyRates(Symbol(),PERIOD_CURRENT,index,1,rates)!=1)
      return;

//--- Set font parameters for bar and indicator data headers
   int  size=0;
   uint flags=0;
   uint angle=0;
   string name=panel.FontParams(size,flags,angle);
   panel.SetFontParams(name,9,FW_BOLD);
   panel.DrawText("Bar data ["+(string)index+"]",3,panel.TableY1(0)-16,clrMaroon,panel.Width()-6);
   panel.DrawText("Indicator data ["+(string)index+"]",3,panel.TableY1(1)-16,clrGreen,panel.Width()-6);
//--- Set font parameters for bar and indicator data
   panel.SetFontParams(name,9);

//--- Display the data of the specified bar in table 0 on the panel
   panel.DrawText("Date",  panel.CellX(0,0,0)+2, panel.CellY(0,0,0)+2); panel.DrawText(TimeToString(  rates[0].time,TIME_DATE),     panel.CellX(0,0,1)+2, panel.CellY(0,0,1)+2,clrNONE,90);
   panel.DrawText("Time",  panel.CellX(0,1,0)+2, panel.CellY(0,1,0)+2); panel.DrawText(TimeToString(  rates[0].time,TIME_MINUTES),  panel.CellX(0,1,1)+2, panel.CellY(0,1,1)+2,clrNONE,90);
   panel.DrawText("Open",  panel.CellX(0,2,0)+2, panel.CellY(0,2,0)+2); panel.DrawText(DoubleToString(rates[0].open,Digits()),      panel.CellX(0,2,1)+2, panel.CellY(0,2,1)+2,clrNONE,90);
   panel.DrawText("High",  panel.CellX(0,3,0)+2, panel.CellY(0,3,0)+2); panel.DrawText(DoubleToString(rates[0].high,Digits()),      panel.CellX(0,3,1)+2, panel.CellY(0,3,1)+2,clrNONE,90);
   panel.DrawText("Low",   panel.CellX(0,4,0)+2, panel.CellY(0,4,0)+2); panel.DrawText(DoubleToString(rates[0].low,Digits()),       panel.CellX(0,4,1)+2, panel.CellY(0,4,1)+2,clrNONE,90);
   panel.DrawText("Close", panel.CellX(0,5,0)+2, panel.CellY(0,5,0)+2); panel.DrawText(DoubleToString(rates[0].close,Digits()),     panel.CellX(0,5,1)+2, panel.CellY(0,5,1)+2,clrNONE,90);

//--- Display the indicator data from the specified bar on the panel in table 1
   panel.DrawText(ind_title, panel.CellX(1,0,0)+2, panel.CellY(1,0,0)+2);
   double value=IndicatorValue(handle,index,0);
   string value_str=(value!=EMPTY_VALUE ? DoubleToString(value,ind_digits) : "");
   panel.DrawText(value_str,panel.CellX(1,0,1)+2,panel.CellY(1,0,1)+2,clrNONE,90);

//--- Display a description of the indicator line state
   panel.DrawText("Line state", panel.CellX(1,1,0)+2, panel.CellY(1,1,0)+2);
   ENUM_LINE_STATE state=LineState(handle,index,0);
   color clr=(value<0 ? clrRed : value>0 ? clrBlue : clrNONE); // The label color changes depending on the value of the line above/below zero
   panel.DrawText(LineStateDescription(state),panel.CellX(1,1,1)+2,panel.CellY(1,1,1)+2,clr,90);

//--- Redraw the chart to immediately display all changes on the panel
   ChartRedraw(ChartID());
  }
Indikatorwerte über/unter Null werden auf dem Armaturenbrett farblich markiert.
Außerdem wird die Ereignisbehandlung des Panel von OnChartEvent() aufgerufen, und die Ereignisse für den Empfang des Balkenindex unter dem Cursor werden behandelt:
//+------------------------------------------------------------------+
//| ChartEvent function                                              |
//+------------------------------------------------------------------+
void OnChartEvent(const int id,
                  const long &lparam,
                  const double &dparam,
                  const string &sparam)
  {
//--- Handling the panel
//--- Call the panel event handler
   panel.OnChartEvent(id,lparam,dparam,sparam);

//--- If the cursor moves or a click is made on the chart
   if(id==CHARTEVENT_MOUSE_MOVE || id==CHARTEVENT_CLICK)
     {
      //--- Declare the variables to record time and price coordinates in them
      datetime time=0;
      double price=0;
      int wnd=0;
      //--- If the cursor coordinates are converted to date and time
      if(ChartXYToTimePrice(ChartID(),(int)lparam,(int)dparam,wnd,time,price))
        {
         //--- write the bar index where the cursor is located to a global variable
         mouse_bar_index=iBarShift(Symbol(),PERIOD_CURRENT,time);
         //--- Display the bar data under the cursor on the panel
         DrawData(mouse_bar_index,time);
        }
     }

//--- If we received a custom event, display the appropriate message in the journal
   if(id>CHARTEVENT_CUSTOM)
     {
      //--- Here we can implement handling a click on the close button on the panel
      PrintFormat("%s: Event id=%ld, object id (lparam): %lu, event message (sparam): %s",__FUNCTION__,id,lparam,sparam);
     }
  }
Nachdem wir den EA kompiliert und auf dem Chart gestartet haben, können wir den Status der Indikatorlinie auf dem Panel überwachen:
Die EA-Datei „TestOscillatorCHO.mq5“ ist unten angehängt.
Commodity Channel Index
Der Commodity Channel Index (CCI) misst die Abweichung des Rohstoffpreises von seinem statistischen Durchschnittspreis. Hohe Werte dieses Indikators weisen auf einen ungewöhnlich hohen Preis hin, verglichen mit dem Durchschnitt und andersherum. Trotz des Namens, kann der Commodity Channel Index kann der Indikator auf jedes Instrument angewandt werden, nicht nur auf Rohstoffe oder Commodities.
Es gibt zwei Techniken den Commodity Channel Index zu nutzen:
- Finden von Abweichungen
Die Divergenz tritt auf, wenn der Preis ein neues Maximum erreicht und der Commodity Channel Index nicht über die vorherigen Maxima steigt. Diese klassische Divergenz wird von einer klassischen Preis-Korrektur begleitet. - Als Indikator für Überkauft/Überverkauft
Der Commodity Channel Index schwankt in der Regel in einem Bereich von ±100. Werte über +100 zeigen einen überkauften Markt an (mit erhöhter Wahrscheinlichkeit einer Korrektur) und Werte darunter einen überverkauften Markt.
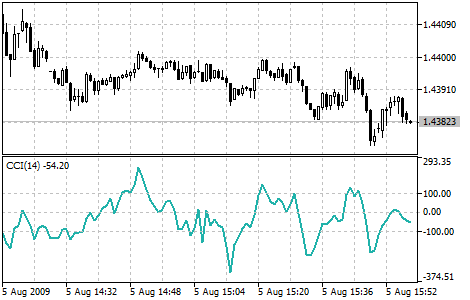
Parameter
Der Indikator hat zwei Parameter:
- Berechnungslänge, Standard — 14
- Berechnungspreis, Standard — Typischer Preis (HLC/3)
Zusätzlich zu den Standard-Indikator-Eingaben können überkaufte und überverkaufte Niveaus verwendet werden, um nach seinen Signalen zu suchen. Sie müssen auch in den EA-Eingaben angegeben werden.
Eingabe- und globale Variablen für die Verwendung des Indikators im EA:
//+------------------------------------------------------------------+
//|                                            TestOscillatorCCI.mq5 |
//|                                  Copyright 2023, MetaQuotes Ltd. |
//|                                             https://www.mql5.com |
//+------------------------------------------------------------------+
#property copyright "Copyright 2023, MetaQuotes Ltd."
#property link      "https://www.mql5.com"
#property version   "1.00"
//--- enums
enum ENUM_LINE_STATE
  {
   LINE_STATE_NONE,        // Undefined state
   LINE_STATE_UP,          // Upward
   LINE_STATE_DOWN,        // Downward
   LINE_STATE_TURN_UP,     // Upward reversal
   LINE_STATE_TURN_DOWN,   // Downward reversal
   LINE_STATE_STOP_UP,     // Upward stop
   LINE_STATE_STOP_DOWN,   // Downward stop
   LINE_STATE_ABOVE,       // Above value
   LINE_STATE_UNDER,       // Below value
   LINE_STATE_CROSS_UP,    // Crossing value upwards
   LINE_STATE_CROSS_DOWN,  // Crossing value downwards
   LINE_STATE_TOUCH_BELOW, // Touching value from below
   LINE_STATE_TOUCH_ABOVE, // Touch value from above
   LINE_STATE_EQUALS,      // Equal to value
  };
//--- input parameters
input uint                 InpPeriod   =  14;            /* CCI Period     */
input ENUM_APPLIED_PRICE   InpPrice    =  PRICE_TYPICAL; /* Applied Price  */
input double               InpOverbough=  100.0;         /* Overbough level*/
input double               InpOversold = -100.0;         /* Oversold level */
//--- global variables
int      handle=INVALID_HANDLE;  // Indicator handle
int      period=0;               // CCI calculation period
int      ind_digits=0;           // Number of decimal places in the indicator values
double   overbough=0;            // Overbought level
double   oversold=0;             // Oversold level
string   ind_title;              // Indicator description
Bei der Verwendung des Dashboards wird die Klassendatei des Panels eingebunden und die Variablen für die Arbeit mit dem Panel werden hinzugefügt:
//+------------------------------------------------------------------+
//|                                            TestOscillatorCCI.mq5 |
//|                                  Copyright 2023, MetaQuotes Ltd. |
//|                                             https://www.mql5.com |
//+------------------------------------------------------------------+
#property copyright "Copyright 2023, MetaQuotes Ltd."
#property link      "https://www.mql5.com"
#property version   "1.00"
//--- includes
#include <Dashboard\Dashboard.mqh>
//--- enums
enum ENUM_LINE_STATE
  {
   LINE_STATE_NONE,        // Undefined state
   LINE_STATE_UP,          // Upward
   LINE_STATE_DOWN,        // Downward
   LINE_STATE_TURN_UP,     // Upward reversal
   LINE_STATE_TURN_DOWN,   // Downward reversal
   LINE_STATE_STOP_UP,     // Upward stop
   LINE_STATE_STOP_DOWN,   // Downward stop
   LINE_STATE_ABOVE,       // Above value
   LINE_STATE_UNDER,       // Below value
   LINE_STATE_CROSS_UP,    // Crossing value upwards
   LINE_STATE_CROSS_DOWN,  // Crossing value downwards
   LINE_STATE_TOUCH_BELOW, // Touching value from below
   LINE_STATE_TOUCH_ABOVE, // Touch value from above
   LINE_STATE_EQUALS,      // Equal to value
  };
//--- input parameters
input uint                 InpPeriod   =  14;            /* CCI Period     */
input ENUM_APPLIED_PRICE   InpPrice    =  PRICE_TYPICAL; /* Applied Price  */
input double               InpOverbough=  100.0;         /* Overbough level*/
input double               InpOversold = -100.0;         /* Oversold level */
//--- global variables
int      handle=INVALID_HANDLE;  // Indicator handle
int      period=0;               // CCI calculation period
int      ind_digits=0;           // Number of decimal places in the indicator values
double   overbough=0;            // Overbought level
double   oversold=0;             // Oversold level
string   ind_title;              // Indicator description
//--- variables for the panel
int      mouse_bar_index;        // Index of the bar the data is taken from
CDashboard *panel=NULL;          // Pointer to the panel object
Initialisierung
OnInit() für die Initialisierung der Indikatorparameter und die Erstellung seines Handles:
//+------------------------------------------------------------------+
//| Expert initialization function                                   |
//+------------------------------------------------------------------+
int OnInit()
  {
//--- create timer
   EventSetTimer(60);

//--- Indicator
//--- Set and adjust the calculation period and levels if necessary
   period=int(InpPeriod<1 ? 14  : InpPeriod<2 ? 2 : InpPeriod);
   overbough=InpOverbough;
   oversold=(InpOversold>=overbough ? overbough-0.01 : InpOversold);
//--- Set the indicator name and the number of decimal places
   ind_title=StringFormat("CCI(%lu)",period);
   ind_digits=2;
//--- Create indicator handle
   ResetLastError();
   handle=iCCI(Symbol(),PERIOD_CURRENT,period,InpPrice);
   if(handle==INVALID_HANDLE)
     {
      PrintFormat("%s: Failed to create indicator handle %s. Error %ld",__FUNCTION__,ind_title,GetLastError());
      return INIT_FAILED;
     }

//--- Successful initialization
   return(INIT_SUCCEEDED);
  }
Das Panel wird bei Verwendung des Dashboards erstellt:
//+------------------------------------------------------------------+
//| Expert initialization function                                   |
//+------------------------------------------------------------------+
int OnInit()
  {
//--- create timer
   EventSetTimer(60);

//--- Indicator
//--- Set and adjust the calculation period and levels if necessary
   period=int(InpPeriod<1 ? 14  : InpPeriod<2 ? 2 : InpPeriod);
   overbough=InpOverbough;
   oversold=(InpOversold>=overbough ? overbough-0.01 : InpOversold);
//--- Set the indicator name and the number of decimal places
   ind_title=StringFormat("CCI(%lu)",period);
   ind_digits=2;
//--- Create indicator handle
   ResetLastError();
   handle=iCCI(Symbol(),PERIOD_CURRENT,period,InpPrice);
   if(handle==INVALID_HANDLE)
     {
      PrintFormat("%s: Failed to create indicator handle %s. Error %ld",__FUNCTION__,ind_title,GetLastError());
      return INIT_FAILED;
     }

//--- Dashboard
//--- Create the panel
   panel=new CDashboard(1,20,20,229,243);
   if(panel==NULL)
     {
      Print("Error. Failed to create panel object");
      return INIT_FAILED;
     }
//--- Set font parameters
   panel.SetFontParams("Calibri",9);
//--- Display the panel with the "Symbol, Timeframe description" header text
   panel.View(Symbol()+", "+StringSubstr(EnumToString(Period()),7));
//--- Create a table with ID 0 to display bar data in it
   panel.CreateNewTable(0);
//--- Draw a table with ID 0 on the panel background
   panel.DrawGrid(0,2,20,6,2,18,112);

//--- Create a table with ID 1 to display indicator data in it
   panel.CreateNewTable(1);
//--- Get the Y2 table coordinate with ID 0 and
//--- set the Y1 coordinate for the table with ID 1
   int y1=panel.TableY2(0)+22;
//--- Draw a table with ID 1 on the panel background
   panel.DrawGrid(1,2,y1,4,2,18,112);

//--- Display tabular data in the journal
   panel.GridPrint(0,2);
   panel.GridPrint(1,2);
//--- Initialize the variable with the index of the mouse cursor bar
   mouse_bar_index=0;
//--- Display the data of the current bar on the panel
   DrawData(mouse_bar_index,TimeCurrent());

//--- Successful initialization
   return(INIT_SUCCEEDED);
  }
Deinitialisierung
In OnDeinit() geben wir das Handle im EA wieder frei:
//+------------------------------------------------------------------+
//| Expert deinitialization function                                 |
//+------------------------------------------------------------------+
void OnDeinit(const int reason)
  {
//--- destroy timer
   EventKillTimer();

//--- Release handle of the indicator
   ResetLastError();
   if(!IndicatorRelease(handle))
      PrintFormat("%s: IndicatorRelease failed. Error %ld",__FUNCTION__,GetLastError());
//--- Clear all comments on the chart
   Comment("");
  }
Das erstellte Dashboard-Objekt wird bei der Verwendung des Dashboards entfernt:
//+------------------------------------------------------------------+
//| Expert deinitialization function                                 |
//+------------------------------------------------------------------+
void OnDeinit(const int reason)
  {
//--- destroy timer
   EventKillTimer();

//--- Release handle of the indicator
   ResetLastError();
   if(!IndicatorRelease(handle))
      PrintFormat("%s: IndicatorRelease failed. Error %ld",__FUNCTION__,GetLastError());
//--- Clear all comments on the chart
   Comment("");

//--- If the panel object exists, delete it
   if(panel!=NULL)
      delete panel;
  }
Abrufen von Daten
Allgemeine Funktionen zum Abrufen von Daten über das Indikatorhandle:
//+------------------------------------------------------------------+
//| Return the indicator data on the specified bar                   |
//+------------------------------------------------------------------+
double IndicatorValue(const int ind_handle,const int index,const int buffer_num)
  {
   double array[1]={0};
   ResetLastError();
   if(CopyBuffer(ind_handle,buffer_num,index,1,array)!=1)
     {
      PrintFormat("%s: CopyBuffer failed. Error %ld",__FUNCTION__,GetLastError());
      return EMPTY_VALUE;
     }
   return array[0];
  }
//+------------------------------------------------------------------+
//| Return the state of the indicator line                           |
//+------------------------------------------------------------------+
ENUM_LINE_STATE LineState(const int ind_handle,const int index,const int buffer_num)
  {
//--- Get the values of the indicator line with the shift (0,1,2) relative to the passed index
   const double value0=IndicatorValue(ind_handle,index,  buffer_num);
   const double value1=IndicatorValue(ind_handle,index+1,buffer_num);
   const double value2=IndicatorValue(ind_handle,index+2,buffer_num);
//--- If at least one of the values could not be obtained, return an undefined value
   if(value0==EMPTY_VALUE || value1==EMPTY_VALUE || value2==EMPTY_VALUE)
      return LINE_STATE_NONE;
//--- Line upward reversal (value2>value1 && value0>value1)
   if(NormalizeDouble(value2-value1,ind_digits)>0 && NormalizeDouble(value0-value1,ind_digits)>0)
      return LINE_STATE_TURN_UP;
//--- Line upward direction (value2<=value1 && value0>value1)
   else if(NormalizeDouble(value2-value1,ind_digits)<=0 && NormalizeDouble(value0-value1,ind_digits)>0)
      return LINE_STATE_UP;
//--- Line upward stop (value2<=value1 && value0==value1)
   else if(NormalizeDouble(value2-value1,ind_digits)<=0 && NormalizeDouble(value0-value1,ind_digits)==0)
      return LINE_STATE_STOP_UP;
//--- Line downward reversal (value2<value1 && value0<value1)
   if(NormalizeDouble(value2-value1,ind_digits)<0 && NormalizeDouble(value0-value1,ind_digits)<0)
      return LINE_STATE_TURN_DOWN;
//--- Line downward direction (value2>=value1 && value0<value1)
   else if(NormalizeDouble(value2-value1,ind_digits)>=0 && NormalizeDouble(value0-value1,ind_digits)<0)
      return LINE_STATE_DOWN;
//--- Line downward stop (value2>=value1 && value0==value1)
   else if(NormalizeDouble(value2-value1,ind_digits)>=0 && NormalizeDouble(value0-value1,ind_digits)==0)
      return LINE_STATE_STOP_DOWN;
//--- Undefined state
   return LINE_STATE_NONE;
  }
//+------------------------------------------------------------------+
//| Return the state of the line relative to the specified level     |
//+------------------------------------------------------------------+
ENUM_LINE_STATE LineStateRelative(const int ind_handle,const int index,const int buffer_num,const double level0,const double level1=EMPTY_VALUE)
  {
//--- Get the values of the indicator line with the shift (0,1) relative to the passed index
   const double value0=IndicatorValue(ind_handle,index,  buffer_num);
   const double value1=IndicatorValue(ind_handle,index+1,buffer_num);
//--- If at least one of the values could not be obtained, return an undefined value
   if(value0==EMPTY_VALUE || value1==EMPTY_VALUE)
      return LINE_STATE_NONE;
//--- Define the second level to compare
   double level=(level1==EMPTY_VALUE ? level0 : level1);
//--- The line is below the level (value1<level && value0<level0)
   if(NormalizeDouble(value1-level,ind_digits)<0 && NormalizeDouble(value0-level0,ind_digits)<0)
      return LINE_STATE_UNDER;
//--- The line is above the level (value1>level && value0>level0)
   if(NormalizeDouble(value1-level,ind_digits)>0 && NormalizeDouble(value0-level0,ind_digits)>0)
      return LINE_STATE_ABOVE;
//--- The line crossed the level upwards (value1<=level && value0>level0)
   if(NormalizeDouble(value1-level,ind_digits)<=0 && NormalizeDouble(value0-level0,ind_digits)>0)
      return LINE_STATE_CROSS_UP;
//--- The line crossed the level downwards (value1>=level && value0<level0)
   if(NormalizeDouble(value1-level,ind_digits)>=0 && NormalizeDouble(value0-level0,ind_digits)<0)
      return LINE_STATE_CROSS_DOWN;
//--- The line touched the level from below (value1<level0 && value0==level0)
   if(NormalizeDouble(value1-level,ind_digits)<0 && NormalizeDouble(value0-level0,ind_digits)==0)
      return LINE_STATE_TOUCH_BELOW;
//--- The line touched the level from above (value1>level0 && value0==level0)
   if(NormalizeDouble(value1-level,ind_digits)>0 && NormalizeDouble(value0-level0,ind_digits)==0)
      return LINE_STATE_TOUCH_BELOW;
//--- Line is equal to the level value (value1==level0 && value0==level0)
   if(NormalizeDouble(value1-level,ind_digits)==0 && NormalizeDouble(value0-level0,ind_digits)==0)
      return LINE_STATE_EQUALS;
//--- Undefined state
   return LINE_STATE_NONE;
  }
//+------------------------------------------------------------------+
//| Return the indicator line state description                      |
//+------------------------------------------------------------------+
string LineStateDescription(const ENUM_LINE_STATE state)
  {
   switch(state)
     {
      case LINE_STATE_UP         :  return "Up";
      case LINE_STATE_STOP_UP    :  return "Stop Up";
      case LINE_STATE_TURN_UP    :  return "Turn Up";
      case LINE_STATE_DOWN       :  return "Down";
      case LINE_STATE_STOP_DOWN  :  return "Stop Down";
      case LINE_STATE_TURN_DOWN  :  return "Turn Down";
      case LINE_STATE_ABOVE      :  return "Above level";
      case LINE_STATE_UNDER      :  return "Under level";
      case LINE_STATE_CROSS_UP   :  return "Crossing Up";
      case LINE_STATE_CROSS_DOWN :  return "Crossing Down";
      case LINE_STATE_TOUCH_BELOW:  return "Touch from Below";
      case LINE_STATE_TOUCH_ABOVE:  return "Touch from Above";
      case LINE_STATE_EQUALS     :  return "Equals";
      default                    :  return "Unknown";
     }
  }
Wenn wir das Dashboard verwenden, werden die Daten mit Hilfe der Funktion auf dem Bedienfeld angezeigt:
//+------------------------------------------------------------------+
//| Display data from the specified timeseries index to the panel    |
//+------------------------------------------------------------------+
void DrawData(const int index,const datetime time)
  {
//--- Declare the variables to receive data in them
   MqlTick  tick={0};
   MqlRates rates[1];

//--- Exit if unable to get the current prices
   if(!SymbolInfoTick(Symbol(),tick))
      return;
//--- Exit if unable to get the bar data by the specified index
   if(CopyRates(Symbol(),PERIOD_CURRENT,index,1,rates)!=1)
      return;

//--- Set font parameters for bar and indicator data headers
   int  size=0;
   uint flags=0;
   uint angle=0;
   string name=panel.FontParams(size,flags,angle);
   panel.SetFontParams(name,9,FW_BOLD);
   panel.DrawText("Bar data ["+(string)index+"]",3,panel.TableY1(0)-16,clrMaroon,panel.Width()-6);
   panel.DrawText("Indicator data ["+(string)index+"]",3,panel.TableY1(1)-16,clrGreen,panel.Width()-6);
//--- Set font parameters for bar and indicator data
   panel.SetFontParams(name,9);

//--- Display the data of the specified bar in table 0 on the panel
   panel.DrawText("Date",  panel.CellX(0,0,0)+2, panel.CellY(0,0,0)+2); panel.DrawText(TimeToString(  rates[0].time,TIME_DATE),     panel.CellX(0,0,1)+2, panel.CellY(0,0,1)+2,clrNONE,90);
   panel.DrawText("Time",  panel.CellX(0,1,0)+2, panel.CellY(0,1,0)+2); panel.DrawText(TimeToString(  rates[0].time,TIME_MINUTES),  panel.CellX(0,1,1)+2, panel.CellY(0,1,1)+2,clrNONE,90);
   panel.DrawText("Open",  panel.CellX(0,2,0)+2, panel.CellY(0,2,0)+2); panel.DrawText(DoubleToString(rates[0].open,Digits()),      panel.CellX(0,2,1)+2, panel.CellY(0,2,1)+2,clrNONE,90);
   panel.DrawText("High",  panel.CellX(0,3,0)+2, panel.CellY(0,3,0)+2); panel.DrawText(DoubleToString(rates[0].high,Digits()),      panel.CellX(0,3,1)+2, panel.CellY(0,3,1)+2,clrNONE,90);
   panel.DrawText("Low",   panel.CellX(0,4,0)+2, panel.CellY(0,4,0)+2); panel.DrawText(DoubleToString(rates[0].low,Digits()),       panel.CellX(0,4,1)+2, panel.CellY(0,4,1)+2,clrNONE,90);
   panel.DrawText("Close", panel.CellX(0,5,0)+2, panel.CellY(0,5,0)+2); panel.DrawText(DoubleToString(rates[0].close,Digits()),     panel.CellX(0,5,1)+2, panel.CellY(0,5,1)+2,clrNONE,90);

//--- Display the indicator data from the specified bar on the panel in table 1
   panel.DrawText(ind_title, panel.CellX(1,0,0)+2, panel.CellY(1,0,0)+2);
   double value=IndicatorValue(handle,index,0);
   string value_str=(value!=EMPTY_VALUE ? DoubleToString(value,ind_digits) : "");
   panel.DrawText(value_str,panel.CellX(1,0,1)+2,panel.CellY(1,0,1)+2,clrNONE,90);

//--- Display a description of the indicator line state relative to the overbought level
   string ovb=StringFormat("%+.2f",overbough);
   panel.DrawText("Overbough", panel.CellX(1,2,0)+2, panel.CellY(1,2,0)+2);
   panel.DrawText(ovb, panel.CellX(1,2,0)+66, panel.CellY(1,2,0)+2);
   ENUM_LINE_STATE state_ovb=LineStateRelative(handle,index,0,overbough);
//--- The label color changes depending on the value of the line relative to the level
   color clr=(state_ovb==LINE_STATE_ABOVE || state_ovb==LINE_STATE_CROSS_DOWN ? clrRed : clrNONE);
   string ovb_str=(state_ovb==LINE_STATE_ABOVE ? "Inside the area" : LineStateDescription(state_ovb));
   panel.DrawText(ovb_str,panel.CellX(1,2,1)+2,panel.CellY(1,2,1)+2,clr,90);

//--- Display a description of the indicator line state relative to the oversold level
   panel.DrawText("Oversold", panel.CellX(1,3,0)+2, panel.CellY(1,3,0)+2);
   string ovs=StringFormat("%+.2f",oversold);
   panel.DrawText(ovs, panel.CellX(1,3,0)+68, panel.CellY(1,3,0)+2);
   ENUM_LINE_STATE state_ovs=LineStateRelative(handle,index,0,oversold);
//--- The label color changes depending on the value of the line relative to the level
   clr=(state_ovs==LINE_STATE_UNDER || state_ovs==LINE_STATE_CROSS_UP ? clrBlue : clrNONE);
   string ovs_str=(state_ovs==LINE_STATE_UNDER ? "Inside the area" : LineStateDescription(state_ovs));
   panel.DrawText(ovs_str,panel.CellX(1,3,1)+2,panel.CellY(1,3,1)+2,clr,90);

//--- Display a description of the indicator line state
   panel.DrawText("Line state", panel.CellX(1,1,0)+2, panel.CellY(1,1,0)+2);
   ENUM_LINE_STATE state=LineState(handle,index,0);
//--- The label color changes depending on the location of the line in the overbought/oversold areas
   clr=(state_ovb==LINE_STATE_ABOVE || state_ovb==LINE_STATE_CROSS_DOWN ? clrRed : state_ovs==LINE_STATE_UNDER || state_ovs==LINE_STATE_CROSS_UP ? clrBlue : clrNONE);
   panel.DrawText(LineStateDescription(state),panel.CellX(1,1,1)+2,panel.CellY(1,1,1)+2,clr,90);

//--- Redraw the chart to immediately display all changes on the panel
   ChartRedraw(ChartID());
  }
Die Lage der Indikatorlinie in überkauften und überverkauften Bereichen sowie die Signale in diesen Bereichen sind auf dem Panel farblich gekennzeichnet.
Außerdem wird die Ereignisbehandlung des Panel von OnChartEvent() aufgerufen, und die Ereignisse für den Empfang des Balkenindex unter dem Cursor werden behandelt:
//+------------------------------------------------------------------+
//| ChartEvent function                                              |
//+------------------------------------------------------------------+
void OnChartEvent(const int id,
                  const long &lparam,
                  const double &dparam,
                  const string &sparam)
  {
//--- Handling the panel
//--- Call the panel event handler
   panel.OnChartEvent(id,lparam,dparam,sparam);

//--- If the cursor moves or a click is made on the chart
   if(id==CHARTEVENT_MOUSE_MOVE || id==CHARTEVENT_CLICK)
     {
      //--- Declare the variables to record time and price coordinates in them
      datetime time=0;
      double price=0;
      int wnd=0;
      //--- If the cursor coordinates are converted to date and time
      if(ChartXYToTimePrice(ChartID(),(int)lparam,(int)dparam,wnd,time,price))
        {
         //--- write the bar index where the cursor is located to a global variable
         mouse_bar_index=iBarShift(Symbol(),PERIOD_CURRENT,time);
         //--- Display the bar data under the cursor on the panel
         DrawData(mouse_bar_index,time);
        }
     }

//--- If we received a custom event, display the appropriate message in the journal
   if(id>CHARTEVENT_CUSTOM)
     {
      //--- Here we can implement handling a click on the close button on the panel
      PrintFormat("%s: Event id=%ld, object id (lparam): %lu, event message (sparam): %s",__FUNCTION__,id,lparam,sparam);
     }
  }
Nachdem wir den EA kompiliert und auf dem Chart gestartet haben, können wir den Status der Indikatorlinie auf dem Panel überwachen:
Die EA-Datei „TestOscillatorCCI.mq5“ ist unten angehängt.
DeMarker
Der Technischer Indikator DeMarker (DeM) basiert auf dem Vergleich des Maximums der aktuellen Periode mit dem Maximum der vorherigen Periode. Wenn das aktuelle Maximum höher ist, wird die Differenz der beiden Maximalwerte registriert. Wenn das aktuelle Maximum kleiner oder gleich dem vorherigen ist, wird der Null-Wert registriert. Die Unterschiede für N-Perioden werden anschließend summiert. Der erhaltene Wert wird als Zähler des DeMarker genutzt und wird durch den gleichen Wert plus die Summe der Unterschiede der Minimalwerte geteilt. Wenn das aktuelle Minimum größer oder gleich dem vorherigen ist, wird Null verwendet.
Wenn der Indikator unter 30 fällt, wird eine bullische Preisumkehr erwartet. Wenn der Indikator über 70 steigt, wird eine bärische Preisumkehr erwartet.
Wenn eine größere Periodenlänge genutzt wird, kann der Indikator langfristige Trend-Tendenzen erkennen. Indikatorenwerte auf Basis kurzer Perioden geben Einstiegspunkte für kurzfristige Markttendenzen und erlauben den Einstieg in die Richtung des Haupttrends mit verringertem Risiko.
Parameter
Der Indikator hat einen konfigurierbaren Parameter — den Berechnungszeitraum. Der Standardwert ist 14.
Da die überkauften/überverkauften Bereiche für die Suche nach Indikatorsignalen verwendet werden, müssen sie ebenfalls in die Eingabeparameter des EA aufgenommen werden.
Eingabe- und globale Variablen für die Verwendung des Indikators im EA:
//+------------------------------------------------------------------+
//|                                            TestOscillatorDeM.mq5 |
//|                                  Copyright 2023, MetaQuotes Ltd. |
//|                                             https://www.mql5.com |
//+------------------------------------------------------------------+
#property copyright "Copyright 2023, MetaQuotes Ltd."
#property link      "https://www.mql5.com"
#property version   "1.00"
//--- enums
enum ENUM_LINE_STATE
  {
   LINE_STATE_NONE,        // Undefined state
   LINE_STATE_UP,          // Upward
   LINE_STATE_DOWN,        // Downward
   LINE_STATE_TURN_UP,     // Upward reversal
   LINE_STATE_TURN_DOWN,   // Downward reversal
   LINE_STATE_STOP_UP,     // Upward stop
   LINE_STATE_STOP_DOWN,   // Downward stop
   LINE_STATE_ABOVE,       // Above value
   LINE_STATE_UNDER,       // Below value
   LINE_STATE_CROSS_UP,    // Crossing value upwards
   LINE_STATE_CROSS_DOWN,  // Crossing value downwards
   LINE_STATE_TOUCH_BELOW, // Touching value from below
   LINE_STATE_TOUCH_ABOVE, // Touch value from above
   LINE_STATE_EQUALS,      // Equal to value
  };
//--- input parameters
input uint                 InpPeriod   =  14;   /* Period         */
input double               InpOverbough=  0.7;  /* Overbough level*/
input double               InpOversold =  0.3;  /* Oversold level */
//--- global variables
int      handle=INVALID_HANDLE;  // Indicator handle
int      period=0;               // DeMarker calculation period
int      ind_digits=0;           // Number of decimal places in the indicator values
double   overbough=0;            // Overbought level
double   oversold=0;             // Oversold level
string   ind_title;              // Indicator description
Bei der Verwendung des Dashboards wird die Klassendatei des Panels eingebunden und die Variablen für die Arbeit mit dem Panel werden hinzugefügt:
//+------------------------------------------------------------------+
//|                                            TestOscillatorDeM.mq5 |
//|                                  Copyright 2023, MetaQuotes Ltd. |
//|                                             https://www.mql5.com |
//+------------------------------------------------------------------+
#property copyright "Copyright 2023, MetaQuotes Ltd."
#property link      "https://www.mql5.com"
#property version   "1.00"
//--- includes
#include <Dashboard\Dashboard.mqh>
//--- enums
enum ENUM_LINE_STATE
  {
   LINE_STATE_NONE,        // Undefined state
   LINE_STATE_UP,          // Upward
   LINE_STATE_DOWN,        // Downward
   LINE_STATE_TURN_UP,     // Upward reversal
   LINE_STATE_TURN_DOWN,   // Downward reversal
   LINE_STATE_STOP_UP,     // Upward stop
   LINE_STATE_STOP_DOWN,   // Downward stop
   LINE_STATE_ABOVE,       // Above value
   LINE_STATE_UNDER,       // Below value
   LINE_STATE_CROSS_UP,    // Crossing value upwards
   LINE_STATE_CROSS_DOWN,  // Crossing value downwards
   LINE_STATE_TOUCH_BELOW, // Touching value from below
   LINE_STATE_TOUCH_ABOVE, // Touch value from above
   LINE_STATE_EQUALS,      // Equal to value
  };
//--- input parameters
input uint                 InpPeriod   =  14;   /* Period         */
input double               InpOverbough=  0.7;  /* Overbough level*/
input double               InpOversold =  0.3;  /* Oversold level */
//--- global variables
int      handle=INVALID_HANDLE;  // Indicator handle
int      period=0;               // DeMarker calculation period
int      ind_digits=0;           // Number of decimal places in the indicator values
double   overbough=0;            // Overbought level
double   oversold=0;             // Oversold level
string   ind_title;              // Indicator description
//--- variables for the panel
int      mouse_bar_index;        // Index of the bar the data is taken from
CDashboard *panel=NULL;          // Pointer to the panel object
Initialisierung
OnInit() für die Initialisierung der Indikatorparameter und die Erstellung seines Handles:
//+------------------------------------------------------------------+
//| Expert initialization function                                   |
//+------------------------------------------------------------------+
int OnInit()
  {
//--- create timer
   EventSetTimer(60);

//--- Indicator
//--- Set and adjust the calculation period and levels if necessary
   period=int(InpPeriod<1 ? 14  : InpPeriod);
   overbough=InpOverbough;
   oversold=(InpOversold>=overbough ? overbough-0.01 : InpOversold);
//--- Set the indicator name and the number of decimal places
   ind_title=StringFormat("DeM(%lu)",period);
   ind_digits=3;
//--- Create indicator handle
   ResetLastError();
   handle=iDeMarker(Symbol(),PERIOD_CURRENT,period);
   if(handle==INVALID_HANDLE)
     {
      PrintFormat("%s: Failed to create indicator handle %s. Error %ld",__FUNCTION__,ind_title,GetLastError());
      return INIT_FAILED;
     }

//--- Successful initialization
   return(INIT_SUCCEEDED);
  }
Das Panel wird bei Verwendung des Dashboards erstellt:
//+------------------------------------------------------------------+
//| Expert initialization function                                   |
//+------------------------------------------------------------------+
int OnInit()
  {
//--- create timer
   EventSetTimer(60);

//--- Indicator
//--- Set and adjust the calculation period and levels if necessary
   period=int(InpPeriod<1 ? 14  : InpPeriod);
   overbough=InpOverbough;
   oversold=(InpOversold>=overbough ? overbough-0.01 : InpOversold);
//--- Set the indicator name and the number of decimal places
   ind_title=StringFormat("DeM(%lu)",period);
   ind_digits=3;
//--- Create indicator handle
   ResetLastError();
   handle=iDeMarker(Symbol(),PERIOD_CURRENT,period);
   if(handle==INVALID_HANDLE)
     {
      PrintFormat("%s: Failed to create indicator handle %s. Error %ld",__FUNCTION__,ind_title,GetLastError());
      return INIT_FAILED;
     }

//--- Dashboard
//--- Create the panel
   panel=new CDashboard(1,20,20,229,243);
   if(panel==NULL)
     {
      Print("Error. Failed to create panel object");
      return INIT_FAILED;
     }
//--- Set font parameters
   panel.SetFontParams("Calibri",9);
//--- Display the panel with the "Symbol, Timeframe description" header text
   panel.View(Symbol()+", "+StringSubstr(EnumToString(Period()),7));
//--- Create a table with ID 0 to display bar data in it
   panel.CreateNewTable(0);
//--- Draw a table with ID 0 on the panel background
   panel.DrawGrid(0,2,20,6,2,18,112);

//--- Create a table with ID 1 to display indicator data in it
   panel.CreateNewTable(1);
//--- Get the Y2 table coordinate with ID 0 and
//--- set the Y1 coordinate for the table with ID 1
   int y1=panel.TableY2(0)+22;
//--- Draw a table with ID 1 on the panel background
   panel.DrawGrid(1,2,y1,4,2,18,112);

//--- Display tabular data in the journal
   panel.GridPrint(0,2);
   panel.GridPrint(1,2);
//--- Initialize the variable with the index of the mouse cursor bar
   mouse_bar_index=0;
//--- Display the data of the current bar on the panel
   DrawData(mouse_bar_index,TimeCurrent());

//--- Successful initialization
   return(INIT_SUCCEEDED);
  }
Deinitialisierung
In OnDeinit() geben wir das Handle im EA wieder frei:
//+------------------------------------------------------------------+
//| Expert deinitialization function                                 |
//+------------------------------------------------------------------+
void OnDeinit(const int reason)
  {
//--- destroy timer
   EventKillTimer();

//--- Release handle of the indicator
   ResetLastError();
   if(!IndicatorRelease(handle))
      PrintFormat("%s: IndicatorRelease failed. Error %ld",__FUNCTION__,GetLastError());
//--- Clear all comments on the chart
   Comment("");
  }
Das erstellte Dashboard-Objekt wird bei der Verwendung des Dashboards entfernt:
//+------------------------------------------------------------------+
//| Expert deinitialization function                                 |
//+------------------------------------------------------------------+
void OnDeinit(const int reason)
  {
//--- destroy timer
   EventKillTimer();

//--- Release handle of the indicator
   ResetLastError();
   if(!IndicatorRelease(handle))
      PrintFormat("%s: IndicatorRelease failed. Error %ld",__FUNCTION__,GetLastError());
//--- Clear all comments on the chart
   Comment("");

//--- If the panel object exists, delete it
   if(panel!=NULL)
      delete panel;
  }
Abrufen von Daten
Allgemeine Funktionen zum Abrufen von Daten über das Indikatorhandle:
//+------------------------------------------------------------------+
//| Return the indicator data on the specified bar                   |
//+------------------------------------------------------------------+
double IndicatorValue(const int ind_handle,const int index,const int buffer_num)
  {
   double array[1]={0};
   ResetLastError();
   if(CopyBuffer(ind_handle,buffer_num,index,1,array)!=1)
     {
      PrintFormat("%s: CopyBuffer failed. Error %ld",__FUNCTION__,GetLastError());
      return EMPTY_VALUE;
     }
   return array[0];
  }
//+------------------------------------------------------------------+
//| Return the state of the indicator line                           |
//+------------------------------------------------------------------+
ENUM_LINE_STATE LineState(const int ind_handle,const int index,const int buffer_num)
  {
//--- Get the values of the indicator line with the shift (0,1,2) relative to the passed index
   const double value0=IndicatorValue(ind_handle,index,  buffer_num);
   const double value1=IndicatorValue(ind_handle,index+1,buffer_num);
   const double value2=IndicatorValue(ind_handle,index+2,buffer_num);
//--- If at least one of the values could not be obtained, return an undefined value
   if(value0==EMPTY_VALUE || value1==EMPTY_VALUE || value2==EMPTY_VALUE)
      return LINE_STATE_NONE;
//--- Line upward reversal (value2>value1 && value0>value1)
   if(NormalizeDouble(value2-value1,ind_digits)>0 && NormalizeDouble(value0-value1,ind_digits)>0)
      return LINE_STATE_TURN_UP;
//--- Line upward direction (value2<=value1 && value0>value1)
   else if(NormalizeDouble(value2-value1,ind_digits)<=0 && NormalizeDouble(value0-value1,ind_digits)>0)
      return LINE_STATE_UP;
//--- Line upward stop (value2<=value1 && value0==value1)
   else if(NormalizeDouble(value2-value1,ind_digits)<=0 && NormalizeDouble(value0-value1,ind_digits)==0)
      return LINE_STATE_STOP_UP;
//--- Line downward reversal (value2<value1 && value0<value1)
   if(NormalizeDouble(value2-value1,ind_digits)<0 && NormalizeDouble(value0-value1,ind_digits)<0)
      return LINE_STATE_TURN_DOWN;
//--- Line downward direction (value2>=value1 && value0<value1)
   else if(NormalizeDouble(value2-value1,ind_digits)>=0 && NormalizeDouble(value0-value1,ind_digits)<0)
      return LINE_STATE_DOWN;
//--- Line downward stop (value2>=value1 && value0==value1)
   else if(NormalizeDouble(value2-value1,ind_digits)>=0 && NormalizeDouble(value0-value1,ind_digits)==0)
      return LINE_STATE_STOP_DOWN;
//--- Undefined state
   return LINE_STATE_NONE;
  }
//+------------------------------------------------------------------+
//| Return the state of the line relative to the specified level     |
//+------------------------------------------------------------------+
ENUM_LINE_STATE LineStateRelative(const int ind_handle,const int index,const int buffer_num,const double level0,const double level1=EMPTY_VALUE)
  {
//--- Get the values of the indicator line with the shift (0,1) relative to the passed index
   const double value0=IndicatorValue(ind_handle,index,  buffer_num);
   const double value1=IndicatorValue(ind_handle,index+1,buffer_num);
//--- If at least one of the values could not be obtained, return an undefined value
   if(value0==EMPTY_VALUE || value1==EMPTY_VALUE)
      return LINE_STATE_NONE;
//--- Define the second level to compare
   double level=(level1==EMPTY_VALUE ? level0 : level1);
//--- The line is below the level (value1<level && value0<level0)
   if(NormalizeDouble(value1-level,ind_digits)<0 && NormalizeDouble(value0-level0,ind_digits)<0)
      return LINE_STATE_UNDER;
//--- The line is above the level (value1>level && value0>level0)
   if(NormalizeDouble(value1-level,ind_digits)>0 && NormalizeDouble(value0-level0,ind_digits)>0)
      return LINE_STATE_ABOVE;
//--- The line crossed the level upwards (value1<=level && value0>level0)
   if(NormalizeDouble(value1-level,ind_digits)<=0 && NormalizeDouble(value0-level0,ind_digits)>0)
      return LINE_STATE_CROSS_UP;
//--- The line crossed the level downwards (value1>=level && value0<level0)
   if(NormalizeDouble(value1-level,ind_digits)>=0 && NormalizeDouble(value0-level0,ind_digits)<0)
      return LINE_STATE_CROSS_DOWN;
//--- The line touched the level from below (value1<level0 && value0==level0)
   if(NormalizeDouble(value1-level,ind_digits)<0 && NormalizeDouble(value0-level0,ind_digits)==0)
      return LINE_STATE_TOUCH_BELOW;
//--- The line touched the level from above (value1>level0 && value0==level0)
   if(NormalizeDouble(value1-level,ind_digits)>0 && NormalizeDouble(value0-level0,ind_digits)==0)
      return LINE_STATE_TOUCH_BELOW;
//--- Line is equal to the level value (value1==level0 && value0==level0)
   if(NormalizeDouble(value1-level,ind_digits)==0 && NormalizeDouble(value0-level0,ind_digits)==0)
      return LINE_STATE_EQUALS;
//--- Undefined state
   return LINE_STATE_NONE;
  }
//+------------------------------------------------------------------+
//| Return the indicator line state description                      |
//+------------------------------------------------------------------+
string LineStateDescription(const ENUM_LINE_STATE state)
  {
   switch(state)
     {
      case LINE_STATE_UP         :  return "Up";
      case LINE_STATE_STOP_UP    :  return "Stop Up";
      case LINE_STATE_TURN_UP    :  return "Turn Up";
      case LINE_STATE_DOWN       :  return "Down";
      case LINE_STATE_STOP_DOWN  :  return "Stop Down";
      case LINE_STATE_TURN_DOWN  :  return "Turn Down";
      case LINE_STATE_ABOVE      :  return "Above level";
      case LINE_STATE_UNDER      :  return "Under level";
      case LINE_STATE_CROSS_UP   :  return "Crossing Up";
      case LINE_STATE_CROSS_DOWN :  return "Crossing Down";
      case LINE_STATE_TOUCH_BELOW:  return "Touch from Below";
      case LINE_STATE_TOUCH_ABOVE:  return "Touch from Above";
      case LINE_STATE_EQUALS     :  return "Equals";
      default                    :  return "Unknown";
     }
  }
Wenn wir das Dashboard verwenden, werden die Daten mit Hilfe der Funktion auf dem Bedienfeld angezeigt:
//+------------------------------------------------------------------+
//| Display data from the specified timeseries index to the panel    |
//+------------------------------------------------------------------+
void DrawData(const int index,const datetime time)
  {
//--- Declare the variables to receive data in them
   MqlTick  tick={0};
   MqlRates rates[1];

//--- Exit if unable to get the current prices
   if(!SymbolInfoTick(Symbol(),tick))
      return;
//--- Exit if unable to get the bar data by the specified index
   if(CopyRates(Symbol(),PERIOD_CURRENT,index,1,rates)!=1)
      return;

//--- Set font parameters for bar and indicator data headers
   int  size=0;
   uint flags=0;
   uint angle=0;
   string name=panel.FontParams(size,flags,angle);
   panel.SetFontParams(name,9,FW_BOLD);
   panel.DrawText("Bar data ["+(string)index+"]",3,panel.TableY1(0)-16,clrMaroon,panel.Width()-6);
   panel.DrawText("Indicator data ["+(string)index+"]",3,panel.TableY1(1)-16,clrGreen,panel.Width()-6);
//--- Set font parameters for bar and indicator data
   panel.SetFontParams(name,9);

//--- Display the data of the specified bar in table 0 on the panel
   panel.DrawText("Date",  panel.CellX(0,0,0)+2, panel.CellY(0,0,0)+2); panel.DrawText(TimeToString(  rates[0].time,TIME_DATE),     panel.CellX(0,0,1)+2, panel.CellY(0,0,1)+2,clrNONE,90);
   panel.DrawText("Time",  panel.CellX(0,1,0)+2, panel.CellY(0,1,0)+2); panel.DrawText(TimeToString(  rates[0].time,TIME_MINUTES),  panel.CellX(0,1,1)+2, panel.CellY(0,1,1)+2,clrNONE,90);
   panel.DrawText("Open",  panel.CellX(0,2,0)+2, panel.CellY(0,2,0)+2); panel.DrawText(DoubleToString(rates[0].open,Digits()),      panel.CellX(0,2,1)+2, panel.CellY(0,2,1)+2,clrNONE,90);
   panel.DrawText("High",  panel.CellX(0,3,0)+2, panel.CellY(0,3,0)+2); panel.DrawText(DoubleToString(rates[0].high,Digits()),      panel.CellX(0,3,1)+2, panel.CellY(0,3,1)+2,clrNONE,90);
   panel.DrawText("Low",   panel.CellX(0,4,0)+2, panel.CellY(0,4,0)+2); panel.DrawText(DoubleToString(rates[0].low,Digits()),       panel.CellX(0,4,1)+2, panel.CellY(0,4,1)+2,clrNONE,90);
   panel.DrawText("Close", panel.CellX(0,5,0)+2, panel.CellY(0,5,0)+2); panel.DrawText(DoubleToString(rates[0].close,Digits()),     panel.CellX(0,5,1)+2, panel.CellY(0,5,1)+2,clrNONE,90);

//--- Display the indicator data from the specified bar on the panel in table 1
   panel.DrawText(ind_title, panel.CellX(1,0,0)+2, panel.CellY(1,0,0)+2);
   double value=IndicatorValue(handle,index,0);
   string value_str=(value!=EMPTY_VALUE ? DoubleToString(value,ind_digits) : "");
   panel.DrawText(value_str,panel.CellX(1,0,1)+2,panel.CellY(1,0,1)+2,clrNONE,100);

//--- Display a description of the indicator line state relative to the overbought level
   string ovb=StringFormat("%+.2f",overbough);
   panel.DrawText("Overbough", panel.CellX(1,2,0)+2, panel.CellY(1,2,0)+2);
   panel.DrawText(ovb, panel.CellX(1,2,0)+66, panel.CellY(1,2,0)+2);
   ENUM_LINE_STATE state_ovb=LineStateRelative(handle,index,0,overbough);
//--- The label color changes depending on the value of the line relative to the level
   color clr=(state_ovb==LINE_STATE_ABOVE || state_ovb==LINE_STATE_CROSS_DOWN ? clrRed : clrNONE);
   string ovb_str=(state_ovb==LINE_STATE_ABOVE ? "Inside the area" : LineStateDescription(state_ovb));
   panel.DrawText(ovb_str,panel.CellX(1,2,1)+2,panel.CellY(1,2,1)+2,clr,100);

//--- Display a description of the indicator line state relative to the oversold level
   panel.DrawText("Oversold", panel.CellX(1,3,0)+2, panel.CellY(1,3,0)+2);
   string ovs=StringFormat("%+.2f",oversold);
   panel.DrawText(ovs, panel.CellX(1,3,0)+68, panel.CellY(1,3,0)+2);
   ENUM_LINE_STATE state_ovs=LineStateRelative(handle,index,0,oversold);
//--- The label color changes depending on the value of the line relative to the level
   clr=(state_ovs==LINE_STATE_UNDER || state_ovs==LINE_STATE_CROSS_UP ? clrBlue : clrNONE);
   string ovs_str=(state_ovs==LINE_STATE_UNDER ? "Inside the area" : LineStateDescription(state_ovs));
   panel.DrawText(ovs_str,panel.CellX(1,3,1)+2,panel.CellY(1,3,1)+2,clr,100);

//--- Display a description of the indicator line state
   panel.DrawText("Line state", panel.CellX(1,1,0)+2, panel.CellY(1,1,0)+2);
   ENUM_LINE_STATE state=LineState(handle,index,0);
//--- The label color changes depending on the location of the line in the overbought/oversold areas
   clr=(state_ovb==LINE_STATE_ABOVE || state_ovb==LINE_STATE_CROSS_DOWN ? clrRed : state_ovs==LINE_STATE_UNDER || state_ovs==LINE_STATE_CROSS_UP ? clrBlue : clrNONE);
   panel.DrawText(LineStateDescription(state),panel.CellX(1,1,1)+2,panel.CellY(1,1,1)+2,clr,100);

//--- Redraw the chart to immediately display all changes on the panel
   ChartRedraw(ChartID());
  }
Die Position der Indikatorlinie in überkauften und überverkauften Bereichen wird auf dem Dashboard farblich markiert.
Außerdem wird die Ereignisbehandlung des Panel von OnChartEvent() aufgerufen, und die Ereignisse für den Empfang des Balkenindex unter dem Cursor werden behandelt:
//+------------------------------------------------------------------+
//| ChartEvent function                                              |
//+------------------------------------------------------------------+
void OnChartEvent(const int id,
                  const long &lparam,
                  const double &dparam,
                  const string &sparam)
  {
//--- Handling the panel
//--- Call the panel event handler
   panel.OnChartEvent(id,lparam,dparam,sparam);

//--- If the cursor moves or a click is made on the chart
   if(id==CHARTEVENT_MOUSE_MOVE || id==CHARTEVENT_CLICK)
     {
      //--- Declare the variables to record time and price coordinates in them
      datetime time=0;
      double price=0;
      int wnd=0;
      //--- If the cursor coordinates are converted to date and time
      if(ChartXYToTimePrice(ChartID(),(int)lparam,(int)dparam,wnd,time,price))
        {
         //--- write the bar index where the cursor is located to a global variable
         mouse_bar_index=iBarShift(Symbol(),PERIOD_CURRENT,time);
         //--- Display the bar data under the cursor on the panel
         DrawData(mouse_bar_index,time);
        }
     }

//--- If we received a custom event, display the appropriate message in the journal
   if(id>CHARTEVENT_CUSTOM)
     {
      //--- Here we can implement handling a click on the close button on the panel
      PrintFormat("%s: Event id=%ld, object id (lparam): %lu, event message (sparam): %s",__FUNCTION__,id,lparam,sparam);
     }
  }
Nachdem wir den EA kompiliert und auf dem Chart gestartet haben, können wir den Status der Indikatorlinie auf dem Panel überwachen:
Die EA-Datei „TestOscillatorDeM.mq5“ ist unten angehängt.
Force Index
Der technische Indikator Force Index (FRC) wurde von Alexander Elder entwickelt. Der Index zeigt die Veränderung der Bulls Power bei jeder Anstieg und Bears Power bei jeder Abfall. Es verbindet die standardmäßigen Elemente an Marktinformationen: Preis Trend, Preis Einbrüche und Volumen der Transaktionen. Dieser Index kann so verwendet werden, wie er ist, aber es ist besser, ihn mit Hilfe des Gleitenden Durchschnitts zu approximieren. Eine Annäherung mithilfe eines schnellen Moving Average (der Autor empfiehlt 2 Intervalle) hilft beim Eröffnen und Schließen von Positionen. Mit einem längeren gleitenden Durchschnitt (Periodenlänge 13), zeigt der Indikator Trendwenden an.
- Es ist besser zu Kaufen, wenn der Indikator im negativen Bereich die Richtung nach oben ändert;
- Der Force Index signalisiert die Weiterführung des Trends, wenn er zu einem Hoch aufsteigt;
- Das Signal kommt, wenn der Index positiv wird während eines fallenden Trends;
- Der Force Index signalisiert die Kraft der Verkäufer und die Weiterführung des fallenden Trends;
- Wenn sich der Preis ändert aber nicht mit dem Volumen korreliert, bleibt der Force Indikator auf einem Level, wodurch eine Trendumkehr angekündigt wird.
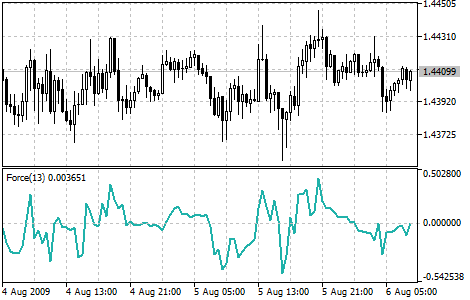
Parameter
Der Indikator hat drei Eingabeparameter:
- Berechnungslänge, Standard — 2,
- Berechnungsmethode, Standard — SMA,
- Verwendete Volumes, standardmäßig — TickVolumen.
Eingabe- und globale Variablen für die Verwendung des Indikators im EA:
//+------------------------------------------------------------------+
//|                                          TestOscillatorForce.mq5 |
//|                                  Copyright 2023, MetaQuotes Ltd. |
//|                                             https://www.mql5.com |
//+------------------------------------------------------------------+
#property copyright "Copyright 2023, MetaQuotes Ltd."
#property link      "https://www.mql5.com"
#property version   "1.00"
//--- enums
enum ENUM_LINE_STATE
  {
   LINE_STATE_NONE,        // Undefined state
   LINE_STATE_UP,          // Upward
   LINE_STATE_DOWN,        // Downward
   LINE_STATE_TURN_UP,     // Upward reversal
   LINE_STATE_TURN_DOWN,   // Downward reversal
   LINE_STATE_STOP_UP,     // Upward stop
   LINE_STATE_STOP_DOWN,   // Downward stop
   LINE_STATE_ABOVE,       // Above value
   LINE_STATE_UNDER,       // Below value
   LINE_STATE_CROSS_UP,    // Crossing value upwards
   LINE_STATE_CROSS_DOWN,  // Crossing value downwards
   LINE_STATE_TOUCH_BELOW, // Touching value from below
   LINE_STATE_TOUCH_ABOVE, // Touch value from above
   LINE_STATE_EQUALS,      // Equal to value
  };
//--- input parameters
input uint                 InpPeriod      =  13;            /* Period         */
input ENUM_MA_METHOD       InpMethod      =  MODE_SMA;      /* Method         */
input ENUM_APPLIED_VOLUME  InpAppliedVol  =  VOLUME_TICK;   /* Applied Volume */
//--- global variables
int      handle=INVALID_HANDLE;  // Indicator handle
int      period=0;               // Force Index calculation period
int      ind_digits=0;           // Number of decimal places in the indicator values
string   ind_title;              // Indicator description
Bei der Verwendung des Dashboards wird die Klassendatei des Panels eingebunden und die Variablen für die Arbeit mit dem Panel werden hinzugefügt:
//+------------------------------------------------------------------+
//|                                          TestOscillatorForce.mq5 |
//|                                  Copyright 2023, MetaQuotes Ltd. |
//|                                             https://www.mql5.com |
//+------------------------------------------------------------------+
#property copyright "Copyright 2023, MetaQuotes Ltd."
#property link      "https://www.mql5.com"
#property version   "1.00"
//--- includes
#include <Dashboard\Dashboard.mqh>
//--- enums
enum ENUM_LINE_STATE
  {
   LINE_STATE_NONE,        // Undefined state
   LINE_STATE_UP,          // Upward
   LINE_STATE_DOWN,        // Downward
   LINE_STATE_TURN_UP,     // Upward reversal
   LINE_STATE_TURN_DOWN,   // Downward reversal
   LINE_STATE_STOP_UP,     // Upward stop
   LINE_STATE_STOP_DOWN,   // Downward stop
   LINE_STATE_ABOVE,       // Above value
   LINE_STATE_UNDER,       // Below value
   LINE_STATE_CROSS_UP,    // Crossing value upwards
   LINE_STATE_CROSS_DOWN,  // Crossing value downwards
   LINE_STATE_TOUCH_BELOW, // Touching value from below
   LINE_STATE_TOUCH_ABOVE, // Touch value from above
   LINE_STATE_EQUALS,      // Equal to value
  };
//--- input parameters
input uint                 InpPeriod      =  13;            /* Period         */
input ENUM_MA_METHOD       InpMethod      =  MODE_SMA;      /* Method         */
input ENUM_APPLIED_VOLUME  InpAppliedVol  =  VOLUME_TICK;   /* Applied Volume */
//--- global variables
int      handle=INVALID_HANDLE;  // Indicator handle
int      period=0;               // Force Index calculation period
int      ind_digits=0;           // Number of decimal places in the indicator values
string   ind_title;              // Indicator description
//--- variables for the panel
int      mouse_bar_index;        // Index of the bar the data is taken from
CDashboard *panel=NULL;          // Pointer to the panel object
Initialisierung
OnInit() für die Initialisierung der Indikatorparameter und die Erstellung seines Handles:
//+------------------------------------------------------------------+
//| Expert initialization function                                   |
//+------------------------------------------------------------------+
int OnInit()
  {
//--- create timer
   EventSetTimer(60);

//--- Indicator
//--- Set and adjust the calculation period if necessary
   period=int(InpPeriod<1 ? 13 : InpPeriod);
//--- Set the indicator name and the number of decimal places
   ind_title=StringFormat("Force(%lu)",period);
   ind_digits=Digits()+1;
//--- Create indicator handle
   ResetLastError();
   handle=iForce(Symbol(),PERIOD_CURRENT,period,InpMethod,InpAppliedVol);
   if(handle==INVALID_HANDLE)
     {
      PrintFormat("%s: Failed to create indicator handle %s. Error %ld",__FUNCTION__,ind_title,GetLastError());
      return INIT_FAILED;
     }

//--- Successful initialization
   return(INIT_SUCCEEDED);
  }
Das Panel wird bei Verwendung des Dashboards erstellt:
//+------------------------------------------------------------------+
//| Expert initialization function                                   |
//+------------------------------------------------------------------+
int OnInit()
  {
//--- create timer
   EventSetTimer(60);

//--- Indicator
//--- Set and adjust the calculation period if necessary
   period=int(InpPeriod<1 ? 13 : InpPeriod);
//--- Set the indicator name and the number of decimal places
   ind_title=StringFormat("Force(%lu)",period);
   ind_digits=Digits()+1;
//--- Create indicator handle
   ResetLastError();
   handle=iForce(Symbol(),PERIOD_CURRENT,period,InpMethod,InpAppliedVol);
   if(handle==INVALID_HANDLE)
     {
      PrintFormat("%s: Failed to create indicator handle %s. Error %ld",__FUNCTION__,ind_title,GetLastError());
      return INIT_FAILED;
     }

//--- Dashboard
//--- Create the panel
   panel=new CDashboard(1,20,20,199,225);
   if(panel==NULL)
     {
      Print("Error. Failed to create panel object");
      return INIT_FAILED;
     }
//--- Set font parameters
   panel.SetFontParams("Calibri",9);
//--- Display the panel with the "Symbol, Timeframe description" header text
   panel.View(Symbol()+", "+StringSubstr(EnumToString(Period()),7));
//--- Create a table with ID 0 to display bar data in it
   panel.CreateNewTable(0);
//--- Draw a table with ID 0 on the panel background
   panel.DrawGrid(0,2,20,6,2,18,97);

//--- Create a table with ID 1 to display indicator data in it
   panel.CreateNewTable(1);
//--- Get the Y2 table coordinate with ID 0 and
//--- set the Y1 coordinate for the table with ID 1
   int y1=panel.TableY2(0)+22;
//--- Draw a table with ID 1 on the panel background
   panel.DrawGrid(1,2,y1,3,2,18,97);

//--- Display tabular data in the journal
   panel.GridPrint(0,2);
   panel.GridPrint(1,2);
//--- Initialize the variable with the index of the mouse cursor bar
   mouse_bar_index=0;
//--- Display the data of the current bar on the panel
   DrawData(mouse_bar_index,TimeCurrent());

//--- Successful initialization
   return(INIT_SUCCEEDED);
  }
Deinitialisierung
In OnDeinit() geben wir das Handle im EA wieder frei:
//+------------------------------------------------------------------+
//| Expert deinitialization function                                 |
//+------------------------------------------------------------------+
void OnDeinit(const int reason)
  {
//--- destroy timer
   EventKillTimer();

//--- Release handle of the indicator
   ResetLastError();
   if(!IndicatorRelease(handle))
      PrintFormat("%s: IndicatorRelease failed. Error %ld",__FUNCTION__,GetLastError());
//--- Clear all comments on the chart
   Comment("");
  }
Das erstellte Dashboard-Objekt wird bei der Verwendung des Dashboards entfernt:
//+------------------------------------------------------------------+
//| Expert deinitialization function                                 |
//+------------------------------------------------------------------+
void OnDeinit(const int reason)
  {
//--- destroy timer
   EventKillTimer();

//--- Release handle of the indicator
   ResetLastError();
   if(!IndicatorRelease(handle))
      PrintFormat("%s: IndicatorRelease failed. Error %ld",__FUNCTION__,GetLastError());
//--- Clear all comments on the chart
   Comment("");

//--- If the panel object exists, delete it
   if(panel!=NULL)
      delete panel;
  }
Abrufen von Daten
Allgemeine Funktionen zum Abrufen von Daten über das Indikatorhandle:
//+------------------------------------------------------------------+
//| Return the indicator data on the specified bar                   |
//+------------------------------------------------------------------+
double IndicatorValue(const int ind_handle,const int index,const int buffer_num)
  {
   double array[1]={0};
   ResetLastError();
   if(CopyBuffer(ind_handle,buffer_num,index,1,array)!=1)
     {
      PrintFormat("%s: CopyBuffer failed. Error %ld",__FUNCTION__,GetLastError());
      return EMPTY_VALUE;
     }
   return array[0];
  }
//+------------------------------------------------------------------+
//| Return the state of the indicator line                           |
//+------------------------------------------------------------------+
ENUM_LINE_STATE LineState(const int ind_handle,const int index,const int buffer_num)
  {
//--- Get the values of the indicator line with the shift (0,1,2) relative to the passed index
   const double value0=IndicatorValue(ind_handle,index,  buffer_num);
   const double value1=IndicatorValue(ind_handle,index+1,buffer_num);
   const double value2=IndicatorValue(ind_handle,index+2,buffer_num);
//--- If at least one of the values could not be obtained, return an undefined value
   if(value0==EMPTY_VALUE || value1==EMPTY_VALUE || value2==EMPTY_VALUE)
      return LINE_STATE_NONE;
//--- Line upward reversal (value2>value1 && value0>value1)
   if(NormalizeDouble(value2-value1,ind_digits)>0 && NormalizeDouble(value0-value1,ind_digits)>0)
      return LINE_STATE_TURN_UP;
//--- Line upward direction (value2<=value1 && value0>value1)
   else if(NormalizeDouble(value2-value1,ind_digits)<=0 && NormalizeDouble(value0-value1,ind_digits)>0)
      return LINE_STATE_UP;
//--- Line upward stop (value2<=value1 && value0==value1)
   else if(NormalizeDouble(value2-value1,ind_digits)<=0 && NormalizeDouble(value0-value1,ind_digits)==0)
      return LINE_STATE_STOP_UP;
//--- Line downward reversal (value2<value1 && value0<value1)
   if(NormalizeDouble(value2-value1,ind_digits)<0 && NormalizeDouble(value0-value1,ind_digits)<0)
      return LINE_STATE_TURN_DOWN;
//--- Line downward direction (value2>=value1 && value0<value1)
   else if(NormalizeDouble(value2-value1,ind_digits)>=0 && NormalizeDouble(value0-value1,ind_digits)<0)
      return LINE_STATE_DOWN;
//--- Line downward stop (value2>=value1 && value0==value1)
   else if(NormalizeDouble(value2-value1,ind_digits)>=0 && NormalizeDouble(value0-value1,ind_digits)==0)
      return LINE_STATE_STOP_DOWN;
//--- Undefined state
   return LINE_STATE_NONE;
  }
//+------------------------------------------------------------------+
//| Return the state of the line relative to the specified level     |
//+------------------------------------------------------------------+
ENUM_LINE_STATE LineStateRelative(const int ind_handle,const int index,const int buffer_num,const double level0,const double level1=EMPTY_VALUE)
  {
//--- Get the values of the indicator line with the shift (0,1) relative to the passed index
   const double value0=IndicatorValue(ind_handle,index,  buffer_num);
   const double value1=IndicatorValue(ind_handle,index+1,buffer_num);
//--- If at least one of the values could not be obtained, return an undefined value
   if(value0==EMPTY_VALUE || value1==EMPTY_VALUE)
      return LINE_STATE_NONE;
//--- Define the second level to compare
   double level=(level1==EMPTY_VALUE ? level0 : level1);
//--- The line is below the level (value1<level && value0<level0)
   if(NormalizeDouble(value1-level,ind_digits)<0 && NormalizeDouble(value0-level0,ind_digits)<0)
      return LINE_STATE_UNDER;
//--- The line is above the level (value1>level && value0>level0)
   if(NormalizeDouble(value1-level,ind_digits)>0 && NormalizeDouble(value0-level0,ind_digits)>0)
      return LINE_STATE_ABOVE;
//--- The line crossed the level upwards (value1<=level && value0>level0)
   if(NormalizeDouble(value1-level,ind_digits)<=0 && NormalizeDouble(value0-level0,ind_digits)>0)
      return LINE_STATE_CROSS_UP;
//--- The line crossed the level downwards (value1>=level && value0<level0)
   if(NormalizeDouble(value1-level,ind_digits)>=0 && NormalizeDouble(value0-level0,ind_digits)<0)
      return LINE_STATE_CROSS_DOWN;
//--- The line touched the level from below (value1<level0 && value0==level0)
   if(NormalizeDouble(value1-level,ind_digits)<0 && NormalizeDouble(value0-level0,ind_digits)==0)
      return LINE_STATE_TOUCH_BELOW;
//--- The line touched the level from above (value1>level0 && value0==level0)
   if(NormalizeDouble(value1-level,ind_digits)>0 && NormalizeDouble(value0-level0,ind_digits)==0)
      return LINE_STATE_TOUCH_BELOW;
//--- Line is equal to the level value (value1==level0 && value0==level0)
   if(NormalizeDouble(value1-level,ind_digits)==0 && NormalizeDouble(value0-level0,ind_digits)==0)
      return LINE_STATE_EQUALS;
//--- Undefined state
   return LINE_STATE_NONE;
  }
//+------------------------------------------------------------------+
//| Return the indicator line state description                      |
//+------------------------------------------------------------------+
string LineStateDescription(const ENUM_LINE_STATE state)
  {
   switch(state)
     {
      case LINE_STATE_UP         :  return "Up";
      case LINE_STATE_STOP_UP    :  return "Stop Up";
      case LINE_STATE_TURN_UP    :  return "Turn Up";
      case LINE_STATE_DOWN       :  return "Down";
      case LINE_STATE_STOP_DOWN  :  return "Stop Down";
      case LINE_STATE_TURN_DOWN  :  return "Turn Down";
      case LINE_STATE_ABOVE      :  return "Above level";
      case LINE_STATE_UNDER      :  return "Under level";
      case LINE_STATE_CROSS_UP   :  return "Crossing Up";
      case LINE_STATE_CROSS_DOWN :  return "Crossing Down";
      case LINE_STATE_TOUCH_BELOW:  return "Touch from Below";
      case LINE_STATE_TOUCH_ABOVE:  return "Touch from Above";
      case LINE_STATE_EQUALS     :  return "Equals";
      default                    :  return "Unknown";
     }
  }
Wenn wir das Dashboard verwenden, werden die Daten mit Hilfe der Funktion auf dem Bedienfeld angezeigt:
//+------------------------------------------------------------------+
//| Display data from the specified timeseries index to the panel    |
//+------------------------------------------------------------------+
void DrawData(const int index,const datetime time)
  {
//--- Declare the variables to receive data in them
   MqlTick  tick={0};
   MqlRates rates[1];

//--- Exit if unable to get the current prices
   if(!SymbolInfoTick(Symbol(),tick))
      return;
//--- Exit if unable to get the bar data by the specified index
   if(CopyRates(Symbol(),PERIOD_CURRENT,index,1,rates)!=1)
      return;

//--- Set font parameters for bar and indicator data headers
   int  size=0;
   uint flags=0;
   uint angle=0;
   string name=panel.FontParams(size,flags,angle);
   panel.SetFontParams(name,9,FW_BOLD);
   panel.DrawText("Bar data ["+(string)index+"]",3,panel.TableY1(0)-16,clrMaroon,panel.Width()-6);
   panel.DrawText("Indicator data ["+(string)index+"]",3,panel.TableY1(1)-16,clrGreen,panel.Width()-6);
//--- Set font parameters for bar and indicator data
   panel.SetFontParams(name,9);

//--- Display the data of the specified bar in table 0 on the panel
   panel.DrawText("Date",  panel.CellX(0,0,0)+2, panel.CellY(0,0,0)+2); panel.DrawText(TimeToString(  rates[0].time,TIME_DATE),     panel.CellX(0,0,1)+2, panel.CellY(0,0,1)+2,clrNONE,90);
   panel.DrawText("Time",  panel.CellX(0,1,0)+2, panel.CellY(0,1,0)+2); panel.DrawText(TimeToString(  rates[0].time,TIME_MINUTES),  panel.CellX(0,1,1)+2, panel.CellY(0,1,1)+2,clrNONE,90);
   panel.DrawText("Open",  panel.CellX(0,2,0)+2, panel.CellY(0,2,0)+2); panel.DrawText(DoubleToString(rates[0].open,Digits()),      panel.CellX(0,2,1)+2, panel.CellY(0,2,1)+2,clrNONE,90);
   panel.DrawText("High",  panel.CellX(0,3,0)+2, panel.CellY(0,3,0)+2); panel.DrawText(DoubleToString(rates[0].high,Digits()),      panel.CellX(0,3,1)+2, panel.CellY(0,3,1)+2,clrNONE,90);
   panel.DrawText("Low",   panel.CellX(0,4,0)+2, panel.CellY(0,4,0)+2); panel.DrawText(DoubleToString(rates[0].low,Digits()),       panel.CellX(0,4,1)+2, panel.CellY(0,4,1)+2,clrNONE,90);
   panel.DrawText("Close", panel.CellX(0,5,0)+2, panel.CellY(0,5,0)+2); panel.DrawText(DoubleToString(rates[0].close,Digits()),     panel.CellX(0,5,1)+2, panel.CellY(0,5,1)+2,clrNONE,90);

//--- Display the indicator data from the specified bar on the panel in table 1
   panel.DrawText(ind_title, panel.CellX(1,0,0)+2, panel.CellY(1,0,0)+2);
   double value=IndicatorValue(handle,index,0);
   string value_str=(value!=EMPTY_VALUE ? DoubleToString(value,ind_digits) : "");
   panel.DrawText(value_str,panel.CellX(1,0,1)+2,panel.CellY(1,0,1)+2,clrNONE,90);

//--- Display a description of the indicator line state
   panel.DrawText("Line state", panel.CellX(1,1,0)+2, panel.CellY(1,1,0)+2);
   ENUM_LINE_STATE state=LineState(handle,index,0);
   color clr=(value<0 ? clrRed : value>0 ? clrBlue : clrNONE); // The label color changes depending on the value of the line above/below zero
   panel.DrawText(LineStateDescription(state),panel.CellX(1,1,1)+2,panel.CellY(1,1,1)+2,clr,90);

//--- Redraw the chart to immediately display all changes on the panel
   ChartRedraw(ChartID());
  }
Indikatorwerte über/unter Null werden auf dem Armaturenbrett farblich markiert.
Außerdem wird die Ereignisbehandlung des Panel von OnChartEvent() aufgerufen, und die Ereignisse für den Empfang des Balkenindex unter dem Cursor werden behandelt:
//+------------------------------------------------------------------+
//| ChartEvent function                                              |
//+------------------------------------------------------------------+
void OnChartEvent(const int id,
                  const long &lparam,
                  const double &dparam,
                  const string &sparam)
  {
//--- Handling the panel
//--- Call the panel event handler
   panel.OnChartEvent(id,lparam,dparam,sparam);

//--- If the cursor moves or a click is made on the chart
   if(id==CHARTEVENT_MOUSE_MOVE || id==CHARTEVENT_CLICK)
     {
      //--- Declare the variables to record time and price coordinates in them
      datetime time=0;
      double price=0;
      int wnd=0;
      //--- If the cursor coordinates are converted to date and time
      if(ChartXYToTimePrice(ChartID(),(int)lparam,(int)dparam,wnd,time,price))
        {
         //--- write the bar index where the cursor is located to a global variable
         mouse_bar_index=iBarShift(Symbol(),PERIOD_CURRENT,time);
         //--- Display the bar data under the cursor on the panel
         DrawData(mouse_bar_index,time);
        }
     }

//--- If we received a custom event, display the appropriate message in the journal
   if(id>CHARTEVENT_CUSTOM)
     {
      //--- Here we can implement handling a click on the close button on the panel
      PrintFormat("%s: Event id=%ld, object id (lparam): %lu, event message (sparam): %s",__FUNCTION__,id,lparam,sparam);
     }
  }
Nachdem wir den EA kompiliert und auf dem Chart gestartet haben, können wir den Status der Indikatorlinie auf dem Panel überwachen:
Die EA-Datei „TestOscillatorForce.mq5“ ist unten angehängt.
MACD
Der Moving Average Convergence/Divergence (MACD) ist ein dynamischer Indikator, der dem Trend folgt. Er gibt die Korrelation zwischen zwei Gleitenden Durchschnitten an.
Der MACD ist die Differenz zwischen einem 26-Perioden- und einem 12-Perioden- Exponentiell Gleitenden Durchschnitt (EMA). Um Kauf- und Verkauf-Möglichkeiten darzustellen, gibt es eine Signal-Linie (9 periodisches Moving Average im MACD Chart.
Das MACD ist am effektivsten in einem weit schwingenden Märkten. Es gibt drei beliebte Wege zur Nutzung des MACD: Kreuzen, Überkauf/Überverkauf und Divergenzen.
Kreuzen
Die Standardregel ist zu verkaufen, wenn der MACD unter die Signal-Linie fällt. Umgekehrt ist es ein Kauf-Signal, wenn das MACD über die Signal-Linie steigt. Außerdem ist es ein beliebtes Kauf- oder Verkaufssignal wenn das MACD die Nulllinie kreuzt.
Überkauf/Überverkauf Bedingungen
Das MACD kann auch als Überkauf oder Überverkauf Indikator genutzt werden. Wenn das kurzfristigere Moving Average stark abweicht vom längerfristigen, kann es sein, dass es einen drastischen Anstieg/Abfall gab, der im Anschluss korrigiert wird.
Divergenzen
Ein Indikator für eine Beendigung des aktuellen Trends kann eine Divergenz zwischen MACD und Preis sein. Eine Aufwärts-Divergenz tritt auf, wenn der Moving Average Convergence/Divergence-Indikator neue Tiefststände erreicht, während der Kurs dies nicht tut. Eine Abwärts-Divergenz tritt auf, wenn der MACD neue Höchststände erreicht, während der Kurs diese nicht erreicht. Beide diese Divergenzen haben eine höhere Signifikanz, wenn diese in überkauften oder überverkauften Zonen stattfinden.
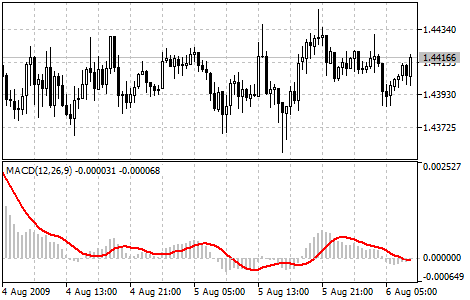
Parameter
Die Anzeige hat vier konfigurierte Parameter:
- Schneller EMA-Berechnungslänge, Standard — 12
- Langsamer EMA-Berechnungslänge, Standard — 26,
- Signal SMA Berechnungslänge, Standard — 9,
- Berechnungspreis, Standard — Schlusskurs.
Eingabe- und globale Variablen für die Verwendung des Indikators im EA:
//+------------------------------------------------------------------+
//|                                           TestOscillatorMACD.mq5 |
//|                                  Copyright 2023, MetaQuotes Ltd. |
//|                                             https://www.mql5.com |
//+------------------------------------------------------------------+
#property copyright "Copyright 2023, MetaQuotes Ltd."
#property link      "https://www.mql5.com"
#property version   "1.00"
//--- enums
enum ENUM_LINE_STATE
  {
   LINE_STATE_NONE,        // Undefined state
   LINE_STATE_UP,          // Upward
   LINE_STATE_DOWN,        // Downward
   LINE_STATE_TURN_UP,     // Upward reversal
   LINE_STATE_TURN_DOWN,   // Downward reversal
   LINE_STATE_STOP_UP,     // Upward stop
   LINE_STATE_STOP_DOWN,   // Downward stop
   LINE_STATE_ABOVE,       // Above value
   LINE_STATE_UNDER,       // Below value
   LINE_STATE_CROSS_UP,    // Crossing value upwards
   LINE_STATE_CROSS_DOWN,  // Crossing value downwards
   LINE_STATE_TOUCH_BELOW, // Touching value from below
   LINE_STATE_TOUCH_ABOVE, // Touch value from above
   LINE_STATE_EQUALS,      // Equal to value
  };
//--- input parameters
input uint                 InpPeriodFast  =  12;            /* Fast MA Period */
input uint                 InpPeriodSlow  =  26;            /* Slow MA Period */
input uint                 InpPeriodSignal=  9;             /* MACD SMA       */
input ENUM_APPLIED_PRICE   InpAppliedPrice=  PRICE_CLOSE;   /* Applied Price  */
//--- global variables
int      handle=INVALID_HANDLE;  // Indicator handle
int      period_fast=0;          // Fast EMA calculation period
int      period_slow=0;          // Slow EMA calculation period
int      period_signal=0;        // Signal line calculation period
int      ind_digits=0;           // Number of decimal places in the indicator values
string   ind_title;              // Indicator description
Bei der Verwendung des Dashboards wird die Klassendatei des Panels eingebunden und die Variablen für die Arbeit mit dem Panel werden hinzugefügt:
//+------------------------------------------------------------------+
//|                                           TestOscillatorMACD.mq5 |
//|                                  Copyright 2023, MetaQuotes Ltd. |
//|                                             https://www.mql5.com |
//+------------------------------------------------------------------+
#property copyright "Copyright 2023, MetaQuotes Ltd."
#property link      "https://www.mql5.com"
#property version   "1.00"
//--- includes
#include <Dashboard\Dashboard.mqh>
//--- enums
enum ENUM_LINE_STATE
  {
   LINE_STATE_NONE,        // Undefined state
   LINE_STATE_UP,          // Upward
   LINE_STATE_DOWN,        // Downward
   LINE_STATE_TURN_UP,     // Upward reversal
   LINE_STATE_TURN_DOWN,   // Downward reversal
   LINE_STATE_STOP_UP,     // Upward stop
   LINE_STATE_STOP_DOWN,   // Downward stop
   LINE_STATE_ABOVE,       // Above value
   LINE_STATE_UNDER,       // Below value
   LINE_STATE_CROSS_UP,    // Crossing value upwards
   LINE_STATE_CROSS_DOWN,  // Crossing value downwards
   LINE_STATE_TOUCH_BELOW, // Touching value from below
   LINE_STATE_TOUCH_ABOVE, // Touch value from above
   LINE_STATE_EQUALS,      // Equal to value
  };
//--- input parameters
input uint                 InpPeriodFast  =  12;            /* Fast MA Period */
input uint                 InpPeriodSlow  =  26;            /* Slow MA Period */
input uint                 InpPeriodSignal=  9;             /* MACD SMA       */
input ENUM_APPLIED_PRICE   InpAppliedPrice=  PRICE_CLOSE;   /* Applied Price  */
//--- global variables
int      handle=INVALID_HANDLE;  // Indicator handle
int      period_fast=0;          // Fast EMA calculation period
int      period_slow=0;          // Slow EMA calculation period
int      period_signal=0;        // Signal line calculation period
int      ind_digits=0;           // Number of decimal places in the indicator values
string   ind_title;              // Indicator description
//--- variables for the panel
int      mouse_bar_index;        // Index of the bar the data is taken from
CDashboard *panel=NULL;          // Pointer to the panel object
Initialisierung
OnInit() für die Initialisierung der Indikatorparameter und die Erstellung seines Handles:
//+------------------------------------------------------------------+
//| Expert initialization function                                   |
//+------------------------------------------------------------------+
int OnInit()
  {
//--- create timer
   EventSetTimer(60);

//--- Indicator
//--- Set and adjust the calculation period if necessary
   period_fast=int(InpPeriodFast<1 ? 12 : InpPeriodFast);
   period_slow=int(InpPeriodSlow<1 ? 26 : InpPeriodSlow==period_fast ? period_fast+1 : InpPeriodSlow);
   period_signal=int(InpPeriodSignal<1 ? 9 : InpPeriodSignal);
//--- Set the indicator name and the number of decimal places
   ind_title=StringFormat("MACD(%lu,%lu,%lu)",period_fast,period_slow,period_signal);
   ind_digits=Digits()+1;
//--- Create indicator handle
   ResetLastError();
   handle=iMACD(Symbol(),PERIOD_CURRENT,period_fast,period_slow,period_signal,InpAppliedPrice);
   if(handle==INVALID_HANDLE)
     {
      PrintFormat("%s: Failed to create indicator handle %s. Error %ld",__FUNCTION__,ind_title,GetLastError());
      return INIT_FAILED;
     }

//--- Successful initialization
   return(INIT_SUCCEEDED);
  }
Das Panel wird bei Verwendung des Dashboards erstellt:
//+------------------------------------------------------------------+
//| Expert initialization function                                   |
//+------------------------------------------------------------------+
int OnInit()
  {
//--- create timer
   EventSetTimer(60);

//--- Indicator
//--- Set and adjust the calculation period if necessary
   period_fast=int(InpPeriodFast<1 ? 12 : InpPeriodFast);
   period_slow=int(InpPeriodSlow<1 ? 26 : InpPeriodSlow==period_fast ? period_fast+1 : InpPeriodSlow);
   period_signal=int(InpPeriodSignal<1 ? 9 : InpPeriodSignal);
//--- Set the indicator name and the number of decimal places
   ind_title=StringFormat("MACD(%lu,%lu,%lu)",period_fast,period_slow,period_signal);
   ind_digits=Digits()+1;
//--- Create indicator handle
   ResetLastError();
   handle=iMACD(Symbol(),PERIOD_CURRENT,period_fast,period_slow,period_signal,InpAppliedPrice);
   if(handle==INVALID_HANDLE)
     {
      PrintFormat("%s: Failed to create indicator handle %s. Error %ld",__FUNCTION__,ind_title,GetLastError());
      return INIT_FAILED;
     }

//--- Dashboard
//--- Create the panel
   panel=new CDashboard(1,20,20,199,261);
   if(panel==NULL)
     {
      Print("Error. Failed to create panel object");
      return INIT_FAILED;
     }
//--- Set font parameters
   panel.SetFontParams("Calibri",9);
//--- Display the panel with the "Symbol, Timeframe description" header text
   panel.View(Symbol()+", "+StringSubstr(EnumToString(Period()),7));
//--- Create a table with ID 0 to display bar data in it
   panel.CreateNewTable(0);
//--- Draw a table with ID 0 on the panel background
   panel.DrawGrid(0,2,20,6,2,18,97);

//--- Create a table with ID 1 to display indicator data in it
   panel.CreateNewTable(1);
//--- Get the Y2 table coordinate with ID 0 and
//--- set the Y1 coordinate for the table with ID 1
   int y1=panel.TableY2(0)+22;
//--- Draw a table with ID 1 on the panel background
   panel.DrawGrid(1,2,y1,5,2,18,97);

//--- Display tabular data in the journal
   panel.GridPrint(0,2);
   panel.GridPrint(1,2);
//--- Initialize the variable with the index of the mouse cursor bar
   mouse_bar_index=0;
//--- Display the data of the current bar on the panel
   DrawData(mouse_bar_index,TimeCurrent());

//--- Successful initialization
   return(INIT_SUCCEEDED);
  }
Deinitialisierung
In OnDeinit() geben wir das Handle im EA wieder frei:
//+------------------------------------------------------------------+
//| Expert deinitialization function                                 |
//+------------------------------------------------------------------+
void OnDeinit(const int reason)
  {
//--- destroy timer
   EventKillTimer();

//--- Release handle of the indicator
   ResetLastError();
   if(!IndicatorRelease(handle))
      PrintFormat("%s: IndicatorRelease failed. Error %ld",__FUNCTION__,GetLastError());
//--- Clear all comments on the chart
   Comment("");
  }
Das erstellte Dashboard-Objekt wird bei der Verwendung des Dashboards entfernt:
//+------------------------------------------------------------------+
//| Expert deinitialization function                                 |
//+------------------------------------------------------------------+
void OnDeinit(const int reason)
  {
//--- destroy timer
   EventKillTimer();

//--- Release handle of the indicator
   ResetLastError();
   if(!IndicatorRelease(handle))
      PrintFormat("%s: IndicatorRelease failed. Error %ld",__FUNCTION__,GetLastError());
//--- Clear all comments on the chart
   Comment("");

//--- If the panel object exists, delete it
   if(panel!=NULL)
      delete panel;
  }
Abrufen von Daten
Allgemeine Funktionen zum Abrufen von Daten über das Indikatorhandle:
//+------------------------------------------------------------------+
//| Return the indicator data on the specified bar                   |
//+------------------------------------------------------------------+
double IndicatorValue(const int ind_handle,const int index,const int buffer_num)
  {
   double array[1]={0};
   ResetLastError();
   if(CopyBuffer(ind_handle,buffer_num,index,1,array)!=1)
     {
      PrintFormat("%s: CopyBuffer failed. Error %ld",__FUNCTION__,GetLastError());
      return EMPTY_VALUE;
     }
   return array[0];
  }
//+------------------------------------------------------------------+
//| Return the state of the indicator line                           |
//+------------------------------------------------------------------+
ENUM_LINE_STATE LineState(const int ind_handle,const int index,const int buffer_num)
  {
//--- Get the values of the indicator line with the shift (0,1,2) relative to the passed index
   const double value0=IndicatorValue(ind_handle,index,  buffer_num);
   const double value1=IndicatorValue(ind_handle,index+1,buffer_num);
   const double value2=IndicatorValue(ind_handle,index+2,buffer_num);
//--- If at least one of the values could not be obtained, return an undefined value
   if(value0==EMPTY_VALUE || value1==EMPTY_VALUE || value2==EMPTY_VALUE)
      return LINE_STATE_NONE;
//--- Line upward reversal (value2>value1 && value0>value1)
   if(NormalizeDouble(value2-value1,ind_digits)>0 && NormalizeDouble(value0-value1,ind_digits)>0)
      return LINE_STATE_TURN_UP;
//--- Line upward direction (value2<=value1 && value0>value1)
   else if(NormalizeDouble(value2-value1,ind_digits)<=0 && NormalizeDouble(value0-value1,ind_digits)>0)
      return LINE_STATE_UP;
//--- Line upward stop (value2<=value1 && value0==value1)
   else if(NormalizeDouble(value2-value1,ind_digits)<=0 && NormalizeDouble(value0-value1,ind_digits)==0)
      return LINE_STATE_STOP_UP;
//--- Line downward reversal (value2<value1 && value0<value1)
   if(NormalizeDouble(value2-value1,ind_digits)<0 && NormalizeDouble(value0-value1,ind_digits)<0)
      return LINE_STATE_TURN_DOWN;
//--- Line downward direction (value2>=value1 && value0<value1)
   else if(NormalizeDouble(value2-value1,ind_digits)>=0 && NormalizeDouble(value0-value1,ind_digits)<0)
      return LINE_STATE_DOWN;
//--- Line downward stop (value2>=value1 && value0==value1)
   else if(NormalizeDouble(value2-value1,ind_digits)>=0 && NormalizeDouble(value0-value1,ind_digits)==0)
      return LINE_STATE_STOP_DOWN;
//--- Undefined state
   return LINE_STATE_NONE;
  }
//+------------------------------------------------------------------+
//| Return the state of the line relative to the specified level     |
//+------------------------------------------------------------------+
ENUM_LINE_STATE LineStateRelative(const int ind_handle,const int index,const int buffer_num,const double level0,const double level1=EMPTY_VALUE)
  {
//--- Get the values of the indicator line with the shift (0,1) relative to the passed index
   const double value0=IndicatorValue(ind_handle,index,  buffer_num);
   const double value1=IndicatorValue(ind_handle,index+1,buffer_num);
//--- If at least one of the values could not be obtained, return an undefined value
   if(value0==EMPTY_VALUE || value1==EMPTY_VALUE)
      return LINE_STATE_NONE;
//--- Define the second level to compare
   double level=(level1==EMPTY_VALUE ? level0 : level1);
//--- The line is below the level (value1<level && value0<level0)
   if(NormalizeDouble(value1-level,ind_digits)<0 && NormalizeDouble(value0-level0,ind_digits)<0)
      return LINE_STATE_UNDER;
//--- The line is above the level (value1>level && value0>level0)
   if(NormalizeDouble(value1-level,ind_digits)>0 && NormalizeDouble(value0-level0,ind_digits)>0)
      return LINE_STATE_ABOVE;
//--- The line crossed the level upwards (value1<=level && value0>level0)
   if(NormalizeDouble(value1-level,ind_digits)<=0 && NormalizeDouble(value0-level0,ind_digits)>0)
      return LINE_STATE_CROSS_UP;
//--- The line crossed the level downwards (value1>=level && value0<level0)
   if(NormalizeDouble(value1-level,ind_digits)>=0 && NormalizeDouble(value0-level0,ind_digits)<0)
      return LINE_STATE_CROSS_DOWN;
//--- The line touched the level from below (value1<level0 && value0==level0)
   if(NormalizeDouble(value1-level,ind_digits)<0 && NormalizeDouble(value0-level0,ind_digits)==0)
      return LINE_STATE_TOUCH_BELOW;
//--- The line touched the level from above (value1>level0 && value0==level0)
   if(NormalizeDouble(value1-level,ind_digits)>0 && NormalizeDouble(value0-level0,ind_digits)==0)
      return LINE_STATE_TOUCH_BELOW;
//--- Line is equal to the level value (value1==level0 && value0==level0)
   if(NormalizeDouble(value1-level,ind_digits)==0 && NormalizeDouble(value0-level0,ind_digits)==0)
      return LINE_STATE_EQUALS;
//--- Undefined state
   return LINE_STATE_NONE;
  }
//+------------------------------------------------------------------+
//| Return the indicator line state description                      |
//+------------------------------------------------------------------+
string LineStateDescription(const ENUM_LINE_STATE state)
  {
   switch(state)
     {
      case LINE_STATE_UP         :  return "Up";
      case LINE_STATE_STOP_UP    :  return "Stop Up";
      case LINE_STATE_TURN_UP    :  return "Turn Up";
      case LINE_STATE_DOWN       :  return "Down";
      case LINE_STATE_STOP_DOWN  :  return "Stop Down";
      case LINE_STATE_TURN_DOWN  :  return "Turn Down";
      case LINE_STATE_ABOVE      :  return "Above level";
      case LINE_STATE_UNDER      :  return "Under level";
      case LINE_STATE_CROSS_UP   :  return "Crossing Up";
      case LINE_STATE_CROSS_DOWN :  return "Crossing Down";
      case LINE_STATE_TOUCH_BELOW:  return "Touch from Below";
      case LINE_STATE_TOUCH_ABOVE:  return "Touch from Above";
      case LINE_STATE_EQUALS     :  return "Equals";
      default                    :  return "Unknown";
     }
  }
Wenn wir das Dashboard verwenden, werden die Daten mit Hilfe der Funktion auf dem Bedienfeld angezeigt:
//+------------------------------------------------------------------+
//| Display data from the specified timeseries index to the panel    |
//+------------------------------------------------------------------+
void DrawData(const int index,const datetime time)
  {
//--- Declare the variables to receive data in them
   MqlTick  tick={0};
   MqlRates rates[1];

//--- Exit if unable to get the current prices
   if(!SymbolInfoTick(Symbol(),tick))
      return;
//--- Exit if unable to get the bar data by the specified index
   if(CopyRates(Symbol(),PERIOD_CURRENT,index,1,rates)!=1)
      return;

//--- Set font parameters for bar and indicator data headers
   int  size=0;
   uint flags=0;
   uint angle=0;
   string name=panel.FontParams(size,flags,angle);
   panel.SetFontParams(name,9,FW_BOLD);
   panel.DrawText("Bar data ["+(string)index+"]",3,panel.TableY1(0)-16,clrMaroon,panel.Width()-6);
   panel.DrawText("Indicator data ["+(string)index+"]",3,panel.TableY1(1)-16,clrGreen,panel.Width()-6);
//--- Set font parameters for bar and indicator data
   panel.SetFontParams(name,9);

//--- Display the data of the specified bar in table 0 on the panel
   panel.DrawText("Date",  panel.CellX(0,0,0)+2, panel.CellY(0,0,0)+2); panel.DrawText(TimeToString(  rates[0].time,TIME_DATE),     panel.CellX(0,0,1)+2, panel.CellY(0,0,1)+2,clrNONE,90);
   panel.DrawText("Time",  panel.CellX(0,1,0)+2, panel.CellY(0,1,0)+2); panel.DrawText(TimeToString(  rates[0].time,TIME_MINUTES),  panel.CellX(0,1,1)+2, panel.CellY(0,1,1)+2,clrNONE,90);
   panel.DrawText("Open",  panel.CellX(0,2,0)+2, panel.CellY(0,2,0)+2); panel.DrawText(DoubleToString(rates[0].open,Digits()),      panel.CellX(0,2,1)+2, panel.CellY(0,2,1)+2,clrNONE,90);
   panel.DrawText("High",  panel.CellX(0,3,0)+2, panel.CellY(0,3,0)+2); panel.DrawText(DoubleToString(rates[0].high,Digits()),      panel.CellX(0,3,1)+2, panel.CellY(0,3,1)+2,clrNONE,90);
   panel.DrawText("Low",   panel.CellX(0,4,0)+2, panel.CellY(0,4,0)+2); panel.DrawText(DoubleToString(rates[0].low,Digits()),       panel.CellX(0,4,1)+2, panel.CellY(0,4,1)+2,clrNONE,90);
   panel.DrawText("Close", panel.CellX(0,5,0)+2, panel.CellY(0,5,0)+2); panel.DrawText(DoubleToString(rates[0].close,Digits()),     panel.CellX(0,5,1)+2, panel.CellY(0,5,1)+2,clrNONE,90);

//--- Display the indicator data from the specified bar on the panel in table 1
   panel.DrawText(ind_title, panel.CellX(1,0,0)+2, panel.CellY(1,0,0)+2);
   double value=IndicatorValue(handle,index,0);
   string value_str=(value!=EMPTY_VALUE ? DoubleToString(value,ind_digits) : "");
   panel.DrawText(value_str,panel.CellX(1,0,1)+2,panel.CellY(1,0,1)+2,clrNONE,90);
//--- Display the indicator signal line data from the specified bar on the panel in table 1
   panel.DrawText("Signal", panel.CellX(1,1,0)+2, panel.CellY(1,1,0)+2);
   double signal=IndicatorValue(handle,index,1);
   string signal_str=(signal!=EMPTY_VALUE ? DoubleToString(signal,ind_digits) : "");
   panel.DrawText(signal_str,panel.CellX(1,1,1)+2,panel.CellY(1,1,1)+2,clrNONE,90);

//--- Display a description of the indicator line state relative to zero
   panel.DrawText("MACD vs Zero", panel.CellX(1,2,0)+2, panel.CellY(1,2,0)+2);
   ENUM_LINE_STATE state_zero=LineStateRelative(handle,index,0,0);
   string state_zero_str=
     (
      state_zero==LINE_STATE_ABOVE        ?  "MACD > 0"  :
      state_zero==LINE_STATE_UNDER        ?  "MACD < 0"  :
      state_zero==LINE_STATE_TOUCH_ABOVE  ||
      state_zero==LINE_STATE_TOUCH_BELOW  ?  "Touch"     :
      LineStateDescription(state_zero)
     );
//--- The label color changes depending on the value of the line relative to the level
   color clr=(state_zero==LINE_STATE_CROSS_UP ? clrBlue : state_zero==LINE_STATE_CROSS_DOWN ? clrRed : clrNONE);
   panel.DrawText(state_zero_str,panel.CellX(1,2,1)+2,panel.CellY(1,2,1)+2,clr,90);

//--- Display a description of the indicator line state relative to the signal line
   panel.DrawText("MACD vs Signal", panel.CellX(1,3,0)+2, panel.CellY(1,3,0)+2);
   ENUM_LINE_STATE state_signal=LineStateRelative(handle,index,0,signal,IndicatorValue(handle,index+1,1));
   string state_signal_str=(state_signal==LINE_STATE_ABOVE ? "MACD > Signal" : state_signal==LINE_STATE_UNDER ? "MACD < Signal" : LineStateDescription(state_signal));
//--- The label color changes depending on the value of the line relative to the level
   clr=(state_signal==LINE_STATE_CROSS_UP ? clrBlue : state_signal==LINE_STATE_CROSS_DOWN ? clrRed : clrNONE);
   panel.DrawText(state_signal_str,panel.CellX(1,3,1)+2,panel.CellY(1,3,1)+2,clr,90);

//--- Redraw the chart to immediately display all changes on the panel
   ChartRedraw(ChartID());
  }
Das Verhältnis des Histogramms zur Signallinie und zum Nullpunkt wird im Panel farblich hervorgehoben.
Außerdem wird die Ereignisbehandlung des Panel von OnChartEvent() aufgerufen, und die Ereignisse für den Empfang des Balkenindex unter dem Cursor werden behandelt:
//+------------------------------------------------------------------+
//| ChartEvent function                                              |
//+------------------------------------------------------------------+
void OnChartEvent(const int id,
                  const long &lparam,
                  const double &dparam,
                  const string &sparam)
  {
//--- Handling the panel
//--- Call the panel event handler
   panel.OnChartEvent(id,lparam,dparam,sparam);

//--- If the cursor moves or a click is made on the chart
   if(id==CHARTEVENT_MOUSE_MOVE || id==CHARTEVENT_CLICK)
     {
      //--- Declare the variables to record time and price coordinates in them
      datetime time=0;
      double price=0;
      int wnd=0;
      //--- If the cursor coordinates are converted to date and time
      if(ChartXYToTimePrice(ChartID(),(int)lparam,(int)dparam,wnd,time,price))
        {
         //--- write the bar index where the cursor is located to a global variable
         mouse_bar_index=iBarShift(Symbol(),PERIOD_CURRENT,time);
         //--- Display the bar data under the cursor on the panel
         DrawData(mouse_bar_index,time);
        }
     }

//--- If we received a custom event, display the appropriate message in the journal
   if(id>CHARTEVENT_CUSTOM)
     {
      //--- Here we can implement handling a click on the close button on the panel
      PrintFormat("%s: Event id=%ld, object id (lparam): %lu, event message (sparam): %s",__FUNCTION__,id,lparam,sparam);
     }
  }
Nachdem wir den EA kompiliert und auf dem Chart gestartet haben, können wir den Status der Indikatorlinien auf dem Panel überwachen:
Die EA-Datei „TestOscillatorMACD.mq5“ ist unten angehängt.
Momentum
Der Momentum-Indikator misst die Änderung der Preise eines Symbols in einem bestimmten Zeitraum. Es gibt grundsätzlich zwei Möglichkeiten der Verwendung des Momentum-Indikators:
- Als Trendfolgeindikator ähnlich dem Moving Average Convergence/Divergence (MACD). In diesem Fall tritt ein Signal zum Kaufen auf, wenn der Momentum Indikator nach einem Tief beginnt zu steigen und andersherum. Sie könnten einen kurzfristigen gleitenden Durchschnitt verwenden, um die Tiefs und Hochs zu erkennen.
Extrem hohe oder niedrige Werte des Momentums bedeuten eine Fortsetzung des aktuellen Trends. Wenn der Indikator also einen extremen Hochpunkt erreicht und wieder absinkt, kann ein weiterer Preis-Anstieg erfolgen. In jedem Fall sollte eine Position nur eröffnet werden, wenn der Preis das Signal bestätigt. - Als Frühindikator. Bei dieser Methode wird angenommen, dass die finale Phase eines Aufwärtstrends von einem rapiden Preisanstieg begleitet wird (da alle erwarten, dass der Preis noch höher steigt) und, dass das Ende eines Abwärtsmarktes durch einen starken Preisverfall dargestellt wird (Liquidierung vieler Positionen). Dies ist oft der Fall, aber es ist auch eine starke Verallgemeinerung.
Wenn sich der Markt einem Höchststand nähert, kommt es zu einem starken Anstieg des Momentum-Indikators. Anschließend fällt der Indikator während die Preise wachsen oder sich horizontal bewegen. Analog dazu fällt der Momentum Indikator bei einem Markttief stark und steigt früher an, bevor der Preis wieder ansteigt. Diese beiden Umstände führen zu einer Divergenz zwischen dem Indikator und den Preise.
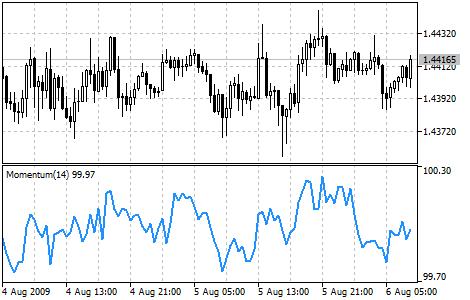
Parameter
Der Indikator hat zwei Parameter:
- Berechnungslänge, Standard — 14,
- Berechnungspreis, Standard — Schlusskurs.
Eingabe- und globale Variablen für die Verwendung des Indikators im EA:
//+------------------------------------------------------------------+
//|                                       TestOscillatorMomentum.mq5 |
//|                                  Copyright 2023, MetaQuotes Ltd. |
//|                                             https://www.mql5.com |
//+------------------------------------------------------------------+
#property copyright "Copyright 2023, MetaQuotes Ltd."
#property link      "https://www.mql5.com"
#property version   "1.00"
//--- enums
enum ENUM_LINE_STATE
  {
   LINE_STATE_NONE,        // Undefined state
   LINE_STATE_UP,          // Upward
   LINE_STATE_DOWN,        // Downward
   LINE_STATE_TURN_UP,     // Upward reversal
   LINE_STATE_TURN_DOWN,   // Downward reversal
   LINE_STATE_STOP_UP,     // Upward stop
   LINE_STATE_STOP_DOWN,   // Downward stop
   LINE_STATE_ABOVE,       // Above value
   LINE_STATE_UNDER,       // Below value
   LINE_STATE_CROSS_UP,    // Crossing value upwards
   LINE_STATE_CROSS_DOWN,  // Crossing value downwards
   LINE_STATE_TOUCH_BELOW, // Touching value from below
   LINE_STATE_TOUCH_ABOVE, // Touch value from above
   LINE_STATE_EQUALS,      // Equal to value
  };
//--- input parameters
input uint                 InpPeriod=  14;            /* Period         */
input ENUM_APPLIED_PRICE   InpPrice =  PRICE_CLOSE;   /* Applied Price  */
//--- global variables
int      handle=INVALID_HANDLE;  // Indicator handle
int      period=0;               // Momentum calculation period
int      ind_digits=0;           // Number of decimal places in the indicator values
string   ind_title;              // Indicator description
Bei der Verwendung des Dashboards wird die Klassendatei des Panels eingebunden und die Variablen für die Arbeit mit dem Panel werden hinzugefügt:
//+------------------------------------------------------------------+
//|                                       TestOscillatorMomentum.mq5 |
//|                                  Copyright 2023, MetaQuotes Ltd. |
//|                                             https://www.mql5.com |
//+------------------------------------------------------------------+
#property copyright "Copyright 2023, MetaQuotes Ltd."
#property link      "https://www.mql5.com"
#property version   "1.00"
//--- includes
#include <Dashboard\Dashboard.mqh>
//--- enums
enum ENUM_LINE_STATE
  {
   LINE_STATE_NONE,        // Undefined state
   LINE_STATE_UP,          // Upward
   LINE_STATE_DOWN,        // Downward
   LINE_STATE_TURN_UP,     // Upward reversal
   LINE_STATE_TURN_DOWN,   // Downward reversal
   LINE_STATE_STOP_UP,     // Upward stop
   LINE_STATE_STOP_DOWN,   // Downward stop
   LINE_STATE_ABOVE,       // Above value
   LINE_STATE_UNDER,       // Below value
   LINE_STATE_CROSS_UP,    // Crossing value upwards
   LINE_STATE_CROSS_DOWN,  // Crossing value downwards
   LINE_STATE_TOUCH_BELOW, // Touching value from below
   LINE_STATE_TOUCH_ABOVE, // Touch value from above
   LINE_STATE_EQUALS,      // Equal to value
  };
//--- input parameters
input uint                 InpPeriod=  14;            /* Period         */
input ENUM_APPLIED_PRICE   InpPrice =  PRICE_CLOSE;   /* Applied Price  */
//--- global variables
int      handle=INVALID_HANDLE;  // Indicator handle
int      period=0;               // Momentum calculation period
int      ind_digits=0;           // Number of decimal places in the indicator values
string   ind_title;              // Indicator description
//--- variables for the panel
int      mouse_bar_index;        // Index of the bar the data is taken from
CDashboard *panel=NULL;          // Pointer to the panel object
Initialisierung
OnInit() für die Initialisierung der Indikatorparameter und die Erstellung seines Handles:
//+------------------------------------------------------------------+
//| Expert initialization function                                   |
//+------------------------------------------------------------------+
int OnInit()
  {
//--- create timer
   EventSetTimer(60);

//--- Indicator
//--- Set and adjust the calculation period if necessary
   period=int(InpPeriod<1 ? 14 : InpPeriod);
//--- Set the indicator name and the number of decimal places
   ind_title=StringFormat("Momentum(%lu)",period);
   ind_digits=2;
//--- Create indicator handle
   ResetLastError();
   handle=iMomentum(Symbol(),PERIOD_CURRENT,period,InpPrice);
   if(handle==INVALID_HANDLE)
     {
      PrintFormat("%s: Failed to create indicator handle %s. Error %ld",__FUNCTION__,ind_title,GetLastError());
      return INIT_FAILED;
     }

//--- Successful initialization
   return(INIT_SUCCEEDED);
  }
Das Panel wird bei Verwendung des Dashboards erstellt:
//+------------------------------------------------------------------+
//| Expert initialization function                                   |
//+------------------------------------------------------------------+
int OnInit()
  {
//--- create timer
   EventSetTimer(60);

//--- Indicator
//--- Set and adjust the calculation period if necessary
   period=int(InpPeriod<1 ? 14 : InpPeriod);
//--- Set the indicator name and the number of decimal places
   ind_title=StringFormat("Momentum(%lu)",period);
   ind_digits=2;
//--- Create indicator handle
   ResetLastError();
   handle=iMomentum(Symbol(),PERIOD_CURRENT,period,InpPrice);
   if(handle==INVALID_HANDLE)
     {
      PrintFormat("%s: Failed to create indicator handle %s. Error %ld",__FUNCTION__,ind_title,GetLastError());
      return INIT_FAILED;
     }

//--- Dashboard
//--- Create the panel
   panel=new CDashboard(1,20,20,199,225);
   if(panel==NULL)
     {
      Print("Error. Failed to create panel object");
      return INIT_FAILED;
     }
//--- Set font parameters
   panel.SetFontParams("Calibri",9);
//--- Display the panel with the "Symbol, Timeframe description" header text
   panel.View(Symbol()+", "+StringSubstr(EnumToString(Period()),7));
//--- Create a table with ID 0 to display bar data in it
   panel.CreateNewTable(0);
//--- Draw a table with ID 0 on the panel background
   panel.DrawGrid(0,2,20,6,2,18,97);

//--- Create a table with ID 1 to display indicator data in it
   panel.CreateNewTable(1);
//--- Get the Y2 table coordinate with ID 0 and
//--- set the Y1 coordinate for the table with ID 1
   int y1=panel.TableY2(0)+22;
//--- Draw a table with ID 1 on the panel background
   panel.DrawGrid(1,2,y1,3,2,18,97);

//--- Display tabular data in the journal
   panel.GridPrint(0,2);
   panel.GridPrint(1,2);
//--- Initialize the variable with the index of the mouse cursor bar
   mouse_bar_index=0;
//--- Display the data of the current bar on the panel
   DrawData(mouse_bar_index,TimeCurrent());

//--- Successful initialization
   return(INIT_SUCCEEDED);
  }
Deinitialisierung
In OnDeinit() geben wir das Handle im EA wieder frei:
//+------------------------------------------------------------------+
//| Expert deinitialization function                                 |
//+------------------------------------------------------------------+
void OnDeinit(const int reason)
  {
//--- destroy timer
   EventKillTimer();

//--- Release handle of the indicator
   ResetLastError();
   if(!IndicatorRelease(handle))
      PrintFormat("%s: IndicatorRelease failed. Error %ld",__FUNCTION__,GetLastError());
//--- Clear all comments on the chart
   Comment("");
  }
Das erstellte Dashboard-Objekt wird bei der Verwendung des Dashboards entfernt:
//+------------------------------------------------------------------+
//| Expert deinitialization function                                 |
//+------------------------------------------------------------------+
void OnDeinit(const int reason)
  {
//--- destroy timer
   EventKillTimer();

//--- Release handle of the indicator
   ResetLastError();
   if(!IndicatorRelease(handle))
      PrintFormat("%s: IndicatorRelease failed. Error %ld",__FUNCTION__,GetLastError());
//--- Clear all comments on the chart
   Comment("");

//--- If the panel object exists, delete it
   if(panel!=NULL)
      delete panel;
  }
Abrufen von Daten
Allgemeine Funktionen zum Abrufen von Daten über das Indikatorhandle:
//+------------------------------------------------------------------+
//| Return the indicator data on the specified bar                   |
//+------------------------------------------------------------------+
double IndicatorValue(const int ind_handle,const int index,const int buffer_num)
  {
   double array[1]={0};
   ResetLastError();
   if(CopyBuffer(ind_handle,buffer_num,index,1,array)!=1)
     {
      PrintFormat("%s: CopyBuffer failed. Error %ld",__FUNCTION__,GetLastError());
      return EMPTY_VALUE;
     }
   return array[0];
  }
//+------------------------------------------------------------------+
//| Return the state of the indicator line                           |
//+------------------------------------------------------------------+
ENUM_LINE_STATE LineState(const int ind_handle,const int index,const int buffer_num)
  {
//--- Get the values of the indicator line with the shift (0,1,2) relative to the passed index
   const double value0=IndicatorValue(ind_handle,index,  buffer_num);
   const double value1=IndicatorValue(ind_handle,index+1,buffer_num);
   const double value2=IndicatorValue(ind_handle,index+2,buffer_num);
//--- If at least one of the values could not be obtained, return an undefined value
   if(value0==EMPTY_VALUE || value1==EMPTY_VALUE || value2==EMPTY_VALUE)
      return LINE_STATE_NONE;
//--- Line upward reversal (value2>value1 && value0>value1)
   if(NormalizeDouble(value2-value1,ind_digits)>0 && NormalizeDouble(value0-value1,ind_digits)>0)
      return LINE_STATE_TURN_UP;
//--- Line upward direction (value2<=value1 && value0>value1)
   else if(NormalizeDouble(value2-value1,ind_digits)<=0 && NormalizeDouble(value0-value1,ind_digits)>0)
      return LINE_STATE_UP;
//--- Line upward stop (value2<=value1 && value0==value1)
   else if(NormalizeDouble(value2-value1,ind_digits)<=0 && NormalizeDouble(value0-value1,ind_digits)==0)
      return LINE_STATE_STOP_UP;
//--- Line downward reversal (value2<value1 && value0<value1)
   if(NormalizeDouble(value2-value1,ind_digits)<0 && NormalizeDouble(value0-value1,ind_digits)<0)
      return LINE_STATE_TURN_DOWN;
//--- Line downward direction (value2>=value1 && value0<value1)
   else if(NormalizeDouble(value2-value1,ind_digits)>=0 && NormalizeDouble(value0-value1,ind_digits)<0)
      return LINE_STATE_DOWN;
//--- Line downward stop (value2>=value1 && value0==value1)
   else if(NormalizeDouble(value2-value1,ind_digits)>=0 && NormalizeDouble(value0-value1,ind_digits)==0)
      return LINE_STATE_STOP_DOWN;
//--- Undefined state
   return LINE_STATE_NONE;
  }
//+------------------------------------------------------------------+
//| Return the state of the line relative to the specified level     |
//+------------------------------------------------------------------+
ENUM_LINE_STATE LineStateRelative(const int ind_handle,const int index,const int buffer_num,const double level0,const double level1=EMPTY_VALUE)
  {
//--- Get the values of the indicator line with the shift (0,1) relative to the passed index
   const double value0=IndicatorValue(ind_handle,index,  buffer_num);
   const double value1=IndicatorValue(ind_handle,index+1,buffer_num);
//--- If at least one of the values could not be obtained, return an undefined value
   if(value0==EMPTY_VALUE || value1==EMPTY_VALUE)
      return LINE_STATE_NONE;
//--- Define the second level to compare
   double level=(level1==EMPTY_VALUE ? level0 : level1);
//--- The line is below the level (value1<level && value0<level0)
   if(NormalizeDouble(value1-level,ind_digits)<0 && NormalizeDouble(value0-level0,ind_digits)<0)
      return LINE_STATE_UNDER;
//--- The line is above the level (value1>level && value0>level0)
   if(NormalizeDouble(value1-level,ind_digits)>0 && NormalizeDouble(value0-level0,ind_digits)>0)
      return LINE_STATE_ABOVE;
//--- The line crossed the level upwards (value1<=level && value0>level0)
   if(NormalizeDouble(value1-level,ind_digits)<=0 && NormalizeDouble(value0-level0,ind_digits)>0)
      return LINE_STATE_CROSS_UP;
//--- The line crossed the level downwards (value1>=level && value0<level0)
   if(NormalizeDouble(value1-level,ind_digits)>=0 && NormalizeDouble(value0-level0,ind_digits)<0)
      return LINE_STATE_CROSS_DOWN;
//--- The line touched the level from below (value1<level0 && value0==level0)
   if(NormalizeDouble(value1-level,ind_digits)<0 && NormalizeDouble(value0-level0,ind_digits)==0)
      return LINE_STATE_TOUCH_BELOW;
//--- The line touched the level from above (value1>level0 && value0==level0)
   if(NormalizeDouble(value1-level,ind_digits)>0 && NormalizeDouble(value0-level0,ind_digits)==0)
      return LINE_STATE_TOUCH_BELOW;
//--- Line is equal to the level value (value1==level0 && value0==level0)
   if(NormalizeDouble(value1-level,ind_digits)==0 && NormalizeDouble(value0-level0,ind_digits)==0)
      return LINE_STATE_EQUALS;
//--- Undefined state
   return LINE_STATE_NONE;
  }
//+------------------------------------------------------------------+
//| Return the indicator line state description                      |
//+------------------------------------------------------------------+
string LineStateDescription(const ENUM_LINE_STATE state)
  {
   switch(state)
     {
      case LINE_STATE_UP         :  return "Up";
      case LINE_STATE_STOP_UP    :  return "Stop Up";
      case LINE_STATE_TURN_UP    :  return "Turn Up";
      case LINE_STATE_DOWN       :  return "Down";
      case LINE_STATE_STOP_DOWN  :  return "Stop Down";
      case LINE_STATE_TURN_DOWN  :  return "Turn Down";
      case LINE_STATE_ABOVE      :  return "Above level";
      case LINE_STATE_UNDER      :  return "Under level";
      case LINE_STATE_CROSS_UP   :  return "Crossing Up";
      case LINE_STATE_CROSS_DOWN :  return "Crossing Down";
      case LINE_STATE_TOUCH_BELOW:  return "Touch from Below";
      case LINE_STATE_TOUCH_ABOVE:  return "Touch from Above";
      case LINE_STATE_EQUALS     :  return "Equals";
      default                    :  return "Unknown";
     }
  }
Wenn wir das Dashboard verwenden, werden die Daten mit Hilfe der Funktion auf dem Bedienfeld angezeigt:
//+------------------------------------------------------------------+
//| Display data from the specified timeseries index to the panel    |
//+------------------------------------------------------------------+
void DrawData(const int index,const datetime time)
  {
//--- Declare the variables to receive data in them
   MqlTick  tick={0};
   MqlRates rates[1];

//--- Exit if unable to get the current prices
   if(!SymbolInfoTick(Symbol(),tick))
      return;
//--- Exit if unable to get the bar data by the specified index
   if(CopyRates(Symbol(),PERIOD_CURRENT,index,1,rates)!=1)
      return;

//--- Set font parameters for bar and indicator data headers
   int  size=0;
   uint flags=0;
   uint angle=0;
   string name=panel.FontParams(size,flags,angle);
   panel.SetFontParams(name,9,FW_BOLD);
   panel.DrawText("Bar data ["+(string)index+"]",3,panel.TableY1(0)-16,clrMaroon,panel.Width()-6);
   panel.DrawText("Indicator data ["+(string)index+"]",3,panel.TableY1(1)-16,clrGreen,panel.Width()-6);
//--- Set font parameters for bar and indicator data
   panel.SetFontParams(name,9);

//--- Display the data of the specified bar in table 0 on the panel
   panel.DrawText("Date",  panel.CellX(0,0,0)+2, panel.CellY(0,0,0)+2); panel.DrawText(TimeToString(  rates[0].time,TIME_DATE),     panel.CellX(0,0,1)+2, panel.CellY(0,0,1)+2,clrNONE,90);
   panel.DrawText("Time",  panel.CellX(0,1,0)+2, panel.CellY(0,1,0)+2); panel.DrawText(TimeToString(  rates[0].time,TIME_MINUTES),  panel.CellX(0,1,1)+2, panel.CellY(0,1,1)+2,clrNONE,90);
   panel.DrawText("Open",  panel.CellX(0,2,0)+2, panel.CellY(0,2,0)+2); panel.DrawText(DoubleToString(rates[0].open,Digits()),      panel.CellX(0,2,1)+2, panel.CellY(0,2,1)+2,clrNONE,90);
   panel.DrawText("High",  panel.CellX(0,3,0)+2, panel.CellY(0,3,0)+2); panel.DrawText(DoubleToString(rates[0].high,Digits()),      panel.CellX(0,3,1)+2, panel.CellY(0,3,1)+2,clrNONE,90);
   panel.DrawText("Low",   panel.CellX(0,4,0)+2, panel.CellY(0,4,0)+2); panel.DrawText(DoubleToString(rates[0].low,Digits()),       panel.CellX(0,4,1)+2, panel.CellY(0,4,1)+2,clrNONE,90);
   panel.DrawText("Close", panel.CellX(0,5,0)+2, panel.CellY(0,5,0)+2); panel.DrawText(DoubleToString(rates[0].close,Digits()),     panel.CellX(0,5,1)+2, panel.CellY(0,5,1)+2,clrNONE,90);

//--- Display the indicator data from the specified bar on the panel in table 1
   panel.DrawText(ind_title, panel.CellX(1,0,0)+2, panel.CellY(1,0,0)+2);
   double value=IndicatorValue(handle,index,0);
   string value_str=(value!=EMPTY_VALUE ? DoubleToString(value,ind_digits) : "");
   panel.DrawText(value_str,panel.CellX(1,0,1)+2,panel.CellY(1,0,1)+2,clrNONE,90);

//--- Display a description of the indicator line state
   panel.DrawText("Line state", panel.CellX(1,1,0)+2, panel.CellY(1,1,0)+2);
   ENUM_LINE_STATE state=LineState(handle,index,0);
   panel.DrawText(LineStateDescription(state),panel.CellX(1,1,1)+2,panel.CellY(1,1,1)+2,clrNONE,90);

//--- Redraw the chart to immediately display all changes on the panel
   ChartRedraw(ChartID());
  }
Außerdem wird die Ereignisbehandlung des Panel von OnChartEvent() aufgerufen, und die Ereignisse für den Empfang des Balkenindex unter dem Cursor werden behandelt:
//+------------------------------------------------------------------+
//| ChartEvent function                                              |
//+------------------------------------------------------------------+
void OnChartEvent(const int id,
                  const long &lparam,
                  const double &dparam,
                  const string &sparam)
  {
//--- Handling the panel
//--- Call the panel event handler
   panel.OnChartEvent(id,lparam,dparam,sparam);

//--- If the cursor moves or a click is made on the chart
   if(id==CHARTEVENT_MOUSE_MOVE || id==CHARTEVENT_CLICK)
     {
      //--- Declare the variables to record time and price coordinates in them
      datetime time=0;
      double price=0;
      int wnd=0;
      //--- If the cursor coordinates are converted to date and time
      if(ChartXYToTimePrice(ChartID(),(int)lparam,(int)dparam,wnd,time,price))
        {
         //--- write the bar index where the cursor is located to a global variable
         mouse_bar_index=iBarShift(Symbol(),PERIOD_CURRENT,time);
         //--- Display the bar data under the cursor on the panel
         DrawData(mouse_bar_index,time);
        }
     }

//--- If we received a custom event, display the appropriate message in the journal
   if(id>CHARTEVENT_CUSTOM)
     {
      //--- Here we can implement handling a click on the close button on the panel
      PrintFormat("%s: Event id=%ld, object id (lparam): %lu, event message (sparam): %s",__FUNCTION__,id,lparam,sparam);
     }
  }
Nachdem wir den EA kompiliert und auf dem Chart gestartet haben, können wir den Status der Indikatorlinie auf dem Panel überwachen:
Die EA-Datei „TestOscillatorMomentum.mq5“ ist unten angehängt.
Gleitender Durchschnitt als Oszillator
Moving Average of Oscillator (OsMA) ist die Differenz zwischen dem Oszillator und der Glättung des Oszillators. In diesem Fall, wird die Basis-Linie des Oszillators Moving Average Convergence/Divergence und die Signal-Linie wird zur Glättung genutzt.
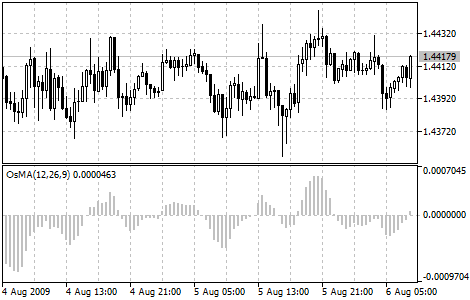
Parameter
Die Anzeige hat vier konfigurierte Parameter:
- Schneller EMA MACD Berechnungslänge, Standard — 12,
- Langsamer EMA MACD Berechnungslänge, Standard — 26,
- Signal SMA MACD Berechnungslänge, Standard — 9,
- MACD-Berechnungspreis, Standardwert — Schlusskurs.
Eingabe- und globale Variablen für die Verwendung des Indikators im EA:
//+------------------------------------------------------------------+
//|                                           TestOscillatorOsMA.mq5 |
//|                                  Copyright 2023, MetaQuotes Ltd. |
//|                                             https://www.mql5.com |
//+------------------------------------------------------------------+
#property copyright "Copyright 2023, MetaQuotes Ltd."
#property link      "https://www.mql5.com"
#property version   "1.00"
//--- enums
enum ENUM_LINE_STATE
  {
   LINE_STATE_NONE,        // Undefined state
   LINE_STATE_UP,          // Upward
   LINE_STATE_DOWN,        // Downward
   LINE_STATE_TURN_UP,     // Upward reversal
   LINE_STATE_TURN_DOWN,   // Downward reversal
   LINE_STATE_STOP_UP,     // Upward stop
   LINE_STATE_STOP_DOWN,   // Downward stop
   LINE_STATE_ABOVE,       // Above value
   LINE_STATE_UNDER,       // Below value
   LINE_STATE_CROSS_UP,    // Crossing value upwards
   LINE_STATE_CROSS_DOWN,  // Crossing value downwards
   LINE_STATE_TOUCH_BELOW, // Touching value from below
   LINE_STATE_TOUCH_ABOVE, // Touch value from above
   LINE_STATE_EQUALS,      // Equal to value
  };
//--- input parameters
input uint                 InpPeriodFast  =  12;            /* Fast MA Period */
input uint                 InpPeriodSlow  =  26;            /* Slow MA Period */
input uint                 InpPeriodSignal=  9;             /* MACD SMA       */
input ENUM_APPLIED_PRICE   InpAppliedPrice=  PRICE_CLOSE;   /* Applied Price  */
//--- global variables
int      handle=INVALID_HANDLE;  // Indicator handle
int      period_fast=0;          // Fast EMA calculation period
int      period_slow=0;          // Slow EMA calculation period
int      period_signal=0;        // Signal line calculation period
int      ind_digits=0;           // Number of decimal places in the indicator values
string   ind_title;              // Indicator description
Bei der Verwendung des Dashboards wird die Klassendatei des Panels eingebunden und die Variablen für die Arbeit mit dem Panel werden hinzugefügt:
//+------------------------------------------------------------------+
//|                                           TestOscillatorOsMA.mq5 |
//|                                  Copyright 2023, MetaQuotes Ltd. |
//|                                             https://www.mql5.com |
//+------------------------------------------------------------------+
#property copyright "Copyright 2023, MetaQuotes Ltd."
#property link      "https://www.mql5.com"
#property version   "1.00"
//--- includes
#include <Dashboard\Dashboard.mqh>
//--- enums
enum ENUM_LINE_STATE
  {
   LINE_STATE_NONE,        // Undefined state
   LINE_STATE_UP,          // Upward
   LINE_STATE_DOWN,        // Downward
   LINE_STATE_TURN_UP,     // Upward reversal
   LINE_STATE_TURN_DOWN,   // Downward reversal
   LINE_STATE_STOP_UP,     // Upward stop
   LINE_STATE_STOP_DOWN,   // Downward stop
   LINE_STATE_ABOVE,       // Above value
   LINE_STATE_UNDER,       // Below value
   LINE_STATE_CROSS_UP,    // Crossing value upwards
   LINE_STATE_CROSS_DOWN,  // Crossing value downwards
   LINE_STATE_TOUCH_BELOW, // Touching value from below
   LINE_STATE_TOUCH_ABOVE, // Touch value from above
   LINE_STATE_EQUALS,      // Equal to value
  };
//--- input parameters
input uint                 InpPeriodFast  =  12;            /* Fast MA Period */
input uint                 InpPeriodSlow  =  26;            /* Slow MA Period */
input uint                 InpPeriodSignal=  9;             /* MACD SMA       */
input ENUM_APPLIED_PRICE   InpAppliedPrice=  PRICE_CLOSE;   /* Applied Price  */
//--- global variables
int      handle=INVALID_HANDLE;  // Indicator handle
int      period_fast=0;          // Fast EMA calculation period
int      period_slow=0;          // Slow EMA calculation period
int      period_signal=0;        // Signal line calculation period
int      ind_digits=0;           // Number of decimal places in the indicator values
string   ind_title;              // Indicator description
//--- variables for the panel
int      mouse_bar_index;        // Index of the bar the data is taken from
CDashboard *panel=NULL;          // Pointer to the panel object
Initialisierung
OnInit() für die Initialisierung der Indikatorparameter und die Erstellung seines Handles:
//+------------------------------------------------------------------+
//| Expert initialization function                                   |
//+------------------------------------------------------------------+
int OnInit()
  {
//--- create timer
   EventSetTimer(60);

//--- Indicator
//--- Set and adjust the calculation period if necessary
   period_fast=int(InpPeriodFast<1 ? 12 : InpPeriodFast);
   period_slow=int(InpPeriodSlow<1 ? 26 : InpPeriodSlow==period_fast ? period_fast+1 : InpPeriodSlow);
   period_signal=int(InpPeriodSignal<1 ? 9 : InpPeriodSignal);
//--- Set the indicator name and the number of decimal places
   ind_title=StringFormat("OsMA(%lu,%lu,%lu)",period_fast,period_slow,period_signal);
   ind_digits=Digits()+2;
//--- Create indicator handle
   ResetLastError();
   handle=iOsMA(Symbol(),PERIOD_CURRENT,period_fast,period_slow,period_signal,InpAppliedPrice);
   if(handle==INVALID_HANDLE)
     {
      PrintFormat("%s: Failed to create indicator handle %s. Error %ld",__FUNCTION__,ind_title,GetLastError());
      return INIT_FAILED;
     }

//--- Successful initialization
   return(INIT_SUCCEEDED);
  }
Das Panel wird bei Verwendung des Dashboards erstellt:
//+------------------------------------------------------------------+
//| Expert initialization function                                   |
//+------------------------------------------------------------------+
int OnInit()
  {
//--- create timer
   EventSetTimer(60);

//--- Indicator
//--- Set and adjust the calculation period if necessary
   period_fast=int(InpPeriodFast<1 ? 12 : InpPeriodFast);
   period_slow=int(InpPeriodSlow<1 ? 26 : InpPeriodSlow==period_fast ? period_fast+1 : InpPeriodSlow);
   period_signal=int(InpPeriodSignal<1 ? 9 : InpPeriodSignal);
//--- Set the indicator name and the number of decimal places
   ind_title=StringFormat("OsMA(%lu,%lu,%lu)",period_fast,period_slow,period_signal);
   ind_digits=Digits()+2;
//--- Create indicator handle
   ResetLastError();
   handle=iOsMA(Symbol(),PERIOD_CURRENT,period_fast,period_slow,period_signal,InpAppliedPrice);
   if(handle==INVALID_HANDLE)
     {
      PrintFormat("%s: Failed to create indicator handle %s. Error %ld",__FUNCTION__,ind_title,GetLastError());
      return INIT_FAILED;
     }

//--- Dashboard
//--- Create the panel
   panel=new CDashboard(1,20,20,199,225);
   if(panel==NULL)
     {
      Print("Error. Failed to create panel object");
      return INIT_FAILED;
     }
//--- Set font parameters
   panel.SetFontParams("Calibri",9);
//--- Display the panel with the "Symbol, Timeframe description" header text
   panel.View(Symbol()+", "+StringSubstr(EnumToString(Period()),7));
//--- Create a table with ID 0 to display bar data in it
   panel.CreateNewTable(0);
//--- Draw a table with ID 0 on the panel background
   panel.DrawGrid(0,2,20,6,2,18,97);

//--- Create a table with ID 1 to display indicator data in it
   panel.CreateNewTable(1);
//--- Get the Y2 table coordinate with ID 0 and
//--- set the Y1 coordinate for the table with ID 1
   int y1=panel.TableY2(0)+22;
//--- Draw a table with ID 1 on the panel background
   panel.DrawGrid(1,2,y1,3,2,18,97);

//--- Display tabular data in the journal
   panel.GridPrint(0,2);
   panel.GridPrint(1,2);
//--- Initialize the variable with the index of the mouse cursor bar
   mouse_bar_index=0;
//--- Display the data of the current bar on the panel
   DrawData(mouse_bar_index,TimeCurrent());

//--- Successful initialization
   return(INIT_SUCCEEDED);
  }
Deinitialisierung
In OnDeinit() geben wir das Handle im EA wieder frei:
//+------------------------------------------------------------------+
//| Expert deinitialization function                                 |
//+------------------------------------------------------------------+
void OnDeinit(const int reason)
  {
//--- destroy timer
   EventKillTimer();

//--- Release handle of the indicator
   ResetLastError();
   if(!IndicatorRelease(handle))
      PrintFormat("%s: IndicatorRelease failed. Error %ld",__FUNCTION__,GetLastError());
//--- Clear all comments on the chart
   Comment("");
  }
Das erstellte Dashboard-Objekt wird bei der Verwendung des Dashboards entfernt:
//+------------------------------------------------------------------+
//| Expert deinitialization function                                 |
//+------------------------------------------------------------------+
void OnDeinit(const int reason)
  {
//--- destroy timer
   EventKillTimer();

//--- Release handle of the indicator
   ResetLastError();
   if(!IndicatorRelease(handle))
      PrintFormat("%s: IndicatorRelease failed. Error %ld",__FUNCTION__,GetLastError());
//--- Clear all comments on the chart
   Comment("");

//--- If the panel object exists, delete it
   if(panel!=NULL)
      delete panel;
  }
Abrufen von Daten
Allgemeine Funktionen zum Abrufen von Daten über das Indikatorhandle:
//+------------------------------------------------------------------+
//| Return the indicator data on the specified bar                   |
//+------------------------------------------------------------------+
double IndicatorValue(const int ind_handle,const int index,const int buffer_num)
  {
   double array[1]={0};
   ResetLastError();
   if(CopyBuffer(ind_handle,buffer_num,index,1,array)!=1)
     {
      PrintFormat("%s: CopyBuffer failed. Error %ld",__FUNCTION__,GetLastError());
      return EMPTY_VALUE;
     }
   return array[0];
  }
//+------------------------------------------------------------------+
//| Return the state of the indicator line                           |
//+------------------------------------------------------------------+
ENUM_LINE_STATE LineState(const int ind_handle,const int index,const int buffer_num)
  {
//--- Get the values of the indicator line with the shift (0,1,2) relative to the passed index
   const double value0=IndicatorValue(ind_handle,index,  buffer_num);
   const double value1=IndicatorValue(ind_handle,index+1,buffer_num);
   const double value2=IndicatorValue(ind_handle,index+2,buffer_num);
//--- If at least one of the values could not be obtained, return an undefined value
   if(value0==EMPTY_VALUE || value1==EMPTY_VALUE || value2==EMPTY_VALUE)
      return LINE_STATE_NONE;
//--- Line upward reversal (value2>value1 && value0>value1)
   if(NormalizeDouble(value2-value1,ind_digits)>0 && NormalizeDouble(value0-value1,ind_digits)>0)
      return LINE_STATE_TURN_UP;
//--- Line upward direction (value2<=value1 && value0>value1)
   else if(NormalizeDouble(value2-value1,ind_digits)<=0 && NormalizeDouble(value0-value1,ind_digits)>0)
      return LINE_STATE_UP;
//--- Line upward stop (value2<=value1 && value0==value1)
   else if(NormalizeDouble(value2-value1,ind_digits)<=0 && NormalizeDouble(value0-value1,ind_digits)==0)
      return LINE_STATE_STOP_UP;
//--- Line downward reversal (value2<value1 && value0<value1)
   if(NormalizeDouble(value2-value1,ind_digits)<0 && NormalizeDouble(value0-value1,ind_digits)<0)
      return LINE_STATE_TURN_DOWN;
//--- Line downward direction (value2>=value1 && value0<value1)
   else if(NormalizeDouble(value2-value1,ind_digits)>=0 && NormalizeDouble(value0-value1,ind_digits)<0)
      return LINE_STATE_DOWN;
//--- Line downward stop (value2>=value1 && value0==value1)
   else if(NormalizeDouble(value2-value1,ind_digits)>=0 && NormalizeDouble(value0-value1,ind_digits)==0)
      return LINE_STATE_STOP_DOWN;
//--- Undefined state
   return LINE_STATE_NONE;
  }
//+------------------------------------------------------------------+
//| Return the state of the line relative to the specified level     |
//+------------------------------------------------------------------+
ENUM_LINE_STATE LineStateRelative(const int ind_handle,const int index,const int buffer_num,const double level0,const double level1=EMPTY_VALUE)
  {
//--- Get the values of the indicator line with the shift (0,1) relative to the passed index
   const double value0=IndicatorValue(ind_handle,index,  buffer_num);
   const double value1=IndicatorValue(ind_handle,index+1,buffer_num);
//--- If at least one of the values could not be obtained, return an undefined value
   if(value0==EMPTY_VALUE || value1==EMPTY_VALUE)
      return LINE_STATE_NONE;
//--- Define the second level to compare
   double level=(level1==EMPTY_VALUE ? level0 : level1);
//--- The line is below the level (value1<level && value0<level0)
   if(NormalizeDouble(value1-level,ind_digits)<0 && NormalizeDouble(value0-level0,ind_digits)<0)
      return LINE_STATE_UNDER;
//--- The line is above the level (value1>level && value0>level0)
   if(NormalizeDouble(value1-level,ind_digits)>0 && NormalizeDouble(value0-level0,ind_digits)>0)
      return LINE_STATE_ABOVE;
//--- The line crossed the level upwards (value1<=level && value0>level0)
   if(NormalizeDouble(value1-level,ind_digits)<=0 && NormalizeDouble(value0-level0,ind_digits)>0)
      return LINE_STATE_CROSS_UP;
//--- The line crossed the level downwards (value1>=level && value0<level0)
   if(NormalizeDouble(value1-level,ind_digits)>=0 && NormalizeDouble(value0-level0,ind_digits)<0)
      return LINE_STATE_CROSS_DOWN;
//--- The line touched the level from below (value1<level0 && value0==level0)
   if(NormalizeDouble(value1-level,ind_digits)<0 && NormalizeDouble(value0-level0,ind_digits)==0)
      return LINE_STATE_TOUCH_BELOW;
//--- The line touched the level from above (value1>level0 && value0==level0)
   if(NormalizeDouble(value1-level,ind_digits)>0 && NormalizeDouble(value0-level0,ind_digits)==0)
      return LINE_STATE_TOUCH_BELOW;
//--- Line is equal to the level value (value1==level0 && value0==level0)
   if(NormalizeDouble(value1-level,ind_digits)==0 && NormalizeDouble(value0-level0,ind_digits)==0)
      return LINE_STATE_EQUALS;
//--- Undefined state
   return LINE_STATE_NONE;
  }
//+------------------------------------------------------------------+
//| Return the indicator line state description                      |
//+------------------------------------------------------------------+
string LineStateDescription(const ENUM_LINE_STATE state)
  {
   switch(state)
     {
      case LINE_STATE_UP         :  return "Up";
      case LINE_STATE_STOP_UP    :  return "Stop Up";
      case LINE_STATE_TURN_UP    :  return "Turn Up";
      case LINE_STATE_DOWN       :  return "Down";
      case LINE_STATE_STOP_DOWN  :  return "Stop Down";
      case LINE_STATE_TURN_DOWN  :  return "Turn Down";
      case LINE_STATE_ABOVE      :  return "Above level";
      case LINE_STATE_UNDER      :  return "Under level";
      case LINE_STATE_CROSS_UP   :  return "Crossing Up";
      case LINE_STATE_CROSS_DOWN :  return "Crossing Down";
      case LINE_STATE_TOUCH_BELOW:  return "Touch from Below";
      case LINE_STATE_TOUCH_ABOVE:  return "Touch from Above";
      case LINE_STATE_EQUALS     :  return "Equals";
      default                    :  return "Unknown";
     }
  }
Wenn wir das Dashboard verwenden, werden die Daten mit Hilfe der Funktion auf dem Bedienfeld angezeigt:
//+------------------------------------------------------------------+
//| Display data from the specified timeseries index to the panel    |
//+------------------------------------------------------------------+
void DrawData(const int index,const datetime time)
  {
//--- Declare the variables to receive data in them
   MqlTick  tick={0};
   MqlRates rates[1];

//--- Exit if unable to get the current prices
   if(!SymbolInfoTick(Symbol(),tick))
      return;
//--- Exit if unable to get the bar data by the specified index
   if(CopyRates(Symbol(),PERIOD_CURRENT,index,1,rates)!=1)
      return;

//--- Set font parameters for bar and indicator data headers
   int  size=0;
   uint flags=0;
   uint angle=0;
   string name=panel.FontParams(size,flags,angle);
   panel.SetFontParams(name,9,FW_BOLD);
   panel.DrawText("Bar data ["+(string)index+"]",3,panel.TableY1(0)-16,clrMaroon,panel.Width()-6);
   panel.DrawText("Indicator data ["+(string)index+"]",3,panel.TableY1(1)-16,clrGreen,panel.Width()-6);
//--- Set font parameters for bar and indicator data
   panel.SetFontParams(name,9);

//--- Display the data of the specified bar in table 0 on the panel
   panel.DrawText("Date",  panel.CellX(0,0,0)+2, panel.CellY(0,0,0)+2); panel.DrawText(TimeToString(  rates[0].time,TIME_DATE),     panel.CellX(0,0,1)+2, panel.CellY(0,0,1)+2,clrNONE,90);
   panel.DrawText("Time",  panel.CellX(0,1,0)+2, panel.CellY(0,1,0)+2); panel.DrawText(TimeToString(  rates[0].time,TIME_MINUTES),  panel.CellX(0,1,1)+2, panel.CellY(0,1,1)+2,clrNONE,90);
   panel.DrawText("Open",  panel.CellX(0,2,0)+2, panel.CellY(0,2,0)+2); panel.DrawText(DoubleToString(rates[0].open,Digits()),      panel.CellX(0,2,1)+2, panel.CellY(0,2,1)+2,clrNONE,90);
   panel.DrawText("High",  panel.CellX(0,3,0)+2, panel.CellY(0,3,0)+2); panel.DrawText(DoubleToString(rates[0].high,Digits()),      panel.CellX(0,3,1)+2, panel.CellY(0,3,1)+2,clrNONE,90);
   panel.DrawText("Low",   panel.CellX(0,4,0)+2, panel.CellY(0,4,0)+2); panel.DrawText(DoubleToString(rates[0].low,Digits()),       panel.CellX(0,4,1)+2, panel.CellY(0,4,1)+2,clrNONE,90);
   panel.DrawText("Close", panel.CellX(0,5,0)+2, panel.CellY(0,5,0)+2); panel.DrawText(DoubleToString(rates[0].close,Digits()),     panel.CellX(0,5,1)+2, panel.CellY(0,5,1)+2,clrNONE,90);

//--- Display the indicator data from the specified bar on the panel in table 1
   panel.DrawText(ind_title, panel.CellX(1,0,0)+2, panel.CellY(1,0,0)+2);
   double value=IndicatorValue(handle,index,0);
   string value_str=(value!=EMPTY_VALUE ? DoubleToString(value,ind_digits) : "");
   panel.DrawText(value_str,panel.CellX(1,0,1)+2,panel.CellY(1,0,1)+2,clrNONE,90);

//--- Display a description of the indicator line state
   panel.DrawText("Line state", panel.CellX(1,1,0)+2, panel.CellY(1,1,0)+2);
   ENUM_LINE_STATE state=LineState(handle,index,0);
//--- The label color changes depending on the value of the line above/below zero
   color clr=(value<0 ? clrRed : value>0 ? clrBlue : clrNONE);
   panel.DrawText(LineStateDescription(state),panel.CellX(1,1,1)+2,panel.CellY(1,1,1)+2,clr,90);

//--- Display a description of the indicator line state relative to zero
   panel.DrawText("OsMA vs Zero", panel.CellX(1,2,0)+2, panel.CellY(1,2,0)+2);
   ENUM_LINE_STATE state_zero=LineStateRelative(handle,index,0,0);
   string state_zero_str=
     (
      state_zero==LINE_STATE_ABOVE        ?  "OsMA > 0"  :
      state_zero==LINE_STATE_UNDER        ?  "OsMA < 0"  :
      state_zero==LINE_STATE_TOUCH_ABOVE  ||
      state_zero==LINE_STATE_TOUCH_BELOW  ?  "Touch"     :
      LineStateDescription(state_zero)
     );
//--- The label color changes depending on the value of the line relative to the level
   clr=(state_zero==LINE_STATE_CROSS_UP ? clrBlue : state_zero==LINE_STATE_CROSS_DOWN ? clrRed : clrNONE);
   panel.DrawText(state_zero_str,panel.CellX(1,2,1)+2,panel.CellY(1,2,1)+2,clr,90);

//--- Redraw the chart to immediately display all changes on the panel
   ChartRedraw(ChartID());
  }
Die Zustände der Anzeigelinie und ihre Position relativ zum Nullpunkt werden auf dem Dashboard farblich hervorgehoben.
Außerdem wird die Ereignisbehandlung des Panel von OnChartEvent() aufgerufen, und die Ereignisse für den Empfang des Balkenindex unter dem Cursor werden behandelt:
//+------------------------------------------------------------------+
//| ChartEvent function                                              |
//+------------------------------------------------------------------+
void OnChartEvent(const int id,
                  const long &lparam,
                  const double &dparam,
                  const string &sparam)
  {
//--- Handling the panel
//--- Call the panel event handler
   panel.OnChartEvent(id,lparam,dparam,sparam);

//--- If the cursor moves or a click is made on the chart
   if(id==CHARTEVENT_MOUSE_MOVE || id==CHARTEVENT_CLICK)
     {
      //--- Declare the variables to record time and price coordinates in them
      datetime time=0;
      double price=0;
      int wnd=0;
      //--- If the cursor coordinates are converted to date and time
      if(ChartXYToTimePrice(ChartID(),(int)lparam,(int)dparam,wnd,time,price))
        {
         //--- write the bar index where the cursor is located to a global variable
         mouse_bar_index=iBarShift(Symbol(),PERIOD_CURRENT,time);
         //--- Display the bar data under the cursor on the panel
         DrawData(mouse_bar_index,time);
        }
     }

//--- If we received a custom event, display the appropriate message in the journal
   if(id>CHARTEVENT_CUSTOM)
     {
      //--- Here we can implement handling a click on the close button on the panel
      PrintFormat("%s: Event id=%ld, object id (lparam): %lu, event message (sparam): %s",__FUNCTION__,id,lparam,sparam);
     }
  }
Nachdem wir den EA kompiliert und auf dem Chart gestartet haben, können wir den Status der Indikatorlinie auf dem Panel überwachen:
Die EA-Datei „TestOscillatorOsMA.mq5“ ist unten angehängt.
RSI (Relative Strength Index)
Der Relative Strength Index (RSI) ist ein dem Preis folgender Oszillator, der zwischen 0 und 100 liegt. Beschreibung des Index der relativen Stärke, J. W. Wilder empfahl die Verwendung der 14-Perioden-Version. Seitdem haben der 9-periodische und 25-periodische RSI an Beliebtheit gewonnen. Eine der üblichen Methoden zur Analyse des Relative Strength Index-Indikators besteht darin, nach Divergenzen zu suchen, wenn der Kurs ein neues Maximum bildet und der RSI das Niveau seines vorherigen Maximums nicht überwindet. Eine solche Divergenz deutet auf die Wahrscheinlichkeit einer Kursumkehr hin. Wenn der Indikator dann nach unten dreht und unter seinen Tiefpunkt fällt, vollendet er einen so genannten „falscher Ausbruch“. Dieser fehlgeschlagene Bewegung gilt als Bestätigung dafür, dass eine Kursumkehr unmittelbar bevorsteht.
Die folgenden Signale des RSI werden für die Chart-Analyse genutzt:
- Hochs und Tiefs
Der Relative-Stärke-Index erreicht in der Regel einen Höchststand von über 70 und einen Tiefststand von unter 30. Diese Hochs und Tiefs werden in der Regel bereits vor dem aktuellen Preis-Chart gebildet. - Chart-Formationen
Der RSI bildet oft Chartmuster wie Kopf und Schultern oder Dreiecke, die auf dem Preischart sichtbar sein können oder auch nicht. - Falscher Ausbruch (Durchbruch der Unterstützung oder des Widerstands)
Dies ist der Fall, wenn der Relative-Stärke-Index ein früheres Hoch (Peak) übersteigt oder unter ein jüngstes Tief (Trough) fällt. - Unterstützungs- und Widerstandsniveaus
Der Relative-Stärke-Index zeigt, manchmal deutlicher als die Kurse selbst, Unterstützungs- und Widerstandsniveaus an. - Divergenzen
Wie bereits erwähnt, treten Divergenzen auf, wenn der Kurs ein neues Hoch (oder Tief) erreicht, das nicht durch ein neues Hoch (oder Tief) im Relative Strength Index bestätigt wird. Der Preis korrigiert normalerweise in die Richtung des RSI.
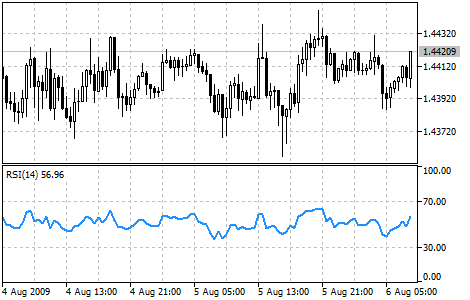
Parameter
Der Indikator hat zwei Parameter:
- Berechnungslänge, Standard — 14,
- Berechnungspreis, Standard — Schlusskurs.
Da die überkauften/überverkauften Bereiche für die Suche nach Indikatorsignalen verwendet werden, werden wir ihre Werte auch als EA-Inputs verwenden.
Eingabe- und globale Variablen für die Verwendung des Indikators im EA:
//+------------------------------------------------------------------+
//|                                            TestOscillatorRSI.mq5 |
//|                                  Copyright 2023, MetaQuotes Ltd. |
//|                                             https://www.mql5.com |
//+------------------------------------------------------------------+
#property copyright "Copyright 2023, MetaQuotes Ltd."
#property link      "https://www.mql5.com"
#property version   "1.00"
//--- enums
enum ENUM_LINE_STATE
  {
   LINE_STATE_NONE,        // Undefined state
   LINE_STATE_UP,          // Upward
   LINE_STATE_DOWN,        // Downward
   LINE_STATE_TURN_UP,     // Upward reversal
   LINE_STATE_TURN_DOWN,   // Downward reversal
   LINE_STATE_STOP_UP,     // Upward stop
   LINE_STATE_STOP_DOWN,   // Downward stop
   LINE_STATE_ABOVE,       // Above value
   LINE_STATE_UNDER,       // Below value
   LINE_STATE_CROSS_UP,    // Crossing value upwards
   LINE_STATE_CROSS_DOWN,  // Crossing value downwards
   LINE_STATE_TOUCH_BELOW, // Touching value from below
   LINE_STATE_TOUCH_ABOVE, // Touch value from above
   LINE_STATE_EQUALS,      // Equal to value
  };
//--- input parameters
input uint                 InpPeriod=  14;            /* Period         */
input ENUM_APPLIED_PRICE   InpPrice =  PRICE_CLOSE;   /* Applied Price  */
input double               InpOverbough=  70;         /* Overbough level*/
input double               InpOversold =  30;         /* Oversold level */
//--- global variables
int      handle=INVALID_HANDLE;  // Indicator handle
int      period=0;               // RSI calculation period
int      ind_digits=0;           // Number of decimal places in the indicator values
double   overbough=0;            // Overbought level
double   oversold=0;             // Oversold level
string   ind_title;              // Indicator description
Bei der Verwendung des Dashboards wird die Klassendatei des Panels eingebunden und die Variablen für die Arbeit mit dem Panel werden hinzugefügt:
//+------------------------------------------------------------------+
//|                                            TestOscillatorRSI.mq5 |
//|                                  Copyright 2023, MetaQuotes Ltd. |
//|                                             https://www.mql5.com |
//+------------------------------------------------------------------+
#property copyright "Copyright 2023, MetaQuotes Ltd."
#property link      "https://www.mql5.com"
#property version   "1.00"
//--- includes
#include <Dashboard\Dashboard.mqh>
//--- enums
enum ENUM_LINE_STATE
  {
   LINE_STATE_NONE,        // Undefined state
   LINE_STATE_UP,          // Upward
   LINE_STATE_DOWN,        // Downward
   LINE_STATE_TURN_UP,     // Upward reversal
   LINE_STATE_TURN_DOWN,   // Downward reversal
   LINE_STATE_STOP_UP,     // Upward stop
   LINE_STATE_STOP_DOWN,   // Downward stop
   LINE_STATE_ABOVE,       // Above value
   LINE_STATE_UNDER,       // Below value
   LINE_STATE_CROSS_UP,    // Crossing value upwards
   LINE_STATE_CROSS_DOWN,  // Crossing value downwards
   LINE_STATE_TOUCH_BELOW, // Touching value from below
   LINE_STATE_TOUCH_ABOVE, // Touch value from above
   LINE_STATE_EQUALS,      // Equal to value
  };
//--- input parameters
input uint                 InpPeriod=  14;            /* Period         */
input ENUM_APPLIED_PRICE   InpPrice =  PRICE_CLOSE;   /* Applied Price  */
input double               InpOverbough=  70;         /* Overbough level*/
input double               InpOversold =  30;         /* Oversold level */
//--- global variables
int      handle=INVALID_HANDLE;  // Indicator handle
int      period=0;               // RSI calculation period
int      ind_digits=0;           // Number of decimal places in the indicator values
double   overbough=0;            // Overbought level
double   oversold=0;             // Oversold level
string   ind_title;              // Indicator description
//--- variables for the panel
int      mouse_bar_index;        // Index of the bar the data is taken from
CDashboard *panel=NULL;          // Pointer to the panel object
Initialisierung
OnInit() für die Initialisierung der Indikatorparameter und die Erstellung seines Handles:
//+------------------------------------------------------------------+
//| Expert initialization function                                   |
//+------------------------------------------------------------------+
int OnInit()
  {
//--- create timer
   EventSetTimer(60);

//--- Indicator
//--- Set and adjust the calculation period and levels if necessary
   period=int(InpPeriod<1 ? 14 : InpPeriod<2 ? 2 : InpPeriod);
   overbough=InpOverbough;
   oversold=(InpOversold>=overbough ? overbough-0.01 : InpOversold);
//--- Set the indicator name and the number of decimal places
   ind_title=StringFormat("RSI(%lu)",period);
   ind_digits=2;
//--- Create indicator handle
   ResetLastError();
   handle=iRSI(Symbol(),PERIOD_CURRENT,period,InpPrice);
   if(handle==INVALID_HANDLE)
     {
      PrintFormat("%s: Failed to create indicator handle %s. Error %ld",__FUNCTION__,ind_title,GetLastError());
      return INIT_FAILED;
     }

//--- Successful initialization
   return(INIT_SUCCEEDED);
  }
Das Panel wird bei Verwendung des Dashboards erstellt:
//+------------------------------------------------------------------+
//| Expert initialization function                                   |
//+------------------------------------------------------------------+
int OnInit()
  {
//--- create timer
   EventSetTimer(60);

//--- Indicator
//--- Set and adjust the calculation period and levels if necessary
   period=int(InpPeriod<1 ? 14 : InpPeriod<2 ? 2 : InpPeriod);
   overbough=InpOverbough;
   oversold=(InpOversold>=overbough ? overbough-0.01 : InpOversold);
//--- Set the indicator name and the number of decimal places
   ind_title=StringFormat("RSI(%lu)",period);
   ind_digits=2;
//--- Create indicator handle
   ResetLastError();
   handle=iRSI(Symbol(),PERIOD_CURRENT,period,InpPrice);
   if(handle==INVALID_HANDLE)
     {
      PrintFormat("%s: Failed to create indicator handle %s. Error %ld",__FUNCTION__,ind_title,GetLastError());
      return INIT_FAILED;
     }

//--- Dashboard
//--- Create the panel
   panel=new CDashboard(1,20,20,229,243);
   if(panel==NULL)
     {
      Print("Error. Failed to create panel object");
      return INIT_FAILED;
     }
//--- Set font parameters
   panel.SetFontParams("Calibri",9);
//--- Display the panel with the "Symbol, Timeframe description" header text
   panel.View(Symbol()+", "+StringSubstr(EnumToString(Period()),7));
//--- Create a table with ID 0 to display bar data in it
   panel.CreateNewTable(0);
//--- Draw a table with ID 0 on the panel background
   panel.DrawGrid(0,2,20,6,2,18,112);

//--- Create a table with ID 1 to display indicator data in it
   panel.CreateNewTable(1);
//--- Get the Y2 table coordinate with ID 0 and
//--- set the Y1 coordinate for the table with ID 1
   int y1=panel.TableY2(0)+22;
//--- Draw a table with ID 1 on the panel background
   panel.DrawGrid(1,2,y1,4,2,18,112);

//--- Display tabular data in the journal
   panel.GridPrint(0,2);
   panel.GridPrint(1,2);
//--- Initialize the variable with the index of the mouse cursor bar
   mouse_bar_index=0;
//--- Display the data of the current bar on the panel
   DrawData(mouse_bar_index,TimeCurrent());

//--- Successful initialization
   return(INIT_SUCCEEDED);
  }
Deinitialisierung
In OnDeinit() geben wir das Handle im EA wieder frei:
//+------------------------------------------------------------------+
//| Expert deinitialization function                                 |
//+------------------------------------------------------------------+
void OnDeinit(const int reason)
  {
//--- destroy timer
   EventKillTimer();

//--- Release handle of the indicator
   ResetLastError();
   if(!IndicatorRelease(handle))
      PrintFormat("%s: IndicatorRelease failed. Error %ld",__FUNCTION__,GetLastError());
//--- Clear all comments on the chart
   Comment("");
  }
Das erstellte Dashboard-Objekt wird bei der Verwendung des Dashboards entfernt:
//+------------------------------------------------------------------+
//| Expert deinitialization function                                 |
//+------------------------------------------------------------------+
void OnDeinit(const int reason)
  {
//--- destroy timer
   EventKillTimer();

//--- Release handle of the indicator
   ResetLastError();
   if(!IndicatorRelease(handle))
      PrintFormat("%s: IndicatorRelease failed. Error %ld",__FUNCTION__,GetLastError());
//--- Clear all comments on the chart
   Comment("");

//--- If the panel object exists, delete it
   if(panel!=NULL)
      delete panel;
  }
Abrufen von Daten
Allgemeine Funktionen zum Abrufen von Daten über das Indikatorhandle:
//+------------------------------------------------------------------+
//| Return the indicator data on the specified bar                   |
//+------------------------------------------------------------------+
double IndicatorValue(const int ind_handle,const int index,const int buffer_num)
  {
   double array[1]={0};
   ResetLastError();
   if(CopyBuffer(ind_handle,buffer_num,index,1,array)!=1)
     {
      PrintFormat("%s: CopyBuffer failed. Error %ld",__FUNCTION__,GetLastError());
      return EMPTY_VALUE;
     }
   return array[0];
  }
//+------------------------------------------------------------------+
//| Return the state of the indicator line                           |
//+------------------------------------------------------------------+
ENUM_LINE_STATE LineState(const int ind_handle,const int index,const int buffer_num)
  {
//--- Get the values of the indicator line with the shift (0,1,2) relative to the passed index
   const double value0=IndicatorValue(ind_handle,index,  buffer_num);
   const double value1=IndicatorValue(ind_handle,index+1,buffer_num);
   const double value2=IndicatorValue(ind_handle,index+2,buffer_num);
//--- If at least one of the values could not be obtained, return an undefined value
   if(value0==EMPTY_VALUE || value1==EMPTY_VALUE || value2==EMPTY_VALUE)
      return LINE_STATE_NONE;
//--- Line upward reversal (value2>value1 && value0>value1)
   if(NormalizeDouble(value2-value1,ind_digits)>0 && NormalizeDouble(value0-value1,ind_digits)>0)
      return LINE_STATE_TURN_UP;
//--- Line upward direction (value2<=value1 && value0>value1)
   else if(NormalizeDouble(value2-value1,ind_digits)<=0 && NormalizeDouble(value0-value1,ind_digits)>0)
      return LINE_STATE_UP;
//--- Line upward stop (value2<=value1 && value0==value1)
   else if(NormalizeDouble(value2-value1,ind_digits)<=0 && NormalizeDouble(value0-value1,ind_digits)==0)
      return LINE_STATE_STOP_UP;
//--- Line downward reversal (value2<value1 && value0<value1)
   if(NormalizeDouble(value2-value1,ind_digits)<0 && NormalizeDouble(value0-value1,ind_digits)<0)
      return LINE_STATE_TURN_DOWN;
//--- Line downward direction (value2>=value1 && value0<value1)
   else if(NormalizeDouble(value2-value1,ind_digits)>=0 && NormalizeDouble(value0-value1,ind_digits)<0)
      return LINE_STATE_DOWN;
//--- Line downward stop (value2>=value1 && value0==value1)
   else if(NormalizeDouble(value2-value1,ind_digits)>=0 && NormalizeDouble(value0-value1,ind_digits)==0)
      return LINE_STATE_STOP_DOWN;
//--- Undefined state
   return LINE_STATE_NONE;
  }
//+------------------------------------------------------------------+
//| Return the state of the line relative to the specified level     |
//+------------------------------------------------------------------+
ENUM_LINE_STATE LineStateRelative(const int ind_handle,const int index,const int buffer_num,const double level0,const double level1=EMPTY_VALUE)
  {
//--- Get the values of the indicator line with the shift (0,1) relative to the passed index
   const double value0=IndicatorValue(ind_handle,index,  buffer_num);
   const double value1=IndicatorValue(ind_handle,index+1,buffer_num);
//--- If at least one of the values could not be obtained, return an undefined value
   if(value0==EMPTY_VALUE || value1==EMPTY_VALUE)
      return LINE_STATE_NONE;
//--- Define the second level to compare
   double level=(level1==EMPTY_VALUE ? level0 : level1);
//--- The line is below the level (value1<level && value0<level0)
   if(NormalizeDouble(value1-level,ind_digits)<0 && NormalizeDouble(value0-level0,ind_digits)<0)
      return LINE_STATE_UNDER;
//--- The line is above the level (value1>level && value0>level0)
   if(NormalizeDouble(value1-level,ind_digits)>0 && NormalizeDouble(value0-level0,ind_digits)>0)
      return LINE_STATE_ABOVE;
//--- The line crossed the level upwards (value1<=level && value0>level0)
   if(NormalizeDouble(value1-level,ind_digits)<=0 && NormalizeDouble(value0-level0,ind_digits)>0)
      return LINE_STATE_CROSS_UP;
//--- The line crossed the level downwards (value1>=level && value0<level0)
   if(NormalizeDouble(value1-level,ind_digits)>=0 && NormalizeDouble(value0-level0,ind_digits)<0)
      return LINE_STATE_CROSS_DOWN;
//--- The line touched the level from below (value1<level0 && value0==level0)
   if(NormalizeDouble(value1-level,ind_digits)<0 && NormalizeDouble(value0-level0,ind_digits)==0)
      return LINE_STATE_TOUCH_BELOW;
//--- The line touched the level from above (value1>level0 && value0==level0)
   if(NormalizeDouble(value1-level,ind_digits)>0 && NormalizeDouble(value0-level0,ind_digits)==0)
      return LINE_STATE_TOUCH_BELOW;
//--- Line is equal to the level value (value1==level0 && value0==level0)
   if(NormalizeDouble(value1-level,ind_digits)==0 && NormalizeDouble(value0-level0,ind_digits)==0)
      return LINE_STATE_EQUALS;
//--- Undefined state
   return LINE_STATE_NONE;
  }
//+------------------------------------------------------------------+
//| Return the indicator line state description                      |
//+------------------------------------------------------------------+
string LineStateDescription(const ENUM_LINE_STATE state)
  {
   switch(state)
     {
      case LINE_STATE_UP         :  return "Up";
      case LINE_STATE_STOP_UP    :  return "Stop Up";
      case LINE_STATE_TURN_UP    :  return "Turn Up";
      case LINE_STATE_DOWN       :  return "Down";
      case LINE_STATE_STOP_DOWN  :  return "Stop Down";
      case LINE_STATE_TURN_DOWN  :  return "Turn Down";
      case LINE_STATE_ABOVE      :  return "Above level";
      case LINE_STATE_UNDER      :  return "Under level";
      case LINE_STATE_CROSS_UP   :  return "Crossing Up";
      case LINE_STATE_CROSS_DOWN :  return "Crossing Down";
      case LINE_STATE_TOUCH_BELOW:  return "Touch from Below";
      case LINE_STATE_TOUCH_ABOVE:  return "Touch from Above";
      case LINE_STATE_EQUALS     :  return "Equals";
      default                    :  return "Unknown";
     }
  }
Wenn wir das Dashboard verwenden, werden die Daten mit Hilfe der Funktion auf dem Bedienfeld angezeigt:
//+------------------------------------------------------------------+
//| Display data from the specified timeseries index to the panel    |
//+------------------------------------------------------------------+
void DrawData(const int index,const datetime time)
  {
//--- Declare the variables to receive data in them
   MqlTick  tick={0};
   MqlRates rates[1];

//--- Exit if unable to get the current prices
   if(!SymbolInfoTick(Symbol(),tick))
      return;
//--- Exit if unable to get the bar data by the specified index
   if(CopyRates(Symbol(),PERIOD_CURRENT,index,1,rates)!=1)
      return;

//--- Set font parameters for bar and indicator data headers
   int  size=0;
   uint flags=0;
   uint angle=0;
   string name=panel.FontParams(size,flags,angle);
   panel.SetFontParams(name,9,FW_BOLD);
   panel.DrawText("Bar data ["+(string)index+"]",3,panel.TableY1(0)-16,clrMaroon,panel.Width()-6);
   panel.DrawText("Indicator data ["+(string)index+"]",3,panel.TableY1(1)-16,clrGreen,panel.Width()-6);
//--- Set font parameters for bar and indicator data
   panel.SetFontParams(name,9);

//--- Display the data of the specified bar in table 0 on the panel
   panel.DrawText("Date",  panel.CellX(0,0,0)+2, panel.CellY(0,0,0)+2); panel.DrawText(TimeToString(  rates[0].time,TIME_DATE),     panel.CellX(0,0,1)+2, panel.CellY(0,0,1)+2,clrNONE,90);
   panel.DrawText("Time",  panel.CellX(0,1,0)+2, panel.CellY(0,1,0)+2); panel.DrawText(TimeToString(  rates[0].time,TIME_MINUTES),  panel.CellX(0,1,1)+2, panel.CellY(0,1,1)+2,clrNONE,90);
   panel.DrawText("Open",  panel.CellX(0,2,0)+2, panel.CellY(0,2,0)+2); panel.DrawText(DoubleToString(rates[0].open,Digits()),      panel.CellX(0,2,1)+2, panel.CellY(0,2,1)+2,clrNONE,90);
   panel.DrawText("High",  panel.CellX(0,3,0)+2, panel.CellY(0,3,0)+2); panel.DrawText(DoubleToString(rates[0].high,Digits()),      panel.CellX(0,3,1)+2, panel.CellY(0,3,1)+2,clrNONE,90);
   panel.DrawText("Low",   panel.CellX(0,4,0)+2, panel.CellY(0,4,0)+2); panel.DrawText(DoubleToString(rates[0].low,Digits()),       panel.CellX(0,4,1)+2, panel.CellY(0,4,1)+2,clrNONE,90);
   panel.DrawText("Close", panel.CellX(0,5,0)+2, panel.CellY(0,5,0)+2); panel.DrawText(DoubleToString(rates[0].close,Digits()),     panel.CellX(0,5,1)+2, panel.CellY(0,5,1)+2,clrNONE,90);

//--- Display the indicator data from the specified bar on the panel in table 1
   panel.DrawText(ind_title, panel.CellX(1,0,0)+2, panel.CellY(1,0,0)+2);
   double value=IndicatorValue(handle,index,0);
   string value_str=(value!=EMPTY_VALUE ? DoubleToString(value,ind_digits) : "");
   panel.DrawText(value_str,panel.CellX(1,0,1)+2,panel.CellY(1,0,1)+2,clrNONE,100);

//--- Display a description of the indicator line state relative to the overbought level
   string ovb=StringFormat("%+.2f",overbough);
   panel.DrawText("Overbough", panel.CellX(1,2,0)+2, panel.CellY(1,2,0)+2);
   panel.DrawText(ovb, panel.CellX(1,2,0)+66, panel.CellY(1,2,0)+2);
   ENUM_LINE_STATE state_ovb=LineStateRelative(handle,index,0,overbough);
//--- The label color changes depending on the value of the line relative to the level
   color clr=(state_ovb==LINE_STATE_CROSS_DOWN ? clrRed : clrNONE);
   string ovb_str=(state_ovb==LINE_STATE_ABOVE ? "Inside the area" : LineStateDescription(state_ovb));
   panel.DrawText(ovb_str,panel.CellX(1,2,1)+2,panel.CellY(1,2,1)+2,clr,100);

//--- Display a description of the indicator line state relative to the oversold level
   panel.DrawText("Oversold", panel.CellX(1,3,0)+2, panel.CellY(1,3,0)+2);
   string ovs=StringFormat("%+.2f",oversold);
   panel.DrawText(ovs, panel.CellX(1,3,0)+68, panel.CellY(1,3,0)+2);
   ENUM_LINE_STATE state_ovs=LineStateRelative(handle,index,0,oversold);
//--- The label color changes depending on the value of the line relative to the level
   clr=(state_ovs==LINE_STATE_CROSS_UP ? clrBlue : clrNONE);
   string ovs_str=(state_ovs==LINE_STATE_UNDER ? "Inside the area" : LineStateDescription(state_ovs));
   panel.DrawText(ovs_str,panel.CellX(1,3,1)+2,panel.CellY(1,3,1)+2,clr,100);

//--- Display a description of the indicator line state
   panel.DrawText("Line state", panel.CellX(1,1,0)+2, panel.CellY(1,1,0)+2);
   ENUM_LINE_STATE state=LineState(handle,index,0);
//--- The label color changes depending on the location of the line in the overbought/oversold areas
   clr=(state_ovb==LINE_STATE_ABOVE || state_ovb==LINE_STATE_CROSS_DOWN ? clrRed : state_ovs==LINE_STATE_UNDER || state_ovs==LINE_STATE_CROSS_UP ? clrBlue : clrNONE);
   panel.DrawText(LineStateDescription(state),panel.CellX(1,1,1)+2,panel.CellY(1,1,1)+2,clr,100);

//--- Redraw the chart to immediately display all changes on the panel
   ChartRedraw(ChartID());
  }
Die Lage der Linie in den überkauften/überverkauften Zonen sowie der Zustand der Linie im Verhältnis zu den Niveaus sind im Panel farblich gekennzeichnet.
Außerdem wird die Ereignisbehandlung des Panel von OnChartEvent() aufgerufen, und die Ereignisse für den Empfang des Balkenindex unter dem Cursor werden behandelt:
//+------------------------------------------------------------------+
//| ChartEvent function                                              |
//+------------------------------------------------------------------+
void OnChartEvent(const int id,
                  const long &lparam,
                  const double &dparam,
                  const string &sparam)
  {
//--- Handling the panel
//--- Call the panel event handler
   panel.OnChartEvent(id,lparam,dparam,sparam);

//--- If the cursor moves or a click is made on the chart
   if(id==CHARTEVENT_MOUSE_MOVE || id==CHARTEVENT_CLICK)
     {
      //--- Declare the variables to record time and price coordinates in them
      datetime time=0;
      double price=0;
      int wnd=0;
      //--- If the cursor coordinates are converted to date and time
      if(ChartXYToTimePrice(ChartID(),(int)lparam,(int)dparam,wnd,time,price))
        {
         //--- write the bar index where the cursor is located to a global variable
         mouse_bar_index=iBarShift(Symbol(),PERIOD_CURRENT,time);
         //--- Display the bar data under the cursor on the panel
         DrawData(mouse_bar_index,time);
        }
     }

//--- If we received a custom event, display the appropriate message in the journal
   if(id>CHARTEVENT_CUSTOM)
     {
      //--- Here we can implement handling a click on the close button on the panel
      PrintFormat("%s: Event id=%ld, object id (lparam): %lu, event message (sparam): %s",__FUNCTION__,id,lparam,sparam);
     }
  }
Nachdem wir den EA kompiliert und auf dem Chart gestartet haben, können wir den Status der Indikatorlinie auf dem Panel überwachen:
Die EA-Datei „TestOscillatorRSI.mq5“ ist unten angehängt.
Relative Vigor Index
Der Hauptpunkt des Relative Vigor Index (RVI) ist, dass auf dem Aufwärtsmarkt der Schlusskurs in der Regel höher ist als der Eröffnungskurs. In einem Abwärtsmarkt ist dies andersherum. Die Idee hinter dem Relative Vigor Index ist, dass das die Kraft (vigor) oder die Energie der Bewegung durch die Preise bestätigt wird. Um den Preis im Rahmen der täglichen Preis-Veränderung zu normalisieren, wird die Änderung des Preises geteilt durch die Maximale Veränderung des Tages. Um eine glattere Berechnung durchzuführen, verwendet man den Einfachen Gleitender Durchschnitt. 10 wird als die beste Periodenlänge angesehen. Um eine Mehrdeutigkeit zu vermeiden, wird eine zusätzliche Signale-Linie mit einem 4-periodischen gewichteten Moving Average über den Relative Vigor Index gelegt. Die Übereinstimmung der Linien dient als Signal zum Kaufen oder Verkaufen.
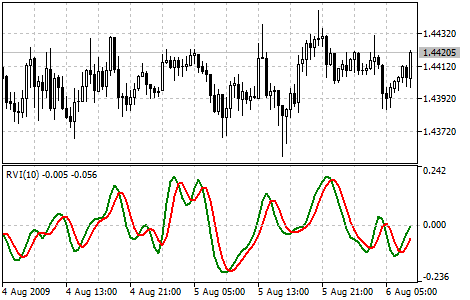
Parameter
Der Indikator hat einen konfigurierbaren Parameter — den Berechnungszeitraum. Der Standardwert ist 10.
Eingabe- und globale Variablen für die Verwendung des Indikators im EA:
//+------------------------------------------------------------------+
//|                                            TestOscillatorRVI.mq5 |
//|                                  Copyright 2023, MetaQuotes Ltd. |
//|                                             https://www.mql5.com |
//+------------------------------------------------------------------+
#property copyright "Copyright 2023, MetaQuotes Ltd."
#property link      "https://www.mql5.com"
#property version   "1.00"
//--- enums
enum ENUM_LINE_STATE
  {
   LINE_STATE_NONE,        // Undefined state
   LINE_STATE_UP,          // Upward
   LINE_STATE_DOWN,        // Downward
   LINE_STATE_TURN_UP,     // Upward reversal
   LINE_STATE_TURN_DOWN,   // Downward reversal
   LINE_STATE_STOP_UP,     // Upward stop
   LINE_STATE_STOP_DOWN,   // Downward stop
   LINE_STATE_ABOVE,       // Above value
   LINE_STATE_UNDER,       // Below value
   LINE_STATE_CROSS_UP,    // Crossing value upwards
   LINE_STATE_CROSS_DOWN,  // Crossing value downwards
   LINE_STATE_TOUCH_BELOW, // Touching value from below
   LINE_STATE_TOUCH_ABOVE, // Touch value from above
   LINE_STATE_EQUALS,      // Equal to value
  };
//--- input parameters
input uint  InpPeriod   =  10;   /* Period */
//--- global variables
int      handle=INVALID_HANDLE;  // Indicator handle
int      period=0;               // RVI calculation period
int      ind_digits=0;           // Number of decimal places in the indicator values
string   ind_title;              // Indicator description
Bei der Verwendung des Dashboards wird die Klassendatei des Panels eingebunden und die Variablen für die Arbeit mit dem Panel werden hinzugefügt:
//+------------------------------------------------------------------+
//|                                            TestOscillatorRVI.mq5 |
//|                                  Copyright 2023, MetaQuotes Ltd. |
//|                                             https://www.mql5.com |
//+------------------------------------------------------------------+
#property copyright "Copyright 2023, MetaQuotes Ltd."
#property link      "https://www.mql5.com"
#property version   "1.00"
//--- includes
#include <Dashboard\Dashboard.mqh>
//--- enums
enum ENUM_LINE_STATE
  {
   LINE_STATE_NONE,        // Undefined state
   LINE_STATE_UP,          // Upward
   LINE_STATE_DOWN,        // Downward
   LINE_STATE_TURN_UP,     // Upward reversal
   LINE_STATE_TURN_DOWN,   // Downward reversal
   LINE_STATE_STOP_UP,     // Upward stop
   LINE_STATE_STOP_DOWN,   // Downward stop
   LINE_STATE_ABOVE,       // Above value
   LINE_STATE_UNDER,       // Below value
   LINE_STATE_CROSS_UP,    // Crossing value upwards
   LINE_STATE_CROSS_DOWN,  // Crossing value downwards
   LINE_STATE_TOUCH_BELOW, // Touching value from below
   LINE_STATE_TOUCH_ABOVE, // Touch value from above
   LINE_STATE_EQUALS,      // Equal to value
  };
//--- input parameters
input uint  InpPeriod   =  10;   /* Period */
//--- global variables
int      handle=INVALID_HANDLE;  // Indicator handle
int      period=0;               // RVI calculation period
int      ind_digits=0;           // Number of decimal places in the indicator values
string   ind_title;              // Indicator description
//--- variables for the panel
int      mouse_bar_index;        // Index of the bar the data is taken from
CDashboard *panel=NULL;          // Pointer to the panel object
Initialisierung
OnInit() für die Initialisierung der Indikatorparameter und die Erstellung seines Handles:
//+------------------------------------------------------------------+
//| Expert initialization function                                   |
//+------------------------------------------------------------------+
int OnInit()
  {
//--- create timer
   EventSetTimer(60);

//--- Indicator
//--- Set and adjust the calculation period if necessary
   period=int(InpPeriod<1 ? 10 : InpPeriod);
//--- Set the indicator name and the number of decimal places
   ind_title=StringFormat("RVI(%lu)",period);
   ind_digits=3;
//--- Create indicator handle
   ResetLastError();
   handle=iRVI(Symbol(),PERIOD_CURRENT,period);
   if(handle==INVALID_HANDLE)
     {
      PrintFormat("%s: Failed to create indicator handle %s. Error %ld",__FUNCTION__,ind_title,GetLastError());
      return INIT_FAILED;
     }

//--- Successful initialization
   return(INIT_SUCCEEDED);
  }
Das Panel wird bei Verwendung des Dashboards erstellt:
//+------------------------------------------------------------------+
//| Expert initialization function                                   |
//+------------------------------------------------------------------+
int OnInit()
  {
//--- create timer
   EventSetTimer(60);

//--- Indicator
//--- Set and adjust the calculation period if necessary
   period=int(InpPeriod<1 ? 10 : InpPeriod);
//--- Set the indicator name and the number of decimal places
   ind_title=StringFormat("RVI(%lu)",period);
   ind_digits=3;
//--- Create indicator handle
   ResetLastError();
   handle=iRVI(Symbol(),PERIOD_CURRENT,period);
   if(handle==INVALID_HANDLE)
     {
      PrintFormat("%s: Failed to create indicator handle %s. Error %ld",__FUNCTION__,ind_title,GetLastError());
      return INIT_FAILED;
     }

//--- Dashboard
//--- Create the panel
   panel=new CDashboard(1,20,20,199,225);
   if(panel==NULL)
     {
      Print("Error. Failed to create panel object");
      return INIT_FAILED;
     }
//--- Set font parameters
   panel.SetFontParams("Calibri",9);
//--- Display the panel with the "Symbol, Timeframe description" header text
   panel.View(Symbol()+", "+StringSubstr(EnumToString(Period()),7));
//--- Create a table with ID 0 to display bar data in it
   panel.CreateNewTable(0);
//--- Draw a table with ID 0 on the panel background
   panel.DrawGrid(0,2,20,6,2,18,97);

//--- Create a table with ID 1 to display indicator data in it
   panel.CreateNewTable(1);
//--- Get the Y2 table coordinate with ID 0 and
//--- set the Y1 coordinate for the table with ID 1
   int y1=panel.TableY2(0)+22;
//--- Draw a table with ID 1 on the panel background
   panel.DrawGrid(1,2,y1,3,2,18,97);

//--- Display tabular data in the journal
   panel.GridPrint(0,2);
   panel.GridPrint(1,2);
//--- Initialize the variable with the index of the mouse cursor bar
   mouse_bar_index=0;
//--- Display the data of the current bar on the panel
   DrawData(mouse_bar_index,TimeCurrent());

//--- Successful initialization
   return(INIT_SUCCEEDED);
  }
Deinitialisierung
In OnDeinit() geben wir das Handle im EA wieder frei:
//+------------------------------------------------------------------+
//| Expert deinitialization function                                 |
//+------------------------------------------------------------------+
void OnDeinit(const int reason)
  {
//--- destroy timer
   EventKillTimer();

//--- Release handle of the indicator
   ResetLastError();
   if(!IndicatorRelease(handle))
      PrintFormat("%s: IndicatorRelease failed. Error %ld",__FUNCTION__,GetLastError());
//--- Clear all comments on the chart
   Comment("");
  }
Das erstellte Dashboard-Objekt wird bei der Verwendung des Dashboards entfernt:
//+------------------------------------------------------------------+
//| Expert deinitialization function                                 |
//+------------------------------------------------------------------+
void OnDeinit(const int reason)
  {
//--- destroy timer
   EventKillTimer();

//--- Release handle of the indicator
   ResetLastError();
   if(!IndicatorRelease(handle))
      PrintFormat("%s: IndicatorRelease failed. Error %ld",__FUNCTION__,GetLastError());
//--- Clear all comments on the chart
   Comment("");

//--- If the panel object exists, delete it
   if(panel!=NULL)
      delete panel;
  }
Abrufen von Daten
Allgemeine Funktionen zum Abrufen von Daten über das Indikatorhandle:
//+------------------------------------------------------------------+
//| Return the indicator data on the specified bar                   |
//+------------------------------------------------------------------+
double IndicatorValue(const int ind_handle,const int index,const int buffer_num)
  {
   double array[1]={0};
   ResetLastError();
   if(CopyBuffer(ind_handle,buffer_num,index,1,array)!=1)
     {
      PrintFormat("%s: CopyBuffer failed. Error %ld",__FUNCTION__,GetLastError());
      return EMPTY_VALUE;
     }
   return array[0];
  }
//+------------------------------------------------------------------+
//| Return the state of the indicator line                           |
//+------------------------------------------------------------------+
ENUM_LINE_STATE LineState(const int ind_handle,const int index,const int buffer_num)
  {
//--- Get the values of the indicator line with the shift (0,1,2) relative to the passed index
   const double value0=IndicatorValue(ind_handle,index,  buffer_num);
   const double value1=IndicatorValue(ind_handle,index+1,buffer_num);
   const double value2=IndicatorValue(ind_handle,index+2,buffer_num);
//--- If at least one of the values could not be obtained, return an undefined value
   if(value0==EMPTY_VALUE || value1==EMPTY_VALUE || value2==EMPTY_VALUE)
      return LINE_STATE_NONE;
//--- Line upward reversal (value2>value1 && value0>value1)
   if(NormalizeDouble(value2-value1,ind_digits)>0 && NormalizeDouble(value0-value1,ind_digits)>0)
      return LINE_STATE_TURN_UP;
//--- Line upward direction (value2<=value1 && value0>value1)
   else if(NormalizeDouble(value2-value1,ind_digits)<=0 && NormalizeDouble(value0-value1,ind_digits)>0)
      return LINE_STATE_UP;
//--- Line upward stop (value2<=value1 && value0==value1)
   else if(NormalizeDouble(value2-value1,ind_digits)<=0 && NormalizeDouble(value0-value1,ind_digits)==0)
      return LINE_STATE_STOP_UP;
//--- Line downward reversal (value2<value1 && value0<value1)
   if(NormalizeDouble(value2-value1,ind_digits)<0 && NormalizeDouble(value0-value1,ind_digits)<0)
      return LINE_STATE_TURN_DOWN;
//--- Line downward direction (value2>=value1 && value0<value1)
   else if(NormalizeDouble(value2-value1,ind_digits)>=0 && NormalizeDouble(value0-value1,ind_digits)<0)
      return LINE_STATE_DOWN;
//--- Line downward stop (value2>=value1 && value0==value1)
   else if(NormalizeDouble(value2-value1,ind_digits)>=0 && NormalizeDouble(value0-value1,ind_digits)==0)
      return LINE_STATE_STOP_DOWN;
//--- Undefined state
   return LINE_STATE_NONE;
  }
//+------------------------------------------------------------------+
//| Return the state of the line relative to the specified level     |
//+------------------------------------------------------------------+
ENUM_LINE_STATE LineStateRelative(const int ind_handle,const int index,const int buffer_num,const double level0,const double level1=EMPTY_VALUE)
  {
//--- Get the values of the indicator line with the shift (0,1) relative to the passed index
   const double value0=IndicatorValue(ind_handle,index,  buffer_num);
   const double value1=IndicatorValue(ind_handle,index+1,buffer_num);
//--- If at least one of the values could not be obtained, return an undefined value
   if(value0==EMPTY_VALUE || value1==EMPTY_VALUE)
      return LINE_STATE_NONE;
//--- Define the second level to compare
   double level=(level1==EMPTY_VALUE ? level0 : level1);
//--- The line is below the level (value1<level && value0<level0)
   if(NormalizeDouble(value1-level,ind_digits)<0 && NormalizeDouble(value0-level0,ind_digits)<0)
      return LINE_STATE_UNDER;
//--- The line is above the level (value1>level && value0>level0)
   if(NormalizeDouble(value1-level,ind_digits)>0 && NormalizeDouble(value0-level0,ind_digits)>0)
      return LINE_STATE_ABOVE;
//--- The line crossed the level upwards (value1<=level && value0>level0)
   if(NormalizeDouble(value1-level,ind_digits)<=0 && NormalizeDouble(value0-level0,ind_digits)>0)
      return LINE_STATE_CROSS_UP;
//--- The line crossed the level downwards (value1>=level && value0<level0)
   if(NormalizeDouble(value1-level,ind_digits)>=0 && NormalizeDouble(value0-level0,ind_digits)<0)
      return LINE_STATE_CROSS_DOWN;
//--- The line touched the level from below (value1<level0 && value0==level0)
   if(NormalizeDouble(value1-level,ind_digits)<0 && NormalizeDouble(value0-level0,ind_digits)==0)
      return LINE_STATE_TOUCH_BELOW;
//--- The line touched the level from above (value1>level0 && value0==level0)
   if(NormalizeDouble(value1-level,ind_digits)>0 && NormalizeDouble(value0-level0,ind_digits)==0)
      return LINE_STATE_TOUCH_BELOW;
//--- Line is equal to the level value (value1==level0 && value0==level0)
   if(NormalizeDouble(value1-level,ind_digits)==0 && NormalizeDouble(value0-level0,ind_digits)==0)
      return LINE_STATE_EQUALS;
//--- Undefined state
   return LINE_STATE_NONE;
  }
//+------------------------------------------------------------------+
//| Return the indicator line state description                      |
//+------------------------------------------------------------------+
string LineStateDescription(const ENUM_LINE_STATE state)
  {
   switch(state)
     {
      case LINE_STATE_UP         :  return "Up";
      case LINE_STATE_STOP_UP    :  return "Stop Up";
      case LINE_STATE_TURN_UP    :  return "Turn Up";
      case LINE_STATE_DOWN       :  return "Down";
      case LINE_STATE_STOP_DOWN  :  return "Stop Down";
      case LINE_STATE_TURN_DOWN  :  return "Turn Down";
      case LINE_STATE_ABOVE      :  return "Above level";
      case LINE_STATE_UNDER      :  return "Under level";
      case LINE_STATE_CROSS_UP   :  return "Crossing Up";
      case LINE_STATE_CROSS_DOWN :  return "Crossing Down";
      case LINE_STATE_TOUCH_BELOW:  return "Touch from Below";
      case LINE_STATE_TOUCH_ABOVE:  return "Touch from Above";
      case LINE_STATE_EQUALS     :  return "Equals";
      default                    :  return "Unknown";
     }
  }
Wenn wir das Dashboard verwenden, werden die Daten mit Hilfe der Funktion auf dem Bedienfeld angezeigt:
//+------------------------------------------------------------------+
//| Display data from the specified timeseries index to the panel    |
//+------------------------------------------------------------------+
void DrawData(const int index,const datetime time)
  {
//--- Declare the variables to receive data in them
   MqlTick  tick={0};
   MqlRates rates[1];

//--- Exit if unable to get the current prices
   if(!SymbolInfoTick(Symbol(),tick))
      return;
//--- Exit if unable to get the bar data by the specified index
   if(CopyRates(Symbol(),PERIOD_CURRENT,index,1,rates)!=1)
      return;

//--- Set font parameters for bar and indicator data headers
   int  size=0;
   uint flags=0;
   uint angle=0;
   string name=panel.FontParams(size,flags,angle);
   panel.SetFontParams(name,9,FW_BOLD);
   panel.DrawText("Bar data ["+(string)index+"]",3,panel.TableY1(0)-16,clrMaroon,panel.Width()-6);
   panel.DrawText("Indicator data ["+(string)index+"]",3,panel.TableY1(1)-16,clrGreen,panel.Width()-6);
//--- Set font parameters for bar and indicator data
   panel.SetFontParams(name,9);

//--- Display the data of the specified bar in table 0 on the panel
   panel.DrawText("Date",  panel.CellX(0,0,0)+2, panel.CellY(0,0,0)+2); panel.DrawText(TimeToString(  rates[0].time,TIME_DATE),     panel.CellX(0,0,1)+2, panel.CellY(0,0,1)+2,clrNONE,90);
   panel.DrawText("Time",  panel.CellX(0,1,0)+2, panel.CellY(0,1,0)+2); panel.DrawText(TimeToString(  rates[0].time,TIME_MINUTES),  panel.CellX(0,1,1)+2, panel.CellY(0,1,1)+2,clrNONE,90);
   panel.DrawText("Open",  panel.CellX(0,2,0)+2, panel.CellY(0,2,0)+2); panel.DrawText(DoubleToString(rates[0].open,Digits()),      panel.CellX(0,2,1)+2, panel.CellY(0,2,1)+2,clrNONE,90);
   panel.DrawText("High",  panel.CellX(0,3,0)+2, panel.CellY(0,3,0)+2); panel.DrawText(DoubleToString(rates[0].high,Digits()),      panel.CellX(0,3,1)+2, panel.CellY(0,3,1)+2,clrNONE,90);
   panel.DrawText("Low",   panel.CellX(0,4,0)+2, panel.CellY(0,4,0)+2); panel.DrawText(DoubleToString(rates[0].low,Digits()),       panel.CellX(0,4,1)+2, panel.CellY(0,4,1)+2,clrNONE,90);
   panel.DrawText("Close", panel.CellX(0,5,0)+2, panel.CellY(0,5,0)+2); panel.DrawText(DoubleToString(rates[0].close,Digits()),     panel.CellX(0,5,1)+2, panel.CellY(0,5,1)+2,clrNONE,90);

//--- Display the indicator data from the specified bar on the panel in table 1
   panel.DrawText(ind_title, panel.CellX(1,0,0)+2, panel.CellY(1,0,0)+2);
   double value=IndicatorValue(handle,index,0);
   string value_str=(value!=EMPTY_VALUE ? DoubleToString(value,ind_digits) : "");
   panel.DrawText(value_str,panel.CellX(1,0,1)+2,panel.CellY(1,0,1)+2,clrNONE,90);
//--- Display the indicator signal line data from the specified bar on the panel in table 1
   panel.DrawText("Signal", panel.CellX(1,1,0)+2, panel.CellY(1,1,0)+2);
   double signal=IndicatorValue(handle,index,1);
   string signal_str=(signal!=EMPTY_VALUE ? DoubleToString(signal,ind_digits) : "");
   panel.DrawText(signal_str,panel.CellX(1,1,1)+2,panel.CellY(1,1,1)+2,clrNONE,90);

//--- Display a description of the indicator line state relative to the signal line
   panel.DrawText("RVI vs Signal", panel.CellX(1,2,0)+2, panel.CellY(1,2,0)+2);
   ENUM_LINE_STATE state_signal=LineStateRelative(handle,index,0,signal,IndicatorValue(handle,index+1,1));
   string state_signal_str=(state_signal==LINE_STATE_ABOVE ? "RVI > Signal" : state_signal==LINE_STATE_UNDER ? "RVI < Signal" : LineStateDescription(state_signal));
//--- The label color changes depending on the value of the line relative to the level
   color clr=(state_signal==LINE_STATE_CROSS_UP ? clrBlue : state_signal==LINE_STATE_CROSS_DOWN ? clrRed : clrNONE);
   panel.DrawText(state_signal_str,panel.CellX(1,2,1)+2,panel.CellY(1,2,1)+2,clr,90);

//--- Redraw the chart to immediately display all changes on the panel
   ChartRedraw(ChartID());
  }
Die Indikatorsignale (Schnittpunkte der Indikatorlinie mit der Signallinie) werden auf dem Dashboard farblich hervorgehoben.
Außerdem wird die Ereignisbehandlung des Panel von OnChartEvent() aufgerufen, und die Ereignisse für den Empfang des Balkenindex unter dem Cursor werden behandelt:
//+------------------------------------------------------------------+
//| ChartEvent function                                              |
//+------------------------------------------------------------------+
void OnChartEvent(const int id,
                  const long &lparam,
                  const double &dparam,
                  const string &sparam)
  {
//--- Handling the panel
//--- Call the panel event handler
   panel.OnChartEvent(id,lparam,dparam,sparam);

//--- If the cursor moves or a click is made on the chart
   if(id==CHARTEVENT_MOUSE_MOVE || id==CHARTEVENT_CLICK)
     {
      //--- Declare the variables to record time and price coordinates in them
      datetime time=0;
      double price=0;
      int wnd=0;
      //--- If the cursor coordinates are converted to date and time
      if(ChartXYToTimePrice(ChartID(),(int)lparam,(int)dparam,wnd,time,price))
        {
         //--- write the bar index where the cursor is located to a global variable
         mouse_bar_index=iBarShift(Symbol(),PERIOD_CURRENT,time);
         //--- Display the bar data under the cursor on the panel
         DrawData(mouse_bar_index,time);
        }
     }

//--- If we received a custom event, display the appropriate message in the journal
   if(id>CHARTEVENT_CUSTOM)
     {
      //--- Here we can implement handling a click on the close button on the panel
      PrintFormat("%s: Event id=%ld, object id (lparam): %lu, event message (sparam): %s",__FUNCTION__,id,lparam,sparam);
     }
  }
Nachdem wir den EA kompiliert und auf dem Chart gestartet haben, können wir den Status der Indikatorlinie auf dem Panel überwachen:
Die EA-Datei „TestOscillatorRVI.mq5“ ist unten angehängt.
Stochastik Oszillator
Der stochastische Oszillator vergleicht, wo der Kurs eines Wertpapiers im Verhältnis zu seiner Kursspanne in einem bestimmten Zeitraum geschlossen hat. Der Stochastik-Oszillator zeichnet zwei Linien. Die Hauptlinie wird %K genannt. Die zweite Linie mit der Bezeichnung %D ist ein Gleitender Durchschnitt von der Linie %K. Die %K-Linie wird normalerweise als durchgängige Linie und die %D-Linie als gepunktete Linie dargestellt. Es gibt verschiedene Wege den Stochastic Oscillator zu interpretieren. Die drei populäre Methoden umfassen:
- Kaufen, wenn der Oszillator (entweder %K oder %D) unter einen bestimmten Wert fällt (zum Beispiel, 20) und dann über dieses Level steigt. Verkaufen, wenn der Oszillator (entweder %K oder %D) über einen bestimmten Wert steigt (zum Beispiel, 80) und dann unter dieses Level fällt.
- Kaufen, wenn die Linie %K die Linie %D nach oben kreuzt. Verkaufen, wenn %K unter %D fällt.
- Achten Sie auf Divergenzen. Zum Beispiel: Wenn der Preis ein neues höheres Hoch bildet, als das vorherige, das neue Hoch des Oszillators aber niedriger liegt als das vorherige Hoch.
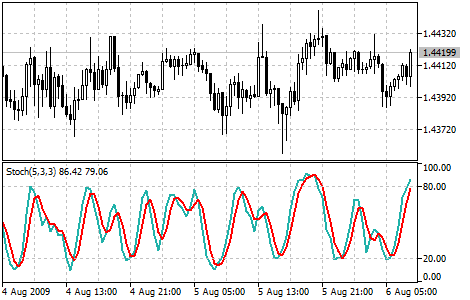
Parameter
Der Indikator hat fünf Eingabeparameter:
- Berechnungslänge von %K, Standardwert — 5,
- Berechnungslänge von %D, Standard — 3,
- Verlangsamungslänge, Standard — 3,
- Stochastischer Berechnungspreis, Standard — Tief/Hoch,
- Berechnungsmethode, Standard — SMA.
Zusätzlich zu diesen Werten müssen wir die überkauften und überverkauften Niveaus in den EA-Eingaben angeben.
Eingabe- und globale Variablen für die Verwendung des Indikators im EA:
//+------------------------------------------------------------------+
//|                                          TestOscillatorStoch.mq5 |
//|                                  Copyright 2023, MetaQuotes Ltd. |
//|                                             https://www.mql5.com |
//+------------------------------------------------------------------+
#property copyright "Copyright 2023, MetaQuotes Ltd."
#property link      "https://www.mql5.com"
#property version   "1.00"
//--- enums
enum ENUM_LINE_STATE
  {
   LINE_STATE_NONE,        // Undefined state
   LINE_STATE_UP,          // Upward
   LINE_STATE_DOWN,        // Downward
   LINE_STATE_TURN_UP,     // Upward reversal
   LINE_STATE_TURN_DOWN,   // Downward reversal
   LINE_STATE_STOP_UP,     // Upward stop
   LINE_STATE_STOP_DOWN,   // Downward stop
   LINE_STATE_ABOVE,       // Above value
   LINE_STATE_UNDER,       // Below value
   LINE_STATE_CROSS_UP,    // Crossing value upwards
   LINE_STATE_CROSS_DOWN,  // Crossing value downwards
   LINE_STATE_TOUCH_BELOW, // Touching value from below
   LINE_STATE_TOUCH_ABOVE, // Touch value from above
   LINE_STATE_EQUALS,      // Equal to value
  };
//--- input parameters
input uint           InpPeriodK  =  5;             /* Period %K   */
input uint           InpPeriodD  =  3;             /* Period %D   */
input uint           InpSlowing  =  3;             /* Slowing     */
input ENUM_STO_PRICE InpPrice    =  STO_LOWHIGH;   /* Price       */
input ENUM_MA_METHOD InpMethod   =  MODE_SMA;      /* Method      */
input double         InpOverbough=  80;            /* Overbough level*/
input double         InpOversold =  20;            /* Oversold level */
//--- global variables
int      handle=INVALID_HANDLE;  // Indicator handle
int      period_k=0;             // %K period
int      period_d=0;             // %D period
int      slowing=0;              // Slowing period
int      ind_digits=0;           // Number of decimal places in the indicator values
double   overbough=0;            // Overbought level
double   oversold=0;             // Oversold level
string   ind_title;              // Indicator description
Bei der Verwendung des Dashboards wird die Klassendatei des Panels eingebunden und die Variablen für die Arbeit mit dem Panel werden hinzugefügt:
//+------------------------------------------------------------------+
//|                                          TestOscillatorStoch.mq5 |
//|                                  Copyright 2023, MetaQuotes Ltd. |
//|                                             https://www.mql5.com |
//+------------------------------------------------------------------+
#property copyright "Copyright 2023, MetaQuotes Ltd."
#property link      "https://www.mql5.com"
#property version   "1.00"
//--- includes
#include <Dashboard\Dashboard.mqh>
//--- enums
enum ENUM_LINE_STATE
  {
   LINE_STATE_NONE,        // Undefined state
   LINE_STATE_UP,          // Upward
   LINE_STATE_DOWN,        // Downward
   LINE_STATE_TURN_UP,     // Upward reversal
   LINE_STATE_TURN_DOWN,   // Downward reversal
   LINE_STATE_STOP_UP,     // Upward stop
   LINE_STATE_STOP_DOWN,   // Downward stop
   LINE_STATE_ABOVE,       // Above value
   LINE_STATE_UNDER,       // Below value
   LINE_STATE_CROSS_UP,    // Crossing value upwards
   LINE_STATE_CROSS_DOWN,  // Crossing value downwards
   LINE_STATE_TOUCH_BELOW, // Touching value from below
   LINE_STATE_TOUCH_ABOVE, // Touch value from above
   LINE_STATE_EQUALS,      // Equal to value
  };
//--- input parameters
input uint           InpPeriodK  =  5;             /* Period %K   */
input uint           InpPeriodD  =  3;             /* Period %D   */
input uint           InpSlowing  =  3;             /* Slowing     */
input ENUM_STO_PRICE InpPrice    =  STO_LOWHIGH;   /* Price       */
input ENUM_MA_METHOD InpMethod   =  MODE_SMA;      /* Method      */
input double         InpOverbough=  80;            /* Overbough level*/
input double         InpOversold =  20;            /* Oversold level */
//--- global variables
int      handle=INVALID_HANDLE;  // Indicator handle
int      period_k=0;             // %K period
int      period_d=0;             // %D period
int      slowing=0;              // Slowing period
int      ind_digits=0;           // Number of decimal places in the indicator values
double   overbough=0;            // Overbought level
double   oversold=0;             // Oversold level
string   ind_title;              // Indicator description
//--- variables for the panel
int      mouse_bar_index;        // Index of the bar the data is taken from
CDashboard *panel=NULL;          // Pointer to the panel object
Initialisierung
OnInit() für die Initialisierung der Indikatorparameter und die Erstellung seines Handles:
//+------------------------------------------------------------------+
//| Expert initialization function                                   |
//+------------------------------------------------------------------+
int OnInit()
  {
//--- create timer
   EventSetTimer(60);

//--- Indicator
//--- Set and adjust the calculation period if necessary
   period_k=int(InpPeriodK<1 ? 5 : InpPeriodK);
   period_d=int(InpPeriodD<1 ? 3 : InpPeriodD);
   slowing =int(InpSlowing<1 ? 3 : InpSlowing);
   overbough=InpOverbough;
   oversold=(InpOversold>=overbough ? overbough-0.01 : InpOversold);
//--- Set the indicator name and the number of decimal places
   ind_title=StringFormat("Stoch(%lu,%lu,%lu)",period_k,period_d,slowing);
   ind_digits=2;
//--- Create indicator handle
   ResetLastError();
   handle=iStochastic(Symbol(),PERIOD_CURRENT,period_k,period_d,slowing,InpMethod,InpPrice);
   if(handle==INVALID_HANDLE)
     {
      PrintFormat("%s: Failed to create indicator handle %s. Error %ld",__FUNCTION__,ind_title,GetLastError());
      return INIT_FAILED;
     }

//--- Successful initialization
   return(INIT_SUCCEEDED);
  }
Das Panel wird bei Verwendung des Dashboards erstellt:
//+------------------------------------------------------------------+
//| Expert initialization function                                   |
//+------------------------------------------------------------------+
int OnInit()
  {
//--- create timer
   EventSetTimer(60);

//--- Indicator
//--- Set and adjust the calculation period if necessary
   period_k=int(InpPeriodK<1 ? 5 : InpPeriodK);
   period_d=int(InpPeriodD<1 ? 3 : InpPeriodD);
   slowing =int(InpSlowing<1 ? 3 : InpSlowing);
   overbough=InpOverbough;
   oversold=(InpOversold>=overbough ? overbough-0.01 : InpOversold);
//--- Set the indicator name and the number of decimal places
   ind_title=StringFormat("Stoch(%lu,%lu,%lu)",period_k,period_d,slowing);
   ind_digits=2;
//--- Create indicator handle
   ResetLastError();
   handle=iStochastic(Symbol(),PERIOD_CURRENT,period_k,period_d,slowing,InpMethod,InpPrice);
   if(handle==INVALID_HANDLE)
     {
      PrintFormat("%s: Failed to create indicator handle %s. Error %ld",__FUNCTION__,ind_title,GetLastError());
      return INIT_FAILED;
     }

//--- Dashboard
//--- Create the panel
   panel=new CDashboard(1,20,20,229,261);
   if(panel==NULL)
     {
      Print("Error. Failed to create panel object");
      return INIT_FAILED;
     }
//--- Set font parameters
   panel.SetFontParams("Calibri",9);
//--- Display the panel with the "Symbol, Timeframe description" header text
   panel.View(Symbol()+", "+StringSubstr(EnumToString(Period()),7));
//--- Create a table with ID 0 to display bar data in it
   panel.CreateNewTable(0);
//--- Draw a table with ID 0 on the panel background
   panel.DrawGrid(0,2,20,6,2,18,112);

//--- Create a table with ID 1 to display indicator data in it
   panel.CreateNewTable(1);
//--- Get the Y2 table coordinate with ID 0 and
//--- set the Y1 coordinate for the table with ID 1
   int y1=panel.TableY2(0)+22;
//--- Draw a table with ID 1 on the panel background
   panel.DrawGrid(1,2,y1,5,2,18,112);

//--- Display tabular data in the journal
   panel.GridPrint(0,2);
   panel.GridPrint(1,2);
//--- Initialize the variable with the index of the mouse cursor bar
   mouse_bar_index=0;
//--- Display the data of the current bar on the panel
   DrawData(mouse_bar_index,TimeCurrent());

//--- Successful initialization
   return(INIT_SUCCEEDED);
  }
Deinitialisierung
In OnDeinit() geben wir das Handle im EA wieder frei:
//+------------------------------------------------------------------+
//| Expert deinitialization function                                 |
//+------------------------------------------------------------------+
void OnDeinit(const int reason)
  {
//--- destroy timer
   EventKillTimer();

//--- Release handle of the indicator
   ResetLastError();
   if(!IndicatorRelease(handle))
      PrintFormat("%s: IndicatorRelease failed. Error %ld",__FUNCTION__,GetLastError());
//--- Clear all comments on the chart
   Comment("");
  }
Das erstellte Dashboard-Objekt wird bei der Verwendung des Dashboards entfernt:
//+------------------------------------------------------------------+
//| Expert deinitialization function                                 |
//+------------------------------------------------------------------+
void OnDeinit(const int reason)
  {
//--- destroy timer
   EventKillTimer();

//--- Release handle of the indicator
   ResetLastError();
   if(!IndicatorRelease(handle))
      PrintFormat("%s: IndicatorRelease failed. Error %ld",__FUNCTION__,GetLastError());
//--- Clear all comments on the chart
   Comment("");

//--- If the panel object exists, delete it
   if(panel!=NULL)
      delete panel;
  }
Abrufen von Daten
Allgemeine Funktionen zum Abrufen von Daten über das Indikatorhandle:
//+------------------------------------------------------------------+
//| Return the indicator data on the specified bar                   |
//+------------------------------------------------------------------+
double IndicatorValue(const int ind_handle,const int index,const int buffer_num)
  {
   double array[1]={0};
   ResetLastError();
   if(CopyBuffer(ind_handle,buffer_num,index,1,array)!=1)
     {
      PrintFormat("%s: CopyBuffer failed. Error %ld",__FUNCTION__,GetLastError());
      return EMPTY_VALUE;
     }
   return array[0];
  }
//+------------------------------------------------------------------+
//| Return the state of the indicator line                           |
//+------------------------------------------------------------------+
ENUM_LINE_STATE LineState(const int ind_handle,const int index,const int buffer_num)
  {
//--- Get the values of the indicator line with the shift (0,1,2) relative to the passed index
   const double value0=IndicatorValue(ind_handle,index,  buffer_num);
   const double value1=IndicatorValue(ind_handle,index+1,buffer_num);
   const double value2=IndicatorValue(ind_handle,index+2,buffer_num);
//--- If at least one of the values could not be obtained, return an undefined value
   if(value0==EMPTY_VALUE || value1==EMPTY_VALUE || value2==EMPTY_VALUE)
      return LINE_STATE_NONE;
//--- Line upward reversal (value2>value1 && value0>value1)
   if(NormalizeDouble(value2-value1,ind_digits)>0 && NormalizeDouble(value0-value1,ind_digits)>0)
      return LINE_STATE_TURN_UP;
//--- Line upward direction (value2<=value1 && value0>value1)
   else if(NormalizeDouble(value2-value1,ind_digits)<=0 && NormalizeDouble(value0-value1,ind_digits)>0)
      return LINE_STATE_UP;
//--- Line upward stop (value2<=value1 && value0==value1)
   else if(NormalizeDouble(value2-value1,ind_digits)<=0 && NormalizeDouble(value0-value1,ind_digits)==0)
      return LINE_STATE_STOP_UP;
//--- Line downward reversal (value2<value1 && value0<value1)
   if(NormalizeDouble(value2-value1,ind_digits)<0 && NormalizeDouble(value0-value1,ind_digits)<0)
      return LINE_STATE_TURN_DOWN;
//--- Line downward direction (value2>=value1 && value0<value1)
   else if(NormalizeDouble(value2-value1,ind_digits)>=0 && NormalizeDouble(value0-value1,ind_digits)<0)
      return LINE_STATE_DOWN;
//--- Line downward stop (value2>=value1 && value0==value1)
   else if(NormalizeDouble(value2-value1,ind_digits)>=0 && NormalizeDouble(value0-value1,ind_digits)==0)
      return LINE_STATE_STOP_DOWN;
//--- Undefined state
   return LINE_STATE_NONE;
  }
//+------------------------------------------------------------------+
//| Return the state of the line relative to the specified level     |
//+------------------------------------------------------------------+
ENUM_LINE_STATE LineStateRelative(const int ind_handle,const int index,const int buffer_num,const double level0,const double level1=EMPTY_VALUE)
  {
//--- Get the values of the indicator line with the shift (0,1) relative to the passed index
   const double value0=IndicatorValue(ind_handle,index,  buffer_num);
   const double value1=IndicatorValue(ind_handle,index+1,buffer_num);
//--- If at least one of the values could not be obtained, return an undefined value
   if(value0==EMPTY_VALUE || value1==EMPTY_VALUE)
      return LINE_STATE_NONE;
//--- Define the second level to compare
   double level=(level1==EMPTY_VALUE ? level0 : level1);
//--- The line is below the level (value1<level && value0<level0)
   if(NormalizeDouble(value1-level,ind_digits)<0 && NormalizeDouble(value0-level0,ind_digits)<0)
      return LINE_STATE_UNDER;
//--- The line is above the level (value1>level && value0>level0)
   if(NormalizeDouble(value1-level,ind_digits)>0 && NormalizeDouble(value0-level0,ind_digits)>0)
      return LINE_STATE_ABOVE;
//--- The line crossed the level upwards (value1<=level && value0>level0)
   if(NormalizeDouble(value1-level,ind_digits)<=0 && NormalizeDouble(value0-level0,ind_digits)>0)
      return LINE_STATE_CROSS_UP;
//--- The line crossed the level downwards (value1>=level && value0<level0)
   if(NormalizeDouble(value1-level,ind_digits)>=0 && NormalizeDouble(value0-level0,ind_digits)<0)
      return LINE_STATE_CROSS_DOWN;
//--- The line touched the level from below (value1<level0 && value0==level0)
   if(NormalizeDouble(value1-level,ind_digits)<0 && NormalizeDouble(value0-level0,ind_digits)==0)
      return LINE_STATE_TOUCH_BELOW;
//--- The line touched the level from above (value1>level0 && value0==level0)
   if(NormalizeDouble(value1-level,ind_digits)>0 && NormalizeDouble(value0-level0,ind_digits)==0)
      return LINE_STATE_TOUCH_BELOW;
//--- Line is equal to the level value (value1==level0 && value0==level0)
   if(NormalizeDouble(value1-level,ind_digits)==0 && NormalizeDouble(value0-level0,ind_digits)==0)
      return LINE_STATE_EQUALS;
//--- Undefined state
   return LINE_STATE_NONE;
  }
//+------------------------------------------------------------------+
//| Return the indicator line state description                      |
//+------------------------------------------------------------------+
string LineStateDescription(const ENUM_LINE_STATE state)
  {
   switch(state)
     {
      case LINE_STATE_UP         :  return "Up";
      case LINE_STATE_STOP_UP    :  return "Stop Up";
      case LINE_STATE_TURN_UP    :  return "Turn Up";
      case LINE_STATE_DOWN       :  return "Down";
      case LINE_STATE_STOP_DOWN  :  return "Stop Down";
      case LINE_STATE_TURN_DOWN  :  return "Turn Down";
      case LINE_STATE_ABOVE      :  return "Above level";
      case LINE_STATE_UNDER      :  return "Under level";
      case LINE_STATE_CROSS_UP   :  return "Crossing Up";
      case LINE_STATE_CROSS_DOWN :  return "Crossing Down";
      case LINE_STATE_TOUCH_BELOW:  return "Touch from Below";
      case LINE_STATE_TOUCH_ABOVE:  return "Touch from Above";
      case LINE_STATE_EQUALS     :  return "Equals";
      default                    :  return "Unknown";
     }
  }
Wenn wir das Dashboard verwenden, werden die Daten mit Hilfe der Funktion auf dem Bedienfeld angezeigt:
//+------------------------------------------------------------------+
//| Display data from the specified timeseries index to the panel    |
//+------------------------------------------------------------------+
void DrawData(const int index,const datetime time)
  {
//--- Declare the variables to receive data in them
   MqlTick  tick={0};
   MqlRates rates[1];

//--- Exit if unable to get the current prices
   if(!SymbolInfoTick(Symbol(),tick))
      return;
//--- Exit if unable to get the bar data by the specified index
   if(CopyRates(Symbol(),PERIOD_CURRENT,index,1,rates)!=1)
      return;

//--- Set font parameters for bar and indicator data headers
   int  size=0;
   uint flags=0;
   uint angle=0;
   string name=panel.FontParams(size,flags,angle);
   panel.SetFontParams(name,9,FW_BOLD);
   panel.DrawText("Bar data ["+(string)index+"]",3,panel.TableY1(0)-16,clrMaroon,panel.Width()-6);
   panel.DrawText("Indicator data ["+(string)index+"]",3,panel.TableY1(1)-16,clrGreen,panel.Width()-6);
//--- Set font parameters for bar and indicator data
   panel.SetFontParams(name,9);

//--- Display the data of the specified bar in table 0 on the panel
   panel.DrawText("Date",  panel.CellX(0,0,0)+2, panel.CellY(0,0,0)+2); panel.DrawText(TimeToString(  rates[0].time,TIME_DATE),     panel.CellX(0,0,1)+2, panel.CellY(0,0,1)+2,clrNONE,90);
   panel.DrawText("Time",  panel.CellX(0,1,0)+2, panel.CellY(0,1,0)+2); panel.DrawText(TimeToString(  rates[0].time,TIME_MINUTES),  panel.CellX(0,1,1)+2, panel.CellY(0,1,1)+2,clrNONE,90);
   panel.DrawText("Open",  panel.CellX(0,2,0)+2, panel.CellY(0,2,0)+2); panel.DrawText(DoubleToString(rates[0].open,Digits()),      panel.CellX(0,2,1)+2, panel.CellY(0,2,1)+2,clrNONE,90);
   panel.DrawText("High",  panel.CellX(0,3,0)+2, panel.CellY(0,3,0)+2); panel.DrawText(DoubleToString(rates[0].high,Digits()),      panel.CellX(0,3,1)+2, panel.CellY(0,3,1)+2,clrNONE,90);
   panel.DrawText("Low",   panel.CellX(0,4,0)+2, panel.CellY(0,4,0)+2); panel.DrawText(DoubleToString(rates[0].low,Digits()),       panel.CellX(0,4,1)+2, panel.CellY(0,4,1)+2,clrNONE,90);
   panel.DrawText("Close", panel.CellX(0,5,0)+2, panel.CellY(0,5,0)+2); panel.DrawText(DoubleToString(rates[0].close,Digits()),     panel.CellX(0,5,1)+2, panel.CellY(0,5,1)+2,clrNONE,90);

//--- Display the indicator data from the specified bar on the panel in table 1
   panel.DrawText(ind_title, panel.CellX(1,0,0)+2, panel.CellY(1,0,0)+2);
   double value=IndicatorValue(handle,index,0);
   string value_str=(value!=EMPTY_VALUE ? DoubleToString(value,ind_digits) : "");
   panel.DrawText(value_str,panel.CellX(1,0,1)+2,panel.CellY(1,0,1)+2,clrNONE,100);
//--- Display the indicator signal line data from the specified bar on the panel in table 1
   panel.DrawText("Signal", panel.CellX(1,1,0)+2, panel.CellY(1,1,0)+2);
   double signal=IndicatorValue(handle,index,1);
   string signal_str=(signal!=EMPTY_VALUE ? DoubleToString(signal,ind_digits) : "");
   panel.DrawText(signal_str,panel.CellX(1,1,1)+2,panel.CellY(1,1,1)+2,clrNONE,100);

//--- Display a description of the indicator line state relative to the signal line
   panel.DrawText("Stoch vs Signal", panel.CellX(1,2,0)+2, panel.CellY(1,2,0)+2);
   ENUM_LINE_STATE state_signal=LineStateRelative(handle,index,0,signal,IndicatorValue(handle,index+1,1));
   string state_signal_str=(state_signal==LINE_STATE_ABOVE ? "Stoch > Signal" : state_signal==LINE_STATE_UNDER ? "Stoch < Signal" : LineStateDescription(state_signal));
//--- The label color changes depending on the value of the line relative to the level
   color clr=(state_signal==LINE_STATE_CROSS_UP ? clrBlue : state_signal==LINE_STATE_CROSS_DOWN ? clrRed : clrNONE);
   panel.DrawText(state_signal_str,panel.CellX(1,2,1)+2,panel.CellY(1,2,1)+2,clr,100);

//--- Display a description of the indicator line state relative to the overbought level
   string ovb=StringFormat("%+.2f",overbough);
   panel.DrawText("Overbough", panel.CellX(1,3,0)+2, panel.CellY(1,3,0)+2);
   panel.DrawText(ovb, panel.CellX(1,3,0)+66, panel.CellY(1,3,0)+2);
   ENUM_LINE_STATE state_ovb=LineStateRelative(handle,index,0,overbough);
//--- The label color changes depending on the value of the line relative to the level
   clr=(state_ovb==LINE_STATE_CROSS_DOWN ? clrRed : clrNONE);
   string ovb_str=(state_ovb==LINE_STATE_ABOVE ? "Inside the area" : LineStateDescription(state_ovb));
   panel.DrawText(ovb_str,panel.CellX(1,3,1)+2,panel.CellY(1,3,1)+2,clr,100);

//--- Display a description of the indicator line state relative to the oversold level
   panel.DrawText("Oversold", panel.CellX(1,4,0)+2, panel.CellY(1,4,0)+2);
   string ovs=StringFormat("%+.2f",oversold);
   panel.DrawText(ovs, panel.CellX(1,4,0)+68, panel.CellY(1,4,0)+2);
   ENUM_LINE_STATE state_ovs=LineStateRelative(handle,index,0,oversold);
//--- The label color changes depending on the value of the line relative to the level
   clr=(state_ovs==LINE_STATE_CROSS_UP ? clrBlue : clrNONE);
   string ovs_str=(state_ovs==LINE_STATE_UNDER ? "Inside the area" : LineStateDescription(state_ovs));
   panel.DrawText(ovs_str,panel.CellX(1,4,1)+2,panel.CellY(1,4,1)+2,clr,100);

//--- Redraw the chart to immediately display all changes on the panel
   ChartRedraw(ChartID());
  }
Der Zustand der Stochastik-Linie, der überkaufte/überverkaufte Bereich und die Indikatorsignale werden auf dem Dashboard farblich gekennzeichnet.
Außerdem wird die Ereignisbehandlung des Panel von OnChartEvent() aufgerufen, und die Ereignisse für den Empfang des Balkenindex unter dem Cursor werden behandelt:
//+------------------------------------------------------------------+
//| ChartEvent function                                              |
//+------------------------------------------------------------------+
void OnChartEvent(const int id,
                  const long &lparam,
                  const double &dparam,
                  const string &sparam)
  {
//--- Handling the panel
//--- Call the panel event handler
   panel.OnChartEvent(id,lparam,dparam,sparam);

//--- If the cursor moves or a click is made on the chart
   if(id==CHARTEVENT_MOUSE_MOVE || id==CHARTEVENT_CLICK)
     {
      //--- Declare the variables to record time and price coordinates in them
      datetime time=0;
      double price=0;
      int wnd=0;
      //--- If the cursor coordinates are converted to date and time
      if(ChartXYToTimePrice(ChartID(),(int)lparam,(int)dparam,wnd,time,price))
        {
         //--- write the bar index where the cursor is located to a global variable
         mouse_bar_index=iBarShift(Symbol(),PERIOD_CURRENT,time);
         //--- Display the bar data under the cursor on the panel
         DrawData(mouse_bar_index,time);
        }
     }

//--- If we received a custom event, display the appropriate message in the journal
   if(id>CHARTEVENT_CUSTOM)
     {
      //--- Here we can implement handling a click on the close button on the panel
      PrintFormat("%s: Event id=%ld, object id (lparam): %lu, event message (sparam): %s",__FUNCTION__,id,lparam,sparam);
     }
  }
Nachdem wir den EA kompiliert und auf dem Chart gestartet haben, können wir den Status der Indikatorlinie auf dem Panel überwachen:
Die EA-Datei „TestOscillatorStoch.mq5“ ist unten angehängt.
Dreifacher exponentieller Durchschnitt
Der Triple Exponential Average (TRIX) wurde von Jack Hutson als Oszillator für überkaufte/überverkaufte Marktbedingungen entwickelt. Es kann auch als Momentum Indikator genutzt werden. Es wird eine dreifache Glättung zum Entfernen von zyklischen Komponenten der Preis-Bewegungen verwenden mit einer Periode niedriger als der TRIX.
Die Zone wird als Indikator für überkaufte und überverkaufte Markt-Situationen genutzt. Das Signal zum Kaufen ist die Kreuzung der Nulllinie von unten oder eine Aufwärts-Divergenz. Das Signal zum Verkaufen ist die Kreuzung der Nulllinie von oben oder eine Abwärts-Divergenz. Das entscheidende Feature des Indikators ist die perfekte Filterung von Preis-Störbewegungen und dem nicht vorhandenen Lag (Verzögerung), der für die meisten Moving Averages typisch ist.
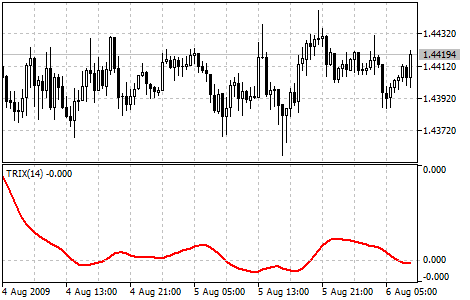
Parameter
Der Indikator hat zwei Parameter:
- Berechnungslänge, Standard — 14,
- Berechnungspreis, Standard — Schlusskurs.
Eingabe- und globale Variablen für die Verwendung des Indikators im EA:
//+------------------------------------------------------------------+
//|                                           TestOscillatorTRIX.mq5 |
//|                                  Copyright 2023, MetaQuotes Ltd. |
//|                                             https://www.mql5.com |
//+------------------------------------------------------------------+
#property copyright "Copyright 2023, MetaQuotes Ltd."
#property link      "https://www.mql5.com"
#property version   "1.00"
//--- enums
enum ENUM_LINE_STATE
  {
   LINE_STATE_NONE,        // Undefined state
   LINE_STATE_UP,          // Upward
   LINE_STATE_DOWN,        // Downward
   LINE_STATE_TURN_UP,     // Upward reversal
   LINE_STATE_TURN_DOWN,   // Downward reversal
   LINE_STATE_STOP_UP,     // Upward stop
   LINE_STATE_STOP_DOWN,   // Downward stop
   LINE_STATE_ABOVE,       // Above value
   LINE_STATE_UNDER,       // Below value
   LINE_STATE_CROSS_UP,    // Crossing value upwards
   LINE_STATE_CROSS_DOWN,  // Crossing value downwards
   LINE_STATE_TOUCH_BELOW, // Touching value from below
   LINE_STATE_TOUCH_ABOVE, // Touch value from above
   LINE_STATE_EQUALS,      // Equal to value
  };
//--- input parameters
input uint                 InpPeriod=  14;            /* Period         *///
input ENUM_APPLIED_PRICE   InpPrice =  PRICE_CLOSE;   /* Applied Price  */
//--- global variables
int      handle=INVALID_HANDLE;  // Indicator handle
int      period=0;               // TRIX calculation period
int      ind_digits=0;           // Number of decimal places in the indicator values
string   ind_title;              // Indicator description
Bei der Verwendung des Dashboards wird die Klassendatei des Panels eingebunden und die Variablen für die Arbeit mit dem Panel werden hinzugefügt:
//+------------------------------------------------------------------+
//|                                           TestOscillatorTRIX.mq5 |
//|                                  Copyright 2023, MetaQuotes Ltd. |
//|                                             https://www.mql5.com |
//+------------------------------------------------------------------+
#property copyright "Copyright 2023, MetaQuotes Ltd."
#property link      "https://www.mql5.com"
#property version   "1.00"
//--- includes
#include <Dashboard\Dashboard.mqh>
//--- enums
enum ENUM_LINE_STATE
  {
   LINE_STATE_NONE,        // Undefined state
   LINE_STATE_UP,          // Upward
   LINE_STATE_DOWN,        // Downward
   LINE_STATE_TURN_UP,     // Upward reversal
   LINE_STATE_TURN_DOWN,   // Downward reversal
   LINE_STATE_STOP_UP,     // Upward stop
   LINE_STATE_STOP_DOWN,   // Downward stop
   LINE_STATE_ABOVE,       // Above value
   LINE_STATE_UNDER,       // Below value
   LINE_STATE_CROSS_UP,    // Crossing value upwards
   LINE_STATE_CROSS_DOWN,  // Crossing value downwards
   LINE_STATE_TOUCH_BELOW, // Touching value from below
   LINE_STATE_TOUCH_ABOVE, // Touch value from above
   LINE_STATE_EQUALS,      // Equal to value
  };
//--- input parameters
input uint                 InpPeriod=  14;            /* Period         *///
input ENUM_APPLIED_PRICE   InpPrice =  PRICE_CLOSE;   /* Applied Price  */
//--- global variables
int      handle=INVALID_HANDLE;  // Indicator handle
int      period=0;               // TRIX calculation period
int      ind_digits=0;           // Number of decimal places in the indicator values
string   ind_title;              // Indicator description
//--- variables for the panel
int      mouse_bar_index;        // Index of the bar the data is taken from
CDashboard *panel=NULL;          // Pointer to the panel object
Initialisierung
OnInit() für die Initialisierung der Indikatorparameter und die Erstellung seines Handles:
//+------------------------------------------------------------------+
//| Expert initialization function                                   |
//+------------------------------------------------------------------+
int OnInit()
  {
//--- create timer
   EventSetTimer(60);

//--- Indicator
//--- Set and adjust the calculation period if necessary
   period=int(InpPeriod<1 ? 14 : InpPeriod<2 ? 2 : InpPeriod);
//--- Set the indicator name and the number of decimal places
   ind_title=StringFormat("TRIX(%lu)",period);
   ind_digits=Digits();
//--- Create indicator handle
   ResetLastError();
   handle=iTriX(Symbol(),PERIOD_CURRENT,period,InpPrice);
   if(handle==INVALID_HANDLE)
     {
      PrintFormat("%s: Failed to create indicator handle %s. Error %ld",__FUNCTION__,ind_title,GetLastError());
      return INIT_FAILED;
     }

//--- Successful initialization
   return(INIT_SUCCEEDED);
  }
Das Panel wird bei Verwendung des Dashboards erstellt:
//+------------------------------------------------------------------+
//| Expert initialization function                                   |
//+------------------------------------------------------------------+
int OnInit()
  {
//--- create timer
   EventSetTimer(60);

//--- Indicator
//--- Set and adjust the calculation period if necessary
   period=int(InpPeriod<1 ? 14 : InpPeriod<2 ? 2 : InpPeriod);
//--- Set the indicator name and the number of decimal places
   ind_title=StringFormat("TRIX(%lu)",period);
   ind_digits=Digits();
//--- Create indicator handle
   ResetLastError();
   handle=iTriX(Symbol(),PERIOD_CURRENT,period,InpPrice);
   if(handle==INVALID_HANDLE)
     {
      PrintFormat("%s: Failed to create indicator handle %s. Error %ld",__FUNCTION__,ind_title,GetLastError());
      return INIT_FAILED;
     }

//--- Dashboard
//--- Create the panel
   panel=new CDashboard(1,20,20,199,225);
   if(panel==NULL)
     {
      Print("Error. Failed to create panel object");
      return INIT_FAILED;
     }
//--- Set font parameters
   panel.SetFontParams("Calibri",9);
//--- Display the panel with the "Symbol, Timeframe description" header text
   panel.View(Symbol()+", "+StringSubstr(EnumToString(Period()),7));
//--- Create a table with ID 0 to display bar data in it
   panel.CreateNewTable(0);
//--- Draw a table with ID 0 on the panel background
   panel.DrawGrid(0,2,20,6,2,18,97);

//--- Create a table with ID 1 to display indicator data in it
   panel.CreateNewTable(1);
//--- Get the Y2 table coordinate with ID 0 and
//--- set the Y1 coordinate for the table with ID 1
   int y1=panel.TableY2(0)+22;
//--- Draw a table with ID 1 on the panel background
   panel.DrawGrid(1,2,y1,3,2,18,97);

//--- Display tabular data in the journal
   panel.GridPrint(0,2);
   panel.GridPrint(1,2);
//--- Initialize the variable with the index of the mouse cursor bar
   mouse_bar_index=0;
//--- Display the data of the current bar on the panel
   DrawData(mouse_bar_index,TimeCurrent());

//--- Successful initialization
   return(INIT_SUCCEEDED);
  }
Deinitialisierung
In OnDeinit() geben wir das Handle im EA wieder frei:
//+------------------------------------------------------------------+
//| Expert deinitialization function                                 |
//+------------------------------------------------------------------+
void OnDeinit(const int reason)
  {
//--- destroy timer
   EventKillTimer();

//--- Release handle of the indicator
   ResetLastError();
   if(!IndicatorRelease(handle))
      PrintFormat("%s: IndicatorRelease failed. Error %ld",__FUNCTION__,GetLastError());
//--- Clear all comments on the chart
   Comment("");
  }
Das erstellte Dashboard-Objekt wird bei der Verwendung des Dashboards entfernt:
//+------------------------------------------------------------------+
//| Expert deinitialization function                                 |
//+------------------------------------------------------------------+
void OnDeinit(const int reason)
  {
//--- destroy timer
   EventKillTimer();

//--- Release handle of the indicator
   ResetLastError();
   if(!IndicatorRelease(handle))
      PrintFormat("%s: IndicatorRelease failed. Error %ld",__FUNCTION__,GetLastError());
//--- Clear all comments on the chart
   Comment("");

//--- If the panel object exists, delete it
   if(panel!=NULL)
      delete panel;
  }
Abrufen von Daten
Allgemeine Funktionen zum Abrufen von Daten über das Indikatorhandle:
//+------------------------------------------------------------------+
//| Return the indicator data on the specified bar                   |
//+------------------------------------------------------------------+
double IndicatorValue(const int ind_handle,const int index,const int buffer_num)
  {
   double array[1]={0};
   ResetLastError();
   if(CopyBuffer(ind_handle,buffer_num,index,1,array)!=1)
     {
      PrintFormat("%s: CopyBuffer failed. Error %ld",__FUNCTION__,GetLastError());
      return EMPTY_VALUE;
     }
   return array[0];
  }
//+------------------------------------------------------------------+
//| Return the state of the indicator line                           |
//+------------------------------------------------------------------+
ENUM_LINE_STATE LineState(const int ind_handle,const int index,const int buffer_num)
  {
//--- Get the values of the indicator line with the shift (0,1,2) relative to the passed index
   const double value0=IndicatorValue(ind_handle,index,  buffer_num);
   const double value1=IndicatorValue(ind_handle,index+1,buffer_num);
   const double value2=IndicatorValue(ind_handle,index+2,buffer_num);
//--- If at least one of the values could not be obtained, return an undefined value
   if(value0==EMPTY_VALUE || value1==EMPTY_VALUE || value2==EMPTY_VALUE)
      return LINE_STATE_NONE;
//--- Line upward reversal (value2>value1 && value0>value1)
   if(NormalizeDouble(value2-value1,ind_digits)>0 && NormalizeDouble(value0-value1,ind_digits)>0)
      return LINE_STATE_TURN_UP;
//--- Line upward direction (value2<=value1 && value0>value1)
   else if(NormalizeDouble(value2-value1,ind_digits)<=0 && NormalizeDouble(value0-value1,ind_digits)>0)
      return LINE_STATE_UP;
//--- Line upward stop (value2<=value1 && value0==value1)
   else if(NormalizeDouble(value2-value1,ind_digits)<=0 && NormalizeDouble(value0-value1,ind_digits)==0)
      return LINE_STATE_STOP_UP;
//--- Line downward reversal (value2<value1 && value0<value1)
   if(NormalizeDouble(value2-value1,ind_digits)<0 && NormalizeDouble(value0-value1,ind_digits)<0)
      return LINE_STATE_TURN_DOWN;
//--- Line downward direction (value2>=value1 && value0<value1)
   else if(NormalizeDouble(value2-value1,ind_digits)>=0 && NormalizeDouble(value0-value1,ind_digits)<0)
      return LINE_STATE_DOWN;
//--- Line downward stop (value2>=value1 && value0==value1)
   else if(NormalizeDouble(value2-value1,ind_digits)>=0 && NormalizeDouble(value0-value1,ind_digits)==0)
      return LINE_STATE_STOP_DOWN;
//--- Undefined state
   return LINE_STATE_NONE;
  }
//+------------------------------------------------------------------+
//| Return the state of the line relative to the specified level     |
//+------------------------------------------------------------------+
ENUM_LINE_STATE LineStateRelative(const int ind_handle,const int index,const int buffer_num,const double level0,const double level1=EMPTY_VALUE)
  {
//--- Get the values of the indicator line with the shift (0,1) relative to the passed index
   const double value0=IndicatorValue(ind_handle,index,  buffer_num);
   const double value1=IndicatorValue(ind_handle,index+1,buffer_num);
//--- If at least one of the values could not be obtained, return an undefined value
   if(value0==EMPTY_VALUE || value1==EMPTY_VALUE)
      return LINE_STATE_NONE;
//--- Define the second level to compare
   double level=(level1==EMPTY_VALUE ? level0 : level1);
//--- The line is below the level (value1<level && value0<level0)
   if(NormalizeDouble(value1-level,ind_digits)<0 && NormalizeDouble(value0-level0,ind_digits)<0)
      return LINE_STATE_UNDER;
//--- The line is above the level (value1>level && value0>level0)
   if(NormalizeDouble(value1-level,ind_digits)>0 && NormalizeDouble(value0-level0,ind_digits)>0)
      return LINE_STATE_ABOVE;
//--- The line crossed the level upwards (value1<=level && value0>level0)
   if(NormalizeDouble(value1-level,ind_digits)<=0 && NormalizeDouble(value0-level0,ind_digits)>0)
      return LINE_STATE_CROSS_UP;
//--- The line crossed the level downwards (value1>=level && value0<level0)
   if(NormalizeDouble(value1-level,ind_digits)>=0 && NormalizeDouble(value0-level0,ind_digits)<0)
      return LINE_STATE_CROSS_DOWN;
//--- The line touched the level from below (value1<level0 && value0==level0)
   if(NormalizeDouble(value1-level,ind_digits)<0 && NormalizeDouble(value0-level0,ind_digits)==0)
      return LINE_STATE_TOUCH_BELOW;
//--- The line touched the level from above (value1>level0 && value0==level0)
   if(NormalizeDouble(value1-level,ind_digits)>0 && NormalizeDouble(value0-level0,ind_digits)==0)
      return LINE_STATE_TOUCH_BELOW;
//--- Line is equal to the level value (value1==level0 && value0==level0)
   if(NormalizeDouble(value1-level,ind_digits)==0 && NormalizeDouble(value0-level0,ind_digits)==0)
      return LINE_STATE_EQUALS;
//--- Undefined state
   return LINE_STATE_NONE;
  }
//+------------------------------------------------------------------+
//| Return the indicator line state description                      |
//+------------------------------------------------------------------+
string LineStateDescription(const ENUM_LINE_STATE state)
  {
   switch(state)
     {
      case LINE_STATE_UP         :  return "Up";
      case LINE_STATE_STOP_UP    :  return "Stop Up";
      case LINE_STATE_TURN_UP    :  return "Turn Up";
      case LINE_STATE_DOWN       :  return "Down";
      case LINE_STATE_STOP_DOWN  :  return "Stop Down";
      case LINE_STATE_TURN_DOWN  :  return "Turn Down";
      case LINE_STATE_ABOVE      :  return "Above level";
      case LINE_STATE_UNDER      :  return "Under level";
      case LINE_STATE_CROSS_UP   :  return "Crossing Up";
      case LINE_STATE_CROSS_DOWN :  return "Crossing Down";
      case LINE_STATE_TOUCH_BELOW:  return "Touch from Below";
      case LINE_STATE_TOUCH_ABOVE:  return "Touch from Above";
      case LINE_STATE_EQUALS     :  return "Equals";
      default                    :  return "Unknown";
     }
  }
Wenn wir das Dashboard verwenden, werden die Daten mit Hilfe der Funktion auf dem Bedienfeld angezeigt:
//+------------------------------------------------------------------+
//| Display data from the specified timeseries index to the panel    |
//+------------------------------------------------------------------+
void DrawData(const int index,const datetime time)
  {
//--- Declare the variables to receive data in them
   MqlTick  tick={0};
   MqlRates rates[1];

//--- Exit if unable to get the current prices
   if(!SymbolInfoTick(Symbol(),tick))
      return;
//--- Exit if unable to get the bar data by the specified index
   if(CopyRates(Symbol(),PERIOD_CURRENT,index,1,rates)!=1)
      return;

//--- Set font parameters for bar and indicator data headers
   int  size=0;
   uint flags=0;
   uint angle=0;
   string name=panel.FontParams(size,flags,angle);
   panel.SetFontParams(name,9,FW_BOLD);
   panel.DrawText("Bar data ["+(string)index+"]",3,panel.TableY1(0)-16,clrMaroon,panel.Width()-6);
   panel.DrawText("Indicator data ["+(string)index+"]",3,panel.TableY1(1)-16,clrGreen,panel.Width()-6);
//--- Set font parameters for bar and indicator data
   panel.SetFontParams(name,9);

//--- Display the data of the specified bar in table 0 on the panel
   panel.DrawText("Date",  panel.CellX(0,0,0)+2, panel.CellY(0,0,0)+2); panel.DrawText(TimeToString(  rates[0].time,TIME_DATE),     panel.CellX(0,0,1)+2, panel.CellY(0,0,1)+2,clrNONE,90);
   panel.DrawText("Time",  panel.CellX(0,1,0)+2, panel.CellY(0,1,0)+2); panel.DrawText(TimeToString(  rates[0].time,TIME_MINUTES),  panel.CellX(0,1,1)+2, panel.CellY(0,1,1)+2,clrNONE,90);
   panel.DrawText("Open",  panel.CellX(0,2,0)+2, panel.CellY(0,2,0)+2); panel.DrawText(DoubleToString(rates[0].open,Digits()),      panel.CellX(0,2,1)+2, panel.CellY(0,2,1)+2,clrNONE,90);
   panel.DrawText("High",  panel.CellX(0,3,0)+2, panel.CellY(0,3,0)+2); panel.DrawText(DoubleToString(rates[0].high,Digits()),      panel.CellX(0,3,1)+2, panel.CellY(0,3,1)+2,clrNONE,90);
   panel.DrawText("Low",   panel.CellX(0,4,0)+2, panel.CellY(0,4,0)+2); panel.DrawText(DoubleToString(rates[0].low,Digits()),       panel.CellX(0,4,1)+2, panel.CellY(0,4,1)+2,clrNONE,90);
   panel.DrawText("Close", panel.CellX(0,5,0)+2, panel.CellY(0,5,0)+2); panel.DrawText(DoubleToString(rates[0].close,Digits()),     panel.CellX(0,5,1)+2, panel.CellY(0,5,1)+2,clrNONE,90);

//--- Display the indicator data from the specified bar on the panel in table 1
   panel.DrawText(ind_title, panel.CellX(1,0,0)+2, panel.CellY(1,0,0)+2);
   double value=IndicatorValue(handle,index,0);
   string value_str=(value!=EMPTY_VALUE ? DoubleToString(value,ind_digits) : "");
   panel.DrawText(value_str,panel.CellX(1,0,1)+2,panel.CellY(1,0,1)+2,clrNONE,90);

//--- Display a description of the indicator line state
   panel.DrawText("Line state", panel.CellX(1,1,0)+2, panel.CellY(1,1,0)+2);
   ENUM_LINE_STATE state=LineState(handle,index,0);
//--- The label color changes depending on the value of the line above/below zero
   color clr=(value<0 ? clrRed : value>0 ? clrBlue : clrNONE);
   panel.DrawText(LineStateDescription(state),panel.CellX(1,1,1)+2,panel.CellY(1,1,1)+2,clr,90);

//--- Display a description of the indicator line state relative to zero
   panel.DrawText("TRIX vs Zero", panel.CellX(1,2,0)+2, panel.CellY(1,2,0)+2);
   ENUM_LINE_STATE state_zero=LineStateRelative(handle,index,0,0);
   string state_zero_str=
     (
      state_zero==LINE_STATE_ABOVE        ?  "TRIX > 0"  :
      state_zero==LINE_STATE_UNDER        ?  "TRIX < 0"  :
      state_zero==LINE_STATE_TOUCH_ABOVE  ||
      state_zero==LINE_STATE_TOUCH_BELOW  ?  "Touch"     :
      LineStateDescription(state_zero)
     );
//--- The label color changes depending on the value of the line relative to the level
   clr=(state_zero==LINE_STATE_CROSS_UP ? clrBlue : state_zero==LINE_STATE_CROSS_DOWN ? clrRed : clrNONE);
   panel.DrawText(state_zero_str,panel.CellX(1,2,1)+2,panel.CellY(1,2,1)+2,clr,90);

//--- Redraw the chart to immediately display all changes on the panel
   ChartRedraw(ChartID());
  }
Die Zustände der Linie und ihr Verhältnis zum Nullpunkt sind auf dem Dashboard farblich markiert.
Außerdem wird die Ereignisbehandlung des Panel von OnChartEvent() aufgerufen, und die Ereignisse für den Empfang des Balkenindex unter dem Cursor werden behandelt:
//+------------------------------------------------------------------+
//| ChartEvent function                                              |
//+------------------------------------------------------------------+
void OnChartEvent(const int id,
                  const long &lparam,
                  const double &dparam,
                  const string &sparam)
  {
//--- Handling the panel
//--- Call the panel event handler
   panel.OnChartEvent(id,lparam,dparam,sparam);

//--- If the cursor moves or a click is made on the chart
   if(id==CHARTEVENT_MOUSE_MOVE || id==CHARTEVENT_CLICK)
     {
      //--- Declare the variables to record time and price coordinates in them
      datetime time=0;
      double price=0;
      int wnd=0;
      //--- If the cursor coordinates are converted to date and time
      if(ChartXYToTimePrice(ChartID(),(int)lparam,(int)dparam,wnd,time,price))
        {
         //--- write the bar index where the cursor is located to a global variable
         mouse_bar_index=iBarShift(Symbol(),PERIOD_CURRENT,time);
         //--- Display the bar data under the cursor on the panel
         DrawData(mouse_bar_index,time);
        }
     }

//--- If we received a custom event, display the appropriate message in the journal
   if(id>CHARTEVENT_CUSTOM)
     {
      //--- Here we can implement handling a click on the close button on the panel
      PrintFormat("%s: Event id=%ld, object id (lparam): %lu, event message (sparam): %s",__FUNCTION__,id,lparam,sparam);
     }
  }
Nachdem wir den EA kompiliert und auf dem Chart gestartet haben, können wir den Status der Indikatorlinie auf dem Panel überwachen:
Die EA-Datei „TestOscillatorTRIX.mq5“ ist unten angehängt.
Williams' Percent Range
Der Williams' Percent Range (%R) ist ein dynamischer technischer Indikator, der bestimmt, ob der Markt überkauft/überverkauft ist. Williams' Percent Range ist dem Stochastic Oszillator sehr ähnlich. Der einzige Unterschied ist, dass die Skala des %R umgekehrt ist und der Stochastik-Oszillator eine interne Glättung hat.
Der einzige Unterschied besteht darin, dass %R eine umgekehrte Skala hat und der Stochastik-Oszillator eine interne Glättung hat. Indikatorwerte zwischen -80% und -100% zeigen an, dass der Markt überverkauft ist. Indikatorwerte zwischen -0% und -20% deuten darauf hin, dass der Markt überkauft ist. Das Minuszeichen sollte von der Analyse ignoriert werden.
Wie mit allen Indikatoren, die überkaufte oder überverkaufte Zustände anzeigen, ist es am besten darauf zu warten, ob der Preis das Signal bestätigt. Zum Beispiel, wenn ein Indikator dieser Art einen überkauften Markt anzeigt, ist es sinnvoll zu warten, bis der Preis des Instruments tatsächlich umdreht.
Eine interessante Eigenschaft des Williams' Percent Range Indikators ist die verblüffende Fähigkeit Umkehrungen im Preis anzuzeigen. Der Indikator formt nahezu immer ein paar Tage vor den Preisen ein Hoch und dreht um. Das gleiche gilt für die umgekehrte Richtung.
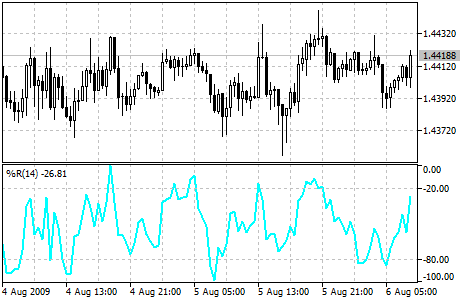
Parameter
Der Indikator hat einen konfigurierbaren Parameter — den Berechnungszeitraum. Der Standardwert ist 14.
Um die Signale des Indikators zu bestimmen, ist es notwendig, die Lage der Linie im überkauften/überverkauften Bereich zu berücksichtigen. Um dies zu erreichen, sollten die Werte der Level zu den EA-Eingaben hinzugefügt werden.
Eingabe- und globale Variablen für die Verwendung des Indikators im EA:
//+------------------------------------------------------------------+
//|                                            TestOscillatorWPR.mq5 |
//|                                  Copyright 2023, MetaQuotes Ltd. |
//|                                             https://www.mql5.com |
//+------------------------------------------------------------------+
#property copyright "Copyright 2023, MetaQuotes Ltd."
#property link      "https://www.mql5.com"
#property version   "1.00"
//--- enums
enum ENUM_LINE_STATE
  {
   LINE_STATE_NONE,        // Undefined state
   LINE_STATE_UP,          // Upward
   LINE_STATE_DOWN,        // Downward
   LINE_STATE_TURN_UP,     // Upward reversal
   LINE_STATE_TURN_DOWN,   // Downward reversal
   LINE_STATE_STOP_UP,     // Upward stop
   LINE_STATE_STOP_DOWN,   // Downward stop
   LINE_STATE_ABOVE,       // Above value
   LINE_STATE_UNDER,       // Below value
   LINE_STATE_CROSS_UP,    // Crossing value upwards
   LINE_STATE_CROSS_DOWN,  // Crossing value downwards
   LINE_STATE_TOUCH_BELOW, // Touching value from below
   LINE_STATE_TOUCH_ABOVE, // Touch value from above
   LINE_STATE_EQUALS,      // Equal to value
  };
//--- input parameters
input uint  InpPeriod   =  14;                     /* Period   */
input double               InpOverbough= -20.0;    /* Overbough level*/
input double               InpOversold = -80.0;    /* Oversold level */
//--- global variables
int      handle=INVALID_HANDLE;  // Indicator handle
int      period=0;               // TRIX calculation period
int      ind_digits=0;           // Number of decimal places in the indicator values
double   overbough=0;            // Overbought level
double   oversold=0;             // Oversold level
string   ind_title;              // Indicator description
Bei der Verwendung des Dashboards wird die Klassendatei des Panels eingebunden und die Variablen für die Arbeit mit dem Panel werden hinzugefügt:
//+------------------------------------------------------------------+
//|                                            TestOscillatorWPR.mq5 |
//|                                  Copyright 2023, MetaQuotes Ltd. |
//|                                             https://www.mql5.com |
//+------------------------------------------------------------------+
#property copyright "Copyright 2023, MetaQuotes Ltd."
#property link      "https://www.mql5.com"
#property version   "1.00"
//--- includes
#include <Dashboard\Dashboard.mqh>
//--- enums
enum ENUM_LINE_STATE
  {
   LINE_STATE_NONE,        // Undefined state
   LINE_STATE_UP,          // Upward
   LINE_STATE_DOWN,        // Downward
   LINE_STATE_TURN_UP,     // Upward reversal
   LINE_STATE_TURN_DOWN,   // Downward reversal
   LINE_STATE_STOP_UP,     // Upward stop
   LINE_STATE_STOP_DOWN,   // Downward stop
   LINE_STATE_ABOVE,       // Above value
   LINE_STATE_UNDER,       // Below value
   LINE_STATE_CROSS_UP,    // Crossing value upwards
   LINE_STATE_CROSS_DOWN,  // Crossing value downwards
   LINE_STATE_TOUCH_BELOW, // Touching value from below
   LINE_STATE_TOUCH_ABOVE, // Touch value from above
   LINE_STATE_EQUALS,      // Equal to value
  };
//--- input parameters
input uint  InpPeriod   =  14;                     /* Period   */
input double               InpOverbough= -20.0;    /* Overbough level*/
input double               InpOversold = -80.0;    /* Oversold level */
//--- global variables
int      handle=INVALID_HANDLE;  // Indicator handle
int      period=0;               // TRIX calculation period
int      ind_digits=0;           // Number of decimal places in the indicator values
double   overbough=0;            // Overbought level
double   oversold=0;             // Oversold level
string   ind_title;              // Indicator description
//--- variables for the panel
int      mouse_bar_index;        // Index of the bar the data is taken from
CDashboard *panel=NULL;          // Pointer to the panel object
Initialisierung
OnInit() für die Initialisierung der Indikatorparameter und die Erstellung seines Handles:
//+------------------------------------------------------------------+
//| Expert initialization function                                   |
//+------------------------------------------------------------------+
int OnInit()
  {
//--- create timer
   EventSetTimer(60);

//--- Indicator
//--- Set and adjust the calculation period and levels if necessary
   period=int(InpPeriod<1 ? 14 : InpPeriod);
   overbough=InpOverbough;
   oversold=(InpOversold>=overbough ? overbough-0.01 : InpOversold);
//--- Set the indicator name and the number of decimal places
   ind_title=StringFormat("%%R(%lu)",period);
   ind_digits=2;
//--- Create indicator handle
   ResetLastError();
   handle=iWPR(Symbol(),PERIOD_CURRENT,period);
   if(handle==INVALID_HANDLE)
     {
      PrintFormat("%s: Failed to create indicator handle %s. Error %ld",__FUNCTION__,ind_title,GetLastError());
      return INIT_FAILED;
     }

//--- Successful initialization
   return(INIT_SUCCEEDED);
  }
Das Panel wird bei Verwendung des Dashboards erstellt:
//+------------------------------------------------------------------+
//| Expert initialization function                                   |
//+------------------------------------------------------------------+
int OnInit()
  {
//--- create timer
   EventSetTimer(60);

//--- Indicator
//--- Set and adjust the calculation period and levels if necessary
   period=int(InpPeriod<1 ? 14 : InpPeriod);
   overbough=InpOverbough;
   oversold=(InpOversold>=overbough ? overbough-0.01 : InpOversold);
//--- Set the indicator name and the number of decimal places
   ind_title=StringFormat("%%R(%lu)",period);
   ind_digits=2;
//--- Create indicator handle
   ResetLastError();
   handle=iWPR(Symbol(),PERIOD_CURRENT,period);
   if(handle==INVALID_HANDLE)
     {
      PrintFormat("%s: Failed to create indicator handle %s. Error %ld",__FUNCTION__,ind_title,GetLastError());
      return INIT_FAILED;
     }

//--- Dashboard
//--- Create the panel
   panel=new CDashboard(1,20,20,229,243);
   if(panel==NULL)
     {
      Print("Error. Failed to create panel object");
      return INIT_FAILED;
     }
//--- Set font parameters
   panel.SetFontParams("Calibri",9);
//--- Display the panel with the "Symbol, Timeframe description" header text
   panel.View(Symbol()+", "+StringSubstr(EnumToString(Period()),7));
//--- Create a table with ID 0 to display bar data in it
   panel.CreateNewTable(0);
//--- Draw a table with ID 0 on the panel background
   panel.DrawGrid(0,2,20,6,2,18,112);

//--- Create a table with ID 1 to display indicator data in it
   panel.CreateNewTable(1);
//--- Get the Y2 table coordinate with ID 0 and
//--- set the Y1 coordinate for the table with ID 1
   int y1=panel.TableY2(0)+22;
//--- Draw a table with ID 1 on the panel background
   panel.DrawGrid(1,2,y1,4,2,18,112);

//--- Display tabular data in the journal
   panel.GridPrint(0,2);
   panel.GridPrint(1,2);
//--- Initialize the variable with the index of the mouse cursor bar
   mouse_bar_index=0;
//--- Display the data of the current bar on the panel
   DrawData(mouse_bar_index,TimeCurrent());

//--- Successful initialization
   return(INIT_SUCCEEDED);
  }
Deinitialisierung
In OnDeinit() geben wir das Handle im EA wieder frei:
//+------------------------------------------------------------------+
//| Expert deinitialization function                                 |
//+------------------------------------------------------------------+
void OnDeinit(const int reason)
  {
//--- destroy timer
   EventKillTimer();

//--- Release handle of the indicator
   ResetLastError();
   if(!IndicatorRelease(handle))
      PrintFormat("%s: IndicatorRelease failed. Error %ld",__FUNCTION__,GetLastError());
//--- Clear all comments on the chart
   Comment("");
  }
Das erstellte Dashboard-Objekt wird bei der Verwendung des Dashboards entfernt:
//+------------------------------------------------------------------+
//| Expert deinitialization function                                 |
//+------------------------------------------------------------------+
void OnDeinit(const int reason)
  {
//--- destroy timer
   EventKillTimer();

//--- Release handle of the indicator
   ResetLastError();
   if(!IndicatorRelease(handle))
      PrintFormat("%s: IndicatorRelease failed. Error %ld",__FUNCTION__,GetLastError());
//--- Clear all comments on the chart
   Comment("");

//--- If the panel object exists, delete it
   if(panel!=NULL)
      delete panel;
  }
Abrufen von Daten
Allgemeine Funktionen zum Abrufen von Daten über das Indikatorhandle:
//+------------------------------------------------------------------+
//| Return the indicator data on the specified bar                   |
//+------------------------------------------------------------------+
double IndicatorValue(const int ind_handle,const int index,const int buffer_num)
  {
   double array[1]={0};
   ResetLastError();
   if(CopyBuffer(ind_handle,buffer_num,index,1,array)!=1)
     {
      PrintFormat("%s: CopyBuffer failed. Error %ld",__FUNCTION__,GetLastError());
      return EMPTY_VALUE;
     }
   return array[0];
  }
//+------------------------------------------------------------------+
//| Return the state of the indicator line                           |
//+------------------------------------------------------------------+
ENUM_LINE_STATE LineState(const int ind_handle,const int index,const int buffer_num)
  {
//--- Get the values of the indicator line with the shift (0,1,2) relative to the passed index
   const double value0=IndicatorValue(ind_handle,index,  buffer_num);
   const double value1=IndicatorValue(ind_handle,index+1,buffer_num);
   const double value2=IndicatorValue(ind_handle,index+2,buffer_num);
//--- If at least one of the values could not be obtained, return an undefined value
   if(value0==EMPTY_VALUE || value1==EMPTY_VALUE || value2==EMPTY_VALUE)
      return LINE_STATE_NONE;
//--- Line upward reversal (value2>value1 && value0>value1)
   if(NormalizeDouble(value2-value1,ind_digits)>0 && NormalizeDouble(value0-value1,ind_digits)>0)
      return LINE_STATE_TURN_UP;
//--- Line upward direction (value2<=value1 && value0>value1)
   else if(NormalizeDouble(value2-value1,ind_digits)<=0 && NormalizeDouble(value0-value1,ind_digits)>0)
      return LINE_STATE_UP;
//--- Line upward stop (value2<=value1 && value0==value1)
   else if(NormalizeDouble(value2-value1,ind_digits)<=0 && NormalizeDouble(value0-value1,ind_digits)==0)
      return LINE_STATE_STOP_UP;
//--- Line downward reversal (value2<value1 && value0<value1)
   if(NormalizeDouble(value2-value1,ind_digits)<0 && NormalizeDouble(value0-value1,ind_digits)<0)
      return LINE_STATE_TURN_DOWN;
//--- Line downward direction (value2>=value1 && value0<value1)
   else if(NormalizeDouble(value2-value1,ind_digits)>=0 && NormalizeDouble(value0-value1,ind_digits)<0)
      return LINE_STATE_DOWN;
//--- Line downward stop (value2>=value1 && value0==value1)
   else if(NormalizeDouble(value2-value1,ind_digits)>=0 && NormalizeDouble(value0-value1,ind_digits)==0)
      return LINE_STATE_STOP_DOWN;
//--- Undefined state
   return LINE_STATE_NONE;
  }
//+------------------------------------------------------------------+
//| Return the state of the line relative to the specified level     |
//+------------------------------------------------------------------+
ENUM_LINE_STATE LineStateRelative(const int ind_handle,const int index,const int buffer_num,const double level0,const double level1=EMPTY_VALUE)
  {
//--- Get the values of the indicator line with the shift (0,1) relative to the passed index
   const double value0=IndicatorValue(ind_handle,index,  buffer_num);
   const double value1=IndicatorValue(ind_handle,index+1,buffer_num);
//--- If at least one of the values could not be obtained, return an undefined value
   if(value0==EMPTY_VALUE || value1==EMPTY_VALUE)
      return LINE_STATE_NONE;
//--- Define the second level to compare
   double level=(level1==EMPTY_VALUE ? level0 : level1);
//--- The line is below the level (value1<level && value0<level0)
   if(NormalizeDouble(value1-level,ind_digits)<0 && NormalizeDouble(value0-level0,ind_digits)<0)
      return LINE_STATE_UNDER;
//--- The line is above the level (value1>level && value0>level0)
   if(NormalizeDouble(value1-level,ind_digits)>0 && NormalizeDouble(value0-level0,ind_digits)>0)
      return LINE_STATE_ABOVE;
//--- The line crossed the level upwards (value1<=level && value0>level0)
   if(NormalizeDouble(value1-level,ind_digits)<=0 && NormalizeDouble(value0-level0,ind_digits)>0)
      return LINE_STATE_CROSS_UP;
//--- The line crossed the level downwards (value1>=level && value0<level0)
   if(NormalizeDouble(value1-level,ind_digits)>=0 && NormalizeDouble(value0-level0,ind_digits)<0)
      return LINE_STATE_CROSS_DOWN;
//--- The line touched the level from below (value1<level0 && value0==level0)
   if(NormalizeDouble(value1-level,ind_digits)<0 && NormalizeDouble(value0-level0,ind_digits)==0)
      return LINE_STATE_TOUCH_BELOW;
//--- The line touched the level from above (value1>level0 && value0==level0)
   if(NormalizeDouble(value1-level,ind_digits)>0 && NormalizeDouble(value0-level0,ind_digits)==0)
      return LINE_STATE_TOUCH_BELOW;
//--- Line is equal to the level value (value1==level0 && value0==level0)
   if(NormalizeDouble(value1-level,ind_digits)==0 && NormalizeDouble(value0-level0,ind_digits)==0)
      return LINE_STATE_EQUALS;
//--- Undefined state
   return LINE_STATE_NONE;
  }
//+------------------------------------------------------------------+
//| Return the indicator line state description                      |
//+------------------------------------------------------------------+
string LineStateDescription(const ENUM_LINE_STATE state)
  {
   switch(state)
     {
      case LINE_STATE_UP         :  return "Up";
      case LINE_STATE_STOP_UP    :  return "Stop Up";
      case LINE_STATE_TURN_UP    :  return "Turn Up";
      case LINE_STATE_DOWN       :  return "Down";
      case LINE_STATE_STOP_DOWN  :  return "Stop Down";
      case LINE_STATE_TURN_DOWN  :  return "Turn Down";
      case LINE_STATE_ABOVE      :  return "Above level";
      case LINE_STATE_UNDER      :  return "Under level";
      case LINE_STATE_CROSS_UP   :  return "Crossing Up";
      case LINE_STATE_CROSS_DOWN :  return "Crossing Down";
      case LINE_STATE_TOUCH_BELOW:  return "Touch from Below";
      case LINE_STATE_TOUCH_ABOVE:  return "Touch from Above";
      case LINE_STATE_EQUALS     :  return "Equals";
      default                    :  return "Unknown";
     }
  }
Wenn wir das Dashboard verwenden, werden die Daten mit Hilfe der Funktion auf dem Bedienfeld angezeigt:
//+------------------------------------------------------------------+
//| Display data from the specified timeseries index to the panel    |
//+------------------------------------------------------------------+
void DrawData(const int index,const datetime time)
  {
//--- Declare the variables to receive data in them
   MqlTick  tick={0};
   MqlRates rates[1];

//--- Exit if unable to get the current prices
   if(!SymbolInfoTick(Symbol(),tick))
      return;
//--- Exit if unable to get the bar data by the specified index
   if(CopyRates(Symbol(),PERIOD_CURRENT,index,1,rates)!=1)
      return;

//--- Set font parameters for bar and indicator data headers
   int  size=0;
   uint flags=0;
   uint angle=0;
   string name=panel.FontParams(size,flags,angle);
   panel.SetFontParams(name,9,FW_BOLD);
   panel.DrawText("Bar data ["+(string)index+"]",3,panel.TableY1(0)-16,clrMaroon,panel.Width()-6);
   panel.DrawText("Indicator data ["+(string)index+"]",3,panel.TableY1(1)-16,clrGreen,panel.Width()-6);
//--- Set font parameters for bar and indicator data
   panel.SetFontParams(name,9);

//--- Display the data of the specified bar in table 0 on the panel
   panel.DrawText("Date",  panel.CellX(0,0,0)+2, panel.CellY(0,0,0)+2); panel.DrawText(TimeToString(  rates[0].time,TIME_DATE),     panel.CellX(0,0,1)+2, panel.CellY(0,0,1)+2,clrNONE,90);
   panel.DrawText("Time",  panel.CellX(0,1,0)+2, panel.CellY(0,1,0)+2); panel.DrawText(TimeToString(  rates[0].time,TIME_MINUTES),  panel.CellX(0,1,1)+2, panel.CellY(0,1,1)+2,clrNONE,90);
   panel.DrawText("Open",  panel.CellX(0,2,0)+2, panel.CellY(0,2,0)+2); panel.DrawText(DoubleToString(rates[0].open,Digits()),      panel.CellX(0,2,1)+2, panel.CellY(0,2,1)+2,clrNONE,90);
   panel.DrawText("High",  panel.CellX(0,3,0)+2, panel.CellY(0,3,0)+2); panel.DrawText(DoubleToString(rates[0].high,Digits()),      panel.CellX(0,3,1)+2, panel.CellY(0,3,1)+2,clrNONE,90);
   panel.DrawText("Low",   panel.CellX(0,4,0)+2, panel.CellY(0,4,0)+2); panel.DrawText(DoubleToString(rates[0].low,Digits()),       panel.CellX(0,4,1)+2, panel.CellY(0,4,1)+2,clrNONE,90);
   panel.DrawText("Close", panel.CellX(0,5,0)+2, panel.CellY(0,5,0)+2); panel.DrawText(DoubleToString(rates[0].close,Digits()),     panel.CellX(0,5,1)+2, panel.CellY(0,5,1)+2,clrNONE,90);

//--- Display the indicator data from the specified bar on the panel in table 1
   panel.DrawText(ind_title, panel.CellX(1,0,0)+2, panel.CellY(1,0,0)+2);
   double value=IndicatorValue(handle,index,0);
   string value_str=(value!=EMPTY_VALUE ? DoubleToString(value,ind_digits) : "");
   panel.DrawText(value_str,panel.CellX(1,0,1)+2,panel.CellY(1,0,1)+2,clrNONE,90);

//--- Get the state of the line and the states relative to the levels
   ENUM_LINE_STATE state=LineState(handle,index,0);
   ENUM_LINE_STATE state_ovb=LineStateRelative(handle,index,0,overbough);
   ENUM_LINE_STATE state_ovs=LineStateRelative(handle,index,0,oversold);

//--- Display a description of the indicator line state relative to the overbought level
   string ovb=StringFormat("%+.2f",overbough);
   panel.DrawText("Overbough", panel.CellX(1,2,0)+2, panel.CellY(1,2,0)+2);
   panel.DrawText(ovb, panel.CellX(1,2,0)+66, panel.CellY(1,2,0)+2);
   color clr=clrNONE;
//--- The label color changes depending on the value of the line relative to the level
   clr=
     (
      state_ovb==LINE_STATE_CROSS_DOWN ||
      (state_ovb==LINE_STATE_ABOVE && state==LINE_STATE_TURN_DOWN) ? clrRed : clrNONE
     );
   string ovb_str=(state_ovb==LINE_STATE_ABOVE ? "Inside the area" : LineStateDescription(state_ovb));
   panel.DrawText(ovb_str,panel.CellX(1,2,1)+2,panel.CellY(1,2,1)+2,clr,90);

//--- Display a description of the indicator line state relative to the oversold level
   panel.DrawText("Oversold", panel.CellX(1,3,0)+2, panel.CellY(1,3,0)+2);
   string ovs=StringFormat("%+.2f",oversold);
   panel.DrawText(ovs, panel.CellX(1,3,0)+68, panel.CellY(1,3,0)+2);
//--- The label color changes depending on the value of the line relative to the level
   clr=
     (
      state_ovs==LINE_STATE_CROSS_UP ||
      (state_ovs==LINE_STATE_UNDER && state==LINE_STATE_TURN_UP) ? clrBlue : clrNONE
     );
   string ovs_str=(state_ovs==LINE_STATE_UNDER ? "Inside the area" : LineStateDescription(state_ovs));
   panel.DrawText(ovs_str,panel.CellX(1,3,1)+2,panel.CellY(1,3,1)+2,clr,90);

//--- Display a description of the indicator line state
   panel.DrawText("Line state", panel.CellX(1,1,0)+2, panel.CellY(1,1,0)+2);
//--- The label color changes depending on the location of the line in the overbought/oversold areas
   clr=(state_ovb==LINE_STATE_ABOVE ? clrOrangeRed : state_ovs==LINE_STATE_UNDER ? clrDodgerBlue : clrNONE);
   panel.DrawText(LineStateDescription(state),panel.CellX(1,1,1)+2,panel.CellY(1,1,1)+2,clr,90);

//--- Redraw the chart to immediately display all changes on the panel
   ChartRedraw(ChartID());
  }
Die Position der Indikatorlinie in überkauften und überverkauften Bereichen, die Indikatorsignale und der Zustand der Linie werden auf dem Dashboard farblich gekennzeichnet.
Außerdem wird die Ereignisbehandlung des Panel von OnChartEvent() aufgerufen, und die Ereignisse für den Empfang des Balkenindex unter dem Cursor werden behandelt:
//+------------------------------------------------------------------+
//| ChartEvent function                                              |
//+------------------------------------------------------------------+
void OnChartEvent(const int id,
                  const long &lparam,
                  const double &dparam,
                  const string &sparam)
  {
//--- Handling the panel
//--- Call the panel event handler
   panel.OnChartEvent(id,lparam,dparam,sparam);

//--- If the cursor moves or a click is made on the chart
   if(id==CHARTEVENT_MOUSE_MOVE || id==CHARTEVENT_CLICK)
     {
      //--- Declare the variables to record time and price coordinates in them
      datetime time=0;
      double price=0;
      int wnd=0;
      //--- If the cursor coordinates are converted to date and time
      if(ChartXYToTimePrice(ChartID(),(int)lparam,(int)dparam,wnd,time,price))
        {
         //--- write the bar index where the cursor is located to a global variable
         mouse_bar_index=iBarShift(Symbol(),PERIOD_CURRENT,time);
         //--- Display the bar data under the cursor on the panel
         DrawData(mouse_bar_index,time);
        }
     }

//--- If we received a custom event, display the appropriate message in the journal
   if(id>CHARTEVENT_CUSTOM)
     {
      //--- Here we can implement handling a click on the close button on the panel
      PrintFormat("%s: Event id=%ld, object id (lparam): %lu, event message (sparam): %s",__FUNCTION__,id,lparam,sparam);
     }
  }
Nachdem wir den EA kompiliert und auf dem Chart gestartet haben, können wir den Status der Indikatorlinie auf dem Panel überwachen:
Die EA-Datei „TestOscillatorWPR.mq5“ ist unten angehängt.
Schlussfolgerung
Der Artikel befasste sich mit der Verbindung von Oszillatoren mit EAs. Mit Hilfe des Dashboards können wir die Werte und Signale der Indikatoren überwachen, die durch gemeinsame universelle Funktionen erhalten werden. Alle hier vorgeschlagenen Codes lassen sich leicht auf EA-Codes übertragen. Sie können so wie sie sind mit Copy-Paste verwendet werden oder aus den unten angehängten Dateien heruntergeladen werden, um sie weiter zu verfeinern.
Als Nächstes werden wir die übrigen Indikatoren aus der Standardterminallieferung auf die gleiche Weise betrachten.
Übersetzt aus dem Russischen von MetaQuotes Ltd.
Originalartikel: https://www.mql5.com/ru/articles/13244
Warnung: Alle Rechte sind von MetaQuotes Ltd. vorbehalten. Kopieren oder Vervielfältigen untersagt.
Dieser Artikel wurde von einem Nutzer der Website verfasst und gibt dessen persönliche Meinung wieder. MetaQuotes Ltd übernimmt keine Verantwortung für die Richtigkeit der dargestellten Informationen oder für Folgen, die sich aus der Anwendung der beschriebenen Lösungen, Strategien oder Empfehlungen ergeben.

- Freie Handelsapplikationen
- Über 8.000 Signale zum Kopieren
- Wirtschaftsnachrichten für die Lage an den Finanzmärkte
Sie stimmen der Website-Richtlinie und den Nutzungsbedingungen zu.
Ich habe herumgespielt und etwas gefunden
Aber es gab auch eine Aufgabe, um den Namen der Zelle zu erhalten, wenn man auf sie klickt.
Alles was ich bekomme ist dies.
--
Gibt es eine Lösung?
Ich habe ein wenig herumgespielt und etwas gefunden
Aber es gab auch eine Aufgabe, um den Namen der Zelle zu erhalten, wenn man sie anklickt.
Alles was ich bekomme ist dies
--
Gibt es eine Lösung?
Ich fürchte, es gibt keine einfache Lösung - es handelt sich um gezeichnete Daten. Wenn Sie also auf die Tabelle klicken, müssen Sie die Koordinaten des Cursors verfolgen und feststellen, auf welcher gezeichneten Zelle er sich befindet.
Ich fürchte, es gibt keine einfache Lösung - es handelt sich um gezeichnete Daten. Wenn Sie also auf die Tabelle klicken, müssen Sie die Koordinaten des Cursors verfolgen und feststellen, auf welcher gezeichneten Zelle er sich befindet.
Im Allgemeinen wird es möglich sein, das Problem zu umgehen.
Ich habe ein paralleles grafisches Objekt OBJ_RECTANGLE_LABEL mit ZORDER = 1 und Farbe = clrNONE gezeichnet.
Funktioniert gut, erhält den Zellnamen. Klappt auch zusammen und dehnt sich aus.
Vielen Dank!
Im Allgemeinen wird es möglich sein, sie zu überwinden.