
Fertige Vorlagen für die Einbindung von Indikatoren in Expert Advisors (Teil 2): Volumen- und Bill-Williams-Indikatoren

Inhalt
- Einführung
- Volumen-Indikatoren
- Indikatoren von Bill Williams
- Accelerator Oszillator
- Alligator
- Awesome Oszillator
- Fraktale
- Gator Oszillator
- Market Facilitation Index
- Verfeinerung der Dashboard-Klassen. Übersicht
- Schlussfolgerung
Einführung
Der Artikel setzt das Thema der vorgefertigten Vorlagen für die Verwendung von Indikatoren in EAs fort. Hier werden wir uns die Verbindung zu EAs und die Verwendung von Volumen- und Bill Williams-Indikatoren ansehen. Wir werden die von den Indikatoren erhaltenen Daten auf dem im ersten Artikel dieser Serie erstellten Dashboard anzeigen. Auch das Dashboard wurde verbessert. Am Ende des Artikels werden wir kurz auf die Änderungen und Verbesserungen eingehen.
Für jeden der betrachteten Indikatoren werden in diesem Artikel fertige Vorlagen zur Verwendung in nutzerdefinierten Programmen vorgestellt:
- Eingabe und globale Variablen,
- Initialisierung von Variablen und Erstellung eines Indikator-Handles,
- Deinitialisierung,
- Empfang von Daten im EA aus dem Indikator,
- Ein Beispiel für die Anzeige der erhaltenen Daten auf dem Dashboard.
Volumen-Indikatoren
Volumen-Indikatoren zeigen das Volumen oder Volumenveränderungen. Für den Forex Markt bedeutet „Volumen“ die Anzahl an Ticks (Preisveränderungen) im Zeitintervall. Für Börsen-Instrumente bedeutet Volumen die Menge an ausgeführten Handelsgeschäfte (in Kontrakten oder Geldsumme).
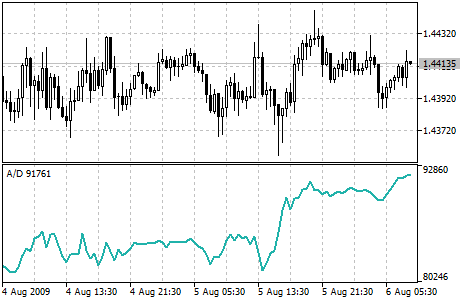
Accumulation/Distribution
Accumulation Distribution (A/D) wird durch die Veränderungen des Preises und des Volumens bestimmt. Das Volumen wirkt als Gewichtungskoeffizient bei der Preisänderung — je höher der Koeffizient (das Volumen) ist, desto größer wird der Beitrag der Preisänderung (für diesen Zeitraum) im Wert des Indikators sein.
Bei diesem Indikator handelt es sich um eine Version des häufiger verwendeten Indikators (On Balance Volume). Beide Indikatoren werden genutzt um die Veränderungen des Preises zu bestätigen durch die Veränderung des Volumens.
Wenn der Accumulation/Distribution Indikator steigt, bedeutet dies eine Accumulation (Häufung, Anstieg der Käufe), was zu einem steigenden Preis des Instruments führt. Wenn der Accumulation/Distribution Indikator sinkt, bedeutet dies eine Distribution (Auslieferung, Anstieg der Verkäufe), was zu einem sinkenden Preis des Instruments führt.
Divergenzen zwischen dem Accumulation/Distribution Indikator und dem Preis zeigen eine mögliche Veränderung des Preises. Als Regel, im Falle solcher Divergenzen, tendiert der Preis zu einer Bewegung, die der des Indikators entspricht. Wenn der Indikator also wächst, der Preis jedoch fällt ist ein Umschwung nach oben möglich.
Parameter
Die Funktion iAD() wird verwendet, um den Indikator-Handle zu erstellen:
Rückgabe des Handles des Indikators Akkumulation/Ausschüttung. Es gibt nur einen Puffer.
int  iAD(
   string               symbol,             // symbol name
   ENUM_TIMEFRAMES      period,             // period
   ENUM_APPLIED_VOLUME  applied_volume      // type of volume used for calculations
   );
symbol
[in] Der Symbolname des Finanzinstruments, dessen Daten zur Berechnung des Indikators verwendet werden sollen. NULL bedeutet das aktuelle Symbol.
period
[in] Der Zeitrahmen, es ist ein Wert aus der Enumeration ENUM_TIMEFRAMES, 0 bedeutet den aktuellen Zeitrahmen.
applied_volume
[in] Verwendetes Volumen. Eines aus ENUM_APPLIED_VOLUME.
Gibt das Handle des angegebenen technischen Indikators zurück. Falls fehlgeschlagen, wird INVALID_HANDLE zurückgegeben. Um den Computerspeicher eines nicht mehr verwendeten Indikators freizugeben, verwenden Sie IndicatorRelease(), dem das Indikator-Handle übergeben wird.
Deklarieren der Eingabe- und der globalen Variablen im EA, um den Indikator zu erstellen:
//+------------------------------------------------------------------+
//|                                                 TestVolumeAD.mq5 |
//|                                  Copyright 2023, MetaQuotes Ltd. |
//|                                             https://www.mql5.com |
//+------------------------------------------------------------------+
#property copyright "Copyright 2023, MetaQuotes Ltd."
#property link      "https://www.mql5.com"
#property version   "1.00"
//--- enums
enum ENUM_LINE_STATE
  {
   LINE_STATE_NONE,        // Undefined state
   LINE_STATE_UP,          // Upward
   LINE_STATE_DOWN,        // Downward
   LINE_STATE_TURN_UP,     // Upward reversal
   LINE_STATE_TURN_DOWN,   // Downward reversal
   LINE_STATE_STOP_UP,     // Upward stop
   LINE_STATE_STOP_DOWN,   // Downward stop
   LINE_STATE_ABOVE,       // Above value
   LINE_STATE_UNDER,       // Below value
   LINE_STATE_CROSS_UP,    // Crossing value upwards
   LINE_STATE_CROSS_DOWN,  // Crossing value downwards
   LINE_STATE_TOUCH_BELOW, // Touching value from below
   LINE_STATE_TOUCH_ABOVE, // Touch value from above
   LINE_STATE_EQUALS,      // Equal to value
  };
//--- input parameters
input ENUM_APPLIED_VOLUME  InpVolume   =  VOLUME_TICK;   /* Applied Volume */
//--- global variables
int      handle=INVALID_HANDLE;  // Indicator handle
int      ind_digits=0;           // Number of decimal places in the indicator values
string   ind_title;              // Indicator description
Die Enumeration ENUM_LINE_STATE wurde geschaffen, um die Ermittlung des Zustands einer Indikatorlinie zu vereinfachen - ihre Form und Lage im Verhältnis zur Linie eines anderen Indikators oder einer beliebigen Ebene.
Weitere Informationen zu der Enumeration finden Sie im Abschnitt ATR-Parameter des vorherigen Artikels.
Wenn Sie das Dashboard im EA verwenden, deklarieren Sie die globalen Variablen und binden Sie die Klassendatei des Panels ein:
//+------------------------------------------------------------------+
//|                                                 TestVolumeAD.mq5 |
//|                                  Copyright 2023, MetaQuotes Ltd. |
//|                                             https://www.mql5.com |
//+------------------------------------------------------------------+
#property copyright "Copyright 2023, MetaQuotes Ltd."
#property link      "https://www.mql5.com"
#property version   "1.00"
//--- includes
#include <Dashboard\Dashboard.mqh>
//--- enums
enum ENUM_LINE_STATE
  {
   LINE_STATE_NONE,        // Undefined state
   LINE_STATE_UP,          // Upward
   LINE_STATE_DOWN,        // Downward
   LINE_STATE_TURN_UP,     // Upward reversal
   LINE_STATE_TURN_DOWN,   // Downward reversal
   LINE_STATE_STOP_UP,     // Upward stop
   LINE_STATE_STOP_DOWN,   // Downward stop
   LINE_STATE_ABOVE,       // Above value
   LINE_STATE_UNDER,       // Below value
   LINE_STATE_CROSS_UP,    // Crossing value upwards
   LINE_STATE_CROSS_DOWN,  // Crossing value downwards
   LINE_STATE_TOUCH_BELOW, // Touching value from below
   LINE_STATE_TOUCH_ABOVE, // Touch value from above
   LINE_STATE_EQUALS,      // Equal to value
  };
//--- input parameters
input ENUM_APPLIED_VOLUME  InpVolume   =  VOLUME_TICK;   /* Applied Volume */
//--- global variables
int      handle=INVALID_HANDLE;  // Indicator handle
int      ind_digits=0;           // Number of decimal places in the indicator values
string   ind_title;              // Indicator description
//--- variables for the panel
int      mouse_bar_index;        // Index of the bar the data is taken from
CDashboard *panel=NULL;          // Pointer to the panel object
Initialisierung
Einstellung der Werte der globalen Variablen für den Indikator und die Erstellung seines Handles:
//+------------------------------------------------------------------+
//| Expert initialization function                                   |
//+------------------------------------------------------------------+
int OnInit()
  {
//--- create timer
   EventSetTimer(60);

//--- Indicator
//--- Set the indicator name and the number of decimal places
   ind_title="A/D";
   ind_digits=0;
//--- Create indicator handle
   ResetLastError();
   handle=iAD(Symbol(),PERIOD_CURRENT,InpVolume);
   if(handle==INVALID_HANDLE)
     {
      PrintFormat("%s: Failed to create indicator handle %s. Error %ld",__FUNCTION__,ind_title,GetLastError());
      return INIT_FAILED;
     }

//--- Successful initialization
   return(INIT_SUCCEEDED);
  }
Wenn der EA die Verwendung des Dashboards vorsieht, erstellen wir es hier:
//+------------------------------------------------------------------+
//| Expert initialization function                                   |
//+------------------------------------------------------------------+
int OnInit()
  {
//--- create timer
   EventSetTimer(60);

//--- Indicator
//--- Set the indicator name and the number of decimal places
   ind_title="A/D";
   ind_digits=0;
//--- Create indicator handle
   ResetLastError();
   handle=iAD(Symbol(),PERIOD_CURRENT,InpVolume);
   if(handle==INVALID_HANDLE)
     {
      PrintFormat("%s: Failed to create indicator handle %s. Error %ld",__FUNCTION__,ind_title,GetLastError());
      return INIT_FAILED;
     }

//--- Dashboard
//--- Create the panel
   panel=new CDashboard(1,20,20,199,225);
   if(panel==NULL)
     {
      Print("Error. Failed to create panel object");
      return INIT_FAILED;
     }
//--- Set font parameters
   panel.SetFontParams("Calibri",9);
//--- Display the panel with the "Symbol, Timeframe description" header text
   panel.View(Symbol()+", "+StringSubstr(EnumToString(Period()),7));
//--- Create a table with ID 0 to display bar data in it
   panel.CreateNewTable(0);
//--- Draw a table with ID 0 on the panel background
   panel.DrawGrid(0,2,20,6,2,18,97);

//--- Create a table with ID 1 to display indicator data in it
   panel.CreateNewTable(1);
//--- Get the Y2 table coordinate with ID 0 and
//--- set the Y1 coordinate for the table with ID 1
   int y1=panel.TableY2(0)+22;
//--- Draw a table with ID 1 on the panel background
   panel.DrawGrid(1,2,y1,3,2,18,97);

//--- Display tabular data in the journal
   panel.GridPrint(0,2);
   panel.GridPrint(1,2);
//--- Initialize the variable with the index of the mouse cursor bar
   mouse_bar_index=0;
//--- Display the data of the current bar on the panel
   DrawData(mouse_bar_index,TimeCurrent());

//--- Successful initialization
   return(INIT_SUCCEEDED);
  }
//+------------------------------------------------------------------+
Deinitialisierung
Freigabe des Indikator-Handles in OnDeinit() des EAs:
//+------------------------------------------------------------------+
//| Expert deinitialization function                                 |
//+------------------------------------------------------------------+
void OnDeinit(const int reason)
  {
//--- destroy timer
   EventKillTimer();

//--- Release handle of the indicator
   ResetLastError();
   if(!IndicatorRelease(handle))
      PrintFormat("%s: IndicatorRelease failed. Error %ld",__FUNCTION__,GetLastError());
//--- Clear all comments on the chart
   Comment("");
  }
Das erstellte Dashboard-Objekt wird bei der Verwendung des Dashboards entfernt:
//+------------------------------------------------------------------+
//| Expert deinitialization function                                 |
//+------------------------------------------------------------------+
void OnDeinit(const int reason)
  {
//--- destroy timer
   EventKillTimer();

//--- Release handle of the indicator
   ResetLastError();
   if(!IndicatorRelease(handle))
      PrintFormat("%s: IndicatorRelease failed. Error %ld",__FUNCTION__,GetLastError());
//--- Clear all comments on the chart
   Comment("");

//--- If the panel object exists, delete it
   if(panel!=NULL)
      delete panel;
  }
Abrufen von Daten
Im Folgenden werden die allgemeinen Funktionen zum Abrufen von Daten über das Indikator-Handle beschrieben. Die Funktionen wurden in dem Artikel über die Verbindung von Oszillatoren mit EAs beschrieben. Die vorgestellten Funktionen können in nutzerdefinierten Programmen im Prinzip unverändert verwendet werden:
//+------------------------------------------------------------------+
//| Return the indicator data on the specified bar                   |
//+------------------------------------------------------------------+
double IndicatorValue(const int ind_handle,const int index,const int buffer_num)
  {
   double array[1]={0};
   ResetLastError();
   if(CopyBuffer(ind_handle,buffer_num,index,1,array)!=1)
     {
      PrintFormat("%s: CopyBuffer failed. Error %ld",__FUNCTION__,GetLastError());
      return EMPTY_VALUE;
     }
   return array[0];
  }
//+------------------------------------------------------------------+
//| Return the state of the indicator line                           |
//+------------------------------------------------------------------+
ENUM_LINE_STATE LineState(const int ind_handle,const int index,const int buffer_num)
  {
//--- Get the values of the indicator line with the shift (0,1,2) relative to the passed index
   const double value0=IndicatorValue(ind_handle,index,  buffer_num);
   const double value1=IndicatorValue(ind_handle,index+1,buffer_num);
   const double value2=IndicatorValue(ind_handle,index+2,buffer_num);
//--- If at least one of the values could not be obtained, return an undefined value
   if(value0==EMPTY_VALUE || value1==EMPTY_VALUE || value2==EMPTY_VALUE)
      return LINE_STATE_NONE;
//--- Line upward reversal (value2>value1 && value0>value1)
   if(NormalizeDouble(value2-value1,ind_digits)>0 && NormalizeDouble(value0-value1,ind_digits)>0)
      return LINE_STATE_TURN_UP;
//--- Line upward direction (value2<=value1 && value0>value1)
   else if(NormalizeDouble(value2-value1,ind_digits)<=0 && NormalizeDouble(value0-value1,ind_digits)>0)
      return LINE_STATE_UP;
//--- Line upward stop (value2<=value1 && value0==value1)
   else if(NormalizeDouble(value2-value1,ind_digits)<=0 && NormalizeDouble(value0-value1,ind_digits)==0)
      return LINE_STATE_STOP_UP;
//--- Line downward reversal (value2<value1 && value0<value1)
   if(NormalizeDouble(value2-value1,ind_digits)<0 && NormalizeDouble(value0-value1,ind_digits)<0)
      return LINE_STATE_TURN_DOWN;
//--- Line downward direction (value2>=value1 && value0<value1)
   else if(NormalizeDouble(value2-value1,ind_digits)>=0 && NormalizeDouble(value0-value1,ind_digits)<0)
      return LINE_STATE_DOWN;
//--- Line downward stop (value2>=value1 && value0==value1)
   else if(NormalizeDouble(value2-value1,ind_digits)>=0 && NormalizeDouble(value0-value1,ind_digits)==0)
      return LINE_STATE_STOP_DOWN;
//--- Undefined state
   return LINE_STATE_NONE;
  }
//+------------------------------------------------------------------+
//| Return the state of the line relative to the specified level     |
//+------------------------------------------------------------------+
ENUM_LINE_STATE LineStateRelative(const int ind_handle,const int index,const int buffer_num,const double level0,const double level1=EMPTY_VALUE)
  {
//--- Get the values of the indicator line with the shift (0,1) relative to the passed index
   const double value0=IndicatorValue(ind_handle,index,  buffer_num);
   const double value1=IndicatorValue(ind_handle,index+1,buffer_num);
//--- If at least one of the values could not be obtained, return an undefined value
   if(value0==EMPTY_VALUE || value1==EMPTY_VALUE)
      return LINE_STATE_NONE;
//--- Define the second level to compare
   double level=(level1==EMPTY_VALUE ? level0 : level1);
//--- The line is below the level (value1<level && value0<level0)
   if(NormalizeDouble(value1-level,ind_digits)<0 && NormalizeDouble(value0-level0,ind_digits)<0)
      return LINE_STATE_UNDER;
//--- The line is above the level (value1>level && value0>level0)
   if(NormalizeDouble(value1-level,ind_digits)>0 && NormalizeDouble(value0-level0,ind_digits)>0)
      return LINE_STATE_ABOVE;
//--- The line crossed the level upwards (value1<=level && value0>level0)
   if(NormalizeDouble(value1-level,ind_digits)<=0 && NormalizeDouble(value0-level0,ind_digits)>0)
      return LINE_STATE_CROSS_UP;
//--- The line crossed the level downwards (value1>=level && value0<level0)
   if(NormalizeDouble(value1-level,ind_digits)>=0 && NormalizeDouble(value0-level0,ind_digits)<0)
      return LINE_STATE_CROSS_DOWN;
//--- The line touched the level from below (value1<level0 && value0==level0)
   if(NormalizeDouble(value1-level,ind_digits)<0 && NormalizeDouble(value0-level0,ind_digits)==0)
      return LINE_STATE_TOUCH_BELOW;
//--- The line touched the level from above (value1>level0 && value0==level0)
   if(NormalizeDouble(value1-level,ind_digits)>0 && NormalizeDouble(value0-level0,ind_digits)==0)
      return LINE_STATE_TOUCH_BELOW;
//--- Line is equal to the level value (value1==level0 && value0==level0)
   if(NormalizeDouble(value1-level,ind_digits)==0 && NormalizeDouble(value0-level0,ind_digits)==0)
      return LINE_STATE_EQUALS;
//--- Undefined state
   return LINE_STATE_NONE;
  }
//+------------------------------------------------------------------+
//| Return the indicator line state description                      |
//+------------------------------------------------------------------+
string LineStateDescription(const ENUM_LINE_STATE state)
  {
   switch(state)
     {
      case LINE_STATE_UP         :  return "Up";
      case LINE_STATE_STOP_UP    :  return "Stop Up";
      case LINE_STATE_TURN_UP    :  return "Turn Up";
      case LINE_STATE_DOWN       :  return "Down";
      case LINE_STATE_STOP_DOWN  :  return "Stop Down";
      case LINE_STATE_TURN_DOWN  :  return "Turn Down";
      case LINE_STATE_ABOVE      :  return "Above level";
      case LINE_STATE_UNDER      :  return "Under level";
      case LINE_STATE_CROSS_UP   :  return "Crossing Up";
      case LINE_STATE_CROSS_DOWN :  return "Crossing Down";
      case LINE_STATE_TOUCH_BELOW:  return "Touch from Below";
      case LINE_STATE_TOUCH_ABOVE:  return "Touch from Above";
      case LINE_STATE_EQUALS     :  return "Equals";
      default                    :  return "Unknown";
     }
  }
Wenn wir das Dashboard verwenden, werden die Daten mit Hilfe der Funktion auf dem Bedienfeld angezeigt:
//+------------------------------------------------------------------+
//| Display data from the specified timeseries index to the panel    |
//+------------------------------------------------------------------+
void DrawData(const int index,const datetime time)
  {
//--- Declare the variables to receive data in them
   MqlTick  tick={0};
   MqlRates rates[1];

//--- Exit if unable to get the current prices
   if(!SymbolInfoTick(Symbol(),tick))
      return;
//--- Exit if unable to get the bar data by the specified index
   if(CopyRates(Symbol(),PERIOD_CURRENT,index,1,rates)!=1)
      return;

//--- Set font parameters for bar and indicator data headers
   int  size=0;
   uint flags=0;
   uint angle=0;
   string name=panel.FontParams(size,flags,angle);
   panel.SetFontParams(name,9,FW_BOLD);
   panel.DrawText("Bar data ["+(string)index+"]",3,panel.TableY1(0)-16,clrMaroon,panel.Width()-6);
   panel.DrawText("Indicator data ["+(string)index+"]",3,panel.TableY1(1)-16,clrGreen,panel.Width()-6);
//--- Set font parameters for bar and indicator data
   panel.SetFontParams(name,9);

//--- Display the data of the specified bar in table 0 on the panel
   panel.DrawText("Date",  panel.CellX(0,0,0)+2, panel.CellY(0,0,0)+2); panel.DrawText(TimeToString(  rates[0].time,TIME_DATE),     panel.CellX(0,0,1)+2, panel.CellY(0,0,1)+2,clrNONE,90);
   panel.DrawText("Time",  panel.CellX(0,1,0)+2, panel.CellY(0,1,0)+2); panel.DrawText(TimeToString(  rates[0].time,TIME_MINUTES),  panel.CellX(0,1,1)+2, panel.CellY(0,1,1)+2,clrNONE,90);
   panel.DrawText("Open",  panel.CellX(0,2,0)+2, panel.CellY(0,2,0)+2); panel.DrawText(DoubleToString(rates[0].open,Digits()),      panel.CellX(0,2,1)+2, panel.CellY(0,2,1)+2,clrNONE,90);
   panel.DrawText("High",  panel.CellX(0,3,0)+2, panel.CellY(0,3,0)+2); panel.DrawText(DoubleToString(rates[0].high,Digits()),      panel.CellX(0,3,1)+2, panel.CellY(0,3,1)+2,clrNONE,90);
   panel.DrawText("Low",   panel.CellX(0,4,0)+2, panel.CellY(0,4,0)+2); panel.DrawText(DoubleToString(rates[0].low,Digits()),       panel.CellX(0,4,1)+2, panel.CellY(0,4,1)+2,clrNONE,90);
   panel.DrawText("Close", panel.CellX(0,5,0)+2, panel.CellY(0,5,0)+2); panel.DrawText(DoubleToString(rates[0].close,Digits()),     panel.CellX(0,5,1)+2, panel.CellY(0,5,1)+2,clrNONE,90);

//--- Display the indicator data from the specified bar on the panel in table 1
   panel.DrawText(ind_title, panel.CellX(1,0,0)+2, panel.CellY(1,0,0)+2);
   double value=IndicatorValue(handle,index,0);
   string value_str=(value!=EMPTY_VALUE ? DoubleToString(value,ind_digits) : "");
   panel.DrawText(value_str,panel.CellX(1,0,1)+2,panel.CellY(1,0,1)+2,clrNONE,90);

//--- Display a description of the indicator line state
   panel.DrawText("Line state", panel.CellX(1,1,0)+2, panel.CellY(1,1,0)+2);
   ENUM_LINE_STATE state=LineState(handle,index,0);
   panel.DrawText(LineStateDescription(state),panel.CellX(1,1,1)+2,panel.CellY(1,1,1)+2,clrNONE,90);

//--- Redraw the chart to immediately display all changes on the panel
   ChartRedraw(ChartID());
  }
Außerdem wird bei der Verwendung des Dashboards das Handle für die Panel-Ereignisse in OnChartEvent() EA-Ereignishandler aufgerufen, und die Ereignisse für den Erhalt des Balkenindex unter dem Cursor werden behandelt:
//+------------------------------------------------------------------+
//| ChartEvent function                                              |
//+------------------------------------------------------------------+
void OnChartEvent(const int id,
                  const long &lparam,
                  const double &dparam,
                  const string &sparam)
  {
//--- Handling the panel
//--- Call the panel event handler
   panel.OnChartEvent(id,lparam,dparam,sparam);

//--- If the cursor moves or a click is made on the chart
   if(id==CHARTEVENT_MOUSE_MOVE || id==CHARTEVENT_CLICK)
     {
      //--- Declare the variables to record time and price coordinates in them
      datetime time=0;
      double price=0;
      int wnd=0;
      //--- If the cursor coordinates are converted to date and time
      if(ChartXYToTimePrice(ChartID(),(int)lparam,(int)dparam,wnd,time,price))
        {
         //--- write the bar index where the cursor is located to a global variable
         mouse_bar_index=iBarShift(Symbol(),PERIOD_CURRENT,time);
         //--- Display the bar data under the cursor on the panel
         DrawData(mouse_bar_index,time);
        }
     }

//--- If we received a custom event, display the appropriate message in the journal
   if(id>CHARTEVENT_CUSTOM)
     {
      //--- Here we can implement handling a click on the close button on the panel
      PrintFormat("%s: Event id=%ld, object id (lparam): %lu, event message (sparam): %s",__FUNCTION__,id,lparam,sparam);
     }
  }
Nachdem wir den EA kompiliert und auf dem Chart gestartet haben, können wir den Status des Indikatorwertes und der Linie auf dem Panel überwachen:
Sie können den Test EA TestVolumeAD.mq5 in den an den Artikel angehängten Dateien ansehen.
Money Flow Index
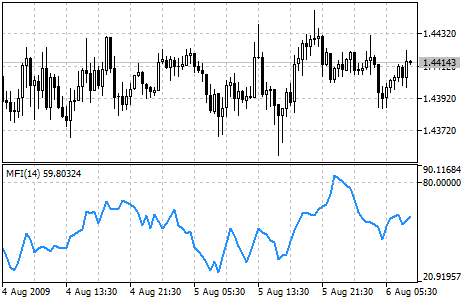
Der Money Flow Index (MFI) ist ein technischer Indikator, der die Rate angibt, mit der Geld in ein Wertpapier investiert und dann wieder abgezogen wird. Konstruktion und Interpretation des Indikators ähneln dem Relative Strength Index mit dem einzigen Unterschied, dass das Volumen für den MFI wichtig ist.
Bei der Analyse des Geldflussindexes sind die folgenden Punkte zu berücksichtigen:
- Divergenzen zwischen Indikator und Preisbewegung. Wenn die Preise steigen, während der MFI fällt (oder umgekehrt), besteht eine große Wahrscheinlichkeit für eine Preisumkehr;
- Wenn der Wert des Money Flow Index über 80 oder unter 20 liegt, signalisiert das entsprechend einen potenziellen Höchststand oder Tiefststand des Marktes.
Parameter
Die Funktion iMFI() wird zur Erstellung des Indikator-Handles verwendet:
int  iMFI(
   string               symbol,             // symbol name
   ENUM_TIMEFRAMES      period,             // period
   int                  ma_period,          // averaging period
   ENUM_APPLIED_VOLUME  applied_volume      // type of volume used for calculations
   );
symbol
[in] Der Symbolname des Finanzinstruments, dessen Daten zur Berechnung des Indikators verwendet werden sollen. NULL bedeutet das aktuelle Symbol.
period
[in] Der Zeitrahmen, es ist ein Wert aus der Enumeration ENUM_TIMEFRAMES, 0 bedeutet den aktuellen Zeitrahmen.
ma_period
[in] Periodenlänge (Anzahl der Balken) für die Berechnung des Indikators.
applied_volume
[in] Verwendetes Volumen. Eines aus ENUM_APPLIED_VOLUME.
Gibt das Handle des angegebenen technischen Indikators zurück. Falls fehlgeschlagen, wird INVALID_HANDLE zurückgegeben. Um den Computerspeicher eines nicht mehr verwendeten Indikators freizugeben, verwenden Sie IndicatorRelease(), dem das Indikator-Handle übergeben wird.
Deklaration der Eingabe- und der globalen Variablen im EA, um den Indikator zu erstellen:
//+------------------------------------------------------------------+
//|                                                TestVolumeMFI.mq5 |
//|                                  Copyright 2023, MetaQuotes Ltd. |
//|                                             https://www.mql5.com |
//+------------------------------------------------------------------+
#property copyright "Copyright 2023, MetaQuotes Ltd."
#property link      "https://www.mql5.com"
#property version   "1.00"
//--- enums
enum ENUM_LINE_STATE
  {
   LINE_STATE_NONE,        // Undefined state
   LINE_STATE_UP,          // Upward
   LINE_STATE_DOWN,        // Downward
   LINE_STATE_TURN_UP,     // Upward reversal
   LINE_STATE_TURN_DOWN,   // Downward reversal
   LINE_STATE_STOP_UP,     // Upward stop
   LINE_STATE_STOP_DOWN,   // Downward stop
   LINE_STATE_ABOVE,       // Above value
   LINE_STATE_UNDER,       // Below value
   LINE_STATE_CROSS_UP,    // Crossing value upwards
   LINE_STATE_CROSS_DOWN,  // Crossing value downwards
   LINE_STATE_TOUCH_BELOW, // Touching value from below
   LINE_STATE_TOUCH_ABOVE, // Touch value from above
   LINE_STATE_EQUALS,      // Equal to value
  };
//--- input parameters
input uint                 InpPeriod   =  14;            /* Period         */
input ENUM_APPLIED_VOLUME  InpVolume   =  VOLUME_TICK;   /* Applied Volume */
input double               InpOverbough=  80;            /* Overbough level*/
input double               InpOversold =  20;            /* Oversold level */
//--- global variables
int      handle=INVALID_HANDLE;  // Indicator handle
int      period=0;               // RSI calculation period
int      ind_digits=0;           // Number of decimal places in the indicator values
double   overbough=0;            // Overbought level
double   oversold=0;             // Oversold level
string   ind_title;              // Indicator description
Wenn Sie das Dashboard im EA verwenden, deklarieren Sie die globalen Variablen und binden Sie die Datei mit der Klasse des Panels ein:
//+------------------------------------------------------------------+
//|                                                TestVolumeMFI.mq5 |
//|                                  Copyright 2023, MetaQuotes Ltd. |
//|                                             https://www.mql5.com |
//+------------------------------------------------------------------+
#property copyright "Copyright 2023, MetaQuotes Ltd."
#property link      "https://www.mql5.com"
#property version   "1.00"
//--- includes
#include <Dashboard\Dashboard.mqh>
//--- enums
enum ENUM_LINE_STATE
  {
   LINE_STATE_NONE,        // Undefined state
   LINE_STATE_UP,          // Upward
   LINE_STATE_DOWN,        // Downward
   LINE_STATE_TURN_UP,     // Upward reversal
   LINE_STATE_TURN_DOWN,   // Downward reversal
   LINE_STATE_STOP_UP,     // Upward stop
   LINE_STATE_STOP_DOWN,   // Downward stop
   LINE_STATE_ABOVE,       // Above value
   LINE_STATE_UNDER,       // Below value
   LINE_STATE_CROSS_UP,    // Crossing value upwards
   LINE_STATE_CROSS_DOWN,  // Crossing value downwards
   LINE_STATE_TOUCH_BELOW, // Touching value from below
   LINE_STATE_TOUCH_ABOVE, // Touch value from above
   LINE_STATE_EQUALS,      // Equal to value
  };
//--- input parameters
input uint                 InpPeriod   =  14;            /* Period         */
input ENUM_APPLIED_VOLUME  InpVolume   =  VOLUME_TICK;   /* Applied Volume */
input double               InpOverbough=  80;            /* Overbough level*/
input double               InpOversold =  20;            /* Oversold level */
//--- global variables
int      handle=INVALID_HANDLE;  // Indicator handle
int      period=0;               // RSI calculation period
int      ind_digits=0;           // Number of decimal places in the indicator values
double   overbough=0;            // Overbought level
double   oversold=0;             // Oversold level
string   ind_title;              // Indicator description
//--- variables for the panel
int      mouse_bar_index;        // Index of the bar the data is taken from
CDashboard *panel=NULL;          // Pointer to the panel object
Initialisierung
Einstellung der Werte der globalen Variablen für den Indikator und die Erstellung seines Handles:
//+------------------------------------------------------------------+
//| Expert initialization function                                   |
//+------------------------------------------------------------------+
int OnInit()
  {
//--- create timer
   EventSetTimer(60);

//--- Indicator
//--- Set and adjust the calculation period and levels if necessary
   period=int(InpPeriod<1 ? 14 : InpPeriod);
   overbough=InpOverbough;
   oversold=(InpOversold>=overbough ? overbough-0.01 : InpOversold);
//--- Set the indicator name and the number of decimal places
   ind_title=StringFormat("MFI(%lu)",period);
   ind_digits=Digits();
//--- Create indicator handle
   ResetLastError();
   handle=iMFI(Symbol(),PERIOD_CURRENT,period,InpVolume);
   if(handle==INVALID_HANDLE)
     {
      PrintFormat("%s: Failed to create indicator handle %s. Error %ld",__FUNCTION__,ind_title,GetLastError());
      return INIT_FAILED;
     }

//--- Successful initialization
   return(INIT_SUCCEEDED);
  }
Wenn der EA die Verwendung des Dashboards vorsieht, erstellen wir es hier:
//+------------------------------------------------------------------+
//| Expert initialization function                                   |
//+------------------------------------------------------------------+
int OnInit()
  {
//--- create timer
   EventSetTimer(60);

//--- Indicator
//--- Set and adjust the calculation period and levels if necessary
   period=int(InpPeriod<1 ? 14 : InpPeriod);
   overbough=InpOverbough;
   oversold=(InpOversold>=overbough ? overbough-0.01 : InpOversold);
//--- Set the indicator name and the number of decimal places
   ind_title=StringFormat("MFI(%lu)",period);
   ind_digits=Digits();
//--- Create indicator handle
   ResetLastError();
   handle=iMFI(Symbol(),PERIOD_CURRENT,period,InpVolume);
   if(handle==INVALID_HANDLE)
     {
      PrintFormat("%s: Failed to create indicator handle %s. Error %ld",__FUNCTION__,ind_title,GetLastError());
      return INIT_FAILED;
     }

//--- Dashboard
//--- Create the panel
   panel=new CDashboard(1,20,20,229,243);
   if(panel==NULL)
     {
      Print("Error. Failed to create panel object");
      return INIT_FAILED;
     }
//--- Set font parameters
   panel.SetFontParams("Calibri",9);
//--- Display the panel with the "Symbol, Timeframe description" header text
   panel.View(Symbol()+", "+StringSubstr(EnumToString(Period()),7));
//--- Create a table with ID 0 to display bar data in it
   panel.CreateNewTable(0);
//--- Draw a table with ID 0 on the panel background
   panel.DrawGrid(0,2,20,6,2,18,112);

//--- Create a table with ID 1 to display indicator data in it
   panel.CreateNewTable(1);
//--- Get the Y2 table coordinate with ID 0 and
//--- set the Y1 coordinate for the table with ID 1
   int y1=panel.TableY2(0)+22;
//--- Draw a table with ID 1 on the panel background
   panel.DrawGrid(1,2,y1,4,2,18,112);

//--- Display tabular data in the journal
   panel.GridPrint(0,2);
   panel.GridPrint(1,2);
//--- Initialize the variable with the index of the mouse cursor bar
   mouse_bar_index=0;
//--- Display the data of the current bar on the panel
   DrawData(mouse_bar_index,TimeCurrent());

//--- Successful initialization
   return(INIT_SUCCEEDED);
  }
Deinitialisierung
Freigabe des Indikator-Handles in OnDeinit() des EAs:
//+------------------------------------------------------------------+
//| Expert deinitialization function                                 |
//+------------------------------------------------------------------+
void OnDeinit(const int reason)
  {
//--- destroy timer
   EventKillTimer();

//--- Release handle of the indicator
   ResetLastError();
   if(!IndicatorRelease(handle))
      PrintFormat("%s: IndicatorRelease failed. Error %ld",__FUNCTION__,GetLastError());
//--- Clear all comments on the chart
   Comment("");
  }
Das erstellte Dashboard-Objekt wird bei der Verwendung des Dashboards entfernt:
//+------------------------------------------------------------------+
//| Expert deinitialization function                                 |
//+------------------------------------------------------------------+
void OnDeinit(const int reason)
  {
//--- destroy timer
   EventKillTimer();

//--- Release handle of the indicator
   ResetLastError();
   if(!IndicatorRelease(handle))
      PrintFormat("%s: IndicatorRelease failed. Error %ld",__FUNCTION__,GetLastError());
//--- Clear all comments on the chart
   Comment("");

//--- If the panel object exists, delete it
   if(panel!=NULL)
      delete panel;
  }
Abrufen von Daten
Im Folgenden werden die allgemeinen Funktionen zum Abrufen von Daten über das Indikator-Handle beschrieben. Die Funktionen wurden in dem Artikel über die Verbindung von Oszillatoren mit EAs beschrieben. Die vorgestellten Funktionen können in nutzerdefinierten Programmen im Prinzip unverändert verwendet werden:
//+------------------------------------------------------------------+
//| Return the indicator data on the specified bar                   |
//+------------------------------------------------------------------+
double IndicatorValue(const int ind_handle,const int index,const int buffer_num)
  {
   double array[1]={0};
   ResetLastError();
   if(CopyBuffer(ind_handle,buffer_num,index,1,array)!=1)
     {
      PrintFormat("%s: CopyBuffer failed. Error %ld",__FUNCTION__,GetLastError());
      return EMPTY_VALUE;
     }
   return array[0];
  }
//+------------------------------------------------------------------+
//| Return the state of the indicator line                           |
//+------------------------------------------------------------------+
ENUM_LINE_STATE LineState(const int ind_handle,const int index,const int buffer_num)
  {
//--- Get the values of the indicator line with the shift (0,1,2) relative to the passed index
   const double value0=IndicatorValue(ind_handle,index,  buffer_num);
   const double value1=IndicatorValue(ind_handle,index+1,buffer_num);
   const double value2=IndicatorValue(ind_handle,index+2,buffer_num);
//--- If at least one of the values could not be obtained, return an undefined value
   if(value0==EMPTY_VALUE || value1==EMPTY_VALUE || value2==EMPTY_VALUE)
      return LINE_STATE_NONE;
//--- Line upward reversal (value2>value1 && value0>value1)
   if(NormalizeDouble(value2-value1,ind_digits)>0 && NormalizeDouble(value0-value1,ind_digits)>0)
      return LINE_STATE_TURN_UP;
//--- Line upward direction (value2<=value1 && value0>value1)
   else if(NormalizeDouble(value2-value1,ind_digits)<=0 && NormalizeDouble(value0-value1,ind_digits)>0)
      return LINE_STATE_UP;
//--- Line upward stop (value2<=value1 && value0==value1)
   else if(NormalizeDouble(value2-value1,ind_digits)<=0 && NormalizeDouble(value0-value1,ind_digits)==0)
      return LINE_STATE_STOP_UP;
//--- Line downward reversal (value2<value1 && value0<value1)
   if(NormalizeDouble(value2-value1,ind_digits)<0 && NormalizeDouble(value0-value1,ind_digits)<0)
      return LINE_STATE_TURN_DOWN;
//--- Line downward direction (value2>=value1 && value0<value1)
   else if(NormalizeDouble(value2-value1,ind_digits)>=0 && NormalizeDouble(value0-value1,ind_digits)<0)
      return LINE_STATE_DOWN;
//--- Line downward stop (value2>=value1 && value0==value1)
   else if(NormalizeDouble(value2-value1,ind_digits)>=0 && NormalizeDouble(value0-value1,ind_digits)==0)
      return LINE_STATE_STOP_DOWN;
//--- Undefined state
   return LINE_STATE_NONE;
  }
//+------------------------------------------------------------------+
//| Return the state of the line relative to the specified level     |
//+------------------------------------------------------------------+
ENUM_LINE_STATE LineStateRelative(const int ind_handle,const int index,const int buffer_num,const double level0,const double level1=EMPTY_VALUE)
  {
//--- Get the values of the indicator line with the shift (0,1) relative to the passed index
   const double value0=IndicatorValue(ind_handle,index,  buffer_num);
   const double value1=IndicatorValue(ind_handle,index+1,buffer_num);
//--- If at least one of the values could not be obtained, return an undefined value
   if(value0==EMPTY_VALUE || value1==EMPTY_VALUE)
      return LINE_STATE_NONE;
//--- Define the second level to compare
   double level=(level1==EMPTY_VALUE ? level0 : level1);
//--- The line is below the level (value1<level && value0<level0)
   if(NormalizeDouble(value1-level,ind_digits)<0 && NormalizeDouble(value0-level0,ind_digits)<0)
      return LINE_STATE_UNDER;
//--- The line is above the level (value1>level && value0>level0)
   if(NormalizeDouble(value1-level,ind_digits)>0 && NormalizeDouble(value0-level0,ind_digits)>0)
      return LINE_STATE_ABOVE;
//--- The line crossed the level upwards (value1<=level && value0>level0)
   if(NormalizeDouble(value1-level,ind_digits)<=0 && NormalizeDouble(value0-level0,ind_digits)>0)
      return LINE_STATE_CROSS_UP;
//--- The line crossed the level downwards (value1>=level && value0<level0)
   if(NormalizeDouble(value1-level,ind_digits)>=0 && NormalizeDouble(value0-level0,ind_digits)<0)
      return LINE_STATE_CROSS_DOWN;
//--- The line touched the level from below (value1<level0 && value0==level0)
   if(NormalizeDouble(value1-level,ind_digits)<0 && NormalizeDouble(value0-level0,ind_digits)==0)
      return LINE_STATE_TOUCH_BELOW;
//--- The line touched the level from above (value1>level0 && value0==level0)
   if(NormalizeDouble(value1-level,ind_digits)>0 && NormalizeDouble(value0-level0,ind_digits)==0)
      return LINE_STATE_TOUCH_BELOW;
//--- Line is equal to the level value (value1==level0 && value0==level0)
   if(NormalizeDouble(value1-level,ind_digits)==0 && NormalizeDouble(value0-level0,ind_digits)==0)
      return LINE_STATE_EQUALS;
//--- Undefined state
   return LINE_STATE_NONE;
  }
//+------------------------------------------------------------------+
//| Return the indicator line state description                      |
//+------------------------------------------------------------------+
string LineStateDescription(const ENUM_LINE_STATE state)
  {
   switch(state)
     {
      case LINE_STATE_UP         :  return "Up";
      case LINE_STATE_STOP_UP    :  return "Stop Up";
      case LINE_STATE_TURN_UP    :  return "Turn Up";
      case LINE_STATE_DOWN       :  return "Down";
      case LINE_STATE_STOP_DOWN  :  return "Stop Down";
      case LINE_STATE_TURN_DOWN  :  return "Turn Down";
      case LINE_STATE_ABOVE      :  return "Above level";
      case LINE_STATE_UNDER      :  return "Under level";
      case LINE_STATE_CROSS_UP   :  return "Crossing Up";
      case LINE_STATE_CROSS_DOWN :  return "Crossing Down";
      case LINE_STATE_TOUCH_BELOW:  return "Touch from Below";
      case LINE_STATE_TOUCH_ABOVE:  return "Touch from Above";
      case LINE_STATE_EQUALS     :  return "Equals";
      default                    :  return "Unknown";
     }
  }
Wenn wir das Dashboard verwenden, werden die Daten mit Hilfe der Funktion auf dem Bedienfeld angezeigt:
//+------------------------------------------------------------------+
//| Display data from the specified timeseries index to the panel    |
//+------------------------------------------------------------------+
void DrawData(const int index,const datetime time)
  {
//--- Declare the variables to receive data in them
   MqlTick  tick={0};
   MqlRates rates[1];

//--- Exit if unable to get the current prices
   if(!SymbolInfoTick(Symbol(),tick))
      return;
//--- Exit if unable to get the bar data by the specified index
   if(CopyRates(Symbol(),PERIOD_CURRENT,index,1,rates)!=1)
      return;

//--- Set font parameters for bar and indicator data headers
   int  size=0;
   uint flags=0;
   uint angle=0;
   string name=panel.FontParams(size,flags,angle);
   panel.SetFontParams(name,9,FW_BOLD);
   panel.DrawText("Bar data ["+(string)index+"]",3,panel.TableY1(0)-16,clrMaroon,panel.Width()-6);
   panel.DrawText("Indicator data ["+(string)index+"]",3,panel.TableY1(1)-16,clrGreen,panel.Width()-6);
//--- Set font parameters for bar and indicator data
   panel.SetFontParams(name,9);

//--- Display the data of the specified bar in table 0 on the panel
   panel.DrawText("Date",  panel.CellX(0,0,0)+2, panel.CellY(0,0,0)+2); panel.DrawText(TimeToString(  rates[0].time,TIME_DATE),     panel.CellX(0,0,1)+2, panel.CellY(0,0,1)+2,clrNONE,90);
   panel.DrawText("Time",  panel.CellX(0,1,0)+2, panel.CellY(0,1,0)+2); panel.DrawText(TimeToString(  rates[0].time,TIME_MINUTES),  panel.CellX(0,1,1)+2, panel.CellY(0,1,1)+2,clrNONE,90);
   panel.DrawText("Open",  panel.CellX(0,2,0)+2, panel.CellY(0,2,0)+2); panel.DrawText(DoubleToString(rates[0].open,Digits()),      panel.CellX(0,2,1)+2, panel.CellY(0,2,1)+2,clrNONE,90);
   panel.DrawText("High",  panel.CellX(0,3,0)+2, panel.CellY(0,3,0)+2); panel.DrawText(DoubleToString(rates[0].high,Digits()),      panel.CellX(0,3,1)+2, panel.CellY(0,3,1)+2,clrNONE,90);
   panel.DrawText("Low",   panel.CellX(0,4,0)+2, panel.CellY(0,4,0)+2); panel.DrawText(DoubleToString(rates[0].low,Digits()),       panel.CellX(0,4,1)+2, panel.CellY(0,4,1)+2,clrNONE,90);
   panel.DrawText("Close", panel.CellX(0,5,0)+2, panel.CellY(0,5,0)+2); panel.DrawText(DoubleToString(rates[0].close,Digits()),     panel.CellX(0,5,1)+2, panel.CellY(0,5,1)+2,clrNONE,90);

//--- Display the indicator data from the specified bar on the panel in table 1
   panel.DrawText(ind_title, panel.CellX(1,0,0)+2, panel.CellY(1,0,0)+2);
   double value=IndicatorValue(handle,index,0);
   string value_str=(value!=EMPTY_VALUE ? DoubleToString(value,ind_digits) : "");
   panel.DrawText(value_str,panel.CellX(1,0,1)+2,panel.CellY(1,0,1)+2,clrNONE,100);

//--- Display a description of the indicator line state relative to the overbought level
   string ovb=StringFormat("%+.2f",overbough);
   panel.DrawText("Overbough", panel.CellX(1,2,0)+2, panel.CellY(1,2,0)+2);
   panel.DrawText(ovb, panel.CellX(1,2,0)+66, panel.CellY(1,2,0)+2);
   ENUM_LINE_STATE state_ovb=LineStateRelative(handle,index,0,overbough);
//--- The label color changes depending on the value of the line relative to the level
   color clr=(state_ovb==LINE_STATE_CROSS_DOWN ? clrRed : clrNONE);
   string ovb_str=(state_ovb==LINE_STATE_ABOVE ? "Inside the area" : LineStateDescription(state_ovb));
   panel.DrawText(ovb_str,panel.CellX(1,2,1)+2,panel.CellY(1,2,1)+2,clr,100);

//--- Display a description of the indicator line state relative to the oversold level
   panel.DrawText("Oversold", panel.CellX(1,3,0)+2, panel.CellY(1,3,0)+2);
   string ovs=StringFormat("%+.2f",oversold);
   panel.DrawText(ovs, panel.CellX(1,3,0)+68, panel.CellY(1,3,0)+2);
   ENUM_LINE_STATE state_ovs=LineStateRelative(handle,index,0,oversold);
//--- The label color changes depending on the value of the line relative to the level
   clr=(state_ovs==LINE_STATE_CROSS_UP ? clrBlue : clrNONE);
   string ovs_str=(state_ovs==LINE_STATE_UNDER ? "Inside the area" : LineStateDescription(state_ovs));
   panel.DrawText(ovs_str,panel.CellX(1,3,1)+2,panel.CellY(1,3,1)+2,clr,100);

//--- Display a description of the indicator line state
   panel.DrawText("Line state", panel.CellX(1,1,0)+2, panel.CellY(1,1,0)+2);
   ENUM_LINE_STATE state=LineState(handle,index,0);
//--- The label color changes depending on the location of the line in the overbought/oversold areas
   clr=(state_ovb==LINE_STATE_ABOVE || state_ovb==LINE_STATE_CROSS_DOWN ? clrRed : state_ovs==LINE_STATE_UNDER || state_ovs==LINE_STATE_CROSS_UP ? clrBlue : clrNONE);
   panel.DrawText(LineStateDescription(state),panel.CellX(1,1,1)+2,panel.CellY(1,1,1)+2,clr,100);

//--- Redraw the chart to immediately display all changes on the panel
   ChartRedraw(ChartID());
  }
Die Position der Indikatorlinie in überkauften/überverkauften Bereichen wird im Panel mit Textfarbe markiert.
Außerdem wird bei der Verwendung des Dashboards das Handle für die Panel-Ereignisse in OnChartEvent() EA-Ereignishandler aufgerufen, und die Ereignisse für den Erhalt des Balkenindex unter dem Cursor werden behandelt:
//+------------------------------------------------------------------+
//| ChartEvent function                                              |
//+------------------------------------------------------------------+
void OnChartEvent(const int id,
                  const long &lparam,
                  const double &dparam,
                  const string &sparam)
  {
//--- Handling the panel
//--- Call the panel event handler
   panel.OnChartEvent(id,lparam,dparam,sparam);

//--- If the cursor moves or a click is made on the chart
   if(id==CHARTEVENT_MOUSE_MOVE || id==CHARTEVENT_CLICK)
     {
      //--- Declare the variables to record time and price coordinates in them
      datetime time=0;
      double price=0;
      int wnd=0;
      //--- If the cursor coordinates are converted to date and time
      if(ChartXYToTimePrice(ChartID(),(int)lparam,(int)dparam,wnd,time,price))
        {
         //--- write the bar index where the cursor is located to a global variable
         mouse_bar_index=iBarShift(Symbol(),PERIOD_CURRENT,time);
         //--- Display the bar data under the cursor on the panel
         DrawData(mouse_bar_index,time);
        }
     }

//--- If we received a custom event, display the appropriate message in the journal
   if(id>CHARTEVENT_CUSTOM)
     {
      //--- Here we can implement handling a click on the close button on the panel
      PrintFormat("%s: Event id=%ld, object id (lparam): %lu, event message (sparam): %s",__FUNCTION__,id,lparam,sparam);
     }
  }
Nachdem wir den EA kompiliert und auf dem Chart gestartet haben, können wir den Status des Indikatorwertes und der Linie auf dem Panel überwachen:
Sie können den Test EA TestVolumeMFI.mq5 in den an den Artikel angehängten Dateien ansehen.
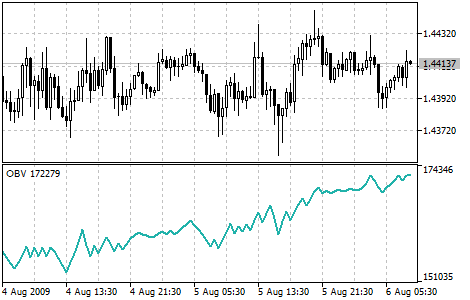
On Balance Volumen
On Balance Volume (OBV) ist ein technischer Momentum-Indikator, der das Volumen mit der Preisänderung in Beziehung setzt. Der Indikator, der von Joseph Granville erfunden wurde, ist vergleichsweise einfach. Wenn der Schlusspreis der aktuellen Kerze höher ist als der der vorherigen Kerze, wird das Volumen der aktuellen Kerze zum vorherigen OBV hinzugefügt. Wenn der Schlusskurs der aktuellen Kerze niedriger ist als der der vorherigen Kerze, wird das Volumen der aktuellen Kerze vom vorherigen OBV subtrahiert.
Die Grundannahme der OBV Analyse ist, dass Änderungen im OBV Preisänderungen vorausgehen. Die Theorie ist, dass das „Smart Money“, das in das Instrument fließt, durch ein steigendes OBV angezeigt wird. Wenn das öffentliche Interesse am Instrument dann steigt, steigen sowohl der Preis als auch das OBV.
Wenn sich der Preis des Instruments vor dem OBV bewegt, ist dies eine „Nicht-Bestätigung“. „Nicht-Bestätigungen“ können z.B. bei den Hochs von Aufwärtsmärkten (wenn der Preis steigt ohne oder bevor eine Steigerung des OBV geschieht) oder andersherum bei den Tiefs.
OBV steigt in einem steigenden Trend, wenn jedes neue Hoch höher ist als das vorherige und jedes neue Tief höher als die vorherigen. Umgekehrt gilt dies für die Gegenrichtung. Wenn das OBV in einer Seitwärtsbewegung ist, ist kein klarer Trend erkennbar.
Wenn ein Trend manifestiert ist, bleibt dieser solange in Kraft, bis er gebrochen wurde. Es gibt zwei Wege wie der Trend des On Balance Volume gebrochen werden kann. Der erste tritt auf, wenn die Richtung des Trends von einem steigenden in einen fallenden wechselt oder umgekehrt.
Die zweite Möglichkeit, wie der OBV-Trend gebrochen werden kann, besteht darin, dass der Trend in einen zweifelhaften Trend übergeht und länger als drei Tage zweifelhaft bleibt. Wenn also das Wertpapier von einem steigenden Trend für zwei Tage in eine Seitwärtsbewegung wechselt, bevor es wieder zu einem steigenden Trend zurückkehrt, wird davon ausgegangen, dass das On Balance Volume immer in einem steigenden Trend war.
Da diese OVB Ausbrüche einer Umkehr im Preis normalerweise vorausgehen, gelten diese als Kauf- bzw. Verkauf-Signale. Bei einem Abwärts-Ausbruch wird daher verkauft und andersherum. Positionen sollten gehalten werden, bis der Trend wechselt.
Parameter
Die Funktion iOBV() wird verwendet, um den Indikator-Handle zu erstellen:
Es wird das Handle des On Balance Volume Indikators zurückgegeben. Es gibt nur einen Puffer.
int  iOBV(
   string                symbol,             // symbol name
   ENUM_TIMEFRAMES       period,             // period
   ENUM_APPLIED_VOLUME   applied_volume      // type of volume used for calculations
   );
[in] Der Symbolname des Finanzinstruments, dessen Daten zur Berechnung des Indikators verwendet werden sollen. NULL bedeutet das aktuelle Symbol.
period
[in] Der Zeitrahmen, es ist ein Wert aus der Enumeration ENUM_TIMEFRAMES, 0 bedeutet den aktuellen Zeitrahmen.
applied_volume
[in] Verwendetes Volumen. Ein Wert aus der Enumeration ENUM_APPLIED_VOLUME.
Gibt das Handle des angegebenen technischen Indikators zurück. Falls fehlgeschlagen, wird INVALID_HANDLE zurückgegeben. Um den Computerspeicher eines nicht mehr verwendeten Indikators freizugeben, verwenden Sie IndicatorRelease(), dem das Indikator-Handle übergeben wird.
Deklarieren der Eingabe- und der globalen Variablen im EA, um den Indikator zu erstellen:
//+------------------------------------------------------------------+
//|                                                TestVolumeOBV.mq5 |
//|                                  Copyright 2023, MetaQuotes Ltd. |
//|                                             https://www.mql5.com |
//+------------------------------------------------------------------+
#property copyright "Copyright 2023, MetaQuotes Ltd."
#property link      "https://www.mql5.com"
#property version   "1.00"
//--- enums
enum ENUM_LINE_STATE
  {
   LINE_STATE_NONE,        // Undefined state
   LINE_STATE_UP,          // Upward
   LINE_STATE_DOWN,        // Downward
   LINE_STATE_TURN_UP,     // Upward reversal
   LINE_STATE_TURN_DOWN,   // Downward reversal
   LINE_STATE_STOP_UP,     // Upward stop
   LINE_STATE_STOP_DOWN,   // Downward stop
   LINE_STATE_ABOVE,       // Above value
   LINE_STATE_UNDER,       // Below value
   LINE_STATE_CROSS_UP,    // Crossing value upwards
   LINE_STATE_CROSS_DOWN,  // Crossing value downwards
   LINE_STATE_TOUCH_BELOW, // Touching value from below
   LINE_STATE_TOUCH_ABOVE, // Touch value from above
   LINE_STATE_EQUALS,      // Equal to value
  };
//--- input parameters
input ENUM_APPLIED_VOLUME  InpVolume   =  VOLUME_TICK;   /* Applied Volume */
//--- global variables
int      handle=INVALID_HANDLE;  // Indicator handle
int      ind_digits=0;           // Number of decimal places in the indicator values
string   ind_title;              // Indicator description
Wenn Sie das Dashboard im EA verwenden, deklarieren Sie die globalen Variablen und binden Sie die Datei mit der Klasse des Panels ein:
//+------------------------------------------------------------------+
//|                                                TestVolumeOBV.mq5 |
//|                                  Copyright 2023, MetaQuotes Ltd. |
//|                                             https://www.mql5.com |
//+------------------------------------------------------------------+
#property copyright "Copyright 2023, MetaQuotes Ltd."
#property link      "https://www.mql5.com"
#property version   "1.00"
//--- includes
#include <Dashboard\Dashboard.mqh>
//--- enums
enum ENUM_LINE_STATE
  {
   LINE_STATE_NONE,        // Undefined state
   LINE_STATE_UP,          // Upward
   LINE_STATE_DOWN,        // Downward
   LINE_STATE_TURN_UP,     // Upward reversal
   LINE_STATE_TURN_DOWN,   // Downward reversal
   LINE_STATE_STOP_UP,     // Upward stop
   LINE_STATE_STOP_DOWN,   // Downward stop
   LINE_STATE_ABOVE,       // Above value
   LINE_STATE_UNDER,       // Below value
   LINE_STATE_CROSS_UP,    // Crossing value upwards
   LINE_STATE_CROSS_DOWN,  // Crossing value downwards
   LINE_STATE_TOUCH_BELOW, // Touching value from below
   LINE_STATE_TOUCH_ABOVE, // Touch value from above
   LINE_STATE_EQUALS,      // Equal to value
  };
//--- input parameters
input ENUM_APPLIED_VOLUME  InpVolume   =  VOLUME_TICK;   /* Applied Volume */
//--- global variables
int      handle=INVALID_HANDLE;  // Indicator handle
int      ind_digits=0;           // Number of decimal places in the indicator values
string   ind_title;              // Indicator description
//--- variables for the panel
int      mouse_bar_index;        // Index of the bar the data is taken from
CDashboard *panel=NULL;          // Pointer to the panel object
Initialisierung
Einstellung der Werte der globalen Variablen für den Indikator und die Erstellung seines Handles:
//+------------------------------------------------------------------+
//| Expert initialization function                                   |
//+------------------------------------------------------------------+
int OnInit()
  {
//--- create timer
   EventSetTimer(60);

//--- Indicator
//--- Set the indicator name and the number of decimal places
   ind_title="OBV";
   ind_digits=0;
//--- Create indicator handle
   ResetLastError();
   handle=iOBV(Symbol(),PERIOD_CURRENT,InpVolume);
   if(handle==INVALID_HANDLE)
     {
      PrintFormat("%s: Failed to create indicator handle %s. Error %ld",__FUNCTION__,ind_title,GetLastError());
      return INIT_FAILED;
     }

//--- Successful initialization
   return(INIT_SUCCEEDED);
  }
Wenn der EA die Verwendung des Dashboards vorsieht, erstellen wir es hier:
//+------------------------------------------------------------------+
//| Expert initialization function                                   |
//+------------------------------------------------------------------+
int OnInit()
  {
//--- create timer
   EventSetTimer(60);

//--- Indicator
//--- Set the indicator name and the number of decimal places
   ind_title="OBV";
   ind_digits=0;
//--- Create indicator handle
   ResetLastError();
   handle=iOBV(Symbol(),PERIOD_CURRENT,InpVolume);
   if(handle==INVALID_HANDLE)
     {
      PrintFormat("%s: Failed to create indicator handle %s. Error %ld",__FUNCTION__,ind_title,GetLastError());
      return INIT_FAILED;
     }

//--- Dashboard
//--- Create the panel
   panel=new CDashboard(1,20,20,199,225);
   if(panel==NULL)
     {
      Print("Error. Failed to create panel object");
      return INIT_FAILED;
     }
//--- Set font parameters
   panel.SetFontParams("Calibri",9);
//--- Display the panel with the "Symbol, Timeframe description" header text
   panel.View(Symbol()+", "+StringSubstr(EnumToString(Period()),7));
//--- Create a table with ID 0 to display bar data in it
   panel.CreateNewTable(0);
//--- Draw a table with ID 0 on the panel background
   panel.DrawGrid(0,2,20,6,2,18,97);

//--- Create a table with ID 1 to display indicator data in it
   panel.CreateNewTable(1);
//--- Get the Y2 table coordinate with ID 0 and
//--- set the Y1 coordinate for the table with ID 1
   int y1=panel.TableY2(0)+22;
//--- Draw a table with ID 1 on the panel background
   panel.DrawGrid(1,2,y1,3,2,18,97);

//--- Display tabular data in the journal
   panel.GridPrint(0,2);
   panel.GridPrint(1,2);
//--- Initialize the variable with the index of the mouse cursor bar
   mouse_bar_index=0;
//--- Display the data of the current bar on the panel
   DrawData(mouse_bar_index,TimeCurrent());

//--- Successful initialization
   return(INIT_SUCCEEDED);
  }
Deinitialisierung
Freigabe des Indikator-Handles in OnDeinit() des EAs:
//+------------------------------------------------------------------+
//| Expert deinitialization function                                 |
//+------------------------------------------------------------------+
void OnDeinit(const int reason)
  {
//--- destroy timer
   EventKillTimer();

//--- Release handle of the indicator
   ResetLastError();
   if(!IndicatorRelease(handle))
      PrintFormat("%s: IndicatorRelease failed. Error %ld",__FUNCTION__,GetLastError());
//--- Clear all comments on the chart
   Comment("");
  }
Das erstellte Dashboard-Objekt wird bei der Verwendung des Dashboards entfernt:
//+------------------------------------------------------------------+
//| Expert deinitialization function                                 |
//+------------------------------------------------------------------+
void OnDeinit(const int reason)
  {
//--- destroy timer
   EventKillTimer();

//--- Release handle of the indicator
   ResetLastError();
   if(!IndicatorRelease(handle))
      PrintFormat("%s: IndicatorRelease failed. Error %ld",__FUNCTION__,GetLastError());
//--- Clear all comments on the chart
   Comment("");

//--- If the panel object exists, delete it
   if(panel!=NULL)
      delete panel;
  }
Abrufen von Daten
Im Folgenden werden die allgemeinen Funktionen zum Abrufen von Daten über das Indikator-Handle beschrieben. Die Funktionen wurden in dem Artikel über die Verbindung von Oszillatoren mit EAs beschrieben. Die vorgestellten Funktionen können in nutzerdefinierten Programmen im Prinzip unverändert verwendet werden:
//+------------------------------------------------------------------+
//| Return the indicator data on the specified bar                   |
//+------------------------------------------------------------------+
double IndicatorValue(const int ind_handle,const int index,const int buffer_num)
  {
   double array[1]={0};
   ResetLastError();
   if(CopyBuffer(ind_handle,buffer_num,index,1,array)!=1)
     {
      PrintFormat("%s: CopyBuffer failed. Error %ld",__FUNCTION__,GetLastError());
      return EMPTY_VALUE;
     }
   return array[0];
  }
//+------------------------------------------------------------------+
//| Return the state of the indicator line                           |
//+------------------------------------------------------------------+
ENUM_LINE_STATE LineState(const int ind_handle,const int index,const int buffer_num)
  {
//--- Get the values of the indicator line with the shift (0,1,2) relative to the passed index
   const double value0=IndicatorValue(ind_handle,index,  buffer_num);
   const double value1=IndicatorValue(ind_handle,index+1,buffer_num);
   const double value2=IndicatorValue(ind_handle,index+2,buffer_num);
//--- If at least one of the values could not be obtained, return an undefined value
   if(value0==EMPTY_VALUE || value1==EMPTY_VALUE || value2==EMPTY_VALUE)
      return LINE_STATE_NONE;
//--- Line upward reversal (value2>value1 && value0>value1)
   if(NormalizeDouble(value2-value1,ind_digits)>0 && NormalizeDouble(value0-value1,ind_digits)>0)
      return LINE_STATE_TURN_UP;
//--- Line upward direction (value2<=value1 && value0>value1)
   else if(NormalizeDouble(value2-value1,ind_digits)<=0 && NormalizeDouble(value0-value1,ind_digits)>0)
      return LINE_STATE_UP;
//--- Line upward stop (value2<=value1 && value0==value1)
   else if(NormalizeDouble(value2-value1,ind_digits)<=0 && NormalizeDouble(value0-value1,ind_digits)==0)
      return LINE_STATE_STOP_UP;
//--- Line downward reversal (value2<value1 && value0<value1)
   if(NormalizeDouble(value2-value1,ind_digits)<0 && NormalizeDouble(value0-value1,ind_digits)<0)
      return LINE_STATE_TURN_DOWN;
//--- Line downward direction (value2>=value1 && value0<value1)
   else if(NormalizeDouble(value2-value1,ind_digits)>=0 && NormalizeDouble(value0-value1,ind_digits)<0)
      return LINE_STATE_DOWN;
//--- Line downward stop (value2>=value1 && value0==value1)
   else if(NormalizeDouble(value2-value1,ind_digits)>=0 && NormalizeDouble(value0-value1,ind_digits)==0)
      return LINE_STATE_STOP_DOWN;
//--- Undefined state
   return LINE_STATE_NONE;
  }
//+------------------------------------------------------------------+
//| Return the state of the line relative to the specified level     |
//+------------------------------------------------------------------+
ENUM_LINE_STATE LineStateRelative(const int ind_handle,const int index,const int buffer_num,const double level0,const double level1=EMPTY_VALUE)
  {
//--- Get the values of the indicator line with the shift (0,1) relative to the passed index
   const double value0=IndicatorValue(ind_handle,index,  buffer_num);
   const double value1=IndicatorValue(ind_handle,index+1,buffer_num);
//--- If at least one of the values could not be obtained, return an undefined value
   if(value0==EMPTY_VALUE || value1==EMPTY_VALUE)
      return LINE_STATE_NONE;
//--- Define the second level to compare
   double level=(level1==EMPTY_VALUE ? level0 : level1);
//--- The line is below the level (value1<level && value0<level0)
   if(NormalizeDouble(value1-level,ind_digits)<0 && NormalizeDouble(value0-level0,ind_digits)<0)
      return LINE_STATE_UNDER;
//--- The line is above the level (value1>level && value0>level0)
   if(NormalizeDouble(value1-level,ind_digits)>0 && NormalizeDouble(value0-level0,ind_digits)>0)
      return LINE_STATE_ABOVE;
//--- The line crossed the level upwards (value1<=level && value0>level0)
   if(NormalizeDouble(value1-level,ind_digits)<=0 && NormalizeDouble(value0-level0,ind_digits)>0)
      return LINE_STATE_CROSS_UP;
//--- The line crossed the level downwards (value1>=level && value0<level0)
   if(NormalizeDouble(value1-level,ind_digits)>=0 && NormalizeDouble(value0-level0,ind_digits)<0)
      return LINE_STATE_CROSS_DOWN;
//--- The line touched the level from below (value1<level0 && value0==level0)
   if(NormalizeDouble(value1-level,ind_digits)<0 && NormalizeDouble(value0-level0,ind_digits)==0)
      return LINE_STATE_TOUCH_BELOW;
//--- The line touched the level from above (value1>level0 && value0==level0)
   if(NormalizeDouble(value1-level,ind_digits)>0 && NormalizeDouble(value0-level0,ind_digits)==0)
      return LINE_STATE_TOUCH_BELOW;
//--- Line is equal to the level value (value1==level0 && value0==level0)
   if(NormalizeDouble(value1-level,ind_digits)==0 && NormalizeDouble(value0-level0,ind_digits)==0)
      return LINE_STATE_EQUALS;
//--- Undefined state
   return LINE_STATE_NONE;
  }
//+------------------------------------------------------------------+
//| Return the indicator line state description                      |
//+------------------------------------------------------------------+
string LineStateDescription(const ENUM_LINE_STATE state)
  {
   switch(state)
     {
      case LINE_STATE_UP         :  return "Up";
      case LINE_STATE_STOP_UP    :  return "Stop Up";
      case LINE_STATE_TURN_UP    :  return "Turn Up";
      case LINE_STATE_DOWN       :  return "Down";
      case LINE_STATE_STOP_DOWN  :  return "Stop Down";
      case LINE_STATE_TURN_DOWN  :  return "Turn Down";
      case LINE_STATE_ABOVE      :  return "Above level";
      case LINE_STATE_UNDER      :  return "Under level";
      case LINE_STATE_CROSS_UP   :  return "Crossing Up";
      case LINE_STATE_CROSS_DOWN :  return "Crossing Down";
      case LINE_STATE_TOUCH_BELOW:  return "Touch from Below";
      case LINE_STATE_TOUCH_ABOVE:  return "Touch from Above";
      case LINE_STATE_EQUALS     :  return "Equals";
      default                    :  return "Unknown";
     }
  }
Wenn wir das Dashboard verwenden, werden die Daten mit Hilfe der Funktion auf dem Bedienfeld angezeigt:
//+------------------------------------------------------------------+
//| Display data from the specified timeseries index to the panel    |
//+------------------------------------------------------------------+
void DrawData(const int index,const datetime time)
  {
//--- Declare the variables to receive data in them
   MqlTick  tick={0};
   MqlRates rates[1];

//--- Exit if unable to get the current prices
   if(!SymbolInfoTick(Symbol(),tick))
      return;
//--- Exit if unable to get the bar data by the specified index
   if(CopyRates(Symbol(),PERIOD_CURRENT,index,1,rates)!=1)
      return;

//--- Set font parameters for bar and indicator data headers
   int  size=0;
   uint flags=0;
   uint angle=0;
   string name=panel.FontParams(size,flags,angle);
   panel.SetFontParams(name,9,FW_BOLD);
   panel.DrawText("Bar data ["+(string)index+"]",3,panel.TableY1(0)-16,clrMaroon,panel.Width()-6);
   panel.DrawText("Indicator data ["+(string)index+"]",3,panel.TableY1(1)-16,clrGreen,panel.Width()-6);
//--- Set font parameters for bar and indicator data
   panel.SetFontParams(name,9);

//--- Display the data of the specified bar in table 0 on the panel
   panel.DrawText("Date",  panel.CellX(0,0,0)+2, panel.CellY(0,0,0)+2); panel.DrawText(TimeToString(  rates[0].time,TIME_DATE),     panel.CellX(0,0,1)+2, panel.CellY(0,0,1)+2,clrNONE,90);
   panel.DrawText("Time",  panel.CellX(0,1,0)+2, panel.CellY(0,1,0)+2); panel.DrawText(TimeToString(  rates[0].time,TIME_MINUTES),  panel.CellX(0,1,1)+2, panel.CellY(0,1,1)+2,clrNONE,90);
   panel.DrawText("Open",  panel.CellX(0,2,0)+2, panel.CellY(0,2,0)+2); panel.DrawText(DoubleToString(rates[0].open,Digits()),      panel.CellX(0,2,1)+2, panel.CellY(0,2,1)+2,clrNONE,90);
   panel.DrawText("High",  panel.CellX(0,3,0)+2, panel.CellY(0,3,0)+2); panel.DrawText(DoubleToString(rates[0].high,Digits()),      panel.CellX(0,3,1)+2, panel.CellY(0,3,1)+2,clrNONE,90);
   panel.DrawText("Low",   panel.CellX(0,4,0)+2, panel.CellY(0,4,0)+2); panel.DrawText(DoubleToString(rates[0].low,Digits()),       panel.CellX(0,4,1)+2, panel.CellY(0,4,1)+2,clrNONE,90);
   panel.DrawText("Close", panel.CellX(0,5,0)+2, panel.CellY(0,5,0)+2); panel.DrawText(DoubleToString(rates[0].close,Digits()),     panel.CellX(0,5,1)+2, panel.CellY(0,5,1)+2,clrNONE,90);

//--- Display the indicator data from the specified bar on the panel in table 1
   panel.DrawText(ind_title, panel.CellX(1,0,0)+2, panel.CellY(1,0,0)+2);
   double value=IndicatorValue(handle,index,0);
   string value_str=(value!=EMPTY_VALUE ? DoubleToString(value,ind_digits) : "");
   panel.DrawText(value_str,panel.CellX(1,0,1)+2,panel.CellY(1,0,1)+2,clrNONE,90);

//--- Display a description of the indicator line state
   panel.DrawText("Line state", panel.CellX(1,1,0)+2, panel.CellY(1,1,0)+2);
   ENUM_LINE_STATE state=LineState(handle,index,0);
   panel.DrawText(LineStateDescription(state),panel.CellX(1,1,1)+2,panel.CellY(1,1,1)+2,clrNONE,90);

//--- Redraw the chart to immediately display all changes on the panel
   ChartRedraw(ChartID());
  }
Außerdem wird bei der Verwendung des Dashboards das Handle für die Panel-Ereignisse in OnChartEvent() EA-Ereignishandler aufgerufen, und die Ereignisse für den Erhalt des Balkenindex unter dem Cursor werden behandelt:
//+------------------------------------------------------------------+
//| ChartEvent function                                              |
//+------------------------------------------------------------------+
void OnChartEvent(const int id,
                  const long &lparam,
                  const double &dparam,
                  const string &sparam)
  {
//--- Handling the panel
//--- Call the panel event handler
   panel.OnChartEvent(id,lparam,dparam,sparam);

//--- If the cursor moves or a click is made on the chart
   if(id==CHARTEVENT_MOUSE_MOVE || id==CHARTEVENT_CLICK)
     {
      //--- Declare the variables to record time and price coordinates in them
      datetime time=0;
      double price=0;
      int wnd=0;
      //--- If the cursor coordinates are converted to date and time
      if(ChartXYToTimePrice(ChartID(),(int)lparam,(int)dparam,wnd,time,price))
        {
         //--- write the bar index where the cursor is located to a global variable
         mouse_bar_index=iBarShift(Symbol(),PERIOD_CURRENT,time);
         //--- Display the bar data under the cursor on the panel
         DrawData(mouse_bar_index,time);
        }
     }

//--- If we received a custom event, display the appropriate message in the journal
   if(id>CHARTEVENT_CUSTOM)
     {
      //--- Here we can implement handling a click on the close button on the panel
      PrintFormat("%s: Event id=%ld, object id (lparam): %lu, event message (sparam): %s",__FUNCTION__,id,lparam,sparam);
     }
  }
Nachdem wir den EA kompiliert und auf dem Chart gestartet haben, können wir den Status des Indikatorwertes und der Linie auf dem Panel überwachen:
Sie können den Test EA TestVolumeOBV.mq5 in den an den Artikel angehängten Dateien ansehen.
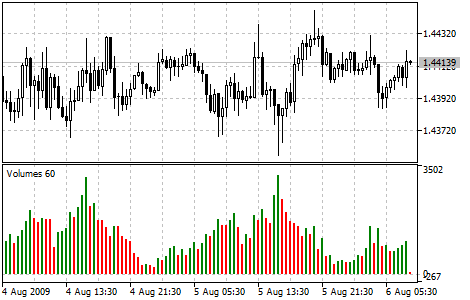
Volumen
Für den Forex-Markt ist der IndikatorVolumen-Indikator der Indikator für die Anzahl der Preisänderungen innerhalb jeder Periode eines ausgewählten Zeitrahmens. Bei Aktiensymbolen ist dies ein Indikator für das tatsächlich gehandelte Volumen (Kontrakte, Geld, Einheiten usw.).
Parameter
Die Funktion iVolumes() wird zur Erstellung des Indikator-Handles verwendet:
Gibt das Handle des Indikators zurück, der die Volumina beschreibt. Es gibt nur einen Puffer.
int  iVolumes(
   string               symbol,             // symbol name
   ENUM_TIMEFRAMES      period,             // period
   ENUM_APPLIED_VOLUME  applied_volume      // volume type
   )
symbol
[in] Der Symbolname des Finanzinstruments, dessen Daten zur Berechnung des Indikators verwendet werden sollen. NULL bedeutet aktuelles Symbol.
period
[in] Der Zeitrahmen, es ist ein Wert aus der Enumeration ENUM_TIMEFRAMES, 0 bedeutet den aktuellen Zeitrahmen.
applied_volume
[in] Verwendetes Volumen. Ein Wert aus der Enumeration ENUM_APPLIED_VOLUME.
Gibt das Handle des angegebenen technischen Indikators zurück. Falls fehlgeschlagen, wird INVALID_HANDLE zurückgegeben. Um den Computerspeicher eines nicht mehr verwendeten Indikators freizugeben, verwenden Sie IndicatorRelease(), dem das Indikator-Handle übergeben wird.
Deklarieren der Eingabe- und der globalen Variablen im EA, um den Indikator zu erstellen:
//+------------------------------------------------------------------+
//|                                                TestVolumeOBV.mq5 |
//|                                  Copyright 2023, MetaQuotes Ltd. |
//|                                             https://www.mql5.com |
//+------------------------------------------------------------------+
#property copyright "Copyright 2023, MetaQuotes Ltd."
#property link      "https://www.mql5.com"
#property version   "1.00"
//--- enums
enum ENUM_LINE_STATE
  {
   LINE_STATE_NONE,        // Undefined state
   LINE_STATE_UP,          // Upward
   LINE_STATE_DOWN,        // Downward
   LINE_STATE_TURN_UP,     // Upward reversal
   LINE_STATE_TURN_DOWN,   // Downward reversal
   LINE_STATE_STOP_UP,     // Upward stop
   LINE_STATE_STOP_DOWN,   // Downward stop
   LINE_STATE_ABOVE,       // Above value
   LINE_STATE_UNDER,       // Below value
   LINE_STATE_CROSS_UP,    // Crossing value upwards
   LINE_STATE_CROSS_DOWN,  // Crossing value downwards
   LINE_STATE_TOUCH_BELOW, // Touching value from below
   LINE_STATE_TOUCH_ABOVE, // Touch value from above
   LINE_STATE_EQUALS,      // Equal to value
  };
//--- input parameters
input ENUM_APPLIED_VOLUME  InpVolume   =  VOLUME_TICK;   /* Applied Volume */
//--- global variables
int      handle=INVALID_HANDLE;  // Indicator handle
int      ind_digits=0;           // Number of decimal places in the indicator values
string   ind_title;              // Indicator description
Wenn Sie das Dashboard im EA verwenden, deklarieren Sie die globalen Variablen und binden Sie die Datei mit der Klasse des Panels ein:
//+------------------------------------------------------------------+
//|                                                TestVolumeOBV.mq5 |
//|                                  Copyright 2023, MetaQuotes Ltd. |
//|                                             https://www.mql5.com |
//+------------------------------------------------------------------+
#property copyright "Copyright 2023, MetaQuotes Ltd."
#property link      "https://www.mql5.com"
#property version   "1.00"
//--- includes
#include <Dashboard\Dashboard.mqh>
//--- enums
enum ENUM_LINE_STATE
  {
   LINE_STATE_NONE,        // Undefined state
   LINE_STATE_UP,          // Upward
   LINE_STATE_DOWN,        // Downward
   LINE_STATE_TURN_UP,     // Upward reversal
   LINE_STATE_TURN_DOWN,   // Downward reversal
   LINE_STATE_STOP_UP,     // Upward stop
   LINE_STATE_STOP_DOWN,   // Downward stop
   LINE_STATE_ABOVE,       // Above value
   LINE_STATE_UNDER,       // Below value
   LINE_STATE_CROSS_UP,    // Crossing value upwards
   LINE_STATE_CROSS_DOWN,  // Crossing value downwards
   LINE_STATE_TOUCH_BELOW, // Touching value from below
   LINE_STATE_TOUCH_ABOVE, // Touch value from above
   LINE_STATE_EQUALS,      // Equal to value
  };
//--- input parameters
input ENUM_APPLIED_VOLUME  InpVolume   =  VOLUME_TICK;   /* Applied Volume */
//--- global variables
int      handle=INVALID_HANDLE;  // Indicator handle
int      ind_digits=0;           // Number of decimal places in the indicator values
string   ind_title;              // Indicator description
//--- variables for the panel
int      mouse_bar_index;        // Index of the bar the data is taken from
CDashboard *panel=NULL;          // Pointer to the panel object
Initialisierung
Einstellung der Werte der globalen Variablen für den Indikator und die Erstellung seines Handles:
//+------------------------------------------------------------------+
//| Expert initialization function                                   |
//+------------------------------------------------------------------+
int OnInit()
  {
//--- create timer
   EventSetTimer(60);

//--- Indicator
//--- Set the indicator name and the number of decimal places
   ind_title="Volumes";
   ind_digits=0;
//--- Create indicator handle
   ResetLastError();
   handle=iVolumes(Symbol(),PERIOD_CURRENT,InpVolume);
   if(handle==INVALID_HANDLE)
     {
      PrintFormat("%s: Failed to create indicator handle %s. Error %ld",__FUNCTION__,ind_title,GetLastError());
      return INIT_FAILED;
     }

//--- Successful initialization
   return(INIT_SUCCEEDED);
  }
Wenn der EA die Verwendung des Dashboards vorsieht, erstellen wir es hier:
//+------------------------------------------------------------------+
//| Expert initialization function                                   |
//+------------------------------------------------------------------+
int OnInit()
  {
//--- create timer
   EventSetTimer(60);

//--- Indicator
//--- Set the indicator name and the number of decimal places
   ind_title="Volumes";
   ind_digits=0;
//--- Create indicator handle
   ResetLastError();
   handle=iVolumes(Symbol(),PERIOD_CURRENT,InpVolume);
   if(handle==INVALID_HANDLE)
     {
      PrintFormat("%s: Failed to create indicator handle %s. Error %ld",__FUNCTION__,ind_title,GetLastError());
      return INIT_FAILED;
     }

//--- Dashboard
//--- Create the panel
   panel=new CDashboard(1,20,20,199,225);
   if(panel==NULL)
     {
      Print("Error. Failed to create panel object");
      return INIT_FAILED;
     }
//--- Set font parameters
   panel.SetFontParams("Calibri",9);
//--- Display the panel with the "Symbol, Timeframe description" header text
   panel.View(Symbol()+", "+StringSubstr(EnumToString(Period()),7));
//--- Create a table with ID 0 to display bar data in it
   panel.CreateNewTable(0);
//--- Draw a table with ID 0 on the panel background
   panel.DrawGrid(0,2,20,6,2,18,97);

//--- Create a table with ID 1 to display indicator data in it
   panel.CreateNewTable(1);
//--- Get the Y2 table coordinate with ID 0 and
//--- set the Y1 coordinate for the table with ID 1
   int y1=panel.TableY2(0)+22;
//--- Draw a table with ID 1 on the panel background
   panel.DrawGrid(1,2,y1,3,2,18,97);

//--- Display tabular data in the journal
   panel.GridPrint(0,2);
   panel.GridPrint(1,2);
//--- Initialize the variable with the index of the mouse cursor bar
   mouse_bar_index=0;
//--- Display the data of the current bar on the panel
   DrawData(mouse_bar_index,TimeCurrent());

//--- Successful initialization
   return(INIT_SUCCEEDED);
  }
Deinitialisierung
Freigabe des Indikator-Handles in OnDeinit() des EAs:
//+------------------------------------------------------------------+
//| Expert deinitialization function                                 |
//+------------------------------------------------------------------+
void OnDeinit(const int reason)
  {
//--- destroy timer
   EventKillTimer();

//--- Release handle of the indicator
   ResetLastError();
   if(!IndicatorRelease(handle))
      PrintFormat("%s: IndicatorRelease failed. Error %ld",__FUNCTION__,GetLastError());
//--- Clear all comments on the chart
   Comment("");
  }
Das erstellte Dashboard-Objekt wird bei der Verwendung des Dashboards entfernt:
//+------------------------------------------------------------------+
//| Expert deinitialization function                                 |
//+------------------------------------------------------------------+
void OnDeinit(const int reason)
  {
//--- destroy timer
   EventKillTimer();

//--- Release handle of the indicator
   ResetLastError();
   if(!IndicatorRelease(handle))
      PrintFormat("%s: IndicatorRelease failed. Error %ld",__FUNCTION__,GetLastError());
//--- Clear all comments on the chart
   Comment("");

//--- If the panel object exists, delete it
   if(panel!=NULL)
      delete panel;
  }
Abrufen von Daten
Im Folgenden werden die allgemeinen Funktionen zum Abrufen von Daten über das Indikator-Handle beschrieben. Die Funktionen wurden in dem Artikel über die Verbindung von Oszillatoren mit EAs beschrieben. Die vorgestellten Funktionen können in nutzerdefinierten Programmen im Prinzip unverändert verwendet werden:
//+------------------------------------------------------------------+
//| Return the indicator data on the specified bar                   |
//+------------------------------------------------------------------+
double IndicatorValue(const int ind_handle,const int index,const int buffer_num)
  {
   double array[1]={0};
   ResetLastError();
   if(CopyBuffer(ind_handle,buffer_num,index,1,array)!=1)
     {
      PrintFormat("%s: CopyBuffer failed. Error %ld",__FUNCTION__,GetLastError());
      return EMPTY_VALUE;
     }
   return array[0];
  }
//+------------------------------------------------------------------+
//| Return the state of the indicator line                           |
//+------------------------------------------------------------------+
ENUM_LINE_STATE LineState(const int ind_handle,const int index,const int buffer_num)
  {
//--- Get the values of the indicator line with the shift (0,1,2) relative to the passed index
   const double value0=IndicatorValue(ind_handle,index,  buffer_num);
   const double value1=IndicatorValue(ind_handle,index+1,buffer_num);
   const double value2=IndicatorValue(ind_handle,index+2,buffer_num);
//--- If at least one of the values could not be obtained, return an undefined value
   if(value0==EMPTY_VALUE || value1==EMPTY_VALUE || value2==EMPTY_VALUE)
      return LINE_STATE_NONE;
//--- Line upward reversal (value2>value1 && value0>value1)
   if(NormalizeDouble(value2-value1,ind_digits)>0 && NormalizeDouble(value0-value1,ind_digits)>0)
      return LINE_STATE_TURN_UP;
//--- Line upward direction (value2<=value1 && value0>value1)
   else if(NormalizeDouble(value2-value1,ind_digits)<=0 && NormalizeDouble(value0-value1,ind_digits)>0)
      return LINE_STATE_UP;
//--- Line upward stop (value2<=value1 && value0==value1)
   else if(NormalizeDouble(value2-value1,ind_digits)<=0 && NormalizeDouble(value0-value1,ind_digits)==0)
      return LINE_STATE_STOP_UP;
//--- Line downward reversal (value2<value1 && value0<value1)
   if(NormalizeDouble(value2-value1,ind_digits)<0 && NormalizeDouble(value0-value1,ind_digits)<0)
      return LINE_STATE_TURN_DOWN;
//--- Line downward direction (value2>=value1 && value0<value1)
   else if(NormalizeDouble(value2-value1,ind_digits)>=0 && NormalizeDouble(value0-value1,ind_digits)<0)
      return LINE_STATE_DOWN;
//--- Line downward stop (value2>=value1 && value0==value1)
   else if(NormalizeDouble(value2-value1,ind_digits)>=0 && NormalizeDouble(value0-value1,ind_digits)==0)
      return LINE_STATE_STOP_DOWN;
//--- Undefined state
   return LINE_STATE_NONE;
  }
//+------------------------------------------------------------------+
//| Return the state of the line relative to the specified level     |
//+------------------------------------------------------------------+
ENUM_LINE_STATE LineStateRelative(const int ind_handle,const int index,const int buffer_num,const double level0,const double level1=EMPTY_VALUE)
  {
//--- Get the values of the indicator line with the shift (0,1) relative to the passed index
   const double value0=IndicatorValue(ind_handle,index,  buffer_num);
   const double value1=IndicatorValue(ind_handle,index+1,buffer_num);
//--- If at least one of the values could not be obtained, return an undefined value
   if(value0==EMPTY_VALUE || value1==EMPTY_VALUE)
      return LINE_STATE_NONE;
//--- Define the second level to compare
   double level=(level1==EMPTY_VALUE ? level0 : level1);
//--- The line is below the level (value1<level && value0<level0)
   if(NormalizeDouble(value1-level,ind_digits)<0 && NormalizeDouble(value0-level0,ind_digits)<0)
      return LINE_STATE_UNDER;
//--- The line is above the level (value1>level && value0>level0)
   if(NormalizeDouble(value1-level,ind_digits)>0 && NormalizeDouble(value0-level0,ind_digits)>0)
      return LINE_STATE_ABOVE;
//--- The line crossed the level upwards (value1<=level && value0>level0)
   if(NormalizeDouble(value1-level,ind_digits)<=0 && NormalizeDouble(value0-level0,ind_digits)>0)
      return LINE_STATE_CROSS_UP;
//--- The line crossed the level downwards (value1>=level && value0<level0)
   if(NormalizeDouble(value1-level,ind_digits)>=0 && NormalizeDouble(value0-level0,ind_digits)<0)
      return LINE_STATE_CROSS_DOWN;
//--- The line touched the level from below (value1<level0 && value0==level0)
   if(NormalizeDouble(value1-level,ind_digits)<0 && NormalizeDouble(value0-level0,ind_digits)==0)
      return LINE_STATE_TOUCH_BELOW;
//--- The line touched the level from above (value1>level0 && value0==level0)
   if(NormalizeDouble(value1-level,ind_digits)>0 && NormalizeDouble(value0-level0,ind_digits)==0)
      return LINE_STATE_TOUCH_BELOW;
//--- Line is equal to the level value (value1==level0 && value0==level0)
   if(NormalizeDouble(value1-level,ind_digits)==0 && NormalizeDouble(value0-level0,ind_digits)==0)
      return LINE_STATE_EQUALS;
//--- Undefined state
   return LINE_STATE_NONE;
  }
//+------------------------------------------------------------------+
//| Return the indicator line state description                      |
//+------------------------------------------------------------------+
string LineStateDescription(const ENUM_LINE_STATE state)
  {
   switch(state)
     {
      case LINE_STATE_UP         :  return "Up";
      case LINE_STATE_STOP_UP    :  return "Stop Up";
      case LINE_STATE_TURN_UP    :  return "Turn Up";
      case LINE_STATE_DOWN       :  return "Down";
      case LINE_STATE_STOP_DOWN  :  return "Stop Down";
      case LINE_STATE_TURN_DOWN  :  return "Turn Down";
      case LINE_STATE_ABOVE      :  return "Above level";
      case LINE_STATE_UNDER      :  return "Under level";
      case LINE_STATE_CROSS_UP   :  return "Crossing Up";
      case LINE_STATE_CROSS_DOWN :  return "Crossing Down";
      case LINE_STATE_TOUCH_BELOW:  return "Touch from Below";
      case LINE_STATE_TOUCH_ABOVE:  return "Touch from Above";
      case LINE_STATE_EQUALS     :  return "Equals";
      default                    :  return "Unknown";
     }
  }
Wenn wir das Dashboard verwenden, werden die Daten mit Hilfe der Funktion auf dem Bedienfeld angezeigt:
//+------------------------------------------------------------------+
//| Display data from the specified timeseries index to the panel    |
//+------------------------------------------------------------------+
void DrawData(const int index,const datetime time)
  {
//--- Declare the variables to receive data in them
   MqlTick  tick={0};
   MqlRates rates[1];

//--- Exit if unable to get the current prices
   if(!SymbolInfoTick(Symbol(),tick))
      return;
//--- Exit if unable to get the bar data by the specified index
   if(CopyRates(Symbol(),PERIOD_CURRENT,index,1,rates)!=1)
      return;

//--- Set font parameters for bar and indicator data headers
   int  size=0;
   uint flags=0;
   uint angle=0;
   string name=panel.FontParams(size,flags,angle);
   panel.SetFontParams(name,9,FW_BOLD);
   panel.DrawText("Bar data ["+(string)index+"]",3,panel.TableY1(0)-16,clrMaroon,panel.Width()-6);
   panel.DrawText("Indicator data ["+(string)index+"]",3,panel.TableY1(1)-16,clrGreen,panel.Width()-6);
//--- Set font parameters for bar and indicator data
   panel.SetFontParams(name,9);

//--- Display the data of the specified bar in table 0 on the panel
   panel.DrawText("Date",  panel.CellX(0,0,0)+2, panel.CellY(0,0,0)+2); panel.DrawText(TimeToString(  rates[0].time,TIME_DATE),     panel.CellX(0,0,1)+2, panel.CellY(0,0,1)+2,clrNONE,90);
   panel.DrawText("Time",  panel.CellX(0,1,0)+2, panel.CellY(0,1,0)+2); panel.DrawText(TimeToString(  rates[0].time,TIME_MINUTES),  panel.CellX(0,1,1)+2, panel.CellY(0,1,1)+2,clrNONE,90);
   panel.DrawText("Open",  panel.CellX(0,2,0)+2, panel.CellY(0,2,0)+2); panel.DrawText(DoubleToString(rates[0].open,Digits()),      panel.CellX(0,2,1)+2, panel.CellY(0,2,1)+2,clrNONE,90);
   panel.DrawText("High",  panel.CellX(0,3,0)+2, panel.CellY(0,3,0)+2); panel.DrawText(DoubleToString(rates[0].high,Digits()),      panel.CellX(0,3,1)+2, panel.CellY(0,3,1)+2,clrNONE,90);
   panel.DrawText("Low",   panel.CellX(0,4,0)+2, panel.CellY(0,4,0)+2); panel.DrawText(DoubleToString(rates[0].low,Digits()),       panel.CellX(0,4,1)+2, panel.CellY(0,4,1)+2,clrNONE,90);
   panel.DrawText("Close", panel.CellX(0,5,0)+2, panel.CellY(0,5,0)+2); panel.DrawText(DoubleToString(rates[0].close,Digits()),     panel.CellX(0,5,1)+2, panel.CellY(0,5,1)+2,clrNONE,90);

//--- Display the indicator data from the specified bar on the panel in table 1
   panel.DrawText(ind_title, panel.CellX(1,0,0)+2, panel.CellY(1,0,0)+2);
   double value0=IndicatorValue(handle,index,  0);
   double value1=IndicatorValue(handle,index+1,0);
   string value_str=(value0!=EMPTY_VALUE ? DoubleToString(value0,ind_digits) : "");
   color clr=(value0>value1 ? clrGreen : value0<value1 ? clrRed : clrNONE);
   panel.DrawText(value_str,panel.CellX(1,0,1)+2,panel.CellY(1,0,1)+2,clrNONE,90);

//--- Display a description of the indicator line state
   panel.DrawText("Line state", panel.CellX(1,1,0)+2, panel.CellY(1,1,0)+2);
   ENUM_LINE_STATE state=LineState(handle,index,0);
   panel.DrawText(LineStateDescription(state),panel.CellX(1,1,1)+2,panel.CellY(1,1,1)+2,clr,90);

//--- Redraw the chart to immediately display all changes on the panel
   ChartRedraw(ChartID());
  }
Die Farbe des Statustextes auf dem Bedienfeld entspricht der Farbe der Anzeigespalte, über der sich der Cursor befindet.
Außerdem wird bei der Verwendung des Dashboards das Handle für die Panel-Ereignisse in OnChartEvent() EA-Ereignishandler aufgerufen, und die Ereignisse für den Erhalt des Balkenindex unter dem Cursor werden behandelt:
//+------------------------------------------------------------------+
//| ChartEvent function                                              |
//+------------------------------------------------------------------+
void OnChartEvent(const int id,
                  const long &lparam,
                  const double &dparam,
                  const string &sparam)
  {
//--- Handling the panel
//--- Call the panel event handler
   panel.OnChartEvent(id,lparam,dparam,sparam);

//--- If the cursor moves or a click is made on the chart
   if(id==CHARTEVENT_MOUSE_MOVE || id==CHARTEVENT_CLICK)
     {
      //--- Declare the variables to record time and price coordinates in them
      datetime time=0;
      double price=0;
      int wnd=0;
      //--- If the cursor coordinates are converted to date and time
      if(ChartXYToTimePrice(ChartID(),(int)lparam,(int)dparam,wnd,time,price))
        {
         //--- write the bar index where the cursor is located to a global variable
         mouse_bar_index=iBarShift(Symbol(),PERIOD_CURRENT,time);
         //--- Display the bar data under the cursor on the panel
         DrawData(mouse_bar_index,time);
        }
     }

//--- If we received a custom event, display the appropriate message in the journal
   if(id>CHARTEVENT_CUSTOM)
     {
      //--- Here we can implement handling a click on the close button on the panel
      PrintFormat("%s: Event id=%ld, object id (lparam): %lu, event message (sparam): %s",__FUNCTION__,id,lparam,sparam);
     }
  }
Nachdem wir den EA kompiliert und auf dem Chart gestartet haben, können wir den Status des Indikatorwertes und der Linie auf dem Panel überwachen:
Sie können den Test EA TestVolumeVolumes.mq5 in den an den Artikel angehängten Dateien ansehen.
Indikatoren von Bill Williams
Bill Williams' Indikatoren sind in einer separaten Gruppe sortiert, da diese Teil des von Ihm beschriebenen Handelssystems sind.
Accelerator Oszillator
Der Preis verändert sich zuletzt. Bevor sich die Preise ändern, ändert die treibende Kraft des Marktes ihre Richtung, die Beschleunigung der treibenden Kraft muss sich verlangsamen und den Nullpunkt erreichen. Dann beginnt er sich zu beschleunigen, bis der Preis seine Richtung zu ändern beginnt.
Acceleration/Deceleration, Accelerator/Decelerator Oscillator (AC) misst die positive oder negative Beschleunigung der aktuellen Antriebskraft. Dieser Indikator ändert die Richtung vor den Veränderungen in den treibenden Kräften, also auch bevor der Preis die Richtung wechselt. Durch das Verständnis dieses Indikators als Frühwarnsystem, haben Sie wichtige Vorteile.
Die Nulllinie ist der Ort, an dem sich die Kräfte beider Richtungen ausgleichen. Ist Acceleration/Deceleration größer Null, ist es leichter, dass die Beschleunigung die Aufwärtsbewegung fortsetzt (und umgekehrt, falls der Wert kleiner als Null ist). Im Gegensatz zum Awesome Oscillator ist der Nulldurchgang kein Signal. Der einzige Entscheidungsfaktor ist die Veränderung der Farbe. Um sich ernsthafte Überlegungen zu ersparen, müssen Sie daran denken: Sie sollten nicht mit Hilfe von Acceleration/Deceleration kaufen, wenn der aktuelle Balken rot gefärbt ist, und Sie sollten nicht verkaufen, wenn der aktuelle Balken grün gefärbt ist.
Wenn Sie in den Markt in der Richtung der treibenden Kraft einsteigen (der Indikator ist höher als Null, wenn Sie kaufen, oder er ist niedriger als Null, wenn Sie verkaufen), dann brauchen Sie nur zwei grüne Balken zum Kaufen (zwei rote Balken zum Verkaufen). Wenn die treibende Kraft nicht der Eröffnungsrichtung entspricht (Indikator unter Null, beim Kauf oder über Null, beim Verkauf), wird eine Bestätigung benötigt, zum Beispiel durch einen dritte Balken. In diesem Fall muss der Indikator drei rote Balken über der Nulllinie für die Verkaufsposition und drei grüne Balken unter der Nulllinie für die Kaufposition zeigen.
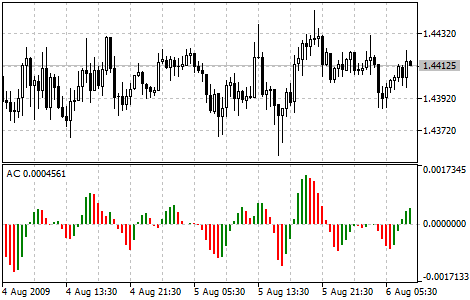
Parameter
Die Funktion iAC() wird verwendet, um das Indikator-Handle zu erstellen:
Erstellen des Accelerator Oscillator Indikator mit der Rückgabe seines Handle. Es gibt nur einen Puffer.
int  iAC(
   string           symbol,     // symbol name
   ENUM_TIMEFRAMES  period      // period
   );
symbol
[in] Der Symbolname des Finanzinstruments, dessen Daten zur Berechnung des Indikators verwendet werden sollen. NULL bedeutet das aktuelle Symbol.
period
[in] Der Zeitrahmen, es ist ein Wert aus der Enumeration ENUM_TIMEFRAMES, 0 bedeutet den aktuellen Zeitrahmen.
Gibt das Handle des angegebenen technischen Indikators zurück. Falls fehlgeschlagen, wird INVALID_HANDLE zurückgegeben. Um den Computerspeicher eines nicht mehr verwendeten Indikators freizugeben, verwenden Sie IndicatorRelease(), dem das Indikator-Handle übergeben wird.
Deklaration der globalen Variablen im EA, um den Indikator zu erstellen (der Indikator hat keine Eingaben außer der Einstellung der Farben der auf- und absteigenden Histogrammbalken):
//+------------------------------------------------------------------+
//|                                               TestWilliamsAC.mq5 |
//|                                  Copyright 2023, MetaQuotes Ltd. |
//|                                             https://www.mql5.com |
//+------------------------------------------------------------------+
#property copyright "Copyright 2023, MetaQuotes Ltd."
#property link      "https://www.mql5.com"
#property version   "1.00"
//--- enums
enum ENUM_LINE_STATE
  {
   LINE_STATE_NONE,        // Undefined state
   LINE_STATE_UP,          // Upward
   LINE_STATE_DOWN,        // Downward
   LINE_STATE_TURN_UP,     // Upward reversal
   LINE_STATE_TURN_DOWN,   // Downward reversal
   LINE_STATE_STOP_UP,     // Upward stop
   LINE_STATE_STOP_DOWN,   // Downward stop
   LINE_STATE_ABOVE,       // Above value
   LINE_STATE_UNDER,       // Below value
   LINE_STATE_CROSS_UP,    // Crossing value upwards
   LINE_STATE_CROSS_DOWN,  // Crossing value downwards
   LINE_STATE_TOUCH_BELOW, // Touching value from below
   LINE_STATE_TOUCH_ABOVE, // Touch value from above
   LINE_STATE_EQUALS,      // Equal to value
  };
//--- global variables
int      handle=INVALID_HANDLE;  // Indicator handle
int      ind_digits=0;           // Number of decimal places in the indicator values
string   ind_title;              // Indicator description
Wenn Sie das Dashboard im EA verwenden, deklarieren Sie die globalen Variablen und binden Sie die Datei mit der Klasse des Panels ein:
//+------------------------------------------------------------------+
//|                                               TestWilliamsAC.mq5 |
//|                                  Copyright 2023, MetaQuotes Ltd. |
//|                                             https://www.mql5.com |
//+------------------------------------------------------------------+
#property copyright "Copyright 2023, MetaQuotes Ltd."
#property link      "https://www.mql5.com"
#property version   "1.00"
//--- includes
#include <Dashboard\Dashboard.mqh>
//--- enums
enum ENUM_LINE_STATE
  {
   LINE_STATE_NONE,        // Undefined state
   LINE_STATE_UP,          // Upward
   LINE_STATE_DOWN,        // Downward
   LINE_STATE_TURN_UP,     // Upward reversal
   LINE_STATE_TURN_DOWN,   // Downward reversal
   LINE_STATE_STOP_UP,     // Upward stop
   LINE_STATE_STOP_DOWN,   // Downward stop
   LINE_STATE_ABOVE,       // Above value
   LINE_STATE_UNDER,       // Below value
   LINE_STATE_CROSS_UP,    // Crossing value upwards
   LINE_STATE_CROSS_DOWN,  // Crossing value downwards
   LINE_STATE_TOUCH_BELOW, // Touching value from below
   LINE_STATE_TOUCH_ABOVE, // Touch value from above
   LINE_STATE_EQUALS,      // Equal to value
  };
//--- global variables
int      handle=INVALID_HANDLE;  // Indicator handle
int      ind_digits=0;           // Number of decimal places in the indicator values
string   ind_title;              // Indicator description
//--- variables for the panel
int      mouse_bar_index;        // Index of the bar the data is taken from
CDashboard *panel=NULL;          // Pointer to the panel object
Initialisierung
Einstellung der Werte der globalen Variablen für den Indikator und die Erstellung seines Handles:
//+------------------------------------------------------------------+
//| Expert initialization function                                   |
//+------------------------------------------------------------------+
int OnInit()
  {
//--- create timer
   EventSetTimer(60);

//--- Indicator
//--- Set the indicator name and the number of decimal places
   ind_title="AC";
   ind_digits=Digits()+2;
//--- Create indicator handle
   ResetLastError();
   handle=iAC(Symbol(),PERIOD_CURRENT);
   if(handle==INVALID_HANDLE)
     {
      PrintFormat("%s: Failed to create indicator handle %s. Error %ld",__FUNCTION__,ind_title,GetLastError());
      return INIT_FAILED;
     }

//--- Successful initialization
   return(INIT_SUCCEEDED);
  }
Wenn der EA die Verwendung des Dashboards vorsieht, erstellen wir es hier:
//+------------------------------------------------------------------+
//| Expert initialization function                                   |
//+------------------------------------------------------------------+
int OnInit()
  {
//--- create timer
   EventSetTimer(60);

//--- Indicator
//--- Set the indicator name and the number of decimal places
   ind_title="AC";
   ind_digits=Digits()+2;
//--- Create indicator handle
   ResetLastError();
   handle=iAC(Symbol(),PERIOD_CURRENT);
   if(handle==INVALID_HANDLE)
     {
      PrintFormat("%s: Failed to create indicator handle %s. Error %ld",__FUNCTION__,ind_title,GetLastError());
      return INIT_FAILED;
     }

//--- Dashboard
//--- Create the panel
   panel=new CDashboard(1,20,20,199,225);
   if(panel==NULL)
     {
      Print("Error. Failed to create panel object");
      return INIT_FAILED;
     }
//--- Set font parameters
   panel.SetFontParams("Calibri",9);
//--- Display the panel with the "Symbol, Timeframe description" header text
   panel.View(Symbol()+", "+StringSubstr(EnumToString(Period()),7));
//--- Create a table with ID 0 to display bar data in it
   panel.CreateNewTable(0);
//--- Draw a table with ID 0 on the panel background
   panel.DrawGrid(0,2,20,6,2,18,97);

//--- Create a table with ID 1 to display indicator data in it
   panel.CreateNewTable(1);
//--- Get the Y2 table coordinate with ID 0 and
//--- set the Y1 coordinate for the table with ID 1
   int y1=panel.TableY2(0)+22;
//--- Draw a table with ID 1 on the panel background
   panel.DrawGrid(1,2,y1,3,2,18,97);

//--- Display tabular data in the journal
   panel.GridPrint(0,2);
   panel.GridPrint(1,2);
//--- Initialize the variable with the index of the mouse cursor bar
   mouse_bar_index=0;
//--- Display the data of the current bar on the panel
   DrawData(mouse_bar_index,TimeCurrent());

//--- Successful initialization
   return(INIT_SUCCEEDED);
  }
Deinitialisierung
Freigabe des Indikator-Handles in OnDeinit() des EAs:
//+------------------------------------------------------------------+
//| Expert deinitialization function                                 |
//+------------------------------------------------------------------+
void OnDeinit(const int reason)
  {
//--- destroy timer
   EventKillTimer();

//--- Release handle of the indicator
   ResetLastError();
   if(!IndicatorRelease(handle))
      PrintFormat("%s: IndicatorRelease failed. Error %ld",__FUNCTION__,GetLastError());
//--- Clear all comments on the chart
   Comment("");
  }
Das erstellte Dashboard-Objekt wird bei der Verwendung des Dashboards entfernt:
//+------------------------------------------------------------------+
//| Expert deinitialization function                                 |
//+------------------------------------------------------------------+
void OnDeinit(const int reason)
  {
//--- destroy timer
   EventKillTimer();

//--- Release handle of the indicator
   ResetLastError();
   if(!IndicatorRelease(handle))
      PrintFormat("%s: IndicatorRelease failed. Error %ld",__FUNCTION__,GetLastError());
//--- Clear all comments on the chart
   Comment("");

//--- If the panel object exists, delete it
   if(panel!=NULL)
      delete panel;
  }
Abrufen von Daten
Im Folgenden werden die allgemeinen Funktionen zum Abrufen von Daten über das Indikator-Handle beschrieben. Die Funktionen wurden in dem Artikel über die Verbindung von Oszillatoren mit EAs beschrieben. Die vorgestellten Funktionen können in nutzerdefinierten Programmen im Prinzip unverändert verwendet werden:
//+------------------------------------------------------------------+
//| Return the indicator data on the specified bar                   |
//+------------------------------------------------------------------+
double IndicatorValue(const int ind_handle,const int index,const int buffer_num)
  {
   double array[1]={0};
   ResetLastError();
   if(CopyBuffer(ind_handle,buffer_num,index,1,array)!=1)
     {
      PrintFormat("%s: CopyBuffer failed. Error %ld",__FUNCTION__,GetLastError());
      return EMPTY_VALUE;
     }
   return array[0];
  }
//+------------------------------------------------------------------+
//| Return the state of the indicator line                           |
//+------------------------------------------------------------------+
ENUM_LINE_STATE LineState(const int ind_handle,const int index,const int buffer_num)
  {
//--- Get the values of the indicator line with the shift (0,1,2) relative to the passed index
   const double value0=IndicatorValue(ind_handle,index,  buffer_num);
   const double value1=IndicatorValue(ind_handle,index+1,buffer_num);
   const double value2=IndicatorValue(ind_handle,index+2,buffer_num);
//--- If at least one of the values could not be obtained, return an undefined value
   if(value0==EMPTY_VALUE || value1==EMPTY_VALUE || value2==EMPTY_VALUE)
      return LINE_STATE_NONE;
//--- Line upward reversal (value2>value1 && value0>value1)
   if(NormalizeDouble(value2-value1,ind_digits)>0 && NormalizeDouble(value0-value1,ind_digits)>0)
      return LINE_STATE_TURN_UP;
//--- Line upward direction (value2<=value1 && value0>value1)
   else if(NormalizeDouble(value2-value1,ind_digits)<=0 && NormalizeDouble(value0-value1,ind_digits)>0)
      return LINE_STATE_UP;
//--- Line upward stop (value2<=value1 && value0==value1)
   else if(NormalizeDouble(value2-value1,ind_digits)<=0 && NormalizeDouble(value0-value1,ind_digits)==0)
      return LINE_STATE_STOP_UP;
//--- Line downward reversal (value2<value1 && value0<value1)
   if(NormalizeDouble(value2-value1,ind_digits)<0 && NormalizeDouble(value0-value1,ind_digits)<0)
      return LINE_STATE_TURN_DOWN;
//--- Line downward direction (value2>=value1 && value0<value1)
   else if(NormalizeDouble(value2-value1,ind_digits)>=0 && NormalizeDouble(value0-value1,ind_digits)<0)
      return LINE_STATE_DOWN;
//--- Line downward stop (value2>=value1 && value0==value1)
   else if(NormalizeDouble(value2-value1,ind_digits)>=0 && NormalizeDouble(value0-value1,ind_digits)==0)
      return LINE_STATE_STOP_DOWN;
//--- Undefined state
   return LINE_STATE_NONE;
  }
//+------------------------------------------------------------------+
//| Return the state of the line relative to the specified level     |
//+------------------------------------------------------------------+
ENUM_LINE_STATE LineStateRelative(const int ind_handle,const int index,const int buffer_num,const double level0,const double level1=EMPTY_VALUE)
  {
//--- Get the values of the indicator line with the shift (0,1) relative to the passed index
   const double value0=IndicatorValue(ind_handle,index,  buffer_num);
   const double value1=IndicatorValue(ind_handle,index+1,buffer_num);
//--- If at least one of the values could not be obtained, return an undefined value
   if(value0==EMPTY_VALUE || value1==EMPTY_VALUE)
      return LINE_STATE_NONE;
//--- Define the second level to compare
   double level=(level1==EMPTY_VALUE ? level0 : level1);
//--- The line is below the level (value1<level && value0<level0)
   if(NormalizeDouble(value1-level,ind_digits)<0 && NormalizeDouble(value0-level0,ind_digits)<0)
      return LINE_STATE_UNDER;
//--- The line is above the level (value1>level && value0>level0)
   if(NormalizeDouble(value1-level,ind_digits)>0 && NormalizeDouble(value0-level0,ind_digits)>0)
      return LINE_STATE_ABOVE;
//--- The line crossed the level upwards (value1<=level && value0>level0)
   if(NormalizeDouble(value1-level,ind_digits)<=0 && NormalizeDouble(value0-level0,ind_digits)>0)
      return LINE_STATE_CROSS_UP;
//--- The line crossed the level downwards (value1>=level && value0<level0)
   if(NormalizeDouble(value1-level,ind_digits)>=0 && NormalizeDouble(value0-level0,ind_digits)<0)
      return LINE_STATE_CROSS_DOWN;
//--- The line touched the level from below (value1<level0 && value0==level0)
   if(NormalizeDouble(value1-level,ind_digits)<0 && NormalizeDouble(value0-level0,ind_digits)==0)
      return LINE_STATE_TOUCH_BELOW;
//--- The line touched the level from above (value1>level0 && value0==level0)
   if(NormalizeDouble(value1-level,ind_digits)>0 && NormalizeDouble(value0-level0,ind_digits)==0)
      return LINE_STATE_TOUCH_BELOW;
//--- Line is equal to the level value (value1==level0 && value0==level0)
   if(NormalizeDouble(value1-level,ind_digits)==0 && NormalizeDouble(value0-level0,ind_digits)==0)
      return LINE_STATE_EQUALS;
//--- Undefined state
   return LINE_STATE_NONE;
  }
//+------------------------------------------------------------------+
//| Return the indicator line state description                      |
//+------------------------------------------------------------------+
string LineStateDescription(const ENUM_LINE_STATE state)
  {
   switch(state)
     {
      case LINE_STATE_UP         :  return "Up";
      case LINE_STATE_STOP_UP    :  return "Stop Up";
      case LINE_STATE_TURN_UP    :  return "Turn Up";
      case LINE_STATE_DOWN       :  return "Down";
      case LINE_STATE_STOP_DOWN  :  return "Stop Down";
      case LINE_STATE_TURN_DOWN  :  return "Turn Down";
      case LINE_STATE_ABOVE      :  return "Above level";
      case LINE_STATE_UNDER      :  return "Under level";
      case LINE_STATE_CROSS_UP   :  return "Crossing Up";
      case LINE_STATE_CROSS_DOWN :  return "Crossing Down";
      case LINE_STATE_TOUCH_BELOW:  return "Touch from Below";
      case LINE_STATE_TOUCH_ABOVE:  return "Touch from Above";
      case LINE_STATE_EQUALS     :  return "Equals";
      default                    :  return "Unknown";
     }
  }
Wenn wir das Dashboard verwenden, werden die Daten mit Hilfe der Funktion auf dem Bedienfeld angezeigt:
//+------------------------------------------------------------------+
//| Display data from the specified timeseries index to the panel    |
//+------------------------------------------------------------------+
void DrawData(const int index,const datetime time)
  {
//--- Declare the variables to receive data in them
   MqlTick  tick={0};
   MqlRates rates[1];

//--- Exit if unable to get the current prices
   if(!SymbolInfoTick(Symbol(),tick))
      return;
//--- Exit if unable to get the bar data by the specified index
   if(CopyRates(Symbol(),PERIOD_CURRENT,index,1,rates)!=1)
      return;

//--- Set font parameters for bar and indicator data headers
   int  size=0;
   uint flags=0;
   uint angle=0;
   string name=panel.FontParams(size,flags,angle);
   panel.SetFontParams(name,9,FW_BOLD);
   panel.DrawText("Bar data ["+(string)index+"]",3,panel.TableY1(0)-16,clrMaroon,panel.Width()-6);
   panel.DrawText("Indicator data ["+(string)index+"]",3,panel.TableY1(1)-16,clrGreen,panel.Width()-6);
//--- Set font parameters for bar and indicator data
   panel.SetFontParams(name,9);

//--- Display the data of the specified bar in table 0 on the panel
   panel.DrawText("Date",  panel.CellX(0,0,0)+2, panel.CellY(0,0,0)+2); panel.DrawText(TimeToString(  rates[0].time,TIME_DATE),     panel.CellX(0,0,1)+2, panel.CellY(0,0,1)+2,clrNONE,90);
   panel.DrawText("Time",  panel.CellX(0,1,0)+2, panel.CellY(0,1,0)+2); panel.DrawText(TimeToString(  rates[0].time,TIME_MINUTES),  panel.CellX(0,1,1)+2, panel.CellY(0,1,1)+2,clrNONE,90);
   panel.DrawText("Open",  panel.CellX(0,2,0)+2, panel.CellY(0,2,0)+2); panel.DrawText(DoubleToString(rates[0].open,Digits()),      panel.CellX(0,2,1)+2, panel.CellY(0,2,1)+2,clrNONE,90);
   panel.DrawText("High",  panel.CellX(0,3,0)+2, panel.CellY(0,3,0)+2); panel.DrawText(DoubleToString(rates[0].high,Digits()),      panel.CellX(0,3,1)+2, panel.CellY(0,3,1)+2,clrNONE,90);
   panel.DrawText("Low",   panel.CellX(0,4,0)+2, panel.CellY(0,4,0)+2); panel.DrawText(DoubleToString(rates[0].low,Digits()),       panel.CellX(0,4,1)+2, panel.CellY(0,4,1)+2,clrNONE,90);
   panel.DrawText("Close", panel.CellX(0,5,0)+2, panel.CellY(0,5,0)+2); panel.DrawText(DoubleToString(rates[0].close,Digits()),     panel.CellX(0,5,1)+2, panel.CellY(0,5,1)+2,clrNONE,90);

//--- Display the indicator data from the specified bar on the panel in table 1
   panel.DrawText(ind_title, panel.CellX(1,0,0)+2, panel.CellY(1,0,0)+2);
   double value0=IndicatorValue(handle,index,  0);
   double value1=IndicatorValue(handle,index+1,0);
   string value_str=(value0!=EMPTY_VALUE ? DoubleToString(value0,ind_digits) : "");
   color clr=(value0>value1 ? clrGreen : value0<value1 ? clrRed : clrNONE);
   panel.DrawText(value_str,panel.CellX(1,0,1)+2,panel.CellY(1,0,1)+2,clrNONE,90);

//--- Display a description of the indicator line state
   panel.DrawText("Line state", panel.CellX(1,1,0)+2, panel.CellY(1,1,0)+2);
   ENUM_LINE_STATE state=LineState(handle,index,0);
   panel.DrawText(LineStateDescription(state),panel.CellX(1,1,1)+2,panel.CellY(1,1,1)+2,clr,90);

//--- Redraw the chart to immediately display all changes on the panel
   ChartRedraw(ChartID());
  }
Die Farbe der Indikatorzeilen-Statustexte auf dem Dashboard entspricht der Farbe der Histogrammbalken, über denen sich der Cursor befindet.
Außerdem wird bei der Verwendung des Dashboards das Handle für die Panel-Ereignisse in OnChartEvent() EA-Ereignishandler aufgerufen, und die Ereignisse für den Erhalt des Balkenindex unter dem Cursor werden behandelt:
//+------------------------------------------------------------------+
//| ChartEvent function                                              |
//+------------------------------------------------------------------+
void OnChartEvent(const int id,
                  const long &lparam,
                  const double &dparam,
                  const string &sparam)
  {
//--- Handling the panel
//--- Call the panel event handler
   panel.OnChartEvent(id,lparam,dparam,sparam);

//--- If the cursor moves or a click is made on the chart
   if(id==CHARTEVENT_MOUSE_MOVE || id==CHARTEVENT_CLICK)
     {
      //--- Declare the variables to record time and price coordinates in them
      datetime time=0;
      double price=0;
      int wnd=0;
      //--- If the cursor coordinates are converted to date and time
      if(ChartXYToTimePrice(ChartID(),(int)lparam,(int)dparam,wnd,time,price))
        {
         //--- write the bar index where the cursor is located to a global variable
         mouse_bar_index=iBarShift(Symbol(),PERIOD_CURRENT,time);
         //--- Display the bar data under the cursor on the panel
         DrawData(mouse_bar_index,time);
        }
     }

//--- If we received a custom event, display the appropriate message in the journal
   if(id>CHARTEVENT_CUSTOM)
     {
      //--- Here we can implement handling a click on the close button on the panel
      PrintFormat("%s: Event id=%ld, object id (lparam): %lu, event message (sparam): %s",__FUNCTION__,id,lparam,sparam);
     }
  }
Nachdem wir den EA kompiliert und auf dem Chart gestartet haben, können wir den Status des Indikatorwertes und der Linie auf dem Panel überwachen:
Sie können den Test EA TestWilliamsAC.mq5 in den an den Artikel angehängten Dateien ansehen.
Alligator
Märkte befinden sich meist in Seitwärtsbewegungen. Nur in etwa 15–30% der Zeit befinden sich Märkte in Trend-Bewegungen und Händler, die nicht selbst Vorort an einer Börse sind, profitieren am meisten von Trend-Bewegungen. Mein Großvater pflegte das zu wiederholen: „Selbst ein blindes Huhn findet seine Körner, wenn es immer zur gleichen Zeit gefüttert wird.“ Nennen wir ein Handelsgeschäft in einem Trend ein „Blindes Huhn im Markt“. Es hat Jahre gebraucht, aber wir haben einen Indikator geschaffen, der es ermöglicht diese Märkte bestmöglich auszunutzen.
Bill Williams
Der Alligator ist eine Kombination aus Saldenlinien (Gleitende Durchschnitte), die fraktale Geometrie und nichtlineare Dynamik verwenden.
- Die blaue Linie (Alligator Jaw oder sein Kinn) ist ein gleitender Durchschnitt mit der Periodenlänge, der für die Erstellung der Grafik verwendet wurde (ein geglätteter gleitender Durchschnitt über 13 Perioden (Balken), der um 8 Balken in die Zukunft verschoben wurde);
- Die rote Linie (Alligator Teeth, Zähne) ist ein gleitender Durchschnitt einer signifikanten Periodenlänge, die eine Größenordnung kleiner ist (ein gleitender 8-Perioden-Durchschnittgeglätteter gleitender Durchschnitt mit einer Periodenlänge von 8, um 5 Balken in die Zukunft verschoben);
- Die grüne Linie (Alligator's Lips, Lippen) ist ein gleitender Durchschnitt einer signifikanten Periodenlänge, die noch einmal um eine Größenordnung kleiner ist (ein geglätteter gleitender Durchschnitt mit einer Periodenlänge von 5, um 3 Balken in die Zukunft verschoben);
Die Lippen, Zähne und Kiefer des Alligators veranschaulichen die Interaktion verschiedener Periodenlängen. Da die Markttrends nur in 15-30 Prozent der Zeit erkannt werden können, müssen wir den Trends folgen und dürfen nicht auf Märkten arbeiten, die nur innerhalb bestimmter Preisperioden schwanken.
Wenn die Kiefer, Zähne und Lippen geschlossen oder ineinander verschlungen sind, schläft der Alligator oder ist bereits am Schlafen. Wenn er schläft, wächst sein Hunger - je mehr er also schläft, desto hungriger wird er sein, wenn er aufwacht. Wenn er aufwacht, öffnet er als Erstes den Mund und beginnt zu gähnen. Dann fängt er an, den Geruch von Nahrung wahrzunehmen: Fleisch von einem Stier oder Bären, und er beginnt, danach zu jagen. Nach dem Fressen verliert der Alligator sein Interesse und die Linien ziehen sich zusammen — Zeit Profite mitzunehmen.
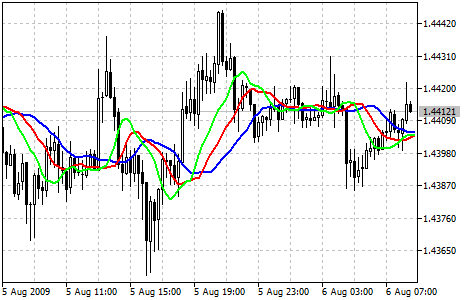
Parameter
Die Funktion iAlligator() wird verwendet, um das Indikator-Handle zu erstellen:
Rückgabe des Handles des Indikators.
int  iAlligator(
   string              symbol,            // symbol name
   ENUM_TIMEFRAMES     period,            // period
   int                 jaw_period,        // period for calculating jaws
   int                 jaw_shift,         // horizontal shift of jaws
   int                 teeth_period,      // period for calculating teeth
   int                 teeth_shift,       // horizontal shift of teeth
   int                 lips_period,       // period for calculating lips
   int                 lips_shift,        // horizontal shift of lips
   ENUM_MA_METHOD      ma_method,         // smoothing type
   ENUM_APPLIED_PRICE  applied_price      // price type or handle
   );
symbol
[in] Der Symbolname des Finanzinstruments, dessen Daten zur Berechnung des Indikators verwendet werden sollen. NULL bedeutet das aktuelle Symbol.
period
[in] Der Zeitrahmen, es ist ein Wert aus der Enumeration ENUM_TIMEFRAMES, 0 bedeutet den aktuellen Zeitrahmen.
jaw_period
[in] Blaue Linie (Alligator's Jaws) Mittelungszeitraum.
jaw_shift
[in] Die blaue Linie verschiebt sich gegenüber dem Preischart.
teeth_period
[in] Rote Linie (Alligator's Teeth) Mittelungszeitraum.
teeth_shift
[in] Verschiebung der roten Linie im Vergleich zum Preischart.
lips_period
[in] Grüne Linie (Alligator's Lips) Mittelungszeitraum.
lips_shift
[in] Verschiebung der grünen Linie im Verhältnis zum Preischart.
ma_method
[in] Mittelungsmethode. Eine aus der Enumeration ENUM_MA_METHOD.
applied_price
[in] Verwendeter Preis. Ein Wert aus der Enumeration ENUM_APPLIED_PRICE oder ein anderes Indikatorhandle.
Gibt das Handle des angegebenen technischen Indikators zurück. Falls fehlgeschlagen, wird INVALID_HANDLE zurückgegeben. Um den Computerspeicher eines nicht mehr verwendeten Indikators freizugeben, verwenden Sie IndicatorRelease(), dem das Indikator-Handle übergeben wird.
Puffer-Indizes: 0 — GATORJAW_LINE, 1 — GATORTEETH_LINE, 2 — GATORLIPS_LINE.
Deklarieren der Eingabe- und der globalen Variablen im EA, um den Indikator zu erstellen:
//+------------------------------------------------------------------+
//|                                        TestWilliamsAlligator.mq5 |
//|                                  Copyright 2023, MetaQuotes Ltd. |
//|                                             https://www.mql5.com |
//+------------------------------------------------------------------+
#property copyright "Copyright 2023, MetaQuotes Ltd."
#property link      "https://www.mql5.com"
#property version   "1.00"
//--- enums
enum ENUM_LINE_STATE
  {
   LINE_STATE_NONE,        // Undefined state
   LINE_STATE_UP,          // Upward
   LINE_STATE_DOWN,        // Downward
   LINE_STATE_TURN_UP,     // Upward reversal
   LINE_STATE_TURN_DOWN,   // Downward reversal
   LINE_STATE_STOP_UP,     // Upward stop
   LINE_STATE_STOP_DOWN,   // Downward stop
   LINE_STATE_ABOVE,       // Above value
   LINE_STATE_UNDER,       // Below value
   LINE_STATE_CROSS_UP,    // Crossing value upwards
   LINE_STATE_CROSS_DOWN,  // Crossing value downwards
   LINE_STATE_TOUCH_BELOW, // Touching value from below
   LINE_STATE_TOUCH_ABOVE, // Touch value from above
   LINE_STATE_EQUALS,      // Equal to value
  };
//--- input parameters
input uint                 InpPeriodJaws  =  13;            /* Jaws Period    */
input int                  InpShiftJaws   =  8;             /* Jaws Shift     */
input uint                 InpPeriodTeeth =  8;             /* Teeth Period   */
input int                  InpShiftTeeth  =  5;             /* Teeth Shift    */
input uint                 InpPeriodLips  =  5;             /* Lips Period    */
input int                  InpShiftLips   =  3;             /* Lips Shift     */
input ENUM_MA_METHOD       InpMethod      =  MODE_SMMA;     /* Smoothed       */
input ENUM_APPLIED_PRICE   InpAppliedPrice=  PRICE_MEDIAN;  /* Applied Price  */
//--- global variables
int      handle=INVALID_HANDLE;  // Indicator handle
int      period_jaws=0;          // Jaws line calculation period
int      period_teeth=0;         // Teeth line calculation period
int      period_lips=0;          // Lips line calculation period
int      ind_digits=0;           // Number of decimal places in the indicator values
string   ind_title;              // Indicator description
Wenn Sie das Dashboard im EA verwenden, deklarieren Sie die globalen Variablen und binden Sie die Datei mit der Klasse des Panels ein:
//+------------------------------------------------------------------+
//|                                        TestWilliamsAlligator.mq5 |
//|                                  Copyright 2023, MetaQuotes Ltd. |
//|                                             https://www.mql5.com |
//+------------------------------------------------------------------+
#property copyright "Copyright 2023, MetaQuotes Ltd."
#property link      "https://www.mql5.com"
#property version   "1.00"
//--- includes
#include <Dashboard\Dashboard.mqh>
//--- enums
enum ENUM_LINE_STATE
  {
   LINE_STATE_NONE,        // Undefined state
   LINE_STATE_UP,          // Upward
   LINE_STATE_DOWN,        // Downward
   LINE_STATE_TURN_UP,     // Upward reversal
   LINE_STATE_TURN_DOWN,   // Downward reversal
   LINE_STATE_STOP_UP,     // Upward stop
   LINE_STATE_STOP_DOWN,   // Downward stop
   LINE_STATE_ABOVE,       // Above value
   LINE_STATE_UNDER,       // Below value
   LINE_STATE_CROSS_UP,    // Crossing value upwards
   LINE_STATE_CROSS_DOWN,  // Crossing value downwards
   LINE_STATE_TOUCH_BELOW, // Touching value from below
   LINE_STATE_TOUCH_ABOVE, // Touch value from above
   LINE_STATE_EQUALS,      // Equal to value
  };
//--- input parameters
input uint                 InpPeriodJaws  =  13;            /* Jaws Period    */
input int                  InpShiftJaws   =  8;             /* Jaws Shift     */
input uint                 InpPeriodTeeth =  8;             /* Teeth Period   */
input int                  InpShiftTeeth  =  5;             /* Teeth Shift    */
input uint                 InpPeriodLips  =  5;             /* Lips Period    */
input int                  InpShiftLips   =  3;             /* Lips Shift     */
input ENUM_MA_METHOD       InpMethod      =  MODE_SMMA;     /* Smoothed       */
input ENUM_APPLIED_PRICE   InpAppliedPrice=  PRICE_MEDIAN;  /* Applied Price  */
//--- global variables
int      handle=INVALID_HANDLE;  // Indicator handle
int      period_jaws=0;          // Jaws line calculation period
int      period_teeth=0;         // Teeth line calculation period
int      period_lips=0;          // Lips line calculation period
int      ind_digits=0;           // Number of decimal places in the indicator values
string   ind_title;              // Indicator description
//--- variables for the panel
int      mouse_bar_index;        // Index of the bar the data is taken from
CDashboard *panel=NULL;          // Pointer to the panel object
Initialisierung
Einstellung der Werte der globalen Variablen für den Indikator und die Erstellung seines Handles:
//+------------------------------------------------------------------+
//| Expert initialization function                                   |
//+------------------------------------------------------------------+
int OnInit()
  {
//--- create timer
   EventSetTimer(60);

//--- Indicator
//--- Set and adjust the calculation period if necessary
   period_jaws=int(InpPeriodJaws<1 ? 13 : InpPeriodJaws);
   period_teeth=int(InpPeriodTeeth<1 ? 8 : InpPeriodTeeth);
   period_lips=int(InpPeriodLips<1 ? 5 : InpPeriodLips);
//--- Set the indicator name and the number of decimal places
   ind_title=StringFormat("Alligator(%lu,%lu,%lu)",period_jaws,period_teeth,period_lips);
   ind_digits=Digits();
//--- Create indicator handle
   ResetLastError();
   handle=iAlligator(Symbol(),PERIOD_CURRENT,period_jaws,InpShiftJaws,period_teeth,InpShiftTeeth,period_lips,InpShiftLips,InpMethod,InpAppliedPrice);
   if(handle==INVALID_HANDLE)
     {
      PrintFormat("%s: Failed to create indicator handle %s. Error %ld",__FUNCTION__,ind_title,GetLastError());
      return INIT_FAILED;
     }

//--- Successful initialization
   return(INIT_SUCCEEDED);
  }
Wenn der EA die Verwendung des Dashboards vorsieht, erstellen wir es hier:
//+------------------------------------------------------------------+
//| Expert initialization function                                   |
//+------------------------------------------------------------------+
int OnInit()
  {
//--- create timer
   EventSetTimer(60);

//--- Indicator
//--- Set and adjust the calculation period if necessary
   period_jaws=int(InpPeriodJaws<1 ? 13 : InpPeriodJaws);
   period_teeth=int(InpPeriodTeeth<1 ? 8 : InpPeriodTeeth);
   period_lips=int(InpPeriodLips<1 ? 5 : InpPeriodLips);
//--- Set the indicator name and the number of decimal places
   ind_title=StringFormat("Alligator(%lu,%lu,%lu)",period_jaws,period_teeth,period_lips);
   ind_digits=Digits();
//--- Create indicator handle
   ResetLastError();
   handle=iAlligator(Symbol(),PERIOD_CURRENT,period_jaws,InpShiftJaws,period_teeth,InpShiftTeeth,period_lips,InpShiftLips,InpMethod,InpAppliedPrice);
   if(handle==INVALID_HANDLE)
     {
      PrintFormat("%s: Failed to create indicator handle %s. Error %ld",__FUNCTION__,ind_title,GetLastError());
      return INIT_FAILED;
     }

//--- Dashboard
//--- Create the panel
   panel=new CDashboard(1,20,20,199,261);
   if(panel==NULL)
     {
      Print("Error. Failed to create panel object");
      return INIT_FAILED;
     }
//--- Set font parameters
   panel.SetFontParams("Calibri",9);
//--- Display the panel with the "Symbol, Timeframe description" header text
   panel.View(Symbol()+", "+StringSubstr(EnumToString(Period()),7));
//--- Create a table with ID 0 to display bar data in it
   panel.CreateNewTable(0);
//--- Draw a table with ID 0 on the panel background
   panel.DrawGrid(0,2,20,6,2,18,97);

//--- Create a table with ID 1 to display indicator data in it
   panel.CreateNewTable(1);
//--- Get the Y2 table coordinate with ID 0 and
//--- set the Y1 coordinate for the table with ID 1
   int y1=panel.TableY2(0)+22;
//--- Draw a table with ID 1 on the panel background
   panel.DrawGrid(1,2,y1,5,2,18,97);

//--- Display tabular data in the journal
   panel.GridPrint(0,2);
   panel.GridPrint(1,2);
//--- Initialize the variable with the index of the mouse cursor bar
   mouse_bar_index=0;
//--- Display the data of the current bar on the panel
   DrawData(mouse_bar_index,TimeCurrent());

//--- Successful initialization
   return(INIT_SUCCEEDED);
  }
Deinitialisierung
Freigabe des Indikator-Handles in OnDeinit() des EAs:
//+------------------------------------------------------------------+
//| Expert deinitialization function                                 |
//+------------------------------------------------------------------+
void OnDeinit(const int reason)
  {
//--- destroy timer
   EventKillTimer();

//--- Release handle of the indicator
   ResetLastError();
   if(!IndicatorRelease(handle))
      PrintFormat("%s: IndicatorRelease failed. Error %ld",__FUNCTION__,GetLastError());
//--- Clear all comments on the chart
   Comment("");
  }
Das erstellte Dashboard-Objekt wird bei der Verwendung des Dashboards entfernt:
//+------------------------------------------------------------------+
//| Expert deinitialization function                                 |
//+------------------------------------------------------------------+
void OnDeinit(const int reason)
  {
//--- destroy timer
   EventKillTimer();

//--- Release handle of the indicator
   ResetLastError();
   if(!IndicatorRelease(handle))
      PrintFormat("%s: IndicatorRelease failed. Error %ld",__FUNCTION__,GetLastError());
//--- Clear all comments on the chart
   Comment("");

//--- If the panel object exists, delete it
   if(panel!=NULL)
      delete panel;
  }
Abrufen von Daten
Im Folgenden werden die allgemeinen Funktionen zum Abrufen von Daten über das Indikator-Handle beschrieben. Die Funktionen wurden in dem Artikel über die Verbindung von Oszillatoren mit EAs beschrieben. Die vorgestellten Funktionen können in nutzerdefinierten Programmen im Prinzip unverändert verwendet werden:
//+------------------------------------------------------------------+
//| Return the indicator data on the specified bar                   |
//+------------------------------------------------------------------+
double IndicatorValue(const int ind_handle,const int index,const int buffer_num)
  {
   double array[1]={0};
   ResetLastError();
   if(CopyBuffer(ind_handle,buffer_num,index,1,array)!=1)
     {
      PrintFormat("%s: CopyBuffer failed. Error %ld",__FUNCTION__,GetLastError());
      return EMPTY_VALUE;
     }
   return array[0];
  }
//+------------------------------------------------------------------+
//| Return the state of the indicator line                           |
//+------------------------------------------------------------------+
ENUM_LINE_STATE LineState(const int ind_handle,const int index,const int buffer_num)
  {
//--- Get the values of the indicator line with the shift (0,1,2) relative to the passed index
   const double value0=IndicatorValue(ind_handle,index,  buffer_num);
   const double value1=IndicatorValue(ind_handle,index+1,buffer_num);
   const double value2=IndicatorValue(ind_handle,index+2,buffer_num);
//--- If at least one of the values could not be obtained, return an undefined value
   if(value0==EMPTY_VALUE || value1==EMPTY_VALUE || value2==EMPTY_VALUE)
      return LINE_STATE_NONE;
//--- Line upward reversal (value2>value1 && value0>value1)
   if(NormalizeDouble(value2-value1,ind_digits)>0 && NormalizeDouble(value0-value1,ind_digits)>0)
      return LINE_STATE_TURN_UP;
//--- Line upward direction (value2<=value1 && value0>value1)
   else if(NormalizeDouble(value2-value1,ind_digits)<=0 && NormalizeDouble(value0-value1,ind_digits)>0)
      return LINE_STATE_UP;
//--- Line upward stop (value2<=value1 && value0==value1)
   else if(NormalizeDouble(value2-value1,ind_digits)<=0 && NormalizeDouble(value0-value1,ind_digits)==0)
      return LINE_STATE_STOP_UP;
//--- Line downward reversal (value2<value1 && value0<value1)
   if(NormalizeDouble(value2-value1,ind_digits)<0 && NormalizeDouble(value0-value1,ind_digits)<0)
      return LINE_STATE_TURN_DOWN;
//--- Line downward direction (value2>=value1 && value0<value1)
   else if(NormalizeDouble(value2-value1,ind_digits)>=0 && NormalizeDouble(value0-value1,ind_digits)<0)
      return LINE_STATE_DOWN;
//--- Line downward stop (value2>=value1 && value0==value1)
   else if(NormalizeDouble(value2-value1,ind_digits)>=0 && NormalizeDouble(value0-value1,ind_digits)==0)
      return LINE_STATE_STOP_DOWN;
//--- Undefined state
   return LINE_STATE_NONE;
  }
//+------------------------------------------------------------------+
//| Return the state of the line relative to the specified level     |
//+------------------------------------------------------------------+
ENUM_LINE_STATE LineStateRelative(const int ind_handle,const int index,const int buffer_num,const double level0,const double level1=EMPTY_VALUE)
  {
//--- Get the values of the indicator line with the shift (0,1) relative to the passed index
   const double value0=IndicatorValue(ind_handle,index,  buffer_num);
   const double value1=IndicatorValue(ind_handle,index+1,buffer_num);
//--- If at least one of the values could not be obtained, return an undefined value
   if(value0==EMPTY_VALUE || value1==EMPTY_VALUE)
      return LINE_STATE_NONE;
//--- Define the second level to compare
   double level=(level1==EMPTY_VALUE ? level0 : level1);
//--- The line is below the level (value1<level && value0<level0)
   if(NormalizeDouble(value1-level,ind_digits)<0 && NormalizeDouble(value0-level0,ind_digits)<0)
      return LINE_STATE_UNDER;
//--- The line is above the level (value1>level && value0>level0)
   if(NormalizeDouble(value1-level,ind_digits)>0 && NormalizeDouble(value0-level0,ind_digits)>0)
      return LINE_STATE_ABOVE;
//--- The line crossed the level upwards (value1<=level && value0>level0)
   if(NormalizeDouble(value1-level,ind_digits)<=0 && NormalizeDouble(value0-level0,ind_digits)>0)
      return LINE_STATE_CROSS_UP;
//--- The line crossed the level downwards (value1>=level && value0<level0)
   if(NormalizeDouble(value1-level,ind_digits)>=0 && NormalizeDouble(value0-level0,ind_digits)<0)
      return LINE_STATE_CROSS_DOWN;
//--- The line touched the level from below (value1<level0 && value0==level0)
   if(NormalizeDouble(value1-level,ind_digits)<0 && NormalizeDouble(value0-level0,ind_digits)==0)
      return LINE_STATE_TOUCH_BELOW;
//--- The line touched the level from above (value1>level0 && value0==level0)
   if(NormalizeDouble(value1-level,ind_digits)>0 && NormalizeDouble(value0-level0,ind_digits)==0)
      return LINE_STATE_TOUCH_BELOW;
//--- Line is equal to the level value (value1==level0 && value0==level0)
   if(NormalizeDouble(value1-level,ind_digits)==0 && NormalizeDouble(value0-level0,ind_digits)==0)
      return LINE_STATE_EQUALS;
//--- Undefined state
   return LINE_STATE_NONE;
  }
//+------------------------------------------------------------------+
//| Return the indicator line state description                      |
//+------------------------------------------------------------------+
string LineStateDescription(const ENUM_LINE_STATE state)
  {
   switch(state)
     {
      case LINE_STATE_UP         :  return "Up";
      case LINE_STATE_STOP_UP    :  return "Stop Up";
      case LINE_STATE_TURN_UP    :  return "Turn Up";
      case LINE_STATE_DOWN       :  return "Down";
      case LINE_STATE_STOP_DOWN  :  return "Stop Down";
      case LINE_STATE_TURN_DOWN  :  return "Turn Down";
      case LINE_STATE_ABOVE      :  return "Above level";
      case LINE_STATE_UNDER      :  return "Under level";
      case LINE_STATE_CROSS_UP   :  return "Crossing Up";
      case LINE_STATE_CROSS_DOWN :  return "Crossing Down";
      case LINE_STATE_TOUCH_BELOW:  return "Touch from Below";
      case LINE_STATE_TOUCH_ABOVE:  return "Touch from Above";
      case LINE_STATE_EQUALS     :  return "Equals";
      default                    :  return "Unknown";
     }
  }
Wenn wir das Dashboard verwenden, werden die Daten mit Hilfe der Funktion auf dem Bedienfeld angezeigt:
//+------------------------------------------------------------------+
//| Display data from the specified timeseries index to the panel    |
//+------------------------------------------------------------------+
void DrawData(const int index,const datetime time)
  {
//--- Declare the variables to receive data in them
   MqlTick  tick={0};
   MqlRates rates[1];

//--- Exit if unable to get the current prices
   if(!SymbolInfoTick(Symbol(),tick))
      return;
//--- Exit if unable to get the bar data by the specified index
   if(CopyRates(Symbol(),PERIOD_CURRENT,index,1,rates)!=1)
      return;

//--- Set font parameters for bar and indicator data headers
   int  size=0;
   uint flags=0;
   uint angle=0;
   string name=panel.FontParams(size,flags,angle);
   panel.SetFontParams(name,9,FW_BOLD);
   panel.DrawText("Bar data ["+(string)index+"]",3,panel.TableY1(0)-16,clrMaroon,panel.Width()-6);
   panel.DrawText("Indicator data ["+(string)index+"]",3,panel.TableY1(1)-16,clrGreen,panel.Width()-6);
//--- Set font parameters for bar and indicator data
   panel.SetFontParams(name,9);

//--- Display the data of the specified bar in table 0 on the panel
   panel.DrawText("Date",  panel.CellX(0,0,0)+2, panel.CellY(0,0,0)+2); panel.DrawText(TimeToString(  rates[0].time,TIME_DATE),     panel.CellX(0,0,1)+2, panel.CellY(0,0,1)+2,clrNONE,90);
   panel.DrawText("Time",  panel.CellX(0,1,0)+2, panel.CellY(0,1,0)+2); panel.DrawText(TimeToString(  rates[0].time,TIME_MINUTES),  panel.CellX(0,1,1)+2, panel.CellY(0,1,1)+2,clrNONE,90);
   panel.DrawText("Open",  panel.CellX(0,2,0)+2, panel.CellY(0,2,0)+2); panel.DrawText(DoubleToString(rates[0].open,Digits()),      panel.CellX(0,2,1)+2, panel.CellY(0,2,1)+2,clrNONE,90);
   panel.DrawText("High",  panel.CellX(0,3,0)+2, panel.CellY(0,3,0)+2); panel.DrawText(DoubleToString(rates[0].high,Digits()),      panel.CellX(0,3,1)+2, panel.CellY(0,3,1)+2,clrNONE,90);
   panel.DrawText("Low",   panel.CellX(0,4,0)+2, panel.CellY(0,4,0)+2); panel.DrawText(DoubleToString(rates[0].low,Digits()),       panel.CellX(0,4,1)+2, panel.CellY(0,4,1)+2,clrNONE,90);
   panel.DrawText("Close", panel.CellX(0,5,0)+2, panel.CellY(0,5,0)+2); panel.DrawText(DoubleToString(rates[0].close,Digits()),     panel.CellX(0,5,1)+2, panel.CellY(0,5,1)+2,clrNONE,90);

//--- Get the indicator lines data
   double value_jaws=IndicatorValue(handle,index,GATORJAW_LINE);
   double value_teeth=IndicatorValue(handle,index,GATORTEETH_LINE);
   double value_lips=IndicatorValue(handle,index,GATORLIPS_LINE);

//--- Display the Jaws line data from the specified bar on the panel in table 1
   string jaws_str=StringFormat("Jaws(%lu)",period_jaws);
   panel.DrawText(jaws_str, panel.CellX(1,0,0)+2, panel.CellY(1,0,0)+2);
   string value_str=(value_jaws!=EMPTY_VALUE ? DoubleToString(value_jaws,ind_digits) : "");
   panel.DrawText(value_str,panel.CellX(1,0,1)+2,panel.CellY(1,0,1)+2,clrNONE,90);
//--- Display the Teeth line data from the specified bar on the panel in table 1
   string teeth_str=StringFormat("Teeth(%lu)",period_teeth);
   panel.DrawText(teeth_str, panel.CellX(1,1,0)+2, panel.CellY(1,1,0)+2);
   value_str=(value_teeth!=EMPTY_VALUE ? DoubleToString(value_teeth,ind_digits) : "");
   panel.DrawText(value_str,panel.CellX(1,1,1)+2,panel.CellY(1,1,1)+2,clrNONE,90);
//--- Display the Lips line data from the specified bar on the panel in table 1
   string lips_str=StringFormat("Lips(%lu)",period_jaws);
   panel.DrawText(lips_str, panel.CellX(1,2,0)+2, panel.CellY(1,2,0)+2);
   value_str=(value_lips!=EMPTY_VALUE ? DoubleToString(value_lips,ind_digits) : "");
   panel.DrawText(value_str,panel.CellX(1,2,1)+2,panel.CellY(1,2,1)+2,clrNONE,90);

//--- Display a description of the Teeth line state relative to the Jaws line
   panel.DrawText("Teeth vs Jaws", panel.CellX(1,3,0)+2, panel.CellY(1,3,0)+2);
   ENUM_LINE_STATE state_tj=LineStateRelative(handle,index,1,value_jaws,IndicatorValue(handle,index+1,GATORJAW_LINE));
   string state_tj_str=
     (
      state_tj==LINE_STATE_ABOVE        ?  "Teeth > Jaws"  :
      state_tj==LINE_STATE_UNDER        ?  "Teeth < Jaws"  :
      state_tj==LINE_STATE_TOUCH_ABOVE  ||
      state_tj==LINE_STATE_TOUCH_BELOW  ?  "Touch"     :
      LineStateDescription(state_tj)
     );
//--- The label color changes depending on the value of the line relative to the level
   color clr=(state_tj==LINE_STATE_CROSS_UP || state_tj==LINE_STATE_ABOVE  ? clrBlue : state_tj==LINE_STATE_CROSS_DOWN || state_tj==LINE_STATE_UNDER ? clrRed : clrNONE);
   panel.DrawText(state_tj_str,panel.CellX(1,3,1)+2,panel.CellY(1,3,1)+2,clr,90);

//--- Display a description of the Lips line state relative to the Teeth line
   panel.DrawText("Lips vs Teeth", panel.CellX(1,4,0)+2, panel.CellY(1,4,0)+2);
   ENUM_LINE_STATE state_lt=LineStateRelative(handle,index,2,value_teeth,IndicatorValue(handle,index+1,GATORTEETH_LINE));
   string state_lt_str=
     (
      state_lt==LINE_STATE_ABOVE        ?  "Lips > Teeth"  :
      state_lt==LINE_STATE_UNDER        ?  "Lips < Teeth"  :
      state_lt==LINE_STATE_TOUCH_ABOVE  ||
      state_lt==LINE_STATE_TOUCH_BELOW  ?  "Touch"     :
      LineStateDescription(state_lt)
     );
//--- The label color changes depending on the value of the line relative to the level
   clr=(state_lt==LINE_STATE_CROSS_UP || state_lt==LINE_STATE_ABOVE  ? clrBlue : state_lt==LINE_STATE_CROSS_DOWN || state_lt==LINE_STATE_UNDER ? clrRed : clrNONE);
   panel.DrawText(state_lt_str,panel.CellX(1,4,1)+2,panel.CellY(1,4,1)+2,clr,90);

//--- Redraw the chart to immediately display all changes on the panel
   ChartRedraw(ChartID());
  }
Zusätzlich zu den Werten der Indikatorlinien auf den Balken, die sich unter dem Cursor befinden, zeigt das Panel die Zustände der Verhältnisse der Linien Zähne - Kiefer und Lippen - Zähne an. Ihre Beziehungen werden im Text angezeigt, und ihre relative Position wird durch die Farbe des angezeigten Textes angegeben.
Außerdem wird bei der Verwendung des Dashboards das Handle für die Panel-Ereignisse in OnChartEvent() EA-Ereignishandler aufgerufen, und die Ereignisse für den Erhalt des Balkenindex unter dem Cursor werden behandelt:
//+------------------------------------------------------------------+
//| ChartEvent function                                              |
//+------------------------------------------------------------------+
void OnChartEvent(const int id,
                  const long &lparam,
                  const double &dparam,
                  const string &sparam)
  {
//--- Handling the panel
//--- Call the panel event handler
   panel.OnChartEvent(id,lparam,dparam,sparam);

//--- If the cursor moves or a click is made on the chart
   if(id==CHARTEVENT_MOUSE_MOVE || id==CHARTEVENT_CLICK)
     {
      //--- Declare the variables to record time and price coordinates in them
      datetime time=0;
      double price=0;
      int wnd=0;
      //--- If the cursor coordinates are converted to date and time
      if(ChartXYToTimePrice(ChartID(),(int)lparam,(int)dparam,wnd,time,price))
        {
         //--- write the bar index where the cursor is located to a global variable
         mouse_bar_index=iBarShift(Symbol(),PERIOD_CURRENT,time);
         //--- Display the bar data under the cursor on the panel
         DrawData(mouse_bar_index,time);
        }
     }

//--- If we received a custom event, display the appropriate message in the journal
   if(id>CHARTEVENT_CUSTOM)
     {
      //--- Here we can implement handling a click on the close button on the panel
      PrintFormat("%s: Event id=%ld, object id (lparam): %lu, event message (sparam): %s",__FUNCTION__,id,lparam,sparam);
     }
  }
Nachdem wir den EA kompiliert und auf dem Chart gestartet haben, können wir den Status des Indikatorwertes und der Linie auf dem Panel überwachen:
Sie können den Test EA TestWilliamsAlligator.mq5 in den an den Artikel angehängten Dateien ansehen.
Awesome Oszillator
Der technische Indikator Bill Williams' Awesome Oscillator (AO) von Williams ist ein einfacher gleitender 34-Perioden-Durchschnitt, der durch die mittleren Punkte der Balken (H+L)/2 gezeichnet wird und vom einfachen gleitenden 5-Perioden-Durchschnitt subtrahiert wird, der durch die mittleren Punkte der Balken (H+L)/2 gebildet wird. Er zeigt uns ganz klar die treibenden Marktkräfte zum gegenwärtigen Zeitpunkt.
Gültige Kaufsignale
- Das Untertassensignal entsteht, wenn das Histogramm seine Richtung von abwärts nach aufwärts umkehrt. Die zweite Spalte ist niedriger als der erste und ist rot gefärbt. Die dritte Spalte ist höher als die zweite und ist grün gefärbt.
- Für ein Untertassensignal muss das Histogramm zumindest drei Balken haben.
Beachten Sie, dass alle Balken des Awesome Oscillator über der Null-Linie für das Untertassensignal liegen sollten.
„Nulllinie kreuzen“, das ist ein Kaufsignal, wenn das Histogramm aus dem Negativen ins Positive wechselt. Bitte bedenken Sie dies:
- für dieses Signal sind nur zwei Spalten notwendig;
- Der erste Balken muss unter Null sein, der zweite muss die Nulllinie überqueren (Übergang von negativen zu positiven Werten);
- Gleichzeitiges Entstehen von Kauf- und Verkaufssignalen ist unmöglich.
„Twin Peaks“ (Doppelspitzen) ist das einzige Kaufsignal, das erzeugt werden kann, wenn die Histogrammwerte unter Null liegen. Denken Sie an das Folgende:
- Das Signal entsteht, wenn eine Spitze unter der Nulllinie (tiefstes Tief) liegt, gefolgt von einer weiteren, nach unten zeigenden Spitze, die etwas höher als der vorhergehende nach unten gerichtete Spitze ist (ein negativer Wert, der daher näher zur Nulllinie ist);
- Zwischen beiden Spitzen unter Null muss es weitere Bars kleiner als Null geben. Wenn das Kerzen-Chart die Null-Linie kreuzt zwischen den Spitzen, ist das Kauf-Signal nicht aktiv. Es wird jedoch ein Kaufsignal erzeugt — Nulllinie gekreuzt;
- jede neue Spitze des Kerzen-Charts muss größer sein als die vorherige;
- wenn eine zusätzliche Spitze geformt wird, näher an der Null-Linie, diese jedoch noch nicht überschritten wurde, wird ein zusätzliches Kauf-Signal generiert.
Verkaufssignale
Die Verkaufssignale des Awesome Oszillators sind vergleichbar mit den Kaufsignalen. Das Quellensignal ist umgekehrt und liegt unter Null. Das „Kreuzen der Nulllinie“ geschieht von oben nach unten — die erste Bar ist über Null, die zweite darunter. Die zwei Spitze ist höher als die Null-Linie und wird auch umgekehrt.
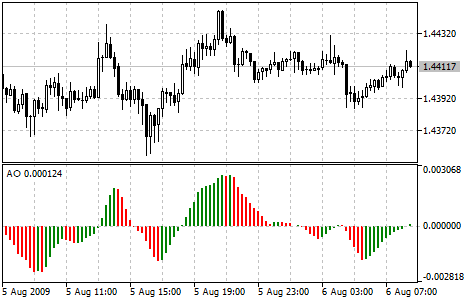
Parameter
Die Funktion iAO() wird zur Erstellung des Indikator-Handles verwendet:
Return Awesome Oscillator Indikator Handle. Es gibt nur einen Puffer.
int  iAO(
   string           symbol,     // symbol name
   ENUM_TIMEFRAMES  period      // period
   );
symbol
[in] Der Symbolname des Finanzinstruments, dessen Daten zur Berechnung des Indikators verwendet werden sollen. NULL bedeutet das aktuelle Symbol.
period
[in] Der Zeitrahmen, es ist ein Wert aus der Enumeration ENUM_TIMEFRAMES, 0 bedeutet den aktuellen Zeitrahmen.
Gibt das Handle des angegebenen technischen Indikators zurück. Falls fehlgeschlagen, wird INVALID_HANDLE zurückgegeben. Um den Computerspeicher eines nicht mehr verwendeten Indikators freizugeben, verwenden Sie IndicatorRelease(), dem das Indikator-Handle übergeben wird.
Deklarieren der Eingabe- und der globalen Variablen im EA, um den Indikator zu erstellen:
//+------------------------------------------------------------------+
//|                                               TestWilliamsAO.mq5 |
//|                                  Copyright 2023, MetaQuotes Ltd. |
//|                                             https://www.mql5.com |
//+------------------------------------------------------------------+
#property copyright "Copyright 2023, MetaQuotes Ltd."
#property link      "https://www.mql5.com"
#property version   "1.00"
//--- enums
enum ENUM_LINE_STATE
  {
   LINE_STATE_NONE,        // Undefined state
   LINE_STATE_UP,          // Upward
   LINE_STATE_DOWN,        // Downward
   LINE_STATE_TURN_UP,     // Upward reversal
   LINE_STATE_TURN_DOWN,   // Downward reversal
   LINE_STATE_STOP_UP,     // Upward stop
   LINE_STATE_STOP_DOWN,   // Downward stop
   LINE_STATE_ABOVE,       // Above value
   LINE_STATE_UNDER,       // Below value
   LINE_STATE_CROSS_UP,    // Crossing value upwards
   LINE_STATE_CROSS_DOWN,  // Crossing value downwards
   LINE_STATE_TOUCH_BELOW, // Touching value from below
   LINE_STATE_TOUCH_ABOVE, // Touch value from above
   LINE_STATE_EQUALS,      // Equal to value
  };
//--- global variables
int      handle=INVALID_HANDLE;  // Indicator handle
int      ind_digits=0;           // Number of decimal places in the indicator values
string   ind_title;              // Indicator description
Wenn Sie das Dashboard im EA verwenden, deklarieren Sie die globalen Variablen und binden Sie die Datei mit der Klasse des Panels ein:
//+------------------------------------------------------------------+
//|                                               TestWilliamsAO.mq5 |
//|                                  Copyright 2023, MetaQuotes Ltd. |
//|                                             https://www.mql5.com |
//+------------------------------------------------------------------+
#property copyright "Copyright 2023, MetaQuotes Ltd."
#property link      "https://www.mql5.com"
#property version   "1.00"
//--- includes
#include <Dashboard\Dashboard.mqh>
//--- enums
enum ENUM_LINE_STATE
  {
   LINE_STATE_NONE,        // Undefined state
   LINE_STATE_UP,          // Upward
   LINE_STATE_DOWN,        // Downward
   LINE_STATE_TURN_UP,     // Upward reversal
   LINE_STATE_TURN_DOWN,   // Downward reversal
   LINE_STATE_STOP_UP,     // Upward stop
   LINE_STATE_STOP_DOWN,   // Downward stop
   LINE_STATE_ABOVE,       // Above value
   LINE_STATE_UNDER,       // Below value
   LINE_STATE_CROSS_UP,    // Crossing value upwards
   LINE_STATE_CROSS_DOWN,  // Crossing value downwards
   LINE_STATE_TOUCH_BELOW, // Touching value from below
   LINE_STATE_TOUCH_ABOVE, // Touch value from above
   LINE_STATE_EQUALS,      // Equal to value
  };
//--- global variables
int      handle=INVALID_HANDLE;  // Indicator handle
int      ind_digits=0;           // Number of decimal places in the indicator values
string   ind_title;              // Indicator description
//--- variables for the panel
int      mouse_bar_index;        // Index of the bar the data is taken from
CDashboard *panel=NULL;          // Pointer to the panel object
Initialisierung
Einstellung der Werte der globalen Variablen für den Indikator und die Erstellung seines Handles:
//+------------------------------------------------------------------+
//| Expert initialization function                                   |
//+------------------------------------------------------------------+
int OnInit()
  {
//--- create timer
   EventSetTimer(60);

//--- Indicator
//--- Set the indicator name and the number of decimal places
   ind_title="AO";
   ind_digits=Digits()+1;
//--- Create indicator handle
   ResetLastError();
   handle=iAO(Symbol(),PERIOD_CURRENT);
   if(handle==INVALID_HANDLE)
     {
      PrintFormat("%s: Failed to create indicator handle %s. Error %ld",__FUNCTION__,ind_title,GetLastError());
      return INIT_FAILED;
     }

//--- Successful initialization
   return(INIT_SUCCEEDED);
  }
Wenn der EA die Verwendung des Dashboards vorsieht, erstellen wir es hier:
//+------------------------------------------------------------------+
//| Expert initialization function                                   |
//+------------------------------------------------------------------+
int OnInit()
  {
//--- create timer
   EventSetTimer(60);

//--- Indicator
//--- Set the indicator name and the number of decimal places
   ind_title="AO";
   ind_digits=Digits()+1;
//--- Create indicator handle
   ResetLastError();
   handle=iAO(Symbol(),PERIOD_CURRENT);
   if(handle==INVALID_HANDLE)
     {
      PrintFormat("%s: Failed to create indicator handle %s. Error %ld",__FUNCTION__,ind_title,GetLastError());
      return INIT_FAILED;
     }

//--- Dashboard
//--- Create the panel
   panel=new CDashboard(1,20,20,199,225);
   if(panel==NULL)
     {
      Print("Error. Failed to create panel object");
      return INIT_FAILED;
     }
//--- Set font parameters
   panel.SetFontParams("Calibri",9);
//--- Display the panel with the "Symbol, Timeframe description" header text
   panel.View(Symbol()+", "+StringSubstr(EnumToString(Period()),7));
//--- Create a table with ID 0 to display bar data in it
   panel.CreateNewTable(0);
//--- Draw a table with ID 0 on the panel background
   panel.DrawGrid(0,2,20,6,2,18,97);

//--- Create a table with ID 1 to display indicator data in it
   panel.CreateNewTable(1);
//--- Get the Y2 table coordinate with ID 0 and
//--- set the Y1 coordinate for the table with ID 1
   int y1=panel.TableY2(0)+22;
//--- Draw a table with ID 1 on the panel background
   panel.DrawGrid(1,2,y1,3,2,18,97);

//--- Display tabular data in the journal
   panel.GridPrint(0,2);
   panel.GridPrint(1,2);
//--- Initialize the variable with the index of the mouse cursor bar
   mouse_bar_index=0;
//--- Display the data of the current bar on the panel
   DrawData(mouse_bar_index,TimeCurrent());

//--- Successful initialization
   return(INIT_SUCCEEDED);
  }
Deinitialisierung
Freigabe des Indikator-Handles in OnDeinit() des EAs:
//+------------------------------------------------------------------+
//| Expert deinitialization function                                 |
//+------------------------------------------------------------------+
void OnDeinit(const int reason)
  {
//--- destroy timer
   EventKillTimer();

//--- Release handle of the indicator
   ResetLastError();
   if(!IndicatorRelease(handle))
      PrintFormat("%s: IndicatorRelease failed. Error %ld",__FUNCTION__,GetLastError());
//--- Clear all comments on the chart
   Comment("");
  }
Das erstellte Dashboard-Objekt wird bei der Verwendung des Dashboards entfernt:
//+------------------------------------------------------------------+
//| Expert deinitialization function                                 |
//+------------------------------------------------------------------+
void OnDeinit(const int reason)
  {
//--- destroy timer
   EventKillTimer();

//--- Release handle of the indicator
   ResetLastError();
   if(!IndicatorRelease(handle))
      PrintFormat("%s: IndicatorRelease failed. Error %ld",__FUNCTION__,GetLastError());
//--- Clear all comments on the chart
   Comment("");

//--- If the panel object exists, delete it
   if(panel!=NULL)
      delete panel;
  }
Abrufen von Daten
Im Folgenden werden die allgemeinen Funktionen zum Abrufen von Daten über das Indikator-Handle beschrieben. Die Funktionen wurden in dem Artikel über die Verbindung von Oszillatoren mit EAs beschrieben. Die vorgestellten Funktionen können in nutzerdefinierten Programmen im Prinzip unverändert verwendet werden:
//+------------------------------------------------------------------+
//| Return the indicator data on the specified bar                   |
//+------------------------------------------------------------------+
double IndicatorValue(const int ind_handle,const int index,const int buffer_num)
  {
   double array[1]={0};
   ResetLastError();
   if(CopyBuffer(ind_handle,buffer_num,index,1,array)!=1)
     {
      PrintFormat("%s: CopyBuffer failed. Error %ld",__FUNCTION__,GetLastError());
      return EMPTY_VALUE;
     }
   return array[0];
  }
//+------------------------------------------------------------------+
//| Return the state of the indicator line                           |
//+------------------------------------------------------------------+
ENUM_LINE_STATE LineState(const int ind_handle,const int index,const int buffer_num)
  {
//--- Get the values of the indicator line with the shift (0,1,2) relative to the passed index
   const double value0=IndicatorValue(ind_handle,index,  buffer_num);
   const double value1=IndicatorValue(ind_handle,index+1,buffer_num);
   const double value2=IndicatorValue(ind_handle,index+2,buffer_num);
//--- If at least one of the values could not be obtained, return an undefined value
   if(value0==EMPTY_VALUE || value1==EMPTY_VALUE || value2==EMPTY_VALUE)
      return LINE_STATE_NONE;
//--- Line upward reversal (value2>value1 && value0>value1)
   if(NormalizeDouble(value2-value1,ind_digits)>0 && NormalizeDouble(value0-value1,ind_digits)>0)
      return LINE_STATE_TURN_UP;
//--- Line upward direction (value2<=value1 && value0>value1)
   else if(NormalizeDouble(value2-value1,ind_digits)<=0 && NormalizeDouble(value0-value1,ind_digits)>0)
      return LINE_STATE_UP;
//--- Line upward stop (value2<=value1 && value0==value1)
   else if(NormalizeDouble(value2-value1,ind_digits)<=0 && NormalizeDouble(value0-value1,ind_digits)==0)
      return LINE_STATE_STOP_UP;
//--- Line downward reversal (value2<value1 && value0<value1)
   if(NormalizeDouble(value2-value1,ind_digits)<0 && NormalizeDouble(value0-value1,ind_digits)<0)
      return LINE_STATE_TURN_DOWN;
//--- Line downward direction (value2>=value1 && value0<value1)
   else if(NormalizeDouble(value2-value1,ind_digits)>=0 && NormalizeDouble(value0-value1,ind_digits)<0)
      return LINE_STATE_DOWN;
//--- Line downward stop (value2>=value1 && value0==value1)
   else if(NormalizeDouble(value2-value1,ind_digits)>=0 && NormalizeDouble(value0-value1,ind_digits)==0)
      return LINE_STATE_STOP_DOWN;
//--- Undefined state
   return LINE_STATE_NONE;
  }
//+------------------------------------------------------------------+
//| Return the state of the line relative to the specified level     |
//+------------------------------------------------------------------+
ENUM_LINE_STATE LineStateRelative(const int ind_handle,const int index,const int buffer_num,const double level0,const double level1=EMPTY_VALUE)
  {
//--- Get the values of the indicator line with the shift (0,1) relative to the passed index
   const double value0=IndicatorValue(ind_handle,index,  buffer_num);
   const double value1=IndicatorValue(ind_handle,index+1,buffer_num);
//--- If at least one of the values could not be obtained, return an undefined value
   if(value0==EMPTY_VALUE || value1==EMPTY_VALUE)
      return LINE_STATE_NONE;
//--- Define the second level to compare
   double level=(level1==EMPTY_VALUE ? level0 : level1);
//--- The line is below the level (value1<level && value0<level0)
   if(NormalizeDouble(value1-level,ind_digits)<0 && NormalizeDouble(value0-level0,ind_digits)<0)
      return LINE_STATE_UNDER;
//--- The line is above the level (value1>level && value0>level0)
   if(NormalizeDouble(value1-level,ind_digits)>0 && NormalizeDouble(value0-level0,ind_digits)>0)
      return LINE_STATE_ABOVE;
//--- The line crossed the level upwards (value1<=level && value0>level0)
   if(NormalizeDouble(value1-level,ind_digits)<=0 && NormalizeDouble(value0-level0,ind_digits)>0)
      return LINE_STATE_CROSS_UP;
//--- The line crossed the level downwards (value1>=level && value0<level0)
   if(NormalizeDouble(value1-level,ind_digits)>=0 && NormalizeDouble(value0-level0,ind_digits)<0)
      return LINE_STATE_CROSS_DOWN;
//--- The line touched the level from below (value1<level0 && value0==level0)
   if(NormalizeDouble(value1-level,ind_digits)<0 && NormalizeDouble(value0-level0,ind_digits)==0)
      return LINE_STATE_TOUCH_BELOW;
//--- The line touched the level from above (value1>level0 && value0==level0)
   if(NormalizeDouble(value1-level,ind_digits)>0 && NormalizeDouble(value0-level0,ind_digits)==0)
      return LINE_STATE_TOUCH_BELOW;
//--- Line is equal to the level value (value1==level0 && value0==level0)
   if(NormalizeDouble(value1-level,ind_digits)==0 && NormalizeDouble(value0-level0,ind_digits)==0)
      return LINE_STATE_EQUALS;
//--- Undefined state
   return LINE_STATE_NONE;
  }
//+------------------------------------------------------------------+
//| Return the indicator line state description                      |
//+------------------------------------------------------------------+
string LineStateDescription(const ENUM_LINE_STATE state)
  {
   switch(state)
     {
      case LINE_STATE_UP         :  return "Up";
      case LINE_STATE_STOP_UP    :  return "Stop Up";
      case LINE_STATE_TURN_UP    :  return "Turn Up";
      case LINE_STATE_DOWN       :  return "Down";
      case LINE_STATE_STOP_DOWN  :  return "Stop Down";
      case LINE_STATE_TURN_DOWN  :  return "Turn Down";
      case LINE_STATE_ABOVE      :  return "Above level";
      case LINE_STATE_UNDER      :  return "Under level";
      case LINE_STATE_CROSS_UP   :  return "Crossing Up";
      case LINE_STATE_CROSS_DOWN :  return "Crossing Down";
      case LINE_STATE_TOUCH_BELOW:  return "Touch from Below";
      case LINE_STATE_TOUCH_ABOVE:  return "Touch from Above";
      case LINE_STATE_EQUALS     :  return "Equals";
      default                    :  return "Unknown";
     }
  }
Wenn wir das Dashboard verwenden, werden die Daten mit Hilfe der Funktion auf dem Bedienfeld angezeigt:
//+------------------------------------------------------------------+
//| Display data from the specified timeseries index to the panel    |
//+------------------------------------------------------------------+
void DrawData(const int index,const datetime time)
  {
//--- Declare the variables to receive data in them
   MqlTick  tick={0};
   MqlRates rates[1];

//--- Exit if unable to get the current prices
   if(!SymbolInfoTick(Symbol(),tick))
      return;
//--- Exit if unable to get the bar data by the specified index
   if(CopyRates(Symbol(),PERIOD_CURRENT,index,1,rates)!=1)
      return;

//--- Set font parameters for bar and indicator data headers
   int  size=0;
   uint flags=0;
   uint angle=0;
   string name=panel.FontParams(size,flags,angle);
   panel.SetFontParams(name,9,FW_BOLD);
   panel.DrawText("Bar data ["+(string)index+"]",3,panel.TableY1(0)-16,clrMaroon,panel.Width()-6);
   panel.DrawText("Indicator data ["+(string)index+"]",3,panel.TableY1(1)-16,clrGreen,panel.Width()-6);
//--- Set font parameters for bar and indicator data
   panel.SetFontParams(name,9);

//--- Display the data of the specified bar in table 0 on the panel
   panel.DrawText("Date",  panel.CellX(0,0,0)+2, panel.CellY(0,0,0)+2); panel.DrawText(TimeToString(  rates[0].time,TIME_DATE),     panel.CellX(0,0,1)+2, panel.CellY(0,0,1)+2,clrNONE,90);
   panel.DrawText("Time",  panel.CellX(0,1,0)+2, panel.CellY(0,1,0)+2); panel.DrawText(TimeToString(  rates[0].time,TIME_MINUTES),  panel.CellX(0,1,1)+2, panel.CellY(0,1,1)+2,clrNONE,90);
   panel.DrawText("Open",  panel.CellX(0,2,0)+2, panel.CellY(0,2,0)+2); panel.DrawText(DoubleToString(rates[0].open,Digits()),      panel.CellX(0,2,1)+2, panel.CellY(0,2,1)+2,clrNONE,90);
   panel.DrawText("High",  panel.CellX(0,3,0)+2, panel.CellY(0,3,0)+2); panel.DrawText(DoubleToString(rates[0].high,Digits()),      panel.CellX(0,3,1)+2, panel.CellY(0,3,1)+2,clrNONE,90);
   panel.DrawText("Low",   panel.CellX(0,4,0)+2, panel.CellY(0,4,0)+2); panel.DrawText(DoubleToString(rates[0].low,Digits()),       panel.CellX(0,4,1)+2, panel.CellY(0,4,1)+2,clrNONE,90);
   panel.DrawText("Close", panel.CellX(0,5,0)+2, panel.CellY(0,5,0)+2); panel.DrawText(DoubleToString(rates[0].close,Digits()),     panel.CellX(0,5,1)+2, panel.CellY(0,5,1)+2,clrNONE,90);

//--- Display the indicator data from the specified bar on the panel in table 1
   panel.DrawText(ind_title, panel.CellX(1,0,0)+2, panel.CellY(1,0,0)+2);
   double value0=IndicatorValue(handle,index,  0);
   double value1=IndicatorValue(handle,index+1,0);
   string value_str=(value0!=EMPTY_VALUE ? DoubleToString(value0,ind_digits) : "");
   color clr=(value0>value1 ? clrGreen : value0<value1 ? clrRed : clrNONE);
   panel.DrawText(value_str,panel.CellX(1,0,1)+2,panel.CellY(1,0,1)+2,clrNONE,90);

//--- Display a description of the indicator line state
   panel.DrawText("Line state", panel.CellX(1,1,0)+2, panel.CellY(1,1,0)+2);
   ENUM_LINE_STATE state=LineState(handle,index,0);
   panel.DrawText(LineStateDescription(state),panel.CellX(1,1,1)+2,panel.CellY(1,1,1)+2,clr,90);

//--- Display a description of the indicator line state relative to zero
   panel.DrawText("AO vs Zero", panel.CellX(1,2,0)+2, panel.CellY(1,2,0)+2);
   ENUM_LINE_STATE state_zero=LineStateRelative(handle,index,0,0);
   string state_zero_str=
     (
      state_zero==LINE_STATE_ABOVE        ?  "AO > 0"  :
      state_zero==LINE_STATE_UNDER        ?  "AO < 0"  :
      state_zero==LINE_STATE_TOUCH_ABOVE  ||
      state_zero==LINE_STATE_TOUCH_BELOW  ?  "Touch"     :
      LineStateDescription(state_zero)
     );
//--- The label color changes depending on the value of the line relative to the level
   clr=(state_zero==LINE_STATE_CROSS_UP ? clrGreen : state_zero==LINE_STATE_CROSS_DOWN ? clrRed : clrNONE);
   panel.DrawText(state_zero_str,panel.CellX(1,2,1)+2,panel.CellY(1,2,1)+2,clr,90);

//--- Redraw the chart to immediately display all changes on the panel
   ChartRedraw(ChartID());
  }
Zusätzlich zur Beschreibung des Zustands der Indikatorlinie, die die Farbe der unter dem Cursor befindlichen Histogrammspalte hat, zeigt das Panel den Zustand ihrer Position relativ zum Nullpunkt an. Wenn die Indikatorlinie die Nulllinie nach oben kreuzt, wird sie mit grünem Text markiert, während die Richtung nach unten mit rotem Text markiert wird.
Außerdem wird bei der Verwendung des Dashboards das Handle für die Panel-Ereignisse in OnChartEvent() EA-Ereignishandler aufgerufen, und die Ereignisse für den Erhalt des Balkenindex unter dem Cursor werden behandelt:
//+------------------------------------------------------------------+
//| ChartEvent function                                              |
//+------------------------------------------------------------------+
void OnChartEvent(const int id,
                  const long &lparam,
                  const double &dparam,
                  const string &sparam)
  {
//--- Handling the panel
//--- Call the panel event handler
   panel.OnChartEvent(id,lparam,dparam,sparam);

//--- If the cursor moves or a click is made on the chart
   if(id==CHARTEVENT_MOUSE_MOVE || id==CHARTEVENT_CLICK)
     {
      //--- Declare the variables to record time and price coordinates in them
      datetime time=0;
      double price=0;
      int wnd=0;
      //--- If the cursor coordinates are converted to date and time
      if(ChartXYToTimePrice(ChartID(),(int)lparam,(int)dparam,wnd,time,price))
        {
         //--- write the bar index where the cursor is located to a global variable
         mouse_bar_index=iBarShift(Symbol(),PERIOD_CURRENT,time);
         //--- Display the bar data under the cursor on the panel
         DrawData(mouse_bar_index,time);
        }
     }

//--- If we received a custom event, display the appropriate message in the journal
   if(id>CHARTEVENT_CUSTOM)
     {
      //--- Here we can implement handling a click on the close button on the panel
      PrintFormat("%s: Event id=%ld, object id (lparam): %lu, event message (sparam): %s",__FUNCTION__,id,lparam,sparam);
     }
  }
Nachdem wir den EA kompiliert und auf dem Chart gestartet haben, können wir den Status des Indikatorwertes und der Linie auf dem Panel überwachen:
Sie können den Test EA TestWilliamsAO.mq5 in den an den Artikel angehängten Dateien ansehen.
Fraktale
Alle Märkte zeichnen sich dadurch aus, dass die Preise die meiste Zeit über nur wenig schwanken und nur für einen kurzen Zeitraum (15-30 %) Trendänderungen zu beobachten sind. Dies sind auch die lukrativsten Marktbewegungen.
Die Fraktale gehören zu den fünf Indikatoren des Bill Williams’ Handelssystem und erlauben das Auffinden von Hochs und Tiefs. Die technische Definition eine Aufwärtsfraktals benötigt zumindest 5 aufeinanderfolgende Balken mit jeweils zwei Balken vor und nach der Balken mit dem höchsten Hoch, deren Hoch alle kleiner sind. Umgekehrt gilt dies für ein Abwärtsfraktal. In einem Chart haben die Fraktale die Werte „Hoch“ und „Tief“ und werden durch Aufwärts- oder Abwärtspfeile angezeigt.
Die Signale der technischen Indikators Fraktale müssen mit Hilfe des technischen Indikators Alligator gefiltert werden. Sie sollten keine Kaufgeschäfte tätigen, wenn das Fraktal unterhalb der Alligatorzähne liegt, und Sie sollten keine Verkaufsgeschäfte tätigen, wenn das Fraktal oberhalb der Alligatorzähne liegt. Sobald ein Fraktalsignal gebildet wurde und eine gewisse Stärke aufweist, die durch seine Position außerhalb des Alligatormauls bestimmt wird, bleibt es ein Signal, bis es durchbrochen wird oder bis ein neueres Fraktalsignal auftritt.
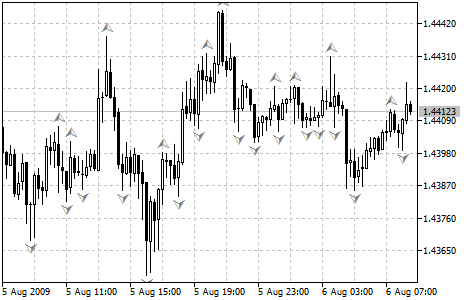
Parameter
Die Funktion iFractals() wird zur Erstellung des Indikator-Handles verwendet:
Rückgabe des Fractals Indikator-Handle.
int  iFractals(
   string           symbol,     // symbol name
   ENUM_TIMEFRAMES  period      // period
   );
symbol
[in] Der Symbolname des Finanzinstruments, dessen Daten zur Berechnung des Indikators verwendet werden sollen. NULL bedeutet das aktuelle Symbol.
period
[in] Der Zeitrahmen, es ist ein Wert aus der Enumeration ENUM_TIMEFRAMES, 0 bedeutet den aktuellen Zeitrahmen.
Rückgabewert
Gibt das Handle des angegebenen technischen Indikators zurück. Falls fehlgeschlagen, wird INVALID_HANDLE zurückgegeben. Um den Computerspeicher eines nicht mehr verwendeten Indikators freizugeben, verwenden Sie IndicatorRelease(), dem das Indikator-Handle übergeben wird.
Puffer-Indizes: 0 — UPPER_LINE, 1 — LOWER_LINE.
Deklarieren der Eingabe- und der globalen Variablen im EA, um den Indikator zu erstellen:
//+------------------------------------------------------------------+
//|                                         TestWilliamsFractals.mq5 |
//|                                  Copyright 2023, MetaQuotes Ltd. |
//|                                             https://www.mql5.com |
//+------------------------------------------------------------------+
#property copyright "Copyright 2023, MetaQuotes Ltd."
#property link      "https://www.mql5.com"
#property version   "1.00"
//--- global variables
int      handle=INVALID_HANDLE;  // Indicator handle
int      ind_digits=0;           // Number of decimal places in the indicator values
string   ind_title;              // Indicator description
Wenn Sie das Dashboard im EA verwenden, deklarieren Sie die globalen Variablen und binden Sie die Datei mit der Klasse des Panels ein:
//+------------------------------------------------------------------+
//|                                         TestWilliamsFractals.mq5 |
//|                                  Copyright 2023, MetaQuotes Ltd. |
//|                                             https://www.mql5.com |
//+------------------------------------------------------------------+
#property copyright "Copyright 2023, MetaQuotes Ltd."
#property link      "https://www.mql5.com"
#property version   "1.00"
//--- includes
#include <Dashboard\Dashboard.mqh>
//--- global variables
int      handle=INVALID_HANDLE;  // Indicator handle
int      ind_digits=0;           // Number of decimal places in the indicator values
string   ind_title;              // Indicator description
//--- variables for the panel
int      mouse_bar_index;        // Index of the bar the data is taken from
CDashboard *panel=NULL;          // Pointer to the panel object
Initialisierung
Einstellung der Werte der globalen Variablen für den Indikator und die Erstellung seines Handles:
//+------------------------------------------------------------------+
//| Expert initialization function                                   |
//+------------------------------------------------------------------+
int OnInit()
  {
//--- create timer
   EventSetTimer(60);

//--- Indicator
//--- Set the indicator name and the number of decimal places
   ind_title="Fractals";
   ind_digits=Digits();
//--- Create indicator handle
   ResetLastError();
   handle=iFractals(Symbol(),PERIOD_CURRENT);
   if(handle==INVALID_HANDLE)
     {
      PrintFormat("%s: Failed to create indicator handle %s. Error %ld",__FUNCTION__,ind_title,GetLastError());
      return INIT_FAILED;
     }

//--- Successful initialization
   return(INIT_SUCCEEDED);
  }
Wenn der EA die Verwendung des Dashboards vorsieht, erstellen wir es hier:
//+------------------------------------------------------------------+
//| Expert initialization function                                   |
//+------------------------------------------------------------------+
int OnInit()
  {
//--- create timer
   EventSetTimer(60);

//--- Indicator
//--- Set the indicator name and the number of decimal places
   ind_title="Fractals";
   ind_digits=Digits();
//--- Create indicator handle
   ResetLastError();
   handle=iFractals(Symbol(),PERIOD_CURRENT);
   if(handle==INVALID_HANDLE)
     {
      PrintFormat("%s: Failed to create indicator handle %s. Error %ld",__FUNCTION__,ind_title,GetLastError());
      return INIT_FAILED;
     }

//--- Dashboard
//--- Create the panel
   panel=new CDashboard(1,20,20,199,225);
   if(panel==NULL)
     {
      Print("Error. Failed to create panel object");
      return INIT_FAILED;
     }
//--- Set font parameters
   panel.SetFontParams("Calibri",9);
//--- Display the panel with the "Symbol, Timeframe description" header text
   panel.View(Symbol()+", "+StringSubstr(EnumToString(Period()),7));
//--- Create a table with ID 0 to display bar data in it
   panel.CreateNewTable(0);
//--- Draw a table with ID 0 on the panel background
   panel.DrawGrid(0,2,20,6,2,18,97);

//--- Create a table with ID 1 to display indicator data in it
   panel.CreateNewTable(1);
//--- Get the Y2 table coordinate with ID 0 and
//--- set the Y1 coordinate for the table with ID 1
   int y1=panel.TableY2(0)+22;
//--- Draw a table with ID 1 on the panel background
   panel.DrawGrid(1,2,y1,3,2,18,97);

//--- Display tabular data in the journal
   panel.GridPrint(0,2);
   panel.GridPrint(1,2);
//--- Initialize the variable with the index of the mouse cursor bar
   mouse_bar_index=0;
//--- Display the data of the current bar on the panel
   DrawData(mouse_bar_index,TimeCurrent());

//--- Successful initialization
   return(INIT_SUCCEEDED);
  }
Deinitialisierung
Freigabe des Indikator-Handles in OnDeinit() des EAs:
//+------------------------------------------------------------------+
//| Expert deinitialization function                                 |
//+------------------------------------------------------------------+
void OnDeinit(const int reason)
  {
//--- destroy timer
   EventKillTimer();

//--- Release handle of the indicator
   ResetLastError();
   if(!IndicatorRelease(handle))
      PrintFormat("%s: IndicatorRelease failed. Error %ld",__FUNCTION__,GetLastError());
//--- Clear all comments on the chart
   Comment("");
  }
Das erstellte Dashboard-Objekt wird bei der Verwendung des Dashboards entfernt:
//+------------------------------------------------------------------+
//| Expert deinitialization function                                 |
//+------------------------------------------------------------------+
void OnDeinit(const int reason)
  {
//--- destroy timer
   EventKillTimer();

//--- Release handle of the indicator
   ResetLastError();
   if(!IndicatorRelease(handle))
      PrintFormat("%s: IndicatorRelease failed. Error %ld",__FUNCTION__,GetLastError());
//--- Clear all comments on the chart
   Comment("");

//--- If the panel object exists, delete it
   if(panel!=NULL)
      delete panel;
  }
Abrufen von Daten
Im Folgenden werden die allgemeinen Funktionen zum Abrufen von Daten über das Indikator-Handle beschrieben. Die Funktionen wurden in dem Artikel über die Verbindung von Oszillatoren mit EAs beschrieben. Die vorgestellten Funktionen können in nutzerdefinierten Programmen im Prinzip unverändert verwendet werden:
//+------------------------------------------------------------------+
//| Return the indicator data on the specified bar                   |
//+------------------------------------------------------------------+
double IndicatorValue(const int ind_handle,const int index,const int buffer_num)
  {
   double array[1]={0};
   ResetLastError();
   if(CopyBuffer(ind_handle,buffer_num,index,1,array)!=1)
     {
      PrintFormat("%s: CopyBuffer failed. Error %ld",__FUNCTION__,GetLastError());
      return EMPTY_VALUE;
     }
   return array[0];
  }
//+------------------------------------------------------------------+
//| Return the state of the indicator line                           |
//+------------------------------------------------------------------+
ENUM_LINE_STATE LineState(const int ind_handle,const int index,const int buffer_num)
  {
//--- Get the values of the indicator line with the shift (0,1,2) relative to the passed index
   const double value0=IndicatorValue(ind_handle,index,  buffer_num);
   const double value1=IndicatorValue(ind_handle,index+1,buffer_num);
   const double value2=IndicatorValue(ind_handle,index+2,buffer_num);
//--- If at least one of the values could not be obtained, return an undefined value
   if(value0==EMPTY_VALUE || value1==EMPTY_VALUE || value2==EMPTY_VALUE)
      return LINE_STATE_NONE;
//--- Line upward reversal (value2>value1 && value0>value1)
   if(NormalizeDouble(value2-value1,ind_digits)>0 && NormalizeDouble(value0-value1,ind_digits)>0)
      return LINE_STATE_TURN_UP;
//--- Line upward direction (value2<=value1 && value0>value1)
   else if(NormalizeDouble(value2-value1,ind_digits)<=0 && NormalizeDouble(value0-value1,ind_digits)>0)
      return LINE_STATE_UP;
//--- Line upward stop (value2<=value1 && value0==value1)
   else if(NormalizeDouble(value2-value1,ind_digits)<=0 && NormalizeDouble(value0-value1,ind_digits)==0)
      return LINE_STATE_STOP_UP;
//--- Line downward reversal (value2<value1 && value0<value1)
   if(NormalizeDouble(value2-value1,ind_digits)<0 && NormalizeDouble(value0-value1,ind_digits)<0)
      return LINE_STATE_TURN_DOWN;
//--- Line downward direction (value2>=value1 && value0<value1)
   else if(NormalizeDouble(value2-value1,ind_digits)>=0 && NormalizeDouble(value0-value1,ind_digits)<0)
      return LINE_STATE_DOWN;
//--- Line downward stop (value2>=value1 && value0==value1)
   else if(NormalizeDouble(value2-value1,ind_digits)>=0 && NormalizeDouble(value0-value1,ind_digits)==0)
      return LINE_STATE_STOP_DOWN;
//--- Undefined state
   return LINE_STATE_NONE;
  }
//+------------------------------------------------------------------+
//| Return the state of the line relative to the specified level     |
//+------------------------------------------------------------------+
ENUM_LINE_STATE LineStateRelative(const int ind_handle,const int index,const int buffer_num,const double level0,const double level1=EMPTY_VALUE)
  {
//--- Get the values of the indicator line with the shift (0,1) relative to the passed index
   const double value0=IndicatorValue(ind_handle,index,  buffer_num);
   const double value1=IndicatorValue(ind_handle,index+1,buffer_num);
//--- If at least one of the values could not be obtained, return an undefined value
   if(value0==EMPTY_VALUE || value1==EMPTY_VALUE)
      return LINE_STATE_NONE;
//--- Define the second level to compare
   double level=(level1==EMPTY_VALUE ? level0 : level1);
//--- The line is below the level (value1<level && value0<level0)
   if(NormalizeDouble(value1-level,ind_digits)<0 && NormalizeDouble(value0-level0,ind_digits)<0)
      return LINE_STATE_UNDER;
//--- The line is above the level (value1>level && value0>level0)
   if(NormalizeDouble(value1-level,ind_digits)>0 && NormalizeDouble(value0-level0,ind_digits)>0)
      return LINE_STATE_ABOVE;
//--- The line crossed the level upwards (value1<=level && value0>level0)
   if(NormalizeDouble(value1-level,ind_digits)<=0 && NormalizeDouble(value0-level0,ind_digits)>0)
      return LINE_STATE_CROSS_UP;
//--- The line crossed the level downwards (value1>=level && value0<level0)
   if(NormalizeDouble(value1-level,ind_digits)>=0 && NormalizeDouble(value0-level0,ind_digits)<0)
      return LINE_STATE_CROSS_DOWN;
//--- The line touched the level from below (value1<level0 && value0==level0)
   if(NormalizeDouble(value1-level,ind_digits)<0 && NormalizeDouble(value0-level0,ind_digits)==0)
      return LINE_STATE_TOUCH_BELOW;
//--- The line touched the level from above (value1>level0 && value0==level0)
   if(NormalizeDouble(value1-level,ind_digits)>0 && NormalizeDouble(value0-level0,ind_digits)==0)
      return LINE_STATE_TOUCH_BELOW;
//--- Line is equal to the level value (value1==level0 && value0==level0)
   if(NormalizeDouble(value1-level,ind_digits)==0 && NormalizeDouble(value0-level0,ind_digits)==0)
      return LINE_STATE_EQUALS;
//--- Undefined state
   return LINE_STATE_NONE;
  }
//+------------------------------------------------------------------+
//| Return the indicator line state description                      |
//+------------------------------------------------------------------+
string LineStateDescription(const ENUM_LINE_STATE state)
  {
   switch(state)
     {
      case LINE_STATE_UP         :  return "Up";
      case LINE_STATE_STOP_UP    :  return "Stop Up";
      case LINE_STATE_TURN_UP    :  return "Turn Up";
      case LINE_STATE_DOWN       :  return "Down";
      case LINE_STATE_STOP_DOWN  :  return "Stop Down";
      case LINE_STATE_TURN_DOWN  :  return "Turn Down";
      case LINE_STATE_ABOVE      :  return "Above level";
      case LINE_STATE_UNDER      :  return "Under level";
      case LINE_STATE_CROSS_UP   :  return "Crossing Up";
      case LINE_STATE_CROSS_DOWN :  return "Crossing Down";
      case LINE_STATE_TOUCH_BELOW:  return "Touch from Below";
      case LINE_STATE_TOUCH_ABOVE:  return "Touch from Above";
      case LINE_STATE_EQUALS     :  return "Equals";
      default                    :  return "Unknown";
     }
  }
Wenn wir das Dashboard verwenden, werden die Daten mit Hilfe der Funktion auf dem Bedienfeld angezeigt:
//+------------------------------------------------------------------+
//| Display data from the specified timeseries index to the panel    |
//+------------------------------------------------------------------+
void DrawData(const int index,const datetime time)
  {
//--- Declare the variables to receive data in them
   MqlTick  tick={0};
   MqlRates rates[1];

//--- Exit if unable to get the current prices
   if(!SymbolInfoTick(Symbol(),tick))
      return;
//--- Exit if unable to get the bar data by the specified index
   if(CopyRates(Symbol(),PERIOD_CURRENT,index,1,rates)!=1)
      return;

//--- Set font parameters for bar and indicator data headers
   int  size=0;
   uint flags=0;
   uint angle=0;
   string name=panel.FontParams(size,flags,angle);
   panel.SetFontParams(name,9,FW_BOLD);
   panel.DrawText("Bar data ["+(string)index+"]",3,panel.TableY1(0)-16,clrMaroon,panel.Width()-6);
   panel.DrawText("Indicator data ["+(string)index+"]",3,panel.TableY1(1)-16,clrGreen,panel.Width()-6);
//--- Set font parameters for bar and indicator data
   panel.SetFontParams(name,9);

//--- Display the data of the specified bar in table 0 on the panel
   panel.DrawText("Date",  panel.CellX(0,0,0)+2, panel.CellY(0,0,0)+2); panel.DrawText(TimeToString(  rates[0].time,TIME_DATE),     panel.CellX(0,0,1)+2, panel.CellY(0,0,1)+2,clrNONE,90);
   panel.DrawText("Time",  panel.CellX(0,1,0)+2, panel.CellY(0,1,0)+2); panel.DrawText(TimeToString(  rates[0].time,TIME_MINUTES),  panel.CellX(0,1,1)+2, panel.CellY(0,1,1)+2,clrNONE,90);
   panel.DrawText("Open",  panel.CellX(0,2,0)+2, panel.CellY(0,2,0)+2); panel.DrawText(DoubleToString(rates[0].open,Digits()),      panel.CellX(0,2,1)+2, panel.CellY(0,2,1)+2,clrNONE,90);
   panel.DrawText("High",  panel.CellX(0,3,0)+2, panel.CellY(0,3,0)+2); panel.DrawText(DoubleToString(rates[0].high,Digits()),      panel.CellX(0,3,1)+2, panel.CellY(0,3,1)+2,clrNONE,90);
   panel.DrawText("Low",   panel.CellX(0,4,0)+2, panel.CellY(0,4,0)+2); panel.DrawText(DoubleToString(rates[0].low,Digits()),       panel.CellX(0,4,1)+2, panel.CellY(0,4,1)+2,clrNONE,90);
   panel.DrawText("Close", panel.CellX(0,5,0)+2, panel.CellY(0,5,0)+2); panel.DrawText(DoubleToString(rates[0].close,Digits()),     panel.CellX(0,5,1)+2, panel.CellY(0,5,1)+2,clrNONE,90);

//--- Display the indicator data from the specified bar on the panel in table 1 (upper fractal)
   panel.DrawText(ind_title+" Up", panel.CellX(1,0,0)+2, panel.CellY(1,0,0)+2);
   double value0=IndicatorValue(handle,index,UPPER_LINE);
   string value_str0=(value0!=EMPTY_VALUE ? DoubleToString(value0,ind_digits) : " ");
   panel.DrawText(value_str0,panel.CellX(1,0,1)+2,panel.CellY(1,0,1)+2,clrNONE,90);

//--- Display the indicator data from the specified bar on the panel in table 1 (lower fractal)
   panel.DrawText(ind_title+" Down", panel.CellX(1,1,0)+2, panel.CellY(1,1,0)+2);
   double value1=IndicatorValue(handle,index,LOWER_LINE);
   string value_str1=(value1!=EMPTY_VALUE ? DoubleToString(value1,ind_digits) : " ");
   panel.DrawText(value_str1,panel.CellX(1,1,1)+2,panel.CellY(1,1,1)+2,clrNONE,90);

//--- Redraw the chart to immediately display all changes on the panel
   ChartRedraw(ChartID());
  }
Außerdem wird bei der Verwendung des Dashboards das Handle für die Panel-Ereignisse in OnChartEvent() EA-Ereignishandler aufgerufen, und die Ereignisse für den Erhalt des Balkenindex unter dem Cursor werden behandelt:
//+------------------------------------------------------------------+
//| ChartEvent function                                              |
//+------------------------------------------------------------------+
void OnChartEvent(const int id,
                  const long &lparam,
                  const double &dparam,
                  const string &sparam)
  {
//--- Handling the panel
//--- Call the panel event handler
   panel.OnChartEvent(id,lparam,dparam,sparam);

//--- If the cursor moves or a click is made on the chart
   if(id==CHARTEVENT_MOUSE_MOVE || id==CHARTEVENT_CLICK)
     {
      //--- Declare the variables to record time and price coordinates in them
      datetime time=0;
      double price=0;
      int wnd=0;
      //--- If the cursor coordinates are converted to date and time
      if(ChartXYToTimePrice(ChartID(),(int)lparam,(int)dparam,wnd,time,price))
        {
         //--- write the bar index where the cursor is located to a global variable
         mouse_bar_index=iBarShift(Symbol(),PERIOD_CURRENT,time);
         //--- Display the bar data under the cursor on the panel
         DrawData(mouse_bar_index,time);
        }
     }

//--- If we received a custom event, display the appropriate message in the journal
   if(id>CHARTEVENT_CUSTOM)
     {
      //--- Here we can implement handling a click on the close button on the panel
      PrintFormat("%s: Event id=%ld, object id (lparam): %lu, event message (sparam): %s",__FUNCTION__,id,lparam,sparam);
     }
  }
Nachdem wir den EA kompiliert und auf dem Chart gestartet haben, können wir die Pufferwerte des Indikators auf dem Dashboard kontrollieren:
Sie können den Test EA TestWilliamsFractals.mq5 in den an den Artikel angehängten Dateien ansehen.
Gator Oszillator
Der Gator Oszillator basiert auf Alligator und zeigt den Grad der Konvergenz/Divergenz seiner Gleichgewichtslinien an (geglätteter gleitender Durchschnitt). Das obere Histogramm ist die absolute Differenz zwischen den Werten der blauen und roten Linie. Das untere Histogramm ist die negativierte absolute Differenz der roten und er grünen Linie, sodass diese Ergebnisse verkehrt herum darstellt wird.
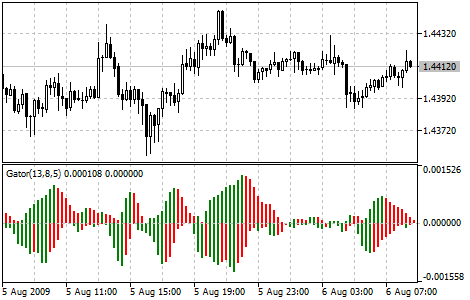
Parameter
Die Funktion iGator() wird zur Erstellung des Indikator-Handles verwendet:
Rückgabe des Gator-Handles. Der Oszillator zeigt die Differenz zwischen der blauen und der roten Alligatorlinie (oberes Histogramm) und die Differenz zwischen der roten und der grünen Linie (unteres Histogramm).
int  iGator(
   string              symbol,            // symbol name
   ENUM_TIMEFRAMES     period,            // period
   int                 jaw_period,        // period for calculating jaws
   int                 jaw_shift,         // horizontal shift of jaws
   int                 teeth_period,      // period for calculating teeth
   int                 teeth_shift,       // teeth shift
   int                 lips_period,       // period for calculating lips
   int                 lips_shift,        // horizontal shift of lips
   ENUM_MA_METHOD      ma_method,         // smoothing type
   ENUM_APPLIED_PRICE  applied_price      // price type or handle
   );
symbol
[in] Der Symbolname des Finanzinstruments, dessen Daten zur Berechnung des Indikators verwendet werden sollen. NULL bedeutet das aktuelle Symbol.
period
[in] Der Zeitrahmen, es ist ein Wert aus der Enumeration ENUM_TIMEFRAMES, 0 bedeutet den aktuellen Zeitrahmen.
jaw_period
[in] Blaue Linie (Alligator's Jaws) Mittelungszeitraum.
jaw_shift
[Verschiebung der blauen Alligator-Linie im Vergleich zum Preischart. Bezieht sich nicht direkt auf die visuelle Verschiebung des Indikatorhistogramms.
teeth_period
[in] Rote Linie (Alligator's Teeth) Mittelungszeitraum.
teeth_shift
[Verschiebung der roten Alligator-Linie im Verhältnis zum Preischart. Bezieht sich nicht direkt auf die visuelle Verschiebung des Indikatorhistogramms.
lips_period
[in] Grüne Linie (Alligator's Lips) Mittelungszeitraum.
lips_shift
[in] Verschiebung der grünen Alligator-Linie relativ zum Preischart. Bezieht sich nicht direkt auf die visuelle Verschiebung des Indikatorhistogramms.
ma_method
[in] Mittelungsmethode. Einer der Werte aus der Enumeration ENUM_MA_METHOD annehmen.
applied_price
[in] Verwendeter Preis. Ein Wert aus der Enumeration ENUM_APPLIED_PRICE oder ein anderes Indikatorhandle.
Gibt das Handle des angegebenen technischen Indikators zurück. Falls fehlgeschlagen, wird INVALID_HANDLE zurückgegeben. Um den Computerspeicher eines nicht mehr verwendeten Indikators freizugeben, verwenden Sie IndicatorRelease(), dem das Indikator-Handle übergeben wird.
Puffer-Indizes: 0 — UPPER_HISTOGRAM, 1 — Farbpuffer für das obere Histogramm, 2 — LOWER_HISTOGRAM, 3 — Farbpuffer für das untere Histogramm.
Deklarieren der Eingabe- und der globalen Variablen im EA, um den Indikator zu erstellen:
//+------------------------------------------------------------------+
//|                                            TestWilliamsGator.mq5 |
//|                                  Copyright 2023, MetaQuotes Ltd. |
//|                                             https://www.mql5.com |
//+------------------------------------------------------------------+
#property copyright "Copyright 2023, MetaQuotes Ltd."
#property link      "https://www.mql5.com"
#property version   "1.00"
//--- enums
enum ENUM_LINE_STATE
  {
   LINE_STATE_NONE,        // Undefined state
   LINE_STATE_UP,          // Upward
   LINE_STATE_DOWN,        // Downward
   LINE_STATE_TURN_UP,     // Upward reversal
   LINE_STATE_TURN_DOWN,   // Downward reversal
   LINE_STATE_STOP_UP,     // Upward stop
   LINE_STATE_STOP_DOWN,   // Downward stop
   LINE_STATE_ABOVE,       // Above value
   LINE_STATE_UNDER,       // Below value
   LINE_STATE_CROSS_UP,    // Crossing value upwards
   LINE_STATE_CROSS_DOWN,  // Crossing value downwards
   LINE_STATE_TOUCH_BELOW, // Touching value from below
   LINE_STATE_TOUCH_ABOVE, // Touch value from above
   LINE_STATE_EQUALS,      // Equal to value
  };
//--- input parameters
input uint                 InpPeriodJaws  =  13;            /* Jaws Period    */
input int                  InpShiftJaws   =  8;             /* Jaws Shift     */
input uint                 InpPeriodTeeth =  8;             /* Teeth Period   */
input int                  InpShiftTeeth  =  5;             /* Teeth Shift    */
input uint                 InpPeriodLips  =  5;             /* Lips Period    */
input int                  InpShiftLips   =  3;             /* Lips Shift     */
input ENUM_MA_METHOD       InpMethod      =  MODE_SMMA;     /* Smoothed       */
input ENUM_APPLIED_PRICE   InpAppliedPrice=  PRICE_MEDIAN;  /* Applied Price  */
//--- global variables
int      handle=INVALID_HANDLE;  // Indicator handle
int      period_jaws=0;          // Jaws line calculation period
int      period_teeth=0;         // Teeth line calculation period
int      period_lips=0;          // Lips line calculation period
int      ind_digits=0;           // Number of decimal places in the indicator values
string   ind_title;              // Indicator description
Wenn Sie das Dashboard im EA verwenden, deklarieren Sie die globalen Variablen und binden Sie die Datei mit der Klasse des Panels ein:
//+------------------------------------------------------------------+
//|                                            TestWilliamsGator.mq5 |
//|                                  Copyright 2023, MetaQuotes Ltd. |
//|                                             https://www.mql5.com |
//+------------------------------------------------------------------+
#property copyright "Copyright 2023, MetaQuotes Ltd."
#property link      "https://www.mql5.com"
#property version   "1.00"
//--- includes
#include <Dashboard\Dashboard.mqh>
//--- enums
enum ENUM_LINE_STATE
  {
   LINE_STATE_NONE,        // Undefined state
   LINE_STATE_UP,          // Upward
   LINE_STATE_DOWN,        // Downward
   LINE_STATE_TURN_UP,     // Upward reversal
   LINE_STATE_TURN_DOWN,   // Downward reversal
   LINE_STATE_STOP_UP,     // Upward stop
   LINE_STATE_STOP_DOWN,   // Downward stop
   LINE_STATE_ABOVE,       // Above value
   LINE_STATE_UNDER,       // Below value
   LINE_STATE_CROSS_UP,    // Crossing value upwards
   LINE_STATE_CROSS_DOWN,  // Crossing value downwards
   LINE_STATE_TOUCH_BELOW, // Touching value from below
   LINE_STATE_TOUCH_ABOVE, // Touch value from above
   LINE_STATE_EQUALS,      // Equal to value
  };
//--- input parameters
input uint                 InpPeriodJaws  =  13;            /* Jaws Period    */
input int                  InpShiftJaws   =  8;             /* Jaws Shift     */
input uint                 InpPeriodTeeth =  8;             /* Teeth Period   */
input int                  InpShiftTeeth  =  5;             /* Teeth Shift    */
input uint                 InpPeriodLips  =  5;             /* Lips Period    */
input int                  InpShiftLips   =  3;             /* Lips Shift     */
input ENUM_MA_METHOD       InpMethod      =  MODE_SMMA;     /* Smoothed       */
input ENUM_APPLIED_PRICE   InpAppliedPrice=  PRICE_MEDIAN;  /* Applied Price  */
//--- global variables
int      handle=INVALID_HANDLE;  // Indicator handle
int      period_jaws=0;          // Jaws line calculation period
int      period_teeth=0;         // Teeth line calculation period
int      period_lips=0;          // Lips line calculation period
int      ind_digits=0;           // Number of decimal places in the indicator values
string   ind_title;              // Indicator description
//--- variables for the panel
int      mouse_bar_index;        // Index of the bar the data is taken from
CDashboard *panel=NULL;          // Pointer to the panel object
Initialisierung
Einstellung der Werte der globalen Variablen für den Indikator und die Erstellung seines Handles:
//+------------------------------------------------------------------+
//| Expert initialization function                                   |
//+------------------------------------------------------------------+
int OnInit()
  {
//--- create timer
   EventSetTimer(60);

//--- Indicator
//--- Set and adjust the calculation period if necessary
   period_jaws=int(InpPeriodJaws<1 ? 13 : InpPeriodJaws);
   period_teeth=int(InpPeriodTeeth<1 ? 8 : InpPeriodTeeth);
   period_lips=int(InpPeriodLips<1 ? 5 : InpPeriodLips);
//--- Set the indicator name and the number of decimal places
   ind_title=StringFormat("Gator(%lu,%lu,%lu)",period_jaws,period_teeth,period_lips);
   ind_digits=Digits()+1;
//--- Create indicator handle
   ResetLastError();
   handle=iGator(Symbol(),PERIOD_CURRENT,period_jaws,InpShiftJaws,period_teeth,InpShiftTeeth,period_lips,InpShiftLips,InpMethod,InpAppliedPrice);
   if(handle==INVALID_HANDLE)
     {
      PrintFormat("%s: Failed to create indicator handle %s. Error %ld",__FUNCTION__,ind_title,GetLastError());
      return INIT_FAILED;
     }

//--- Successful initialization
   return(INIT_SUCCEEDED);
  }
Wenn der EA die Verwendung des Dashboards vorsieht, erstellen wir es hier:
//+------------------------------------------------------------------+
//| Expert initialization function                                   |
//+------------------------------------------------------------------+
int OnInit()
  {
//--- create timer
   EventSetTimer(60);

//--- Indicator
//--- Set and adjust the calculation period if necessary
   period_jaws=int(InpPeriodJaws<1 ? 13 : InpPeriodJaws);
   period_teeth=int(InpPeriodTeeth<1 ? 8 : InpPeriodTeeth);
   period_lips=int(InpPeriodLips<1 ? 5 : InpPeriodLips);
//--- Set the indicator name and the number of decimal places
   ind_title=StringFormat("Gator(%lu,%lu,%lu)",period_jaws,period_teeth,period_lips);
   ind_digits=Digits()+1;
//--- Create indicator handle
   ResetLastError();
   handle=iGator(Symbol(),PERIOD_CURRENT,period_jaws,InpShiftJaws,period_teeth,InpShiftTeeth,period_lips,InpShiftLips,InpMethod,InpAppliedPrice);
   if(handle==INVALID_HANDLE)
     {
      PrintFormat("%s: Failed to create indicator handle %s. Error %ld",__FUNCTION__,ind_title,GetLastError());
      return INIT_FAILED;
     }

//--- Dashboard
//--- Create the panel
   panel=new CDashboard(1,20,20,229,225);
   if(panel==NULL)
     {
      Print("Error. Failed to create panel object");
      return INIT_FAILED;
     }
//--- Set font parameters
   panel.SetFontParams("Calibri",9);
//--- Display the panel with the "Symbol, Timeframe description" header text
   panel.View(Symbol()+", "+StringSubstr(EnumToString(Period()),7));
//--- Create a table with ID 0 to display bar data in it
   panel.CreateNewTable(0);
//--- Draw a table with ID 0 on the panel background
   panel.DrawGrid(0,2,20,6,2,18,112);

//--- Create a table with ID 1 to display indicator data in it
   panel.CreateNewTable(1);
//--- Get the Y2 table coordinate with ID 0 and
//--- set the Y1 coordinate for the table with ID 1
   int y1=panel.TableY2(0)+22;
//--- Draw a table with ID 1 on the panel background
   panel.DrawGrid(1,2,y1,3,2,18,112);

//--- Display tabular data in the journal
   panel.GridPrint(0,2);
   panel.GridPrint(1,2);
//--- Initialize the variable with the index of the mouse cursor bar
   mouse_bar_index=0;
//--- Display the data of the current bar on the panel
   DrawData(mouse_bar_index,TimeCurrent());

//--- Successful initialization
   return(INIT_SUCCEEDED);
  }
Deinitialisierung
Freigabe des Indikator-Handles in OnDeinit() des EAs:
//+------------------------------------------------------------------+
//| Expert deinitialization function                                 |
//+------------------------------------------------------------------+
void OnDeinit(const int reason)
  {
//--- destroy timer
   EventKillTimer();

//--- Release handle of the indicator
   ResetLastError();
   if(!IndicatorRelease(handle))
      PrintFormat("%s: IndicatorRelease failed. Error %ld",__FUNCTION__,GetLastError());
//--- Clear all comments on the chart
   Comment("");
  }
Das erstellte Dashboard-Objekt wird bei der Verwendung des Dashboards entfernt:
//+------------------------------------------------------------------+
//| Expert deinitialization function                                 |
//+------------------------------------------------------------------+
void OnDeinit(const int reason)
  {
//--- destroy timer
   EventKillTimer();

//--- Release handle of the indicator
   ResetLastError();
   if(!IndicatorRelease(handle))
      PrintFormat("%s: IndicatorRelease failed. Error %ld",__FUNCTION__,GetLastError());
//--- Clear all comments on the chart
   Comment("");

//--- If the panel object exists, delete it
   if(panel!=NULL)
      delete panel;
  }
Abrufen von Daten
Im Folgenden werden die allgemeinen Funktionen zum Abrufen von Daten über das Indikator-Handle beschrieben. Die Funktionen wurden in dem Artikel über die Verbindung von Oszillatoren mit EAs beschrieben. Die vorgestellten Funktionen können in nutzerdefinierten Programmen im Prinzip unverändert verwendet werden:
//+------------------------------------------------------------------+
//| Return the indicator data on the specified bar                   |
//+------------------------------------------------------------------+
double IndicatorValue(const int ind_handle,const int index,const int buffer_num)
  {
   double array[1]={0};
   ResetLastError();
   if(CopyBuffer(ind_handle,buffer_num,index,1,array)!=1)
     {
      PrintFormat("%s: CopyBuffer failed. Error %ld",__FUNCTION__,GetLastError());
      return EMPTY_VALUE;
     }
   return array[0];
  }
//+------------------------------------------------------------------+
//| Return the state of the indicator line                           |
//+------------------------------------------------------------------+
ENUM_LINE_STATE LineState(const int ind_handle,const int index,const int buffer_num)
  {
//--- Get the values of the indicator line with the shift (0,1,2) relative to the passed index
   const double value0=IndicatorValue(ind_handle,index,  buffer_num);
   const double value1=IndicatorValue(ind_handle,index+1,buffer_num);
   const double value2=IndicatorValue(ind_handle,index+2,buffer_num);
//--- If at least one of the values could not be obtained, return an undefined value
   if(value0==EMPTY_VALUE || value1==EMPTY_VALUE || value2==EMPTY_VALUE)
      return LINE_STATE_NONE;
//--- Line upward reversal (value2>value1 && value0>value1)
   if(NormalizeDouble(value2-value1,ind_digits)>0 && NormalizeDouble(value0-value1,ind_digits)>0)
      return LINE_STATE_TURN_UP;
//--- Line upward direction (value2<=value1 && value0>value1)
   else if(NormalizeDouble(value2-value1,ind_digits)<=0 && NormalizeDouble(value0-value1,ind_digits)>0)
      return LINE_STATE_UP;
//--- Line upward stop (value2<=value1 && value0==value1)
   else if(NormalizeDouble(value2-value1,ind_digits)<=0 && NormalizeDouble(value0-value1,ind_digits)==0)
      return LINE_STATE_STOP_UP;
//--- Line downward reversal (value2<value1 && value0<value1)
   if(NormalizeDouble(value2-value1,ind_digits)<0 && NormalizeDouble(value0-value1,ind_digits)<0)
      return LINE_STATE_TURN_DOWN;
//--- Line downward direction (value2>=value1 && value0<value1)
   else if(NormalizeDouble(value2-value1,ind_digits)>=0 && NormalizeDouble(value0-value1,ind_digits)<0)
      return LINE_STATE_DOWN;
//--- Line downward stop (value2>=value1 && value0==value1)
   else if(NormalizeDouble(value2-value1,ind_digits)>=0 && NormalizeDouble(value0-value1,ind_digits)==0)
      return LINE_STATE_STOP_DOWN;
//--- Undefined state
   return LINE_STATE_NONE;
  }
//+------------------------------------------------------------------+
//| Return the state of the line relative to the specified level     |
//+------------------------------------------------------------------+
ENUM_LINE_STATE LineStateRelative(const int ind_handle,const int index,const int buffer_num,const double level0,const double level1=EMPTY_VALUE)
  {
//--- Get the values of the indicator line with the shift (0,1) relative to the passed index
   const double value0=IndicatorValue(ind_handle,index,  buffer_num);
   const double value1=IndicatorValue(ind_handle,index+1,buffer_num);
//--- If at least one of the values could not be obtained, return an undefined value
   if(value0==EMPTY_VALUE || value1==EMPTY_VALUE)
      return LINE_STATE_NONE;
//--- Define the second level to compare
   double level=(level1==EMPTY_VALUE ? level0 : level1);
//--- The line is below the level (value1<level && value0<level0)
   if(NormalizeDouble(value1-level,ind_digits)<0 && NormalizeDouble(value0-level0,ind_digits)<0)
      return LINE_STATE_UNDER;
//--- The line is above the level (value1>level && value0>level0)
   if(NormalizeDouble(value1-level,ind_digits)>0 && NormalizeDouble(value0-level0,ind_digits)>0)
      return LINE_STATE_ABOVE;
//--- The line crossed the level upwards (value1<=level && value0>level0)
   if(NormalizeDouble(value1-level,ind_digits)<=0 && NormalizeDouble(value0-level0,ind_digits)>0)
      return LINE_STATE_CROSS_UP;
//--- The line crossed the level downwards (value1>=level && value0<level0)
   if(NormalizeDouble(value1-level,ind_digits)>=0 && NormalizeDouble(value0-level0,ind_digits)<0)
      return LINE_STATE_CROSS_DOWN;
//--- The line touched the level from below (value1<level0 && value0==level0)
   if(NormalizeDouble(value1-level,ind_digits)<0 && NormalizeDouble(value0-level0,ind_digits)==0)
      return LINE_STATE_TOUCH_BELOW;
//--- The line touched the level from above (value1>level0 && value0==level0)
   if(NormalizeDouble(value1-level,ind_digits)>0 && NormalizeDouble(value0-level0,ind_digits)==0)
      return LINE_STATE_TOUCH_BELOW;
//--- Line is equal to the level value (value1==level0 && value0==level0)
   if(NormalizeDouble(value1-level,ind_digits)==0 && NormalizeDouble(value0-level0,ind_digits)==0)
      return LINE_STATE_EQUALS;
//--- Undefined state
   return LINE_STATE_NONE;
  }
//+------------------------------------------------------------------+
//| Return the indicator line state description                      |
//+------------------------------------------------------------------+
string LineStateDescription(const ENUM_LINE_STATE state)
  {
   switch(state)
     {
      case LINE_STATE_UP         :  return "Up";
      case LINE_STATE_STOP_UP    :  return "Stop Up";
      case LINE_STATE_TURN_UP    :  return "Turn Up";
      case LINE_STATE_DOWN       :  return "Down";
      case LINE_STATE_STOP_DOWN  :  return "Stop Down";
      case LINE_STATE_TURN_DOWN  :  return "Turn Down";
      case LINE_STATE_ABOVE      :  return "Above level";
      case LINE_STATE_UNDER      :  return "Under level";
      case LINE_STATE_CROSS_UP   :  return "Crossing Up";
      case LINE_STATE_CROSS_DOWN :  return "Crossing Down";
      case LINE_STATE_TOUCH_BELOW:  return "Touch from Below";
      case LINE_STATE_TOUCH_ABOVE:  return "Touch from Above";
      case LINE_STATE_EQUALS     :  return "Equals";
      default                    :  return "Unknown";
     }
  }
Wenn wir das Dashboard verwenden, werden die Daten mit Hilfe der Funktion auf dem Bedienfeld angezeigt:
//+------------------------------------------------------------------+
//| Display data from the specified timeseries index to the panel    |
//+------------------------------------------------------------------+
void DrawData(const int index,const datetime time)
  {
//--- Declare the variables to receive data in them
   MqlTick  tick={0};
   MqlRates rates[1];

//--- Exit if unable to get the current prices
   if(!SymbolInfoTick(Symbol(),tick))
      return;
//--- Exit if unable to get the bar data by the specified index
   if(CopyRates(Symbol(),PERIOD_CURRENT,index,1,rates)!=1)
      return;

//--- Set font parameters for bar and indicator data headers
   int  size=0;
   uint flags=0;
   uint angle=0;
   string name=panel.FontParams(size,flags,angle);
   panel.SetFontParams(name,9,FW_BOLD);
   panel.DrawText("Bar data ["+(string)index+"]",3,panel.TableY1(0)-16,clrMaroon,panel.Width()-6);
   panel.DrawText("Indicator data ["+(string)index+"]",3,panel.TableY1(1)-16,clrGreen,panel.Width()-6);
//--- Set font parameters for bar and indicator data
   panel.SetFontParams(name,9);

//--- Display the data of the specified bar in table 0 on the panel
   panel.DrawText("Date",  panel.CellX(0,0,0)+2, panel.CellY(0,0,0)+2); panel.DrawText(TimeToString(  rates[0].time,TIME_DATE),     panel.CellX(0,0,1)+2, panel.CellY(0,0,1)+2,clrNONE,90);
   panel.DrawText("Time",  panel.CellX(0,1,0)+2, panel.CellY(0,1,0)+2); panel.DrawText(TimeToString(  rates[0].time,TIME_MINUTES),  panel.CellX(0,1,1)+2, panel.CellY(0,1,1)+2,clrNONE,90);
   panel.DrawText("Open",  panel.CellX(0,2,0)+2, panel.CellY(0,2,0)+2); panel.DrawText(DoubleToString(rates[0].open,Digits()),      panel.CellX(0,2,1)+2, panel.CellY(0,2,1)+2,clrNONE,90);
   panel.DrawText("High",  panel.CellX(0,3,0)+2, panel.CellY(0,3,0)+2); panel.DrawText(DoubleToString(rates[0].high,Digits()),      panel.CellX(0,3,1)+2, panel.CellY(0,3,1)+2,clrNONE,90);
   panel.DrawText("Low",   panel.CellX(0,4,0)+2, panel.CellY(0,4,0)+2); panel.DrawText(DoubleToString(rates[0].low,Digits()),       panel.CellX(0,4,1)+2, panel.CellY(0,4,1)+2,clrNONE,90);
   panel.DrawText("Close", panel.CellX(0,5,0)+2, panel.CellY(0,5,0)+2); panel.DrawText(DoubleToString(rates[0].close,Digits()),     panel.CellX(0,5,1)+2, panel.CellY(0,5,1)+2,clrNONE,90);

//--- Get the indicator buffers data
   double value0=IndicatorValue(handle,index,UPPER_HISTOGRAM); // Upper histogram
   double value1=IndicatorValue(handle,index,1);               // Upper histogram color buffer
   double value2=IndicatorValue(handle,index,LOWER_HISTOGRAM); // Lower histogram
   double value3=IndicatorValue(handle,index,3);               // Lower histogram color buffer
   color clr=clrNONE;
//--- Display the upper histogram data from the specified bar on the panel in table 1
   panel.DrawText(ind_title+" Up", panel.CellX(1,0,0)+2, panel.CellY(1,0,0)+2);
   string value_str=(value0!=EMPTY_VALUE ? DoubleToString(value0,ind_digits) : "");
   clr=(value1>0 ? clrRed : clrGreen);
   panel.DrawText(value_str,panel.CellX(1,0,1)+2,panel.CellY(1,0,1)+2,clr,100);

//--- Display the lower histogram data from the specified bar on the panel in table 1
   panel.DrawText(ind_title+" Down", panel.CellX(1,1,0)+2, panel.CellY(1,1,0)+2);
   value_str=(value2!=EMPTY_VALUE ? DoubleToString(value2,ind_digits) : "");
   clr=(value3>0 ? clrRed : clrGreen);
   panel.DrawText(value_str,panel.CellX(1,1,1)+2,panel.CellY(1,1,1)+2,clr,100);

//--- Redraw the chart to immediately display all changes on the panel
   ChartRedraw(ChartID());
  }
Die Farbe des Textes, der die Werte der Indikatorpuffer beschreibt, hat die gleiche Farbe wie die entsprechende Spalte des Indikatorhistogramms.
Außerdem wird bei der Verwendung des Dashboards das Handle für die Panel-Ereignisse in OnChartEvent() EA-Ereignishandler aufgerufen, und die Ereignisse für den Erhalt des Balkenindex unter dem Cursor werden behandelt:
//+------------------------------------------------------------------+
//| ChartEvent function                                              |
//+------------------------------------------------------------------+
void OnChartEvent(const int id,
                  const long &lparam,
                  const double &dparam,
                  const string &sparam)
  {
//--- Handling the panel
//--- Call the panel event handler
   panel.OnChartEvent(id,lparam,dparam,sparam);

//--- If the cursor moves or a click is made on the chart
   if(id==CHARTEVENT_MOUSE_MOVE || id==CHARTEVENT_CLICK)
     {
      //--- Declare the variables to record time and price coordinates in them
      datetime time=0;
      double price=0;
      int wnd=0;
      //--- If the cursor coordinates are converted to date and time
      if(ChartXYToTimePrice(ChartID(),(int)lparam,(int)dparam,wnd,time,price))
        {
         //--- write the bar index where the cursor is located to a global variable
         mouse_bar_index=iBarShift(Symbol(),PERIOD_CURRENT,time);
         //--- Display the bar data under the cursor on the panel
         DrawData(mouse_bar_index,time);
        }
     }

//--- If we received a custom event, display the appropriate message in the journal
   if(id>CHARTEVENT_CUSTOM)
     {
      //--- Here we can implement handling a click on the close button on the panel
      PrintFormat("%s: Event id=%ld, object id (lparam): %lu, event message (sparam): %s",__FUNCTION__,id,lparam,sparam);
     }
  }
Nachdem wir den EA kompiliert und auf dem Chart gestartet haben, können wir den Status des Indikatorwertes und der Linie auf dem Panel überwachen:
Sie können den Test EA TestWilliamsGator.mq5 in den an den Artikel angehängten Dateien ansehen.
Market Facilitation Index
Market Facilitation Index (BW MFI) ist der Indikator, der die Preisveränderung für einen Tick anzeigt. Die absoluten Werte des Indikators haben alleine keine Bedeutung, da nur die Preis-Veränderung angezeigt wird. Bill Williams zeigt die Bedeutung aus der Interaktion von MFI und Volumen:
- Market Facilitation Index und Volumen erhöhen sich gleichzeitig — dies bedeutet, dass: a) die Anzahl an Marktteilnehmern steigt b) neue Marktteilnehmer Positionen in die Richtung der Chart-Entwicklung eröffnen.
- Market Facilitation Index fällt und das Volumen fällt. Das bedeutet, dass Marktteilnehmer kein Interesse mehr zeigen.
- Market Facilitation Index steigt, aber das Volumen fällt. Es ist höchst wahrscheinlich, dass der Markt nicht durch Volumen der Händler unterstützt wird und die Richtung des Preises wechselt durch den Einfluss von Floor-Tradern (Broker, Agenten und Dealer).
- Market Facilitation Index fällt aber das Volumen steigt. Es gibt einen Kampf zwischen Bullen und Bären, charakterisiert durch große Kaufs- und Verkausvolumen, der Preis verändert sich jedoch nicht signifikant, da die Kräfte ausgeglichen sind. Eine der teilnehmenden Parteien (Käufer vs. Verkäufer) gewinnt diesen Kampf schlussendlich. Normalerweise gibt der Durchbruch einer Kerze das Signal für eine Fortführung des Trends oder dem Abbruch. Bill Williams nennt solch einen Balken „curtsying“ (Knicks).
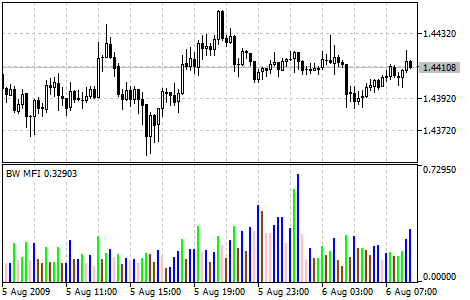
Parameter
Die Funktion iBWMFI() wird zur Erstellung des Indikator-Handles verwendet:
Gibt das Handle des Market Facilitation Index Indikators zurück. Es gibt nur einen Puffer.
int  iBWMFI(
   string               symbol,             // symbol name
   ENUM_TIMEFRAMES      period,             // period
   ENUM_APPLIED_VOLUME  applied_volume      // type of volume used for calculations
   );
symbol
[in] Der Symbolname des Finanzinstruments, dessen Daten zur Berechnung des Indikators verwendet werden sollen. NULL bedeutet das aktuelle Symbol.
period
[in] Der Zeitrahmen, es ist ein Wert aus der Enumeration ENUM_TIMEFRAMES, 0 bedeutet den aktuellen Zeitrahmen.
applied_volume
[in] Verwendetes Volumen. Ein Wert aus der Enumeration ENUM_APPLIED_VOLUME.
Gibt das Handle des angegebenen technischen Indikators zurück. Falls fehlgeschlagen, wird INVALID_HANDLE zurückgegeben. Um den Computerspeicher eines nicht mehr verwendeten Indikators freizugeben, verwenden Sie IndicatorRelease(), dem das Indikator-Handle übergeben wird.
Deklarieren der Eingabe- und der globalen Variablen im EA, um den Indikator zu erstellen:
//+------------------------------------------------------------------+
//|                                            TestWilliamsBWMFI.mq5 |
//|                                  Copyright 2023, MetaQuotes Ltd. |
//|                                             https://www.mql5.com |
//+------------------------------------------------------------------+
#property copyright "Copyright 2023, MetaQuotes Ltd."
#property link      "https://www.mql5.com"
#property version   "1.00"
//--- enums
enum ENUM_LINE_STATE
  {
   LINE_STATE_NONE,        // Undefined state
   LINE_STATE_UP,          // Upward
   LINE_STATE_DOWN,        // Downward
   LINE_STATE_TURN_UP,     // Upward reversal
   LINE_STATE_TURN_DOWN,   // Downward reversal
   LINE_STATE_STOP_UP,     // Upward stop
   LINE_STATE_STOP_DOWN,   // Downward stop
   LINE_STATE_ABOVE,       // Above value
   LINE_STATE_UNDER,       // Below value
   LINE_STATE_CROSS_UP,    // Crossing value upwards
   LINE_STATE_CROSS_DOWN,  // Crossing value downwards
   LINE_STATE_TOUCH_BELOW, // Touching value from below
   LINE_STATE_TOUCH_ABOVE, // Touch value from above
   LINE_STATE_EQUALS,      // Equal to value
  };
//--- input parameters
input ENUM_APPLIED_VOLUME  InpVolume   =  VOLUME_TICK;   /* Applied Volume */
//--- global variables
int      handle=INVALID_HANDLE;  // Indicator handle
int      ind_digits=0;           // Number of decimal places in the indicator values
string   ind_title;              // Indicator description
Wenn Sie das Dashboard im EA verwenden, deklarieren Sie die globalen Variablen und binden Sie die Datei mit der Klasse des Panels ein:
//+------------------------------------------------------------------+
//|                                            TestWilliamsBWMFI.mq5 |
//|                                  Copyright 2023, MetaQuotes Ltd. |
//|                                             https://www.mql5.com |
//+------------------------------------------------------------------+
#property copyright "Copyright 2023, MetaQuotes Ltd."
#property link      "https://www.mql5.com"
#property version   "1.00"
//--- includes
#include <Dashboard\Dashboard.mqh>
//--- enums
enum ENUM_LINE_STATE
  {
   LINE_STATE_NONE,        // Undefined state
   LINE_STATE_UP,          // Upward
   LINE_STATE_DOWN,        // Downward
   LINE_STATE_TURN_UP,     // Upward reversal
   LINE_STATE_TURN_DOWN,   // Downward reversal
   LINE_STATE_STOP_UP,     // Upward stop
   LINE_STATE_STOP_DOWN,   // Downward stop
   LINE_STATE_ABOVE,       // Above value
   LINE_STATE_UNDER,       // Below value
   LINE_STATE_CROSS_UP,    // Crossing value upwards
   LINE_STATE_CROSS_DOWN,  // Crossing value downwards
   LINE_STATE_TOUCH_BELOW, // Touching value from below
   LINE_STATE_TOUCH_ABOVE, // Touch value from above
   LINE_STATE_EQUALS,      // Equal to value
  };
//--- input parameters
input ENUM_APPLIED_VOLUME  InpVolume   =  VOLUME_TICK;   /* Applied Volume */
//--- global variables
int      handle=INVALID_HANDLE;  // Indicator handle
int      ind_digits=0;           // Number of decimal places in the indicator values
string   ind_title;              // Indicator description
//--- variables for the panel
int      mouse_bar_index;        // Index of the bar the data is taken from
CDashboard *panel=NULL;          // Pointer to the panel object
Initialisierung
Einstellung der Werte der globalen Variablen für den Indikator und die Erstellung seines Handles:
//+------------------------------------------------------------------+
//| Expert initialization function                                   |
//+------------------------------------------------------------------+
int OnInit()
  {
//--- create timer
   EventSetTimer(60);

//--- Indicator
//--- Set the indicator name and the number of decimal places
   ind_title="BW MFI";
   ind_digits=Digits();
//--- Create indicator handle
   ResetLastError();
   handle=iBWMFI(Symbol(),PERIOD_CURRENT,InpVolume);
   if(handle==INVALID_HANDLE)
     {
      PrintFormat("%s: Failed to create indicator handle %s. Error %ld",__FUNCTION__,ind_title,GetLastError());
      return INIT_FAILED;
     }

//--- Successful initialization
   return(INIT_SUCCEEDED);
  }
Wenn der EA die Verwendung des Dashboards vorsieht, erstellen wir es hier:
//+------------------------------------------------------------------+
//| Expert initialization function                                   |
//+------------------------------------------------------------------+
int OnInit()
  {
//--- create timer
   EventSetTimer(60);

//--- Indicator
//--- Set the indicator name and the number of decimal places
   ind_title="BW MFI";
   ind_digits=Digits();
//--- Create indicator handle
   ResetLastError();
   handle=iBWMFI(Symbol(),PERIOD_CURRENT,InpVolume);
   if(handle==INVALID_HANDLE)
     {
      PrintFormat("%s: Failed to create indicator handle %s. Error %ld",__FUNCTION__,ind_title,GetLastError());
      return INIT_FAILED;
     }

//--- Dashboard
//--- Create the panel
   panel=new CDashboard(1,20,20,199,225);
   if(panel==NULL)
     {
      Print("Error. Failed to create panel object");
      return INIT_FAILED;
     }
//--- Set font parameters
   panel.SetFontParams("Calibri",9);
//--- Display the panel with the "Symbol, Timeframe description" header text
   panel.View(Symbol()+", "+StringSubstr(EnumToString(Period()),7));
//--- Create a table with ID 0 to display bar data in it
   panel.CreateNewTable(0);
//--- Draw a table with ID 0 on the panel background
   panel.DrawGrid(0,2,20,6,2,18,97);

//--- Create a table with ID 1 to display indicator data in it
   panel.CreateNewTable(1);
//--- Get the Y2 table coordinate with ID 0 and
//--- set the Y1 coordinate for the table with ID 1
   int y1=panel.TableY2(0)+22;
//--- Draw a table with ID 1 on the panel background
   panel.DrawGrid(1,2,y1,3,2,18,97);

//--- Display tabular data in the journal
   panel.GridPrint(0,2);
   panel.GridPrint(1,2);
//--- Initialize the variable with the index of the mouse cursor bar
   mouse_bar_index=0;
//--- Display the data of the current bar on the panel
   DrawData(mouse_bar_index,TimeCurrent());

//--- Successful initialization
   return(INIT_SUCCEEDED);
  }
Deinitialisierung
Freigabe des Indikator-Handles in OnDeinit() des EAs:
//+------------------------------------------------------------------+
//| Expert deinitialization function                                 |
//+------------------------------------------------------------------+
void OnDeinit(const int reason)
  {
//--- destroy timer
   EventKillTimer();

//--- Release handle of the indicator
   ResetLastError();
   if(!IndicatorRelease(handle))
      PrintFormat("%s: IndicatorRelease failed. Error %ld",__FUNCTION__,GetLastError());
//--- Clear all comments on the chart
   Comment("");
  }
Das erstellte Dashboard-Objekt wird bei der Verwendung des Dashboards entfernt:
//+------------------------------------------------------------------+
//| Expert deinitialization function                                 |
//+------------------------------------------------------------------+
void OnDeinit(const int reason)
  {
//--- destroy timer
   EventKillTimer();

//--- Release handle of the indicator
   ResetLastError();
   if(!IndicatorRelease(handle))
      PrintFormat("%s: IndicatorRelease failed. Error %ld",__FUNCTION__,GetLastError());
//--- Clear all comments on the chart
   Comment("");

//--- If the panel object exists, delete it
   if(panel!=NULL)
      delete panel;
  }
Abrufen von Daten
Im Folgenden werden die allgemeinen Funktionen zum Abrufen von Daten über das Indikator-Handle beschrieben. Die Funktionen wurden in dem Artikel über die Verbindung von Oszillatoren mit EAs beschrieben. Die vorgestellten Funktionen können in nutzerdefinierten Programmen im Prinzip unverändert verwendet werden:
//+------------------------------------------------------------------+
//| Return the indicator data on the specified bar                   |
//+------------------------------------------------------------------+
double IndicatorValue(const int ind_handle,const int index,const int buffer_num)
  {
   double array[1]={0};
   ResetLastError();
   if(CopyBuffer(ind_handle,buffer_num,index,1,array)!=1)
     {
      PrintFormat("%s: CopyBuffer failed. Error %ld",__FUNCTION__,GetLastError());
      return EMPTY_VALUE;
     }
   return array[0];
  }
//+------------------------------------------------------------------+
//| Return the state of the indicator line                           |
//+------------------------------------------------------------------+
ENUM_LINE_STATE LineState(const int ind_handle,const int index,const int buffer_num)
  {
//--- Get the values of the indicator line with the shift (0,1,2) relative to the passed index
   const double value0=IndicatorValue(ind_handle,index,  buffer_num);
   const double value1=IndicatorValue(ind_handle,index+1,buffer_num);
   const double value2=IndicatorValue(ind_handle,index+2,buffer_num);
//--- If at least one of the values could not be obtained, return an undefined value
   if(value0==EMPTY_VALUE || value1==EMPTY_VALUE || value2==EMPTY_VALUE)
      return LINE_STATE_NONE;
//--- Line upward reversal (value2>value1 && value0>value1)
   if(NormalizeDouble(value2-value1,ind_digits)>0 && NormalizeDouble(value0-value1,ind_digits)>0)
      return LINE_STATE_TURN_UP;
//--- Line upward direction (value2<=value1 && value0>value1)
   else if(NormalizeDouble(value2-value1,ind_digits)<=0 && NormalizeDouble(value0-value1,ind_digits)>0)
      return LINE_STATE_UP;
//--- Line upward stop (value2<=value1 && value0==value1)
   else if(NormalizeDouble(value2-value1,ind_digits)<=0 && NormalizeDouble(value0-value1,ind_digits)==0)
      return LINE_STATE_STOP_UP;
//--- Line downward reversal (value2<value1 && value0<value1)
   if(NormalizeDouble(value2-value1,ind_digits)<0 && NormalizeDouble(value0-value1,ind_digits)<0)
      return LINE_STATE_TURN_DOWN;
//--- Line downward direction (value2>=value1 && value0<value1)
   else if(NormalizeDouble(value2-value1,ind_digits)>=0 && NormalizeDouble(value0-value1,ind_digits)<0)
      return LINE_STATE_DOWN;
//--- Line downward stop (value2>=value1 && value0==value1)
   else if(NormalizeDouble(value2-value1,ind_digits)>=0 && NormalizeDouble(value0-value1,ind_digits)==0)
      return LINE_STATE_STOP_DOWN;
//--- Undefined state
   return LINE_STATE_NONE;
  }
//+------------------------------------------------------------------+
//| Return the state of the line relative to the specified level     |
//+------------------------------------------------------------------+
ENUM_LINE_STATE LineStateRelative(const int ind_handle,const int index,const int buffer_num,const double level0,const double level1=EMPTY_VALUE)
  {
//--- Get the values of the indicator line with the shift (0,1) relative to the passed index
   const double value0=IndicatorValue(ind_handle,index,  buffer_num);
   const double value1=IndicatorValue(ind_handle,index+1,buffer_num);
//--- If at least one of the values could not be obtained, return an undefined value
   if(value0==EMPTY_VALUE || value1==EMPTY_VALUE)
      return LINE_STATE_NONE;
//--- Define the second level to compare
   double level=(level1==EMPTY_VALUE ? level0 : level1);
//--- The line is below the level (value1<level && value0<level0)
   if(NormalizeDouble(value1-level,ind_digits)<0 && NormalizeDouble(value0-level0,ind_digits)<0)
      return LINE_STATE_UNDER;
//--- The line is above the level (value1>level && value0>level0)
   if(NormalizeDouble(value1-level,ind_digits)>0 && NormalizeDouble(value0-level0,ind_digits)>0)
      return LINE_STATE_ABOVE;
//--- The line crossed the level upwards (value1<=level && value0>level0)
   if(NormalizeDouble(value1-level,ind_digits)<=0 && NormalizeDouble(value0-level0,ind_digits)>0)
      return LINE_STATE_CROSS_UP;
//--- The line crossed the level downwards (value1>=level && value0<level0)
   if(NormalizeDouble(value1-level,ind_digits)>=0 && NormalizeDouble(value0-level0,ind_digits)<0)
      return LINE_STATE_CROSS_DOWN;
//--- The line touched the level from below (value1<level0 && value0==level0)
   if(NormalizeDouble(value1-level,ind_digits)<0 && NormalizeDouble(value0-level0,ind_digits)==0)
      return LINE_STATE_TOUCH_BELOW;
//--- The line touched the level from above (value1>level0 && value0==level0)
   if(NormalizeDouble(value1-level,ind_digits)>0 && NormalizeDouble(value0-level0,ind_digits)==0)
      return LINE_STATE_TOUCH_BELOW;
//--- Line is equal to the level value (value1==level0 && value0==level0)
   if(NormalizeDouble(value1-level,ind_digits)==0 && NormalizeDouble(value0-level0,ind_digits)==0)
      return LINE_STATE_EQUALS;
//--- Undefined state
   return LINE_STATE_NONE;
  }
//+------------------------------------------------------------------+
//| Return the indicator line state description                      |
//+------------------------------------------------------------------+
string LineStateDescription(const ENUM_LINE_STATE state)
  {
   switch(state)
     {
      case LINE_STATE_UP         :  return "Up";
      case LINE_STATE_STOP_UP    :  return "Stop Up";
      case LINE_STATE_TURN_UP    :  return "Turn Up";
      case LINE_STATE_DOWN       :  return "Down";
      case LINE_STATE_STOP_DOWN  :  return "Stop Down";
      case LINE_STATE_TURN_DOWN  :  return "Turn Down";
      case LINE_STATE_ABOVE      :  return "Above level";
      case LINE_STATE_UNDER      :  return "Under level";
      case LINE_STATE_CROSS_UP   :  return "Crossing Up";
      case LINE_STATE_CROSS_DOWN :  return "Crossing Down";
      case LINE_STATE_TOUCH_BELOW:  return "Touch from Below";
      case LINE_STATE_TOUCH_ABOVE:  return "Touch from Above";
      case LINE_STATE_EQUALS     :  return "Equals";
      default                    :  return "Unknown";
     }
  }
Wenn wir das Dashboard verwenden, werden die Daten mit Hilfe der Funktion auf dem Bedienfeld angezeigt:
//+------------------------------------------------------------------+
//| Display data from the specified timeseries index to the panel    |
//+------------------------------------------------------------------+
void DrawData(const int index,const datetime time)
  {
//--- Declare the variables to receive data in them
   MqlTick  tick={0};
   MqlRates rates[1];

//--- Exit if unable to get the current prices
   if(!SymbolInfoTick(Symbol(),tick))
      return;
//--- Exit if unable to get the bar data by the specified index
   if(CopyRates(Symbol(),PERIOD_CURRENT,index,1,rates)!=1)
      return;

//--- Set font parameters for bar and indicator data headers
   int  size=0;
   uint flags=0;
   uint angle=0;
   string name=panel.FontParams(size,flags,angle);
   panel.SetFontParams(name,9,FW_BOLD);
   panel.DrawText("Bar data ["+(string)index+"]",3,panel.TableY1(0)-16,clrMaroon,panel.Width()-6);
   panel.DrawText("Indicator data ["+(string)index+"]",3,panel.TableY1(1)-16,clrGreen,panel.Width()-6);
//--- Set font parameters for bar and indicator data
   panel.SetFontParams(name,9);

//--- Display the data of the specified bar in table 0 on the panel
   panel.DrawText("Date",  panel.CellX(0,0,0)+2, panel.CellY(0,0,0)+2); panel.DrawText(TimeToString(  rates[0].time,TIME_DATE),     panel.CellX(0,0,1)+2, panel.CellY(0,0,1)+2,clrNONE,90);
   panel.DrawText("Time",  panel.CellX(0,1,0)+2, panel.CellY(0,1,0)+2); panel.DrawText(TimeToString(  rates[0].time,TIME_MINUTES),  panel.CellX(0,1,1)+2, panel.CellY(0,1,1)+2,clrNONE,90);
   panel.DrawText("Open",  panel.CellX(0,2,0)+2, panel.CellY(0,2,0)+2); panel.DrawText(DoubleToString(rates[0].open,Digits()),      panel.CellX(0,2,1)+2, panel.CellY(0,2,1)+2,clrNONE,90);
   panel.DrawText("High",  panel.CellX(0,3,0)+2, panel.CellY(0,3,0)+2); panel.DrawText(DoubleToString(rates[0].high,Digits()),      panel.CellX(0,3,1)+2, panel.CellY(0,3,1)+2,clrNONE,90);
   panel.DrawText("Low",   panel.CellX(0,4,0)+2, panel.CellY(0,4,0)+2); panel.DrawText(DoubleToString(rates[0].low,Digits()),       panel.CellX(0,4,1)+2, panel.CellY(0,4,1)+2,clrNONE,90);
   panel.DrawText("Close", panel.CellX(0,5,0)+2, panel.CellY(0,5,0)+2); panel.DrawText(DoubleToString(rates[0].close,Digits()),     panel.CellX(0,5,1)+2, panel.CellY(0,5,1)+2,clrNONE,90);

//--- Display the indicator data from the specified bar on the panel in table 1
   panel.DrawText(ind_title, panel.CellX(1,0,0)+2, panel.CellY(1,0,0)+2);
   double value=IndicatorValue(handle,index,0);
   string value_str=(value!=EMPTY_VALUE ? DoubleToString(value,ind_digits) : "");
   panel.DrawText(value_str,panel.CellX(1,0,1)+2,panel.CellY(1,0,1)+2,clrNONE,90);

//--- Create Volumes indicator handle
   static bool create=false;
   static int hv=INVALID_HANDLE;
   if(!create)
     {
      ResetLastError();
      hv=iVolumes(Symbol(),PERIOD_CURRENT,InpVolume);
      if(hv==INVALID_HANDLE)
        {
         PrintFormat("%s: Failed to create indicator handle Volumes. Error %ld",__FUNCTION__,GetLastError());
         return;
        }
      create=true;
     }

//--- Get Volumes indicator status
   ENUM_LINE_STATE state_vol=LineState(hv,index,0);
//--- Display a description of the indicator line state
   panel.DrawText("BW MFI State", panel.CellX(1,1,0)+2, panel.CellY(1,1,0)+2);
   ENUM_LINE_STATE state=LineState(handle,index,0);
   color clr=clrNONE;
   string state_str=LineStateDescription(state);
   if((state==LINE_STATE_UP || state==LINE_STATE_TURN_UP) && (state_vol==LINE_STATE_UP || state_vol==LINE_STATE_TURN_UP))
     {
      state_str="MFI Up, Vol Up";
      clr=clrGreen;
     }
   if((state==LINE_STATE_DOWN || state==LINE_STATE_TURN_DOWN) && (state_vol==LINE_STATE_DOWN || state_vol==LINE_STATE_TURN_DOWN))
     {
      state_str="MFI Dn, Vol Dn";
      clr=clrSaddleBrown;
     }
   if((state==LINE_STATE_UP || state==LINE_STATE_TURN_UP) && (state_vol==LINE_STATE_DOWN || state_vol==LINE_STATE_TURN_DOWN))
     {
      state_str="MFI Up, Vol Dn";
      clr=clrBlue;
     }
   if((state==LINE_STATE_DOWN || state==LINE_STATE_TURN_DOWN) && (state_vol==LINE_STATE_UP || state_vol==LINE_STATE_TURN_UP))
     {
      state_str="MFI Dn, Vol Up";
      clr=clrLightCoral;
     }

//--- Set font parameters for indicator state data (bold font)
   name=panel.FontParams(size,flags,angle);
   panel.SetFontParams(name,9,FW_BOLD);
   panel.DrawText(state_str,panel.CellX(1,1,1)+2,panel.CellY(1,1,1)+2,clr,90);
//--- Restore the normal thickness of the panel font
   panel.SetFontParams(name,9);

//--- Redraw the chart to immediately display all changes on the panel
   ChartRedraw(ChartID());
  }
Die Daten der BW-MFI-Indikatoren können auf die übliche Weise - über die hier bereitgestellten universellen Funktionen - abgerufen werden. Um die Werte der Indikatorspalten zu interpretieren, benötigen wir jedoch einen weiteren Indikator - den Volumen-Indikator, denn um die Histogrammbalken spalten zu färben, werden zwei Indikatoren verglichen - der Wert der Histogrammbalken und der Volumenwert im Verhältnis zu ihren vorherigen Werten. Um das Volumen in der Funktion zu erhalten, erstellen Sie das Indikatorhandle für das Volumen (einmal beim ersten Zugriff) und vergleichen Sie die Zustände der Zeilen BW MFI und des Volumens. Eine Beschreibung ihrer gegenseitigen Beziehung wird als Text auf dem Panel angezeigt.
Außerdem wird bei der Verwendung des Dashboards das Handle für die Panel-Ereignisse in OnChartEvent() EA-Ereignishandler aufgerufen, und die Ereignisse für den Erhalt des Balkenindex unter dem Cursor werden behandelt:
//+------------------------------------------------------------------+
//| ChartEvent function                                              |
//+------------------------------------------------------------------+
void OnChartEvent(const int id,
                  const long &lparam,
                  const double &dparam,
                  const string &sparam)
  {
//--- Handling the panel
//--- Call the panel event handler
   panel.OnChartEvent(id,lparam,dparam,sparam);

//--- If the cursor moves or a click is made on the chart
   if(id==CHARTEVENT_MOUSE_MOVE || id==CHARTEVENT_CLICK)
     {
      //--- Declare the variables to record time and price coordinates in them
      datetime time=0;
      double price=0;
      int wnd=0;
      //--- If the cursor coordinates are converted to date and time
      if(ChartXYToTimePrice(ChartID(),(int)lparam,(int)dparam,wnd,time,price))
        {
         //--- write the bar index where the cursor is located to a global variable
         mouse_bar_index=iBarShift(Symbol(),PERIOD_CURRENT,time);
         //--- Display the bar data under the cursor on the panel
         DrawData(mouse_bar_index,time);
        }
     }

//--- If we received a custom event, display the appropriate message in the journal
   if(id>CHARTEVENT_CUSTOM)
     {
      //--- Here we can implement handling a click on the close button on the panel
      PrintFormat("%s: Event id=%ld, object id (lparam): %lu, event message (sparam): %s",__FUNCTION__,id,lparam,sparam);
     }
  }
Nachdem wir den EA kompiliert und auf dem Chart gestartet haben, können wir den Status des Indikatorwertes und der Linie auf dem Panel überwachen:
Sie können den Test EA TestWilliamsBWMFI.mq5 in den an den Artikel angehängten Dateien ansehen.
Verfeinerung der Dashboard-Klassen. Durchsuchen
In den Test-EAs in dieser Serie verwenden wir das im ersten Artikel erstellte Dashboard. Es war möglich, eine Tabelle im Panel zu erstellen. Die Koordinaten der Tabelle können zur Anzeige von Daten auf dem Dashboard verwendet werden. Jetzt sind die Dashboard-Klassen fertiggestellt - Sie können eine beliebige Anzahl von Tabellen erstellen, um Daten darin zu platzieren. Ich habe auch das vorübergehende Verschwinden der Dashboard-Daten nach dem Zusammenklappen des Dashboards, dem Wechseln eines Zeitrahmens und dem erneuten Erweitern des Dashboards behoben. Gehen wir kurz auf die vorgenommenen Änderungen ein, um nicht auf das Thema der Änderungen an den Dashboard-Klassen zurückzukommen.
Jetzt kann jede erstellte Tabelle auf der Tafel ihre Koordinaten zurückgeben: X1, Y1 — obere linke Ecke, X2 und Y2 — untere rechte Ecke. Jedem Schild wird eine eigene ID und ein Name zugewiesen, über die Sie Daten abrufen können.
Die Tabellendatenklasse CTableData verfügt jetzt über private Variablen und öffentliche Methoden zum Schreiben und Zurückgeben dieser Werte:
//+------------------------------------------------------------------+
//| Table data class                                                 |
//+------------------------------------------------------------------+
class CTableData : public CObject
  {
private:
   CArrayObj         m_list_rows;               // List of rows
   uint              m_id;                      // Table ID
   int               m_x1;                      // X1 coordinate
   int               m_y1;                      // Y1 coordinate
   int               m_x2;                      // X2 coordinate
   int               m_y2;                      // Y2 coordinate
   int               m_w;                       // Width
   int               m_h;                       // Height
   string            m_name;                    // Table name
public:
//--- Set table name
   void              SetName(const string name) { this.m_name=name;              }
//--- Return table (1) ID and (2) name
   uint              ID(void)             const { return this.m_id;              }
   string            Name(void)           const { return this.m_name;            }

//--- Set coordinate (1) X1, (2) X2
   void              SetX1(const uint x1)       { this.m_x1=(int)x1;             }
   void              SetX2(const uint x2)       { this.m_x2=(int)x2;             }
//--- Set coordinate (1) Y1, (2) Y2
   void              SetY1(const uint y1)       { this.m_y1=(int)y1;             }
   void              SetY2(const uint y2)       { this.m_y2=(int)y2;             }
//--- Set table coordinates
   void              SetCoords(const int x1,const int y1,const int x2,const int y2)
                       {
                        this.SetX1(x1);
                        this.SetY1(y1);
                        this.SetX2(x2);
                        this.SetY2(y2);
                       }

//--- Return coordinate (1) X1, (2) X2
   int               X1(void)             const { return this.m_x1;              }
   int               X2(void)             const { return this.m_x2;              }
//--- Return coordinate (1) Y1, (2) Y2
   int               Y1(void)             const { return this.m_y1;              }
   int               Y2(void)             const { return this.m_y2;              }

//--- Return (1) width and (2) height
   int               Width(void)          const { return this.m_x2-this.m_x1+1;  }
   int               Height(void)         const { return this.m_y2-this.m_y1+1;  }

//--- Return the list of table rows
Es wurde eine öffentliche Methode hinzugefügt, die die Anzahl der Zellen in der angegebenen Zeile zurückgibt:
   int               ColumnsInRow(const int row_index)
                       {
                        //--- If there is no row in the list, return 0
                        if(this.RowsTotal()==0)
                           return 0;
                        //--- Get a pointer to the specified row and return the number of cells in it
                        CTableRow *row=this.GetRow(row_index);
                        return(row!=NULL ? row.CellsTotal() : 0);
                       }
//--- Return the total number of cells in the table
Es wurde eine öffentliche Methode hinzugefügt, die die Gesamtzahl der Tabellenzellen zurückgibt:
//--- Return the total number of cells in the table
   int               CellsTotal(void)
                       {
                        //--- If there is no row in the list, return 0
                        if(this.RowsTotal()==0)
                           return 0;
                        //---
                        int num=0;
                        int total=this.RowsTotal();
                        for(int i=0;i<total;i++)
                           num+=this.ColumnsInRow(i);
                        return num;
                       }
//--- Clear lists of rows and table cells
Bisher haben wir einfach die Anzahl der Spalten in der ersten Zeile der Tabelle zurückgegeben, in der Hoffnung, dass ihre Anzahl in jeder Zeile gleich ist. Jetzt können wir die Gesamtzahl der Tabellenzellen ermitteln - durch die Anzahl der Zellen in jeder Zeile der Tabelle. Wir können auch eine Anzahl von Zellen in einer bestimmten Zeile ermitteln. So ist es möglich, nicht-gitterförmige Tabellen zu erstellen. Die Erstellung von Tabellen mit einer unterschiedlichen Anzahl von Zellen in den Zeilen wurde mangels Nachfrage in den aktuellen Aufgaben nicht getestet. Höchstwahrscheinlich werden zusätzliche Verbesserungen erforderlich sein. Aber im Moment gibt es keinen Bedarf für solche Tabellen.
Die Klasse verfügt über die virtuelle Compare-Methode, mit der wir Tabellen anhand von IDs (Modus = 0) oder Namen (Modus != 0) vergleichen können:
//--- Virtual method for comparing two objects
   virtual int       Compare(const CObject *node,const int mode=0) const
                       {
                        const CTableData *compared=node;
                        if(mode==0)
                           return(this.ID()>compared.ID() ? 1 : this.ID()<compared.ID() ? -1 : 0);
                        else
                           return(this.Name()==compared.Name() ? 0 : this.Name()>compared.Name() ? 1 : -1);
                       }
Die ID der erstellten Tabelle wird nun an den parametrischen Konstruktor der Klasse übergeben:
//--- Constructor/destructor
                     CTableData(const uint id) : m_id(id){ this.m_list_rows.Clear(); this.m_name="";  }
                    ~CTableData(void)                    { this.m_list_rows.Clear();                  }
Während die Instanz des Tabellendatenobjekts zuvor in der Panel-Klasse deklariert wurde, deklarieren wir jetzt die Liste, um Zeiger auf die im Panel erstellten Tabellen zu enthalten.
//+------------------------------------------------------------------+
//| Dashboard class                                                  |
//+------------------------------------------------------------------+
class CDashboard : public CObject
  {
private:
   CCanvas           m_canvas;                  // Canvas
   CCanvas           m_workspace;               // Work space
   CArrayObj         m_list_table;              // List of tables
   ENUM_PROGRAM_TYPE m_program_type;            // Program type
   ENUM_MOUSE_STATE  m_mouse_state;             // Mouse button status
Die Variablen werden zur Erstellung von Dateinamen für die Speicherung von Hintergrund- und Arbeitsbereichspixeln in einer Datei im privaten Bereich deklariert:
   string            m_name_gv_m;               // Name of the global terminal variable storing the collapsed panel flag

   string            m_name_gv_u;               // Name of the global terminal variable storing the flag of the pinned panel
   string            m_filename_bg;             // File name to save background pixels
   string            m_filename_ws;             // File name for saving work space pixels

   uint              m_array_wpx[];             // Array of pixels to save/restore the workspace
   uint              m_array_ppx[];             // Array of pixels to save/restore the panel background
Hinzufügen und Verbessern der Methoden für die Arbeit mit Panel-Schriften sowie für das Erstellen und Abrufen von Tabellen und deren Koordinaten:
//--- Set default panel font parameters
   void              SetFontParams(const string name,const int size,const uint flags=0,const uint angle=0);
//--- Return the specified dashboard font parameters
   string            FontParams(int &size,uint &flags,uint &angle);
//--- Return the specified panel (1) font, (2) size and font flags
   string            FontName(void)    const { return this.m_workspace.FontNameGet();  }
   int               FontSize(void)    const { return this.m_workspace.FontSizeGet();  }
   uint              FontFlags(void)   const { return this.m_workspace.FontFlagsGet(); }
//--- Display a text message at the specified coordinates
   void              DrawText(const string text,const int x,const int y,const color clr=clrNONE,const int width=WRONG_VALUE,const int height=WRONG_VALUE);
//--- Create a new table
   bool              CreateNewTable(const int id=WRONG_VALUE);
//--- Return tabular data object by (1) ID and (2) name
   CTableData       *GetTable(const uint id);
   CTableData       *GetTable(const string name);
//--- Draw a (1) background grid (2) with automatic cell size
   void              DrawGrid(const uint table_id,const uint x,const uint y,const uint rows,const uint columns,const uint row_size,const uint col_size,const color line_color=clrNONE,bool alternating_color=true);
   void              DrawGridAutoFill(const uint table_id,const uint border,const uint rows,const uint columns,const color line_color=clrNONE,bool alternating_color=true);
//--- Print grid data (line intersection coordinates)
   void              GridPrint(const uint table_id,const uint indent=0)
                       {
                        CTableData *table=this.GetTable(table_id);
                        if(table==NULL)
                          {
                           ::PrintFormat("%s: Error. Failed to get table object with id %lu",__FUNCTION__,table_id);
                           return;
                          }
                        table.Print(indent);
                       }
//--- Write the X and Y coordinate values of the specified table cell to variables
   void              CellXY(const uint table_id,const uint row,const uint column, int &x, int &y)
                       {
                        CTableData *table=this.GetTable(table_id);
                        if(table==NULL)
                          {
                           ::PrintFormat("%s: Error. Failed to get table object with id %lu",__FUNCTION__,table_id);
                           return;
                          }
                        table.CellXY(row,column,x,y);
                       }
//--- Return the (1) X and (2) Y coordinate of the specified table cell
   int               CellX(const uint table_id,const uint row,const uint column)
                       {
                        CTableData *table=this.GetTable(table_id);
                        if(table==NULL)
                          {
                           ::PrintFormat("%s: Error. Failed to get table object with id %lu",__FUNCTION__,table_id);
                           return WRONG_VALUE;
                          }
                        return table.CellX(row,column);
                       }
   int               CellY(const uint table_id,const uint row,const uint column)
                       {
                        CTableData *table=this.GetTable(table_id);
                        if(table==NULL)
                          {
                           ::PrintFormat("%s: Error. Failed to get table object with id %lu",__FUNCTION__,table_id);
                           return WRONG_VALUE;
                          }
                        return table.CellY(row,column);
                       }
//--- Write X1 and Y1, X2 and Y2 coordinate values of the specified table to the variables
   void              TableCoords(const uint table_id,int &x1,int &y1,int &x2,int &y2)
                       {
                        x1=y1=x2=y2=WRONG_VALUE;
                        CTableData *table=this.GetTable(table_id);
                        if(table==NULL)
                           return;
                        x1=table.X1();
                        y1=table.Y1();
                        x2=table.X2();
                        y2=table.Y2();
                       }

//--- Return the (1) X1, (2) Y1, (3) X2 and (4) Y2 coordinate of the specified table
   int               TableX1(const uint table_id)
                       {
                        CTableData *table=this.GetTable(table_id);
                        return(table!=NULL ? table.X1() : WRONG_VALUE);
                       }
   int               TableY1(const uint table_id)
                       {
                        CTableData *table=this.GetTable(table_id);
                        return(table!=NULL ? table.Y1() : WRONG_VALUE);
                       }
   int               TableX2(const uint table_id)
                       {
                        CTableData *table=this.GetTable(table_id);
                        return(table!=NULL ? table.X2() : WRONG_VALUE);
                       }
   int               TableY2(const uint table_id)
                       {
                        CTableData *table=this.GetTable(table_id);
                        return(table!=NULL ? table.Y2() : WRONG_VALUE);
                       }

//--- Event handler
   void              OnChartEvent(const int id,const long &lparam,const double &dparam,const string &sparam);
//--- Constructor/destructor
                     CDashboard(const uint id,const int x,const int y, const int w,const int h,const int wnd=-1);
                    ~CDashboard();
Im Klassenkonstruktor werden die Dateinamen für die Speicherung des Hintergrunds und der Arbeitsfläche erstellt:
//--- Set the names of global terminal variables to store panel coordinates, collapsed/expanded state and pinning
   this.m_name_gv_x=this.m_program_name+"_id_"+(string)this.m_id+"_"+(string)this.m_chart_id+"_X";
   this.m_name_gv_y=this.m_program_name+"_id_"+(string)this.m_id+"_"+(string)this.m_chart_id+"_Y";
   this.m_name_gv_m=this.m_program_name+"_id_"+(string)this.m_id+"_"+(string)this.m_chart_id+"_Minimize";
   this.m_name_gv_u=this.m_program_name+"_id_"+(string)this.m_id+"_"+(string)this.m_chart_id+"_Unpin";

//--- Set file names for saving background and work space pixels
   this.m_filename_bg=this.m_program_name+"\\Dashboard"+(string)this.m_id+"\\background.bin";
   this.m_filename_ws=this.m_program_name+"\\Dashboard"+(string)this.m_id+"\\workspace.bin";
Ganz am Ende des Konstruktors, wenn das Panel zusammengeklappt ist, werden die Daten aus den Dateien in die Hintergrund- und Arbeitsbereichspixelarrays geladen:
//--- If the panel collapse flag is set, load the background and work space pixels from the files into arrays
   if(this.m_minimized)
     {
      if(::FileIsExist(this.m_filename_bg))
         this.FileLoadBackground();
      if(::FileIsExist(this.m_filename_ws))
         this.FileLoadWorkspace();
     }
  }
Wenn also die Pixel zuvor in Dateien gespeichert wurden und das Panel in minimierter Form erstellt wird, wird das Aussehen des Panels aus den Dateien geladen und das Panel in eingeklappter Form gezeichnet. Wenn es erweitert wird, wird sein Aussehen aus den aus den Dateien gefüllten Pixelarrays gewonnen.
Wenn das Panel im Destruktor zusammengeklappt ist, müssen wir es vor dem Löschen der Panel-Objekte ausklappen, die Pixeldaten in die Dateien schreiben und es wieder zusammenklappen. Danach können wir Panel-Objekte löschen - ihr Aussehen ist bereits in den Dateien gespeichert und kann bei der späteren Erstellung im Konstruktor wiederhergestellt werden:
//+------------------------------------------------------------------+
//| Destructor                                                       |
//+------------------------------------------------------------------+
CDashboard::~CDashboard()
  {
//--- Write the current values to global terminal variables
   ::GlobalVariableSet(this.m_name_gv_x,this.m_x);
   ::GlobalVariableSet(this.m_name_gv_y,this.m_y);
   ::GlobalVariableSet(this.m_name_gv_m,this.m_minimized);
   ::GlobalVariableSet(this.m_name_gv_u,this.m_movable);

//--- If the panel is collapsed,
//--- expand the panel, save the appearance into pixel arrays and collapse the panel
   if(this.m_minimized)
     {
      this.Expand();
      this.SaveBackground();
      this.SaveWorkspace();
      this.Collapse();
     }
//--- otherwise, if the panel is expanded,
//--- save the appearance into pixel arrays
   else
     {
      this.SaveBackground();
      this.SaveWorkspace();
     }
//--- Save pixel arrays to files
   this.FileSaveBackground();
   this.FileSaveWorkspace();

//--- Delete panel objects
   this.m_canvas.Destroy();
   this.m_workspace.Destroy();
  }
Im Block für die Behandlung von Klicks auf die Schaltfläche zum Zusammenklappen/Erweitern des Panels markieren wir das Flag und speichern den Hintergrund und die Arbeitsfläche in Pixelarrays, wenn das Panel erweitert ist:
      //--- If the panel collapse/expand button is pressed
      else if(state==MOUSE_STATE_PRESSED_INSIDE_MINIMIZE)
        {
         //--- Disable chart scrolling, right-click menu and crosshair
         this.SetChartsTool(false);
         //--- If the panel is not collapsed, save the background and work space into pixel arrays
         if(!this.m_minimized)
           {
            this.SaveWorkspace();
            this.SaveBackground();
           }
         //--- "flip" the panel collapse flag,
         this.m_minimized=!this.m_minimized;
         //--- redraw the panel taking into account the new state of the flag,
         this.Draw(this.m_title);
         //--- redraw the panel header area
         this.RedrawHeaderArea();
         //--- If the panel is pinned and expanded, move it to the stored location coordinates
         if(this.m_minimized && !this.m_movable)
            this.Move(this.m_x_dock,this.m_y_dock);
         //--- Update the canvas with chart redrawing and
         this.m_canvas.Update();
         //--- write the state of the panel expand flag to the global terminal variable
         ::GlobalVariableSet(this.m_name_gv_m,this.m_minimized);
        }
Die Zeichenketten zum Speichern des Pixelarrays wurden aus der Methode zum Zusammenklappen des Panels entfernt. Das Speichern von Pixeln erfolgt jetzt nur noch beim Drücken der Schaltfläche Minimieren/Erweitern:
//+------------------------------------------------------------------+
//| Collapse the panel                                               |
//+------------------------------------------------------------------+
void CDashboard::Collapse(void)
  {
//--- Save the pixels of the working space and the panel background into arrays
   this.SaveWorkspace();
   this.SaveBackground();
//--- Remember the current height of the panel
   int h=this.m_h;
//--- Change the dimensions (height) of the canvas and working space
   if(!this.SetSizes(this.m_canvas.Width(),this.m_header_h))
      return;
//--- Draw the header area
   this.DrawHeaderArea(this.m_title);
//--- Return the saved panel height to the variable
   this.m_h=h;
  }
Implementierung einer Methode, die den Satz Dashboard-Schriftparameter zurückgibt:
//+------------------------------------------------------------------+
//| Return the specified dashboard font parameters                   |
//+------------------------------------------------------------------+
string CDashboard::FontParams(int &size,uint &flags,uint &angle)
  {
   size=this.m_workspace.FontSizeGet();
   flags=this.m_workspace.FontFlagsGet();
   angle=this.m_workspace.FontAngleGet();
   return this.m_workspace.FontNameGet();
  }
Die Methode gibt den Namen der Schriftart zurück. Die Schriftgröße, ihre Flags und der Winkel werden in die Variablen geschrieben, die durch den Link übergeben werden.
Die Textfarbe wird nun auch an die Zeichenmethode übergeben. Der Standardwert ist clrNONE, d. h. die zuvor eingestellte Textfarbe:
//+------------------------------------------------------------------+
//| Display a text message at the specified coordinates              |
//+------------------------------------------------------------------+
void CDashboard::DrawText(const string text,const int x,const int y,const color clr=clrNONE,const int width=WRONG_VALUE,const int height=WRONG_VALUE)
  {
//--- Declare variables to record the text width and height in them
   int w=width;
   int h=height;
//--- If the width and height of the text passed to the method have zero values,
//--- then the entire working space is completely cleared using the transparent color
   if(width==0 && height==0)
      this.m_workspace.Erase(0x00FFFFFF);
//--- Otherwise
   else
     {
      //--- If the passed width and height have default values (-1), we get its width and height from the text
      if(width==WRONG_VALUE && height==WRONG_VALUE)
         this.m_workspace.TextSize(text,w,h);
      //--- otherwise,
      else
        {
         //--- if the width passed to the method has the default value (-1) - get the width from the text, or
         //--- if the width passed to the method has a value greater than zero, use the width passed to the method, or
         //--- if the width passed to the method has a zero value, use the value 1 for the width
         w=(width ==WRONG_VALUE ? this.m_workspace.TextWidth(text)  : width>0  ? width  : 1);
         //--- if the height passed to the method has a default value (-1), get the height from the text, or
         //--- if the height passed to the method has a value greater than zero, use the height passed to the method, or
         //--- if the height passed to the method has a zero value, use value 1 for the height
         h=(height==WRONG_VALUE ? this.m_workspace.TextHeight(text) : height>0 ? height : 1);
        }
      //--- Fill the space according to the specified coordinates and the resulting width and height with a transparent color (erase the previous entry)
      this.m_workspace.FillRectangle(x,y,x+w,y+h,0x00FFFFFF);
     }
//--- Display the text to the space cleared of previous text and update the working space without redrawing the screen
   this.m_workspace.TextOut(x,y,text,::ColorToARGB(clr==clrNONE ? this.m_fore_color : clr));
   this.m_workspace.Update(false);
  }
Implementierung von Methoden zum Erstellen einer neuen Tabelle und zum Abrufen von Tabellendaten nach ID und Tabellenname:
//+------------------------------------------------------------------+
//| Create a new table                                               |
//+------------------------------------------------------------------+
bool CDashboard::CreateNewTable(const int id=WRONG_VALUE)
  {
   uint num=(id>WRONG_VALUE ? id : this.m_list_table.Total());
   CTableData *table=new CTableData(num);
   this.m_list_table.Sort();
   if(this.m_list_table.Search(table)!=WRONG_VALUE)
     {
      PrintFormat("%s: Error. Table with id %lu already exists in the list",__FUNCTION__,num);
      delete table;
      return false;
     }
   if(!this.m_list_table.Add(table))
     {
      PrintFormat("%s: Error. Failed to add table with id %lu to the list",__FUNCTION__,num);
      delete table;
      return false;
     }
   return true;
  }
//+------------------------------------------------------------------+
//| Return tabular data object by ID                                 |
//+------------------------------------------------------------------+
CTableData *CDashboard::GetTable(const uint id)
  {
   if(this.m_list_table.Total()==0)
     {
      PrintFormat("%s: Error. The list of tables is empty. First you need to create a table using CreateNewTable",__FUNCTION__);
      .return NULL;
     }
   CTableData *table=new CTableData(id);
   if(table==NULL)
     {
      ::PrintFormat("%s: Error. Failed to create table object with id %lu",__FUNCTION__,id);
      .return NULL;
     }
   this.m_list_table.Sort();
   int index=this.m_list_table.Search(table);
   delete table;
   return this.m_list_table.At(index);
  }
//+------------------------------------------------------------------+
//| Return tabular data object by name                               |
//+------------------------------------------------------------------+
CTableData *CDashboard::GetTable(const string name)
  {
   if(this.m_list_table.Total()==0)
     {
      PrintFormat("%s: Error. The list of tables is empty. First you need to create a table using CreateNewTable",__FUNCTION__);
      .return NULL;
     }
   CTableData *table=new CTableData(0);
   if(table==NULL)
     {
      ::PrintFormat("%s: Error. Failed to create table object");
      .return NULL;
     }
   table.SetName(name);
   this.m_list_table.Sort(1);
   int index=this.m_list_table.Search(table);
   delete table;
   return this.m_list_table.At(index);
  }
Änderungen bei den Methoden zum Zeichnen von Tabellen:
//+------------------------------------------------------------------+
//| Draw the background grid                                         |
//+------------------------------------------------------------------+
void CDashboard::DrawGrid(const uint table_id,
                          const uint x,const uint y,const uint rows,const uint columns,const uint row_size,const uint col_size,
                          const color line_color=clrNONE,bool alternating_color=true)
  {
//--- Get a table object by ID
   CTableData *table=this.GetTable(table_id);
   if(table==NULL)
     {
      PrintFormat("%s: Error. Failed to get table object with id %lu",__FUNCTION__,table_id);
      return;
     }
//--- Clear all lists of the tabular data object (remove cells from rows and all rows)
   table.Clear();
//--- Line height cannot be less than 2
   int row_h=int(row_size<2 ? 2 : row_size);
//--- Column width cannot be less than 2
   int col_w=int(col_size<2 ? 2 : col_size);

//--- The X1 (left) coordinate of the table cannot be less than 1 (to leave one pixel around the perimeter of the panel for the frame)
   int x1=int(x<1 ? 1 : x);
//--- Calculate the X2 coordinate (right) depending on the number of columns and their width
   int x2=x1+col_w*int(columns>0 ? columns : 1);
//--- The Y1 coordinate is located under the panel title area
   int y1=this.m_header_h+(int)y;
//--- Calculate the Y2 coordinate (bottom) depending on the number of lines and their height
   int y2=y1+row_h*int(rows>0 ? rows : 1);
//--- Set table coordinates
   table.SetCoords(x1,y1-this.m_header_h,x2,y2-this.m_header_h);

//--- Get the color of the table grid lines, either by default or passed to the method
   color clr=(line_color==clrNONE ? C'200,200,200' : line_color);
//--- If the initial X coordinate is greater than 1, draw a table frame
//--- (in case of the coordinate 1, the table frame is the panel frame)
   if(x1>1)
      this.m_canvas.Rectangle(x1,y1,x2,y2,::ColorToARGB(clr,this.m_alpha));
//--- In the loop by table rows,
   for(int i=0;i<(int)rows;i++)
     {
      //--- calculate the Y coordinate of the next horizontal grid line (Y coordinate of the next table row)
      int row_y=y1+row_h*i;
      //--- if the flag of "alternating" line colors is passed and the line is even
      if(alternating_color && i%2==0)
        {
         //--- lighten the table background color and draw a background rectangle
         color new_color=this.NewColor(clr,45,45,45);
         this.m_canvas.FillRectangle(x1+1,row_y+1,x2-1,row_y+row_h-1,::ColorToARGB(new_color,this.m_alpha));
        }
      //--- Draw a table grid horizontal line
      this.m_canvas.Line(x1,row_y,x2,row_y,::ColorToARGB(clr,this.m_alpha));

      //--- Create a new table row object
      CTableRow *row_obj=new CTableRow(i);
      if(row_obj==NULL)
        {
         ::PrintFormat("%s: Failed to create table row object at index %lu",(string)__FUNCTION__,i);
         continue;
        }
      //--- Add it to the list of rows of the tabular data object
      //--- (if adding an object failed, delete the created object)
      if(!table.AddRow(row_obj))
         delete row_obj;
      //--- Set its Y coordinate in the created row object taking into account the offset from the panel title
      row_obj.SetY(row_y-this.m_header_h);
     }

//--- In the loop by table columns,
   for(int i=0;i<(int)columns;i++)
     {
      //--- calculate the X coordinate of the next vertical grid line (X coordinate of the next table row)
      int col_x=x1+col_w*i;
      //--- If the grid line goes beyond the panel, interrupt the loop
      if(x1==1 && col_x>=x1+m_canvas.Width()-2)
         break;
      //--- Draw a vertical line of the table grid
      this.m_canvas.Line(col_x,y1,col_x,y2,::ColorToARGB(clr,this.m_alpha));

      //--- Get the number of created rows from the table data object
      int total=table.RowsTotal();
      //--- In the loop by table rows
      for(int j=0;j<total;j++)
        {
         //--- get the next row
         CTableRow *row=table.GetRow(j);
         if(row==NULL)
            continue;
         //--- Create a new table cell
         CTableCell *cell=new CTableCell(row.Row(),i);
         if(cell==NULL)
           {
            ::PrintFormat("%s: Failed to create table cell object at index %lu",(string)__FUNCTION__,i);
            continue;
           }
         //--- Add the created cell to the row
         //--- (if adding an object failed, delete the created object)
         if(!row.AddCell(cell))
           {
            delete cell;
            continue;
           }
         //--- In the created cell object, set its X coordinate and the Y coordinate from the row object
         cell.SetXY(col_x,row.Y());
        }
     }
//--- Update the canvas without redrawing the chart
   this.m_canvas.Update(false);
  }
//+------------------------------------------------------------------+
//| Draws the background grid with automatic cell sizing             |
//+------------------------------------------------------------------+
void CDashboard::DrawGridAutoFill(const uint table_id,const uint border,const uint rows,const uint columns,const color line_color=clrNONE,bool alternating_color=true)
  {
//--- Get a table object by ID
   CTableData *table=this.GetTable(table_id);
   if(table==NULL)
     {
      PrintFormat("%s: Error. Failed to get table object with id %lu",__FUNCTION__,table_id);
      return;
     }
//--- X1 (left) table coordinate
   int x1=(int)border;
//--- X2 (right) table coordinate
   int x2=this.m_canvas.Width()-(int)border-1;
//--- Y1 (upper) table coordinate
   int y1=this.m_header_h+(int)border;
//--- Y2 (lower) table coordinate
   int y2=this.m_canvas.Height()-(int)border-1;
//--- Set table coordinates
   table.SetCoords(x1,y1,x2,y2);

//--- Get the color of the table grid lines, either by default or passed to the method
   color clr=(line_color==clrNONE ? C'200,200,200' : line_color);
//--- If the offset from the edge of the panel is greater than zero, draw a table border,
//--- otherwise, the panel border is used as the table border
   if(border>0)
      this.m_canvas.Rectangle(x1,y1,x2,y2,::ColorToARGB(clr,this.m_alpha));

//--- Height of the entire table grid
   int greed_h=y2-y1;
//--- Calculate the row height depending on the table height and the number of rows
   int row_h=(int)::round((double)greed_h/(double)rows);
//--- In the loop based on the number of rows
   for(int i=0;i<(int)rows;i++)
     {
      //--- calculate the Y coordinate of the next horizontal grid line (Y coordinate of the next table row)
      int row_y=y1+row_h*i;
      //--- if the flag of "alternating" line colors is passed and the line is even
      if(alternating_color && i%2==0)
        {
         //--- lighten the table background color and draw a background rectangle
         color new_color=this.NewColor(clr,45,45,45);
         this.m_canvas.FillRectangle(x1+1,row_y+1,x2-1,row_y+row_h-1,::ColorToARGB(new_color,this.m_alpha));
        }
      //--- Draw a table grid horizontal line
      this.m_canvas.Line(x1,row_y,x2,row_y,::ColorToARGB(clr,this.m_alpha));

      //--- Create a new table row object
      CTableRow *row_obj=new CTableRow(i);
      if(row_obj==NULL)
        {
         ::PrintFormat("%s: Failed to create table row object at index %lu",(string)__FUNCTION__,i);
         continue;
        }
      //--- Add it to the list of rows of the tabular data object
      //--- (if adding an object failed, delete the created object)
      if(!table.AddRow(row_obj))
         delete row_obj;
      //--- Set its Y coordinate in the created row object taking into account the offset from the panel title
      row_obj.SetY(row_y-this.m_header_h);
     }

//--- Table grid width
   int greed_w=x2-x1;
//--- Calculate the column width depending on the table width and the number of columns
   int col_w=(int)::round((double)greed_w/(double)columns);
//--- In the loop by table columns,
   for(int i=0;i<(int)columns;i++)
     {
      //--- calculate the X coordinate of the next vertical grid line (X coordinate of the next table row)
      int col_x=x1+col_w*i;
      //--- If this is not the very first vertical line, draw it
      //--- (the first vertical line is either the table frame or the panel frame)
      if(i>0)
         this.m_canvas.Line(col_x,y1,col_x,y2,::ColorToARGB(clr,this.m_alpha));

      //--- Get the number of created rows from the table data object
      int total=table.RowsTotal();
      //--- In the loop by table rows
      for(int j=0;j<total;j++)
        {
         //--- get the next row
         CTableRow *row=table.GetRow(j);
         if(row==NULL)
            continue;
         //--- Create a new table cell
         CTableCell *cell=new CTableCell(row.Row(),i);
         if(cell==NULL)
           {
            ::PrintFormat("%s: Failed to create table cell object at index %lu",(string)__FUNCTION__,i);
            continue;
           }
         //--- Add the created cell to the row
         //--- (if adding an object failed, delete the created object)
         if(!row.AddCell(cell))
           {
            delete cell;
            continue;
           }
         //--- In the created cell object, set its X coordinate and the Y coordinate from the row object
         cell.SetXY(col_x,row.Y());
        }
     }
//--- Update the canvas without redrawing the chart
   this.m_canvas.Update(false);
  }
Die Methoden zum Speichern/Laden von Pixeln in/aus der Datei verwenden nun die zuvor im Konstruktor erstellten Dateinamen:
//+------------------------------------------------------------------+
//| Save the pixel array of the working space to a file              |
//+------------------------------------------------------------------+
bool CDashboard::FileSaveWorkspace(void)
  {
//--- If the saved array is empty, inform of that and return 'false'
   if(this.m_array_wpx.Size()==0)
     {
      ::PrintFormat("%s: Error. The workspace pixel array is empty.",__FUNCTION__);
      return false;
     }
//--- If the array could not be saved to a file, report this and return 'false'
   if(!::FileSave(this.m_filename_ws,this.m_array_wpx))
     {
      ::PrintFormat("%s: FileSave '%s' failed. Error %lu",__FUNCTION__,this.m_filename_ws,::GetLastError());
      return false;
     }
//--- Successful, return 'true'
   return true;
  }
//+------------------------------------------------------------------+
//| Save the pixel array of the panel background to a file           |
//+------------------------------------------------------------------+
bool CDashboard::FileSaveBackground(void)
  {
//--- If the saved array is empty, inform of that and return 'false'
   if(this.m_array_ppx.Size()==0)
     {
      ::PrintFormat("%s: Error. The background pixel array is empty.",__FUNCTION__);
      return false;
     }
//--- If the array could not be saved to a file, report this and return 'false'
   if(!::FileSave(this.m_filename_bg,this.m_array_ppx))
     {
      ::PrintFormat("%s: FileSave '%s' failed. Error %lu",__FUNCTION__,this.m_filename_bg,::GetLastError());
      return false;
     }
//--- Successful, return 'true'
   return true;
  }
//+------------------------------------------------------------------+
//| Upload the array of working space pixels from a file             |
//+------------------------------------------------------------------+
bool CDashboard::FileLoadWorkspace(void)
  {
//--- If failed to upload data from the file into the array, report this and return 'false'
   if(::FileLoad(this.m_filename_ws,this.m_array_wpx)==WRONG_VALUE)
     {
      ::PrintFormat("%s: FileLoad '%s' failed. Error %lu",__FUNCTION__,this.m_filename_ws,::GetLastError());
      return false;
     }
//--- Successful, return 'true'
   return true;
  }
//+------------------------------------------------------------------+
//| Upload the array of panel background pixels from a file          |
//+------------------------------------------------------------------+
bool CDashboard::FileLoadBackground(void)
  {
   if(::FileLoad(this.m_filename_bg,this.m_array_ppx)==WRONG_VALUE)
     {
      ::PrintFormat("%s: FileLoad '%s' failed. Error %lu",__FUNCTION__,this.m_filename_bg,::GetLastError());
      return false;
     }
//--- Successful, return 'true'
   return true;
  }
Schlussfolgerung
In diesem Artikel haben wir uns die Verbindung zu Volumes und Bill Williams' Indikator-EAs angesehen. Alle Codes, die in diesem Artikel bereitgestellt werden, können „so wie sie sind“ verwendet werden, um sie in den nutzerdefinierten Code einzufügen. Als Nächstes werden wir die letzte Kategorie von Indikatoren - die Trendindikatoren - im Hinblick auf ihre Verbindung und Verwendung in EAs betrachten.
Alle Dateien (Test-EAs und Panel-Klassen) können von der unten angefügten Dateiliste heruntergeladen werden. Die Panel-Klasse sollte sich unter \MQL5\Include\Dashboard\Dashboard.mqh befinden.
Übersetzt aus dem Russischen von MetaQuotes Ltd.
Originalartikel: https://www.mql5.com/ru/articles/13277
Warnung: Alle Rechte sind von MetaQuotes Ltd. vorbehalten. Kopieren oder Vervielfältigen untersagt.
Dieser Artikel wurde von einem Nutzer der Website verfasst und gibt dessen persönliche Meinung wieder. MetaQuotes Ltd übernimmt keine Verantwortung für die Richtigkeit der dargestellten Informationen oder für Folgen, die sich aus der Anwendung der beschriebenen Lösungen, Strategien oder Empfehlungen ergeben.

 Integrieren Sie Ihr eigenes LLM in EA (Teil 2): Beispiel für den Einsatz in einer Umgebung
- Freie Handelsapplikationen
- Über 8.000 Signale zum Kopieren
- Wirtschaftsnachrichten für die Lage an den Finanzmärkte
Sie stimmen der Website-Richtlinie und den Nutzungsbedingungen zu.
Ein Detail; im Buch von Bill Williams lautet der Satz über ein blindes Huhn:
"Auch ein blindes Huhn findet ab und zu eine Ähre."
Hier heißt es:
"Auch ein blindes Huhn findet seine Ähren, wenn es immer zur gleichen Zeit gefüttert wird". Es könnte sich aber um einen Übersetzungseffekt Russisch/Englisch handeln.
Bill Williams setzt in seinem Buch auf einen "zeitgenössischen Trend zur Massenhypnose", indem er den drei gleitenden Durchschnittskurven des Alligator-Indikators einen Bezug zur
"Wissenschaft des Chaos, zusammen mit Quantenphysik, Holographie, Kybernetik, nichtlinearer Dynamik, Informationstheorie und fraktaler Geometrie" zuschreibt. Aber sein Chaos-Sprech ist ein wenig übertrieben. Das Buch enthält aber auch viel Weisheit. Unabhängig davon ist der Alligator eine praktische Kombination von MAs.
"Wissenschaft des Chaos, zusammen mit Quantenphysik, Holographie, Kybernetik, nichtlinearer Dynamik, Informationstheorie und fraktaler Geometrie" zuschreibt. Aber sein Chaos-Sprech ist etwas übertrieben. Das Buch enthält aber auch viel Weisheit. Unabhängig davon ist der Alligator eine praktische Kombination von MAs.
Danke für die Bewertung.
Ich habe Williams' Werke nicht gelesen, daher kann ich nicht genau sagen, wie und was er gesagt hat.
Nun, man kann viel reden und schreiben. Aber das Wichtigste ist, dass man es tut. Und, noch besser, es richtig zu tun)
Wenn Sie das Panel minimieren und den Zeitrahmen wechseln, können Sie das Gitter sehen.
Wie lässt es sich beheben?
Video, zum Abspielen drücken
-
Video, zum Abspielen drücken
-
Irgendwo weiter unten gibt es weitere Artikel, die diese Bibliothek verwenden. Dort wurde sie sehr stark verbessert. Bitte verwenden Sie die neueste Version dieser Bibliothek. Ich kann jetzt nicht mehr genau sagen, in welchem Artikel sie das letzte Mal verwendet wurde. Aber Sie können sie in den Listen meiner Artikel finden. Der letzte Artikel, in dem die Bibliothek verwendet wird, ist die neueste Version dieser Bibliothek. Sie sollten sie überprüfen. Ich kann es aus guten Gründen noch nicht.