Proxy Footprint

ProxyFootprint — Genel Bakış

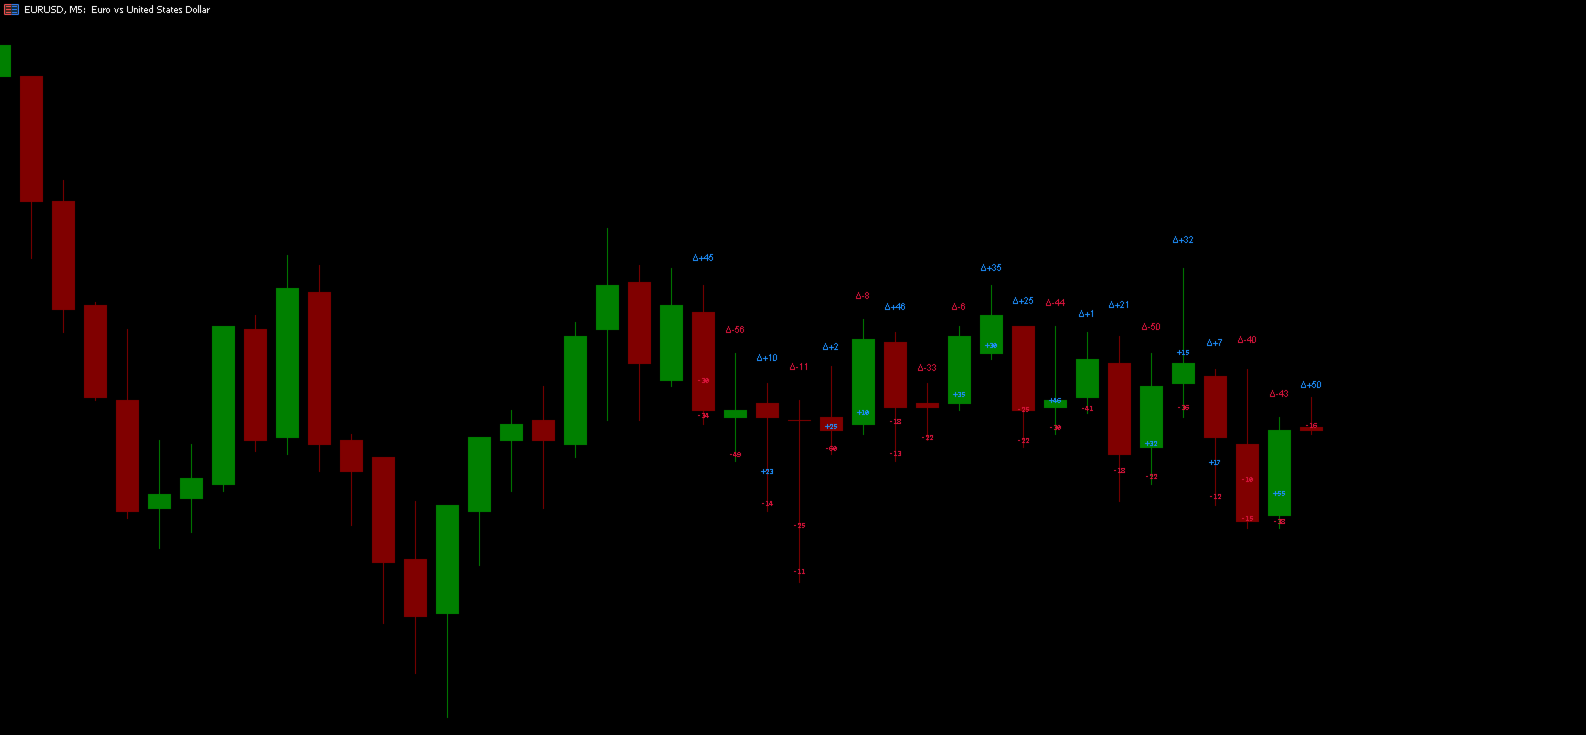
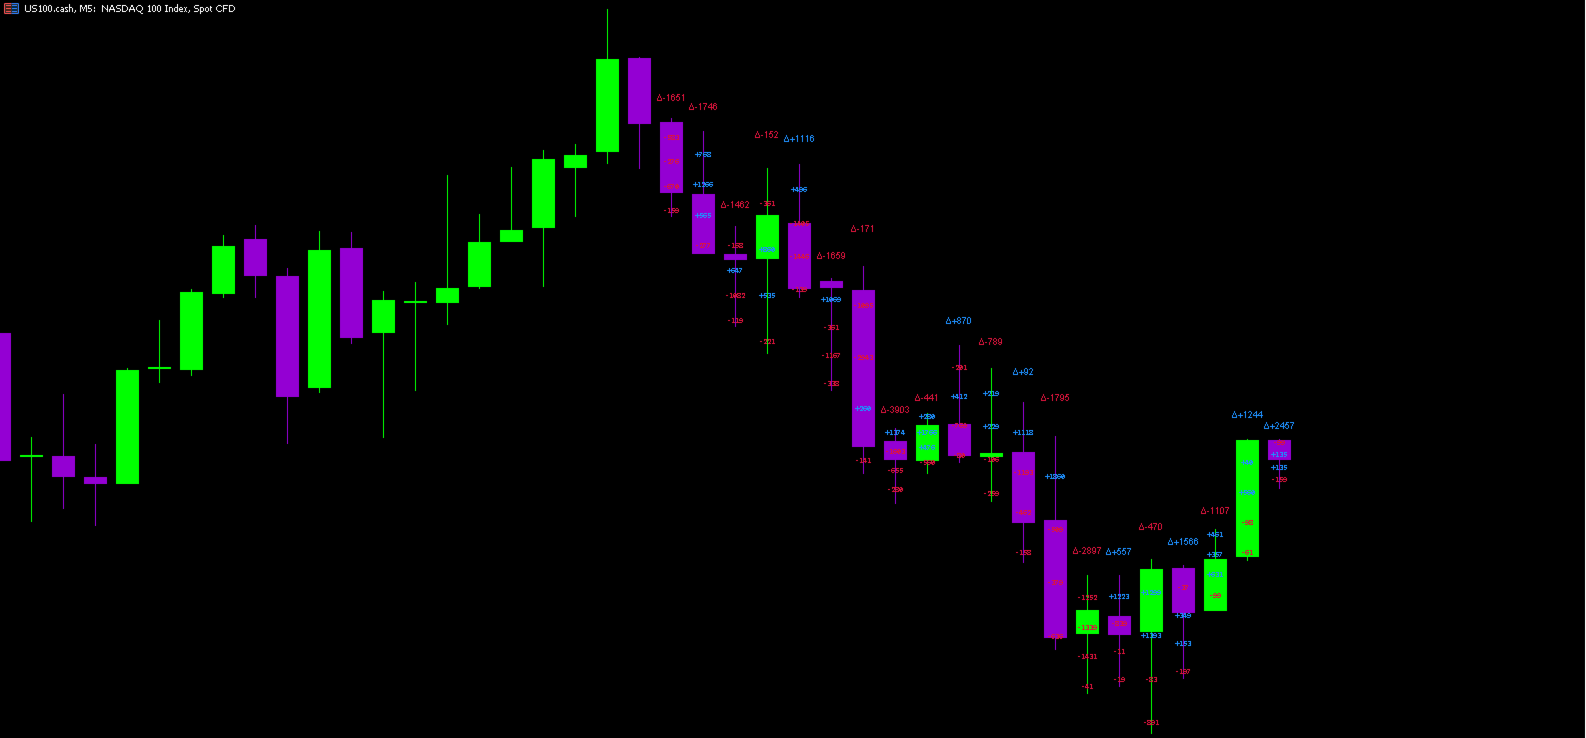
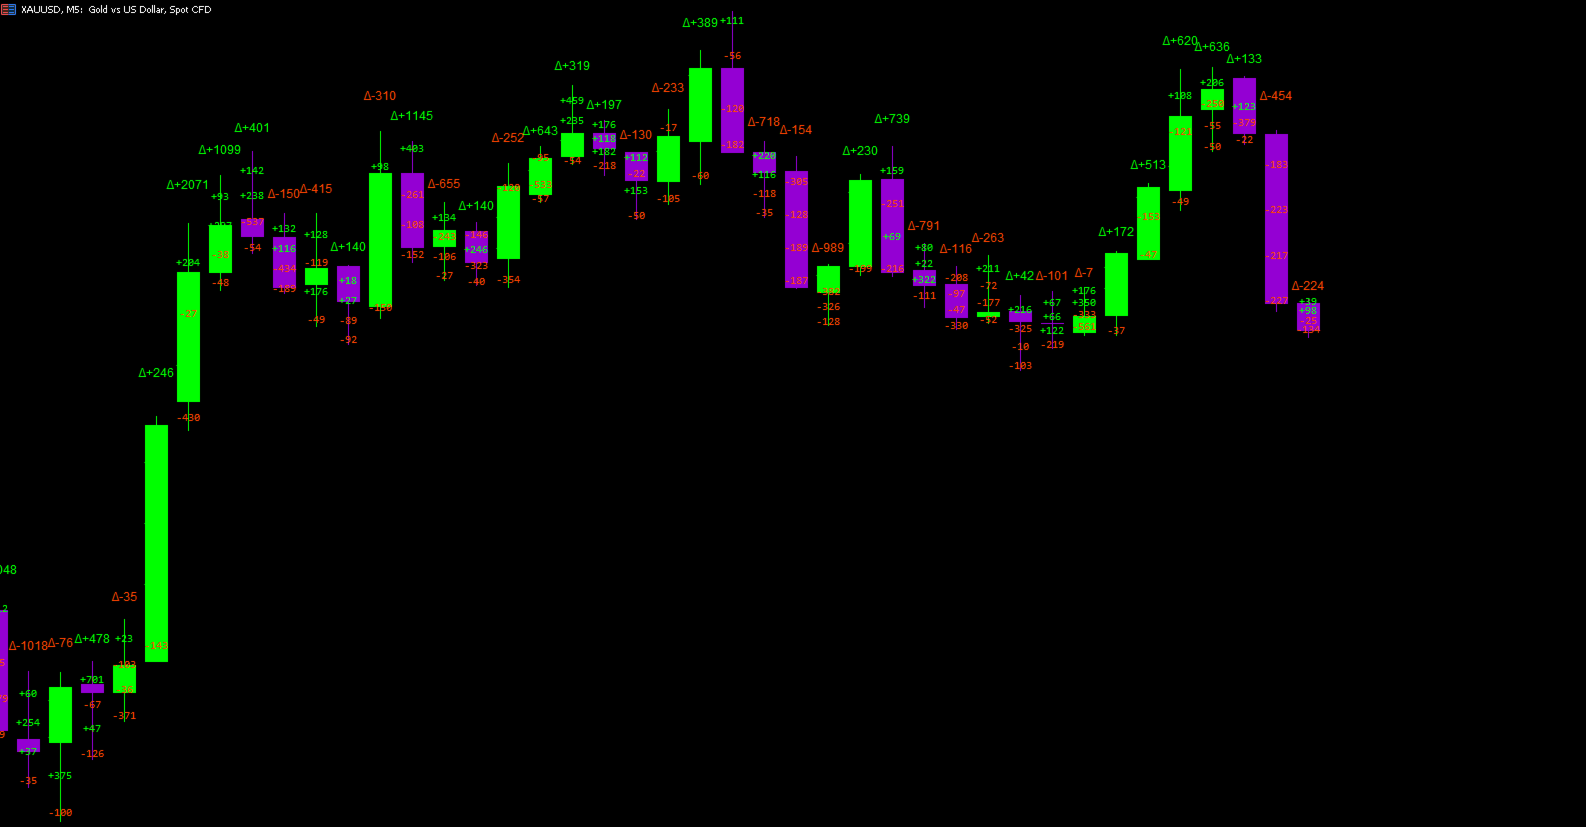
ProxyFootprint Advanced, MetaTrader 5 için geliştirilmiş bir emir akışı görselleştirme indikatörüdür.
Farklı fiyat seviyelerinde alım ve satım baskısı hakkında bilgi sağlar.

Nedir (ve ne değildir)

Önemli: Bu, gerçek bir footprint grafiği değildir.
Gerçek footprint grafikleri, her fiyat seviyesindeki emir defteri verilerine (alış/satış hacimleri) erişim gerektirir ve bu veriler borsalar veya özel veri sağlayıcıları tarafından sunulur.
Bu gösterge, herkese açık tick verilerini kullanarak footprint grafiğinden esinlenilmiş görsel bir tahmin oluşturur.

Nasıl çalışır

Gösterge, fiyat hareketlerini tick bazında analiz eder ve alım/satım baskısını tahmin eder:

  • Yukarı yönlü tick’ler alım baskısı olarak sınıflandırılır

  • Aşağı yönlü tick’ler satım baskısı olarak sınıflandırılır

  • Delta (alış hacmi − satış hacmi) hesaplanır ve her mum içinde birden fazla fiyat seviyesinde görüntülenir

Temel Özellikler

  • Çok katmanlı fiyat analizi: Her mum için 8’e kadar özelleştirilebilir fiyat seviyesinde delta değerlerini gösterir

  • Net delta görünümü: Her barın toplam alım/satım baskısını gösterir

  • 6 görsel tema: Professional, Dark, Light, Vibrant, Classic ve Custom

  • Akıllı filtreleme: Görsel karmaşayı önlemek için yalnızca önemli deltaları gösterir

  • Gerçek zamanlı güncelleme: Mevcut mum her 2 saniyede bir yenilenir

  • Hafif performans: M1, M5 ve M15 zaman dilimleri için optimize edilmiştir

Kullanım Alanları

Şu amaçlar için idealdir:

  • Kurumsal düzeyde emir akışı verilerine erişimi olmadan alım/satım baskısını görselleştirmek

  • Hacim dengesizliklerine dayalı potansiyel destek/direnç seviyelerini belirlemek

  • Fiyat hareketini hacim analiziyle doğrulamak

  • Fiyat ile delta arasındaki farklılıkları (uyuşmazlıkları) tespit etmek

Sınırlamalar

  • Gerçek emir defteri verilerine dayalı değildir

  • Doğruluk, broker’ın tick verilerinin kalitesine ve kapsamına bağlıdır

  • Geniş tick geçmişine sahip ECN/STP broker’larla en iyi sonucu verir

  • Yaklaşım yöntemi, piyasanın tüm detaylarını tam olarak yansıtamayabilir

Teknik Gereksinimler

  • Platform: MetaTrader 5

  • Zaman Dilimleri: M5, M15

  • Veri: Geniş tick geçmişine sahip bir broker gerektirir


Önerilen ürünler
Vwap Freeze
Ricardo Almeida Branco
5 (1)
The previous day's vwap is used by some traders as a support and resistance point, after all it is one of the ways to consider the fair price of that asset or that pair the day before. Possible defenses can occur in this region indicating a reversal, or triggering stops starting a new, more directional movement. It is a matter of analyzing how it will add to your operational. To avoid manually drawing the previous day's vwaps and saving time for your analysis, use the Vwap Freeze indicator, as
Çapalı VWAP Çapalı VWAP, geleneksel VWAP'ın bir varyasyonudur. Gösterge hesaplaması, işlem seansının başlangıcından veya sabit bir zaman aralığından ziyade, belirli bir zaman noktasından (çapa) başlar. Bu, büyük bir haber, bir trendin başlangıcı veya bir destek veya direnç seviyesinin kırılması gibi belirli olaylardan itibaren fiyat davranışını hacme göre değerlendirmek isteyen yatırımcılar için yararlı olabilir. Gösterge Forex, hisse senetleri ve endekslerde çalışır. Aynı grafikte birden fazla
Zone vwap auto band
Anizio Donizete Dias De Moraes
It is an indicator used to identify support and resistance points from the daily VWAP and you can use it to check the best entry and exit points. The calculated value of the channel distance can be calculated in several ways: - Manual   Defining the value to be projected to calculate the distance of the channels. - Automatic   Select the timeframe to be used.   Regardless of the graphic time that is on the screen, if the parameter is changed to      H1(One hour candles), the system will calc
The   Visual Volatility Clustering   indicator clusters the market based on volatility. The indicator does not redraw and gives accurate data, does not use closing prices. Uses the opening prices or the highs or lows of the previous completed bar. Therefore, all information will be clear and unambiguous. The essence of the indicator is to divide the price market into certain areas according to a similar type of volatility. This can be done in any way. In this example, the indicator is configure
Gösterge, mevcut fiyat yönünü ve piyasa oynaklığını belirlemenizi sağlar. Traders Dynamic Index'in bu sürümü, geçmiş verilerin yeniden çizilmesini ortadan kaldırdı, algoritma hesaplama hızı optimize edildi, daha hassas ayarlamalar için daha fazla harici parametreye ve genişletilmiş işlevselliklere sahiptir: ilk osilatör seçimi ve ortalamaların yumuşatma yöntemleri eklendi . parametreler: Mode Osc - tahmin osilatör seçimi Period Osc - kullanılan osilatörün hesaplama periyodu Price Osc - salınım h
Anchored VWAP Bands
Alexandre Silva Diniz
The Anchored VWAP Bands is an advanced precision tool designed to calculate the Volume Weighted Average Price (VWAP) from any specific point on the chart, utilizing a dynamic point-and-click anchoring logic . The Advantage: Precision Anchoring (Click-Point Detection) Unlike standard VWAPs, this indicator detects exactly where you click relative to the candle to define the price calculation base: Click at the Top (HIGH): Anchoring focused on the Maximum Price. Ideal for measuring the average cost
The   Pivot Point indicator   automatically calculates and displays the pivot point line and support and resistance levels. Pivot can be calculated according to the Classic, Floor, Fibonacci, Woodie, Camarilla or DeMark formula. It is also possible to select the period for calculating the indicator. A trader can choose from daily, weekly, monthly, or user-defined periods. Types of pivots Classic Floor Fibonacci Woodie Camarilla DeMark Main features The indicator shows the current and historic
FREE
Initial Balance MT5
Ricardo Almeida Branco
The Initial Balance (Initial Balance / Initial Balance) is a concept related to the study of volume (to learn more, study about Market Profile and Auction Market Theory. You can find some videos in English when searching for "Initial Balance Market Profile"). The IB defines a range in which prices were negotiated in the first hour of trading.The amplitude of the range is important and the break in the range defined by the Initial Balance may have occurred due to the movement of several players
The   Real Flow Defense Levels   indicator is a proprietary tool designed to identify and plot   significant, high-conviction price zones   directly onto your main trading chart. It uses a dynamic, volume-based analysis to determine where the market has previously demonstrated the   strongest defense or concentration of activity . These plotted lines serve as   dynamic support and resistance levels , highlighting the prices where major participants are most likely to enter or defend their positi
What is VWAP? The Volume Weighted Average Price (VWAP) is a trading benchmark that reflects the average price of a security, weighted by volume, over a specific time period. It helps traders identify fair value and is used widely in intraday trading to assess price action relative to institutional trading levels. Key Features of Anchored VWAP PRO Anchored Calculation : Unlike traditional VWAP that resets daily, your indicator allows users to anchor VWAP to specific time frames or key points (e.g
VWAP Diaria
Samuel De Souza Ferreira
Daily VWAP — Institutional Reference for Intraday Value The Daily VWAP is a professional indicator based on the Volume-Weighted Average Price (VWAP) , designed to reveal the true balance between price and volume throughout the trading session. Unlike traditional moving averages, the Daily VWAP incorporates the weight of traded volume in every price movement, providing a much more accurate reference to the behavior of institutional traders and large market participants. What the indicator deliver
FREE
VP hidden
Emr Aljnaby
4.33 (12)
The indicator works to convert normal volume into levels and determine financial liquidity control points. It is very similar in function to Fixed Volume Profile. But it is considered more accurate and easier to use than the one found on Trading View because it calculates the full trading volumes in each candle and in all the brokers present in MetaTrade, unlike what is found in Trading View, as it only measures the broker’s displayed prices. To follow us on social media platforms: telegram
FREE
Automatic Vwap Midas
Ricardo Almeida Branco
5 (1)
The 3 Automatic Vwap (Midas) Indicator can be used for Price and Volume studyers to map the movement of market drivers. It automatically plots 3 Vwaps, two of which are dynamic and will be updated throughout the day if new highs or new lows emerge. The third Vwap is daily and can help if the trend is up or down. Also, an auxiliary indicator that plots (also dynamic) points of interest with OHLC prices (Open, High and Low of the current day and Close of the previous day) was inserted. Success and
Trend Battle
Osmar Santiago
5 (1)
Trend Battle Indicator Overview The Trend Battle Indicator is a professional technical analysis tool that reveals the battle between buyers (Bulls) and sellers (Bears) in the market through a comprehensive dashboard. Using an intuitive visual interface, the indicator offers a unique perspective on market power dynamics by analyzing the last twenty bars to provide precise insights into momentum and directional strength. Additionally, the panel provides automatic real-time updates for bars in for
An anchored Vwap With Arrows is an indicator that includes a moving average weighted by volume that allows you to plot on a bottom or a top. Usually banks and institutions measure an average price, this average price is a price range where they agree to make a trade. Using the logic of anchored vwap with arrows it is possible to understand that if the price breaks the vwap it means that someone with enough buying and selling power has lost control. You can use vwap anchored with arrows in any ti
VWAP Daily
Anton Polkovnikov
Weighted average price indicator or VWAP. The well-known standard VWAP with the beginning of the day is added with the function of selecting the periodization. It can be calculated both every day and on other periods. Also the indicator allows to exclude the volume from the calculation, which will allow using it on the cryptocurrencies and forex. There is an alert for a VWAP price crossing. There are 1 and 2 standard deviation. Settings: Volume: turning volume on and off in the calculation mecha
Intraday Session TPO: Precision Volume Profiling for Day Traders Stop trading blind during the most volatile hours of the day. Standard daily volume profiles blend everything together, masking the true areas of liquidity and institutional interest. The Intraday Session TPO is engineered specifically for session-to-session traders. It empowers you to isolate and profile specific time windows—like the London Open, the New York Killzone, or the Asian range—so you can see exactly where the volume is
Vwap Bar
Jean Jacques Huve Ribeiro
5 (1)
VWAP BAR  It´s power full indicator of candle by candle when lined up   with greate analysis, you have great opportunity, finder defense candle. Is a good ideia from order flow method, now your meta trader 5   inside you time frame chart .   What is the Volume Weighted Average Price (VWAP)? The volume weighted average price (VWAP) is a trading benchmark used by traders that gives the average price a security has traded at throughout the day, based on both volume and price. It is important be
FREE
The Market Structures Pro indicator finds and displays 5 (five) patterns of the Smart Money Concepts (SMC) system on the chart, namely: Break Of Structures (BoS)       Change of character (CHoCH) Equal Highs & Lows Premium, Equilibrium and Discount zones with Fibo grid High-high, Low-low, High-low and Low-high extremes Patterns are displayed for two modes - Swing and Internal and are easily distinguished by color on the chart. Internal mode features higher contrast colors, finer lines, and smal
Swiss VWAPsimple
Terence Gronowski
4.8 (5)
Swiss VWAPsimple Motivation Did not find free VWAP that works, the one that I found craseh. So I created a VWAP which calculates values only for the actual day. So computer resouces are not over stressed. What is VWAP, how is it used?  VWAP stands for Volume Weighed Average Price, it calculates the running sum of tick volume and the runnung sum of price times tickvolume. The division of these sums result in a weighed price (Sum P*V/Sum V). The calculation starts normally at midnight. The values
FREE
Each VolumeProfile holds: The price range for a given period Buy/sell volume for each price level Calculated POC, VAH, VAL, Delta, and Imbalance Indicator Logic Summary Divide data by timeframe (e.g., one H1 profile per hour). Aggregate volumes for each price level. Separate buy and sell volumes using tick or trade direction. Compute Delta (Buy − Sell) and Imbalance (dominance ≥70%). Detect POC, VAH, VAL to outline the Value Area. Draw graphical profiles beside price candles using color-co
Elevate Your Trading with Advanced Anchored Volume Weighted Average Price Technology Unlock the true power of price action with our premium Anchored VWAP Indicator for MetaTrader 5 - the essential tool for precision entries, strategic exits, and high-probability trend continuation setups. Write me a DM for a 7 day free trial.  Anchored VWAP Plus gives traders unprecedented control by allowing custom anchor points for Volume Weighted Average Price calculations on any chart. With support for 4 sim
FREE
This Volume Delta Profile is an advanced MetaTrader 5 indicator that visualizes   volume delta (order flow imbalance)   using a volume profile-style histogram. It shows the difference between buying and selling pressure at specific price levels, helping traders identify supply and demand zones. This indicator provides a unique perspective on market dynamics by visualizing the imbalance between buying and selling pressure, offering insights beyond traditional volume analysis. Core Concept Positiv
Intraday Vwap Orion
Joao Paulo Botelho Silva
Theory VWAP is a volume-weighted moving average, bringing greater relevance to prices. The VWAP base calculation follows the classic formula described in Investopedia ( https://www.investopedia.com/terms/v/vwap.asp ). VWAP = sum(typical price[i]*volume[i]) / sum(volume[i]) Functionalities Orion Intraday VWAP innovates by allowing the user to choose between the conventional Daily, Weekly and Monthly periods, also having the option of calculating the Intraday indicator, as used in other platform
Bohemia Gold MT5
Vladislav Taska
4.75 (4)
Bohemia Gold MT5 is  Trend & Volatility EA trading system designed specifically for Gold (XAUUSD) . It combines higher-timeframe trend filtering , trend detection , volatility-based SL management , and advanced trade management to adapt market conditions. It uses style logic focused on trend strength, volatility, and capital protection. NOTE:   Based on backtests, I found better trading results with the following setup: D1/H4/H2 (Trend/ADX/ATR & trade). The SET file can be downloaded here … bohe
FREE
Auto Midas VWAP
Paulo Henrique Faquineli Garcia
AUTO MIDAS VWAP Volume Weighted Average Price (VWAP) is a trading benchmark commonly used by Big Players that gives the average price a Symbol has traded throughout the day. It is based on both Volume and price. Commonly, MIDAS VWAP damand you to determine the initial point of analysis. This indicator plots automatically based on ZigZag Approach. You will be able to use up to 3 HIGH MIDAS VWAP's and 3 LOW MIDAS VWAP's. Wish the best trade results!!
AutoLevelsPro — fiyat verilerini analiz ederek otomatik olarak destek ve direnç bölgelerini işaretleyen bir indikatördür. Özellikle düşük zaman dilimleri için tasarlanmıştır; en iyi sonuçları 15 dakikalık grafiklerde verir ve piyasanın en dinamik tepkilerini yakalar. Kullandığı veriler: High — mumun en yüksek fiyatı Low — mumun en düşük fiyatı Close — ATR hesaplamasında kullanılır Her mumun zaman damgası, bölgelerin doğru konumlandırılması için ️ Analiz süreci: Yerel zirveleri
Avwap
Pablo Filipe Soares De Almeida
Avwap Başlıca özellikler: Otomatik Günlük VWAP (her gün sunucu saatine göre 00:00’da mükemmel şekilde yeniden başlar) Hesaplama için 8 fiyat tipi: Close, (H+L+C)/3, (H+L)/2, (O+C)/2, (O+H+L+C)/4 ve daha fazlası Anchored VWAP modu: sadece dikey çizgiyi geçmişteki herhangi bir noktaya sürükleyin, VWAP o andan itibaren anında yeniden hesaplanır Dikey çizginin rengi, kalınlığı ve tarzı %100 özelleştirilebilir (çapayı nasıl görmek istediğinizi siz seçersiniz) Grafikte etiket veya metin yok Son derece
Anchored VWAP with Alert MT5
Trade The Volume Waves Single Member P.C.
5 (1)
What is the Volume Weighted Average Price (VWAP)? The volume weighted average price (VWAP) is a trading benchmark used by traders that gives the average price an instrument has traded at throughout the day, based on both volume and price.  It is important because it provides traders with insight into both the trend and value of the instrument. What is the Difference between VWAP and AVWAP? While VWAP is having as starting point the beggining of the day,week,month etc. in the AVWAP you can pla
Bu ürünün alıcıları ayrıca şunları da satın alıyor
SuperScalp Pro
Van Minh Nguyen
5 (14)
SuperScalp Pro – Gelişmiş Çoklu Filtreli Scalping Gösterge Sistemi SuperScalp Pro, klasik Supertrend ile çok sayıda akıllı onay filtresini birleştiren gelişmiş bir scalping gösterge sistemidir. Gösterge M1’den H4’e kadar tüm zaman dilimlerinde verimli çalışır ve özellikle XAUUSD, BTCUSD ve ana Forex pariteleri için uygundur. Bağımsız bir sistem olarak kullanılabilir veya mevcut ticaret stratejilerine esnek şekilde entegre edilebilir. Gösterge, hız ve yavaş EMA’lar, trend belirleyen üç EMA, EMA e
Azimuth Pro
Ottaviano De Cicco
5 (6)
LAUNCH PROMO Azimuth Pro price is initially set at 299$ for the first 100 buyers. Final price will be 499$ . THE DIFFERENCE BETWEEN RETAIL AND INSTITUTIONAL ENTRIES ISN'T THE INDICATOR — IT'S THE LOCATION. Most traders enter at arbitrary price levels, chasing momentum or reacting to lagging signals. Institutions wait for price to reach structured levels where supply and demand actually shift. Azimuth Pro maps these levels automatically: swing-anchored VWAP, multi-timeframe structure lines, an
Entry In The Zone and SMC Multi Timeframe is a real-time market analysis tool developed based on Smart Money Concepts (SMC). It is designed to analyze market structure, price direction, reversal points, and key zones across multiple timeframes in a systematic way. The system displays Points of Interest (POI) and real-time No Repaint signals, with instant alerts when price reaches key zones or when signals occur within those zones. It functions as both an Indicator and a Signal System (2-in-1), c
Divergence Bomber
Ihor Otkydach
4.89 (85)
Bu göstergeyi satın alan herkese aşağıdaki ekstra içerikler ücretsiz olarak sunulmaktadır: Her işlemi otomatik olarak yöneten, Stop Loss ve Take Profit seviyelerini ayarlayan ve işlemleri strateji kurallarına göre kapatan özel yardımcı araç: "Bomber Utility" Göstergenin farklı varlıklar üzerinde kullanılmasına yönelik ayar dosyaları (set dosyaları) Bomber Utility için 3 farklı modda kullanım sunan ayar dosyaları: "Minimum Risk", "Dengeli Risk" ve "Bekle-Gör Stratejisi" Bu ticaret stratejisini hı
ARICoins
Temirlan Kdyrkhan
ARICoin is a powerful trading companion designed to generate high-probability entry signals with dynamic TP/SL/DP levels based on volatility. Built-in performance tracking shows win/loss stats, PP1/PP2 hits, and success rates all updated live. Key Features: Buy/Sell signals with adaptive volatility bands Real-time TP/SL/DP levels based on ATR Built-in MA Filter with optional ATR/StdDev volatility Performance stats panel (Success, Profit/Loss, PP1/PP2) Alerts via popup, sound, push, or email Cust
CGE Trading Suite
Carl Gustav Johan Ekstrom
5 (1)
CGE Trading Suite delivers the analytical edge typically reserved for professional trading desks. The platform integrates a full suite of analytical tools into one seamless workflow: dynamic grid mapping, liquidity behavior analysis, ECM, trend lines, MIDAS, trade cycles, and directional channel projections. Together, these provide a unified view of market structure and momentum. Directional clarity is further enhanced by the capital flow index, which measures currency basket strength to identif
Bu indikatörü satın alırsanız, Profesyonel Trade Manager’ımı  + EA ÜCRETSİZ olarak alacaksınız. Öncelikle, bu Ticaret Sistemi'nin Non-Repainting, Non-Redrawing ve Non-Lagging Göstergesi olduğunu vurgulamak önemlidir, bu da hem manuel hem de robot ticareti için ideal hale getirir. Online kurs, kılavuz ve ön ayarları indir. "Smart Trend Trading System MT5", yeni ve deneyimli tüccarlar için özelleştirilmiş kapsamlı bir ticaret çözümüdür. 10'dan fazla premium göstergeyi birleştiriyor ve 7'den fazla
Meridian Pro
Ottaviano De Cicco
5 (1)
Meridian Pro: Professional Multi-Timeframe Trend Matrix for MT5 Overview Meridian Pro is a multi-timeframe trend matrix by Merkava Labs that compresses directional state, strength, momentum condition and matrix agreement into one compact panel. One adaptive engine, applied consistently from M1 to W1. No per-symbol tuning. No indicator stacking. One structured readout across every asset and every timeframe. Launch Offer — Get Meridian Pro for USD 99 (introductory). Regular price: USD 149. 1. Why
RelicusRoad Pro: Kantitatif Piyasa İşletim Sistemi ÖMÜR BOYU ERİŞİMDE %70 İNDİRİM (SINIRLI SÜRE) - 2.000+ TRADER'A KATILIN Neden çoğu trader "mükemmel" indikatörlere rağmen başarısız olur? Çünkü tekil kavramları boşlukta trade ederler. Bağlamı olmayan bir sinyal kumardır. Sürekli kazanmak için KONFLÜANS (UYUM) gerekir. RelicusRoad Pro basit bir ok indikatörü değildir. Tam bir Kantitatif Piyasa Ekosistemi dir. Tescilli volatilite modellemesini kullanarak fiyatın ilerlediği "Adil Değer Yolu"nu har
FX Trend MT5 NG
Daniel Stein
5 (4)
FX Trend NG: Yeni Nesil Çoklu Piyasa Trend Zekâsı Genel Bakış FX Trend NG , çoklu zaman dilimlerinde çalışan profesyonel bir trend analiz ve piyasa izleme aracıdır. Piyasanın yapısını saniyeler içinde anlamanızı sağlar. Birden fazla grafik arasında geçiş yapmak yerine, hangi enstrümanların trendde olduğunu, momentumun nerede zayıfladığını ve hangi zaman dilimlerinin uyumlu olduğunu anında görebilirsiniz. Lansman Teklifi – FX Trend NG sadece $30 (6 Ay) veya $80 Ömür Boyu Lisans ile edinin. Zate
AriX
Temirlan Kdyrkhan
1 (4)
AriX Indicator for MT5 A powerful trend-following and signal-evaluation tool AriX is a custom MT5 indicator that combines Moving Averages and ATR-based risk/reward logic to generate clear buy/sell signals. It visualizes dynamic SL/TP levels, evaluates past trade outcomes, and displays win/loss statistics in a clean on-chart panel. Key features include: Buy/Sell signals based on MA crossovers ATR-based SL/TP1/TP2/TP3 levels with visual lines and labels Signal outcome tracking with real-time stat
Power Candles – Tüm Piyasalar İçin Güce Dayalı Giriş Sinyalleri Power Candles , Stein Investments’ın kanıtlanmış güç analizini doğrudan fiyat grafiğinize taşır. Sadece fiyata tepki vermek yerine, her mum gerçek piyasa gücüne göre renklendirilir. Bu sayede momentum birikimleri, güç hızlanmaları ve net trend geçişleri anında görülebilir. Tüm Piyasalar İçin Tek Mantık Power Candles tüm işlem sembollerinde otomatik olarak çalışır. Gösterge, mevcut sembolün Forex mi yoksa Forex dışı bir piyasa mı old
Quantum TrendPulse
Bogdan Ion Puscasu
5 (22)
SuperTrend   ,   RSI   ve   Stochastic'in   gücünü tek bir kapsamlı göstergede birleştirerek işlem potansiyelinizi en üst düzeye çıkaran nihai işlem aracı olan   Quantum TrendPulse'u   tanıtıyoruz. Hassasiyet ve verimlilik arayan yatırımcılar için tasarlanan bu gösterge, piyasa trendlerini, momentum değişimlerini ve en uygun giriş ve çıkış noktalarını güvenle belirlemenize yardımcı olur. Temel Özellikler: SuperTrend Entegrasyonu:   Güncel piyasa trendlerini kolayca takip edin ve karlılık dalgası
Trend Screener Pro MT5
STE S.S.COMPANY
4.84 (102)
Trend Göstergesi, Trend Alım Satım ve Filtreleme için Çığır Açan Benzersiz Çözüm, Tüm Önemli Trend Özellikleriyle Tek Bir Araç İçinde Yerleştirildi! Forex, emtialar, kripto para birimleri, endeksler ve hisse senetleri gibi tüm sembollerde/araçlarda kullanılabilen %100 yeniden boyamayan çoklu zaman çerçevesi ve Çoklu para birimi göstergesidir. Trend Screener, grafikte noktalarla ok trend sinyalleri sağlayan etkili bir trend trend göstergesidir. Trend analizörü göstergesinde bulunan özellikler: 1.
Atomic Analyst MT5
Issam Kassas
3.94 (31)
Öncelikle belirtmek gerekir ki bu Ticaret Göstergesi Yeniden Çizim Yapmaz, Gecikmez ve Gecikme Göstermez, bu da hem manuel hem de robot ticareti için ideal hale getirir. Kullanıcı kılavuzu: ayarlar, girişler ve strateji. Atom Analisti, Piyasada Daha İyi Bir Avantaj Bulmak İçin Fiyatın Gücünü ve Momentumunu Kullanan PA Fiyat Hareketi Göstergesidir. Gürültüleri ve Yanlış Sinyalleri Kaldırmaya ve Ticaret Potansiyelini Artırmaya Yardımcı Olan Gelişmiş Filtrelerle Donatılmıştır. Birden fazla katmanl
Göstergе, herhangi bir noktadan hacmi analiz eder ve bu hacim için piyasanın tükeniş seviyelerini hesaplar. Meravith’in ana çizgileri: Boğa hacim tükeniş çizgisi – hedef olarak kullanılır. Ayı hacim tükeniş çizgisi – hedef olarak kullanılır. Trend çizgisi – piyasa trendini gösterir. Piyasanın boğa mı ayı mı olduğuna bağlı olarak rengi değişir ve trend desteği görevi görür. Nasıl kullanılır: Mor dikey çizgiye çift tıklayın ve istediğiniz konuma taşıyın. Her şeyi analiz edebilirsiniz – trendleri v
OmniSync Projection
Antonio-alin Teculescu
5 (1)
Chronos Fractal Engine is an innovative price projection indicator for MetaTrader 5, designed to transform your technical analysis by intelligently identifying and projecting historical price patterns. Built upon an advanced correlation algorithm and the fractal principles of the market, this powerful tool visualizes potential future price movements, giving you a unique edge in your trading decisions. What is Chronos Fractal Engine? At its core, the Chronos Fractal Engine employs a sophisticat
Grabber System MT5
Ihor Otkydach
4.83 (23)
Size mükemmel bir teknik gösterge olan Grabber’ı tanıtıyorum. Bu araç, kullanıma hazır bir “her şey dahil” işlem stratejisi olarak çalışır. Tek bir yazılım kodu içinde güçlü piyasa teknik analiz araçları, işlem sinyalleri (oklar), uyarı işlevleri ve push bildirimleri entegre edilmiştir. Bu göstergeyi satın alan herkes aşağıdaki hediyeleri ücretsiz olarak alır: Açık emirleri otomatik yönetmek için Grabber Yardımcı Aracı Kurulum, yapılandırma ve nasıl işlem yapılacağını adım adım anlatan video kıl
Bill Williams Advanced
Siarhei Vashchylka
5 (11)
Bill Williams Advanced is designed for automatic chart analysis using Bill Williams' "Profitunity" system. The indicator analyzes four timeframes at once. Manual (Be sure to read before purchasing) Advantages 1. Analyzes the chart using Bill Williams' "Profitunity" system. Signals are displayed in a table in the corner of the screen and on the price chart. 2. Finds all known AO and AC signals, as well as zone signals. Equipped with a trend filter based on the Alligator. 3. Finds "Divergence Bar
Currency Strength Dashboard Pro MetaTrader 5 için profesyonel gerçek zamanlı döviz gücü analiz paneli . Bu gösterge, 8 ana para biriminin (EUR, USD, GBP, JPY, CHF, AUD, CAD, NZD) gücünü hesaplar ve 28 döviz çiftini aynı anda birden fazla zaman diliminde analiz ederek gösterir. Panel, yatırımcıya piyasayı tek bakışta tamamen görme imkânı sağlar — ek hesaplamalar yapmadan ve grafikler arasında geçiş yapmadan. Hesaplama Yöntemi Gösterge, gelişmiş matematiksel döviz gücü analiz yöntemine dayanır. Bu
FX Power MT5 NG
Daniel Stein
5 (31)
FX Power: Daha Akıllı Ticaret Kararları için Para Birimlerinin Gücünü Analiz Edin Genel Bakış FX Power , her piyasa koşulunda başlıca para birimlerinin ve altının gerçek gücünü anlamak için vazgeçilmez bir araçtır. Güçlü para birimlerini alıp zayıf olanları satarak, FX Power ticaret kararlarınızı basitleştirir ve yüksek olasılıklı fırsatları ortaya çıkarır. İster trendlere sadık kalın ister Delta'nın aşırı değerlerini kullanarak tersine dönüşleri öngörün, bu araç ticaret tarzınıza mükemmel bir
Tanıtım       Quantum Breakout PRO   , Breakout Bölgeleri ile ticaret yapma şeklinizi değiştiren çığır açan MQL5 Göstergesi! 13 yılı aşkın ticaret tecrübesine sahip deneyimli tüccarlardan oluşan bir ekip tarafından geliştirilmiştir.       Kuantum Breakout PRO       yenilikçi ve dinamik koparma bölgesi stratejisiyle ticaret yolculuğunuzu yeni zirvelere taşımak için tasarlanmıştır. Kuantum Breakout Göstergesi, size 5 kar hedefi bölgesi ile kırılma bölgelerinde sinyal okları ve kırılma kutusuna da
Market Structure Order Block Dashboard MT5 , MT5 için bir indikatördür . Piyasa yapısı ve ICT / Smart Money Concepts yaklaşımına odaklanır: HH/HL/LH/LL , BOS , ChoCH , ayrıca Order Blocks , Fair Value Gaps (FVG) , likidite (EQH/EQL, sweeps), seanslar / Kill Zones ve entegre Volume Profile ile kompakt bir confluence dashboard sunar. Önemli: Bu bir analiz aracıdır . İşlem açmaz (EA değildir). Alıcı Bonusu Satın aldıktan sonra mağazamdan seçerek 2 bonus indikatör ücretsiz alabilirsiniz. Bonusları
RFI levels PRO MT5
Roman Podpora
3.67 (3)
Bu gösterge, fiyat dönüş noktalarını ve fiyat geri dönüş bölgelerini doğru bir şekilde gösterir.       Başlıca oyuncular   . Yeni trendlerin nerede oluştuğunu görüyorsunuz ve her işlem üzerinde kontrolü elinizde tutarak, azami hassasiyetle kararlar alıyorsunuz. TREND LINES PRO   göstergesiyle birlikte kullanıldığında maksimum potansiyelini ortaya koyar.  VERSION MT4 Göstergenin gösterdiği şey: Yeni bir trendin başlangıcında aktivasyonla birlikte tersine dönüş yapıları ve tersine dönüş seviyeler
Advanced Supply Demand MT5
Bernhard Schweigert
4.53 (15)
Herhangi bir Acemi veya Uzman Tüccar için En İyi Çözüm! Bu gösterge benzersiz, yüksek kaliteli ve uygun fiyatlı bir ticaret aracıdır çünkü bir dizi tescilli özelliği ve yeni bir formülü bir araya getirdik. Bu güncelleme ile çift zaman dilimi dilimlerini gösterebileceksiniz. Yalnızca daha yüksek bir TF gösteremeyeceksiniz, aynı zamanda TF grafiğini ve ARTIK daha yüksek TF'yi de gösterebileceksiniz: YUVARLAK BÖLGELERİ GÖSTERMEK. Tüm Arz Talebi tüccarları buna bayılacak. :) Önemli Bilgiler Açıkland
Trend Forecaster
Alexey Minkov
5 (7)
The Trend Forecaster indicator utilizes a unique proprietary algorithm to determine entry points for a breakout trading strategy. The indicator identifies price clusters, analyzes price movement near levels, and provides a signal when the price breaks through a level. The Trend Forecaster indicator is suitable for all financial assets, including currencies (Forex), metals, stocks, indices, and cryptocurrencies. You can also adjust the indicator to work on any time frames, although it is recommen
Crystal Heikin Ashi Signals
Muhammad Jawad Shabir
5 (1)
Crystal Heikin Ashi Signals - Professional Trend & Signal Detection Indicator Advanced Heikin Ashi Visualization with Intelligent Signal System for Manual & Automated Trading Final Price: $149 ---------> Price goes up $10 after every 10 sales . Limited slots available — act fast . Overview Crystal Heikin Ashi Signals is a professional-grade MetaTrader 5 indicator that combines pure Heikin Ashi candle visualization with an advanced momentum-shift detection system. Designed for both manual traders
Smart Stop Indicator – Stop-loss düzeylerini doğrudan grafikte akıllı ve hassas şekilde belirleyin Genel Bakış Smart Stop Indicator, stop-loss seviyesini tahmin ederek veya sezgilere güvenerek değil, net ve sistematik bir şekilde belirlemek isteyen traderlar için özel olarak geliştirilmiştir. Bu araç, klasik price-action mantığını (yükselen tepeler, düşen dipler) modern breakout algılama ile birleştirerek bir sonraki mantıklı stop seviyesini belirler. Trendlerde, yatay piyasalarda veya hızlı k
Gann Made Easy , bay teorisini kullanarak ticaretin en iyi ilkelerine dayanan, profesyonel ve kullanımı kolay bir Forex ticaret sistemidir. WD Gann. Gösterge, Zararı Durdur ve Kâr Al Seviyeleri dahil olmak üzere doğru SATIN AL ve SAT sinyalleri sağlar. PUSH bildirimlerini kullanarak hareket halindeyken bile işlem yapabilirsiniz. Satın alma işleminden sonra, alım satım talimatlarını ve harika ek göstergeleri ücretsiz olarak almak için lütfen benimle iletişime geçin! Muhtemelen Gann ticaret yöntem
Gold Sniper Scalper Pro
Ich Khiem Nguyen
3.78 (9)
Gold Sniper Scalper Pro, XAUUSD üzerinde sahte kırılma (false breakout) formasyonlarını tespit etmek için özel olarak tasarlanmış bir MetaTrader 5 göstergesidir. Fiyatın bir range sınırını kırdığı, kırılma yatırımcılarını çektiği ve ardından tersine döndüğü 4 çubuklu tuzak yapısını belirler — hareketin sahte bir kırılma olduğunu doğrular. Gösterge, her kurulumu 17 kalite faktörüne göre puanlar, 4 katmanlı bir uyum hattından geçirir, 7 zaman dilimli trend konsensüs motoruyla doğrular ve altın vo
Yazarın diğer ürünleri
Volume Profile Density V2.40 Fiyat seviyelerine göre işlem hacmini gösterir ve kurumsal ilgiyi çeken bölgeleri ortaya çıkarır. Klasik hacim göstergelerinden farklı olarak, hacmin gerçekte nerede yoğunlaştığını gösterir. Temel ilkeler: Yatay çubuklar = her fiyat seviyesindeki işlem hacmi Daha uzun çubuk → daha yüksek hacim Kırmızı bölgeler = güçlü destek / direnç alanları Ana kullanımlar: Gerçek destek ve direnç bölgelerini belirleme POC (Point of Control) tespiti Değer Alanı (toplam hacmin %70’i
FREE
Iceblock Volume
Vincent Jose Proenca
5 (1)
Kısa ifade: Iceblock — fiyat hareketinin az olduğu fakat işlem hacminin yüksek olduğu kümeleri tespit eden MT4 göstergesi (buzdağı benzeri davranış). TF: Tüm zaman dilimlerinde çalışır (M1–D1). Parite: Forex, endeksler, altın ve CFD’lerle uyumlu. Ayarlar: VolumeLookback – ortalama hacim hesabı için mum sayısı VolumeThreshold – anormal yüksek hacmi belirleyen çarpan ClusterSize – küme doğrulaması için bitişik mum sayısı RangeComparisonPeriod – mum aralıklarının (high–low) ortalaması için dönem
FREE
VolumeSR MT4
Vincent Jose Proenca
his indicator automatically identifies key support and resistance levels by analyzing volume patterns. Unlike traditional S/R tools that rely only on price, Volume S/R finds levels where the market truly reacted.   DETECTION LOGIC: - High Volume Zones: Price levels where strong buying/selling occurred - Low Volume Zones: Areas of weak interest - potential breakout or reversal zones   SMART FILTERING: - Nearby levels are automatically merged to avoid chart clutter - Maximum levels limit keeps yo
FREE
Pivot PDHL Levels
Vincent Jose Proenca
AutoPivot – Otomatik Pivot Noktaları Göstergesi MT4 göstergesi, pivot noktalarını (PP, R1/R2/R3, S1/S2/S3) ve önceki günün seviyelerini (PDH/PDL) gösterir. Ana özellikler: Grafiğin zaman dilimine (H4/D1/W1) göre otomatik uyum PDH/PDL ile en yakın destek/direnç seviyesi arasındaki bölgeler 8 önceden ayarlanmış renk teması Renkler, çizgi stilleri ve bölge saydamlığı tamamen özelleştirilebilir Fiyat gösterimi isteğe bağlı kompakt etiketler Yapılandırılabilir otomatik güncellemeler Seviyeler, standa
CustomBreakout
Vincent Jose Proenca
Range Breakout EA – Simple Description Concept An automated trading robot for MetaTrader 5 that exploits range breakouts with two key periods: Features Automatic market hours management Customizable Stop Loss and Take Profit Smart Trailing Stop Built-in testing mode for simulation Detailed logs for monitoring How It Works Records extreme prices at the start of the day Waits for a breakout of the secondary range Opens a position in the breakout direction Automatically manages the trade (SL/TP/Tr
FREE
PDHL – simply displays the highs and lows of previous days directly on your chart, providing a quick and visual reference of past key levels. The indicator is lightweight and easily customizable , allowing you to adjust the number of days displayed, the colors, as well as the style and thickness of the lines to suit your preferences. It is designed to be simple and practical, but may not work on all instruments or platforms . Only teste Tested only with CFDs
FREE
VWAP_PC_MQL5 — MT5 üzerinde hacim ağırlıklı ortalama fiyatı (VWAP) gösteren basit, el yapımı bir gösterge. TF: Tüm zaman dilimlerinde çalışır. Parite: Forex, endeks, emtia ve hisse senetleriyle uyumlu. Ayarlar: AppliedPrice – hesaplama için kullanılan fiyat türü LineColor / Width / Style – çizgi görünümü SessionReset – günlük sıfırlama veya sürekli mod Çalışma prensibi (VWAP): VWAP (Volume Weighted Average Price) = (Fiyat × Hacim toplamı) / (Hacim toplamı) Fiyat VWAP’ın üzerindeyse alıcılar b
FREE
Dynamic Pivot Zones
Vincent Jose Proenca
Dynamic Pivot Zones – Your Level Assistant on the Chart This indicator is a bit like a GPS for your trading . It shows you where the price likes to hang out, where it gets nervous, and where it flies through. No more calculating pivots by hand or guessing support and resistance levels. What it does: Automatically plots H1, H4, and D1 pivots . Shows support and resistance zones : R1, R2, S1, S2. Lines are colored and easy to read , so you can instantly see what’s hot or cold. Why you’ll love it:
FREE
Volume-to-Price Movement Oscillator (VP Oscillator) for MT5 The VP Oscillator highlights the balance (or imbalance) between trading volume and price movement, helping traders spot hidden accumulation, distribution, or weakening trends. How It Works: Calculates each bar’s price range (High–Low) and tick volume. Normalizes both values over a set period (default: 14). Plots the absolute difference between them ×100 — showing how closely price action aligns with trading activity. Interpretation: Hig
FREE
Custom Box CFDs
Vincent Jose Proenca
Range Box Indicator for Trading Sessions This indicator allows traders to visualize and analyze specific time ranges directly on their chart by drawing rectangular boxes for each trading session. Key Features: Customizable session interval: set your own session start and end times. Number of days displayed: choose how many past sessions are visible. Default color and special color for Monday: easily highlight weekly patterns. Adjustable border width: customize the appearance of the rectangles to
FREE
This indicator allows you to number bars within a trading session for CFDs. It works on GER40, UK100, US30, US100, and US500 and is fully customizable to fit your trading style and chart preferences. Key Features & Parameters: Customizable session interval: define your own session start and end times Option to hide even numbers for a cleaner chart Adjust number distance to position the bar numbers as you prefer Font size and color: choose the size and color that suit your chart Number of days di
FREE
VMS Oscillator
Vincent Jose Proenca
Volume & Move Strength (VMS) Indicator for MT5 The VMS Indicator displays the relationship between trading volume and price movement strength, helping traders assess how well market activity supports price action. How It Works: Measures tick volume as trading activity. Calculates move strength using a normalized True Range (%). Both values can be smoothed (default: 5) and optionally normalized (0–100) for consistency across markets. Plots two lines in a separate window: Blue (Volume) – trading a
FREE
indicator that numbers the bars (candles) in a custom trading session. The indicator allows: Defining the session start time (StartHour and StartMinute) Displaying numbers only on odd bars (if AfficherUniquementImpairs is true) Displaying numbers on the last N days (NbJours) Customizing the color and font size of the text The indicator will loop through the bars of the last N days and, for each day, start counting from the session start time. It will display the bar number (starting at 1) belo
FREE
STRUCTURAL TREND LINES - MT4 Indicator Simple indicator that automatically draws trend lines based on market structure. Features: - 3 degrees of structure detection (short, medium, long term) - Configurable swing strength for each degree - Single color per degree for clean visualization - Adjustable number of lines per degree - Customizable colors and line widths How it works: The indicator identifies swing highs and lows based on the strength parameter, then connects these points to create t
FREE
Adaptive Flow MAs
Vincent Jose Proenca
Adaptive Flow MAs is a moving average indicator designed to naturally adjust to market movements. Unlike traditional averages, it dynamically adapts its periods based on recent volatility and the current trend. The EMA closely follows rapid price swings to capture every impulse, while the SMA remains smoother, providing a stable and reliable reference. With a clean display showing the current adaptive periods, this tool helps traders feel the “flow” of the market without visual clutter. It’s cr
FREE
STRUCTURAL TREND LINES - MT4/MT5 Indicator Simple indicator that automatically draws trend lines based on market structure. Features: - 3 degrees of structure detection (short, medium, long term) - Configurable swing strength for each degree - Single color per degree for clean visualization - Adjustable number of lines per degree - Customizable colors and line widths How it works: The indicator identifies swing highs and lows based on the strength parameter, then connects these points to crea
FREE
The Candle Activity Visualizer turns your chart into a dynamic heatmap, giving you a clear view of buying and selling pressure. In-Depth Market Insight: Active Zone Detection: The algorithm highlights areas where high volume builds up within a narrow price range, revealing key pressure zones. Real-Time Intensity: Colors adjust in real time, shifting smoothly from cool tones to warmer shades as activity increases. Visual Customization: 5 Color Palettes: Choose from five professionally designed th
Rainbow Price Visualizer v1.21 See where the market really breathes. Turns your MT4 chart into an ultra-precise heatmap that highlights price zones favored by big players. Why it matters 300 price levels at 0.2‑pip resolution — microscopic detail. 8 visual themes (Rainbow, Fire, Ocean…) for instant readibility. Smart opacity: low noise fades, real zones pop. Lightweight rendering with automatic cleanup. Fully customizable: saturation, opacity, resolution, history depth. Bands project into the f
Baloncuk Göstergesi — Fiyat Yavaşlaması + Hacim Sıçraması Fiyat aniden yavaşladığında ve aynı anda hacim yükseldiğinde grafikte renkli kareler gösteren basit bir görsel araç. (Doldurma fonksiyonu ve konsantrik baloncuk efekti içerir) Piyasanın hareket etmeye hazırlanacağı önemli anları tespit etmeye yardımcı olur. Göstergenin yaptığı şeyler: Piyasanın hareket etmeden önce “tereddüt ettiği” anları tespit eder Büyük hacim girişlerinin fiyatı çok fazla hareket ettirmediği noktaları gösterir Olası k
Institutional Flow Indicator A smart volume-based tool that detects institutional activity zones through direct order flow patterns. It reveals where large institutions operate. An advanced volume indicator that filters out noise to identify probable institutional patterns. Key Features Smart cluster detection Automatic identification Signal classification: Violet / Yellow – Institutional Zone – Strong, sustained institutional activity Red / Green – Strong Signal – Significant buying/selling pre
AMD Adaptive MA MT4
Vincent Jose Proenca
5 (1)
AMD Uyarlanabilir Hareketli Ortalama (AAMA) AAMA, MetaTrader 4 için geliştirilmiş, piyasa koşullarına göre tepkisini otomatik olarak ayarlayan bir uyarlanabilir hareketli ortalama göstergesidir. Temel Özellikler: Kaufman Verimlilik Oranı’na dayalı uyarlanabilir hareketli ortalama – güçlü trendlerde hızlı tepki verir, yatay piyasalarda gürültüyü filtreler 4 AMD piyasa aşamasının otomatik tespiti: Birikim (Accumulation), Yükseliş (Markup), Dağıtım (Distribution), Düşüş (Markdown) ATR aracılığıyla
STRUCTURAL TREND LINES - MT4 Indicator Simple indicator that automatically draws trend lines based on market structure. Features: - 3 degrees of structure detection (short, medium, long term) - Configurable swing strength for each degree - Single color per degree for clean visualization - Adjustable number of lines per degree - Customizable colors and line widths How it works: The indicator identifies swing highs and lows based on the strength parameter, then connects these points to create t
Volume Profil MT4
Vincent Jose Proenca
Volume Profile Rectangle – Ürün Açıklaması Özet Seçilen bir alan içindeki her fiyat seviyesindeki işlem hacminin yatay analizini gösteren interaktif bir hacim profili göstergesidir . Otomatik olarak taşınabilir bir dikdörtgen oluşturur ve yükseliş (bullish) ve düşüş (bearish) hacim dağılımını renkli çubuklarla gösterir. Neler yapar: Yatay hacmi gösterir : Her fiyat seviyesindeki hacim dağılımını yatay çubuklar şeklinde görselleştirir Yükseliş/Düşüş analizi : Çubukları yeşil (yükseliş hacmi baskı
Proxy OrderFlow MT4
Vincent Jose Proenca
5 (1)
Tick-spread dengesizliğine dayalı gösterge. TF: Tüm zaman dilimlerinde çalışır (M1’den D1’e). Parite: Forex, endeksler, altın ve CFD’lerle uyumludur (JPY, Altın ve CFD enstrümanları için otomatik ayar). Ayarlar: TickWindow (200) – tik gözlem penceresi SpreadWeight (1.5) – spread ağırlığı NormalizationPeriod (20) – normalizasyon periyodu (z-score) Overbought / Oversold (±3.0) – uyarı eşikleri AlertCooldown (300s) – uyarılar arasındaki bekleme süresi Sonuç: Proxy Order Flow – Imbalance Tick-Spr
Nexus Signal System
Vincent Jose Proenca
TEKNİK AÇIKLAMA Nexus Signal System, MT4 için 12 teknik kriteri birleştirerek ticaret sinyalleri üreten bir göstergedir. Sistem, bir sinyali doğrulamadan önce birden fazla faktörün (trend, momentum, hacim, destek/direnç bölgeleri) birleşimini analiz eder; bu sayede yalnızca tek bir kriter kullanan göstergelere kıyasla yanlış sinyallerin sayısı azalır. ANALİZ KRİTERLERİ (0–15 Puan): Formasyon tespiti (pin bar, engulfing) Çoklu Zaman Çerçevesi Analizi (üst zaman diliminde trend doğrulama) ADX Piya
VR Signal
Vincent Jose Proenca
VolumeRejectionSignals v5.0 Gelişmiş Hacim Analiz Göstergesi Genel Açıklama VolumeRejectionSignals v5.0, hacim retlerini derinlemesine analiz ederek önemli fiyat hareketlerini doğru bir şekilde tespit etmek için tasarlanmış gelişmiş bir teknik göstergedir. Emir akışı dinamikleri ve piyasa yapısını birleştirerek, alım veya satım baskısının azaldığı bölgeleri tespit eder ve trend dönüşlerini veya hızlanmalarını önceden tahmin etmeyi sağlar. Akıllı Puanlama Sistemi Göstergeler, her sinyalin kalit
Liquidity Compression MT4
Vincent Jose Proenca
5 (1)
Kurumsal Likidite Sıkışma Göstergesi Bu gösterge, Bollinger Bantlarının normalize edilmiş genişliğini, hacmi ve ortalama spread’i kullanarak likidite daralmasını gerçek zamanlı olarak ölçer ve fiyat kırılmalarından önceki sıkışma evrelerini tespit eder. Görünüm: Profesyonel tarzda ayrı bir pencerede “Compression Score” histogramı ve “Threshold” referans çizgisi. Temel Özellikler Erken tespit: Fiyat hareketlerinden önce daralma bölgelerini belirler. Çok faktörlü ölçüm: Normalize edilmiş Bollinge
Mean Reversion Probability – İstatistiksel Dönüş Göstergesi Kısa açıklama Piyasa yorgunluk bölgelerini nicel hassasiyetle tanımlayan, 200 hareketli ortalamaya geri dönüş olasılığını tarihsel aşırılıklar analizine dayanarak hesaplayan kurumsal bir göstergedir. Temel Özellikler Gelişmiş istatistiksel analiz – Gerçek olasılıkları hesaplamak için 500+ tarihsel aşırılık veritabanı oluşturur Olasılık skoru 0–99% – Ortalama dönüş olasılığını kesin olarak ölçer Yorgunluk tespiti – Aşırılığın süresini
WBP Chart Signals
Vincent Jose Proenca
WBP Chart Signals – Çok zaman dilimli alım/satım baskı göstergesi Açıklama: WBP Chart Signals, hacim, spread ve fiyat hareketini analiz ederek piyasa baskısını ölçen gelişmiş bir göstergedir. Çok zaman dilimli onay ve kurumsal analiz tarzı ile hassas sinyaller arayan yatırımcılar için idealdir. Ana Özellikler: Weighted Buy Pressure (WBP): VWAP, MA200, hacim gücü, likidite ve momentumu birleştiren özel algoritma Çok zaman dilimli analiz: Üst zaman diliminde otomatik onay Gerçek zamanlı çok sembo
Filtrele:
Değerlendirme yok
Değerlendirmeye yanıt