Moving VVC mt5
- Göstergeler
-
Andriy Sydoruk
 https://www.mql5.com/ru/users/andreys/seller
Large selection of products for different tastes.
e-mail: andriisydoruk@gmail.com - Sürüm: 1.0
- Etkinleştirmeler: 5
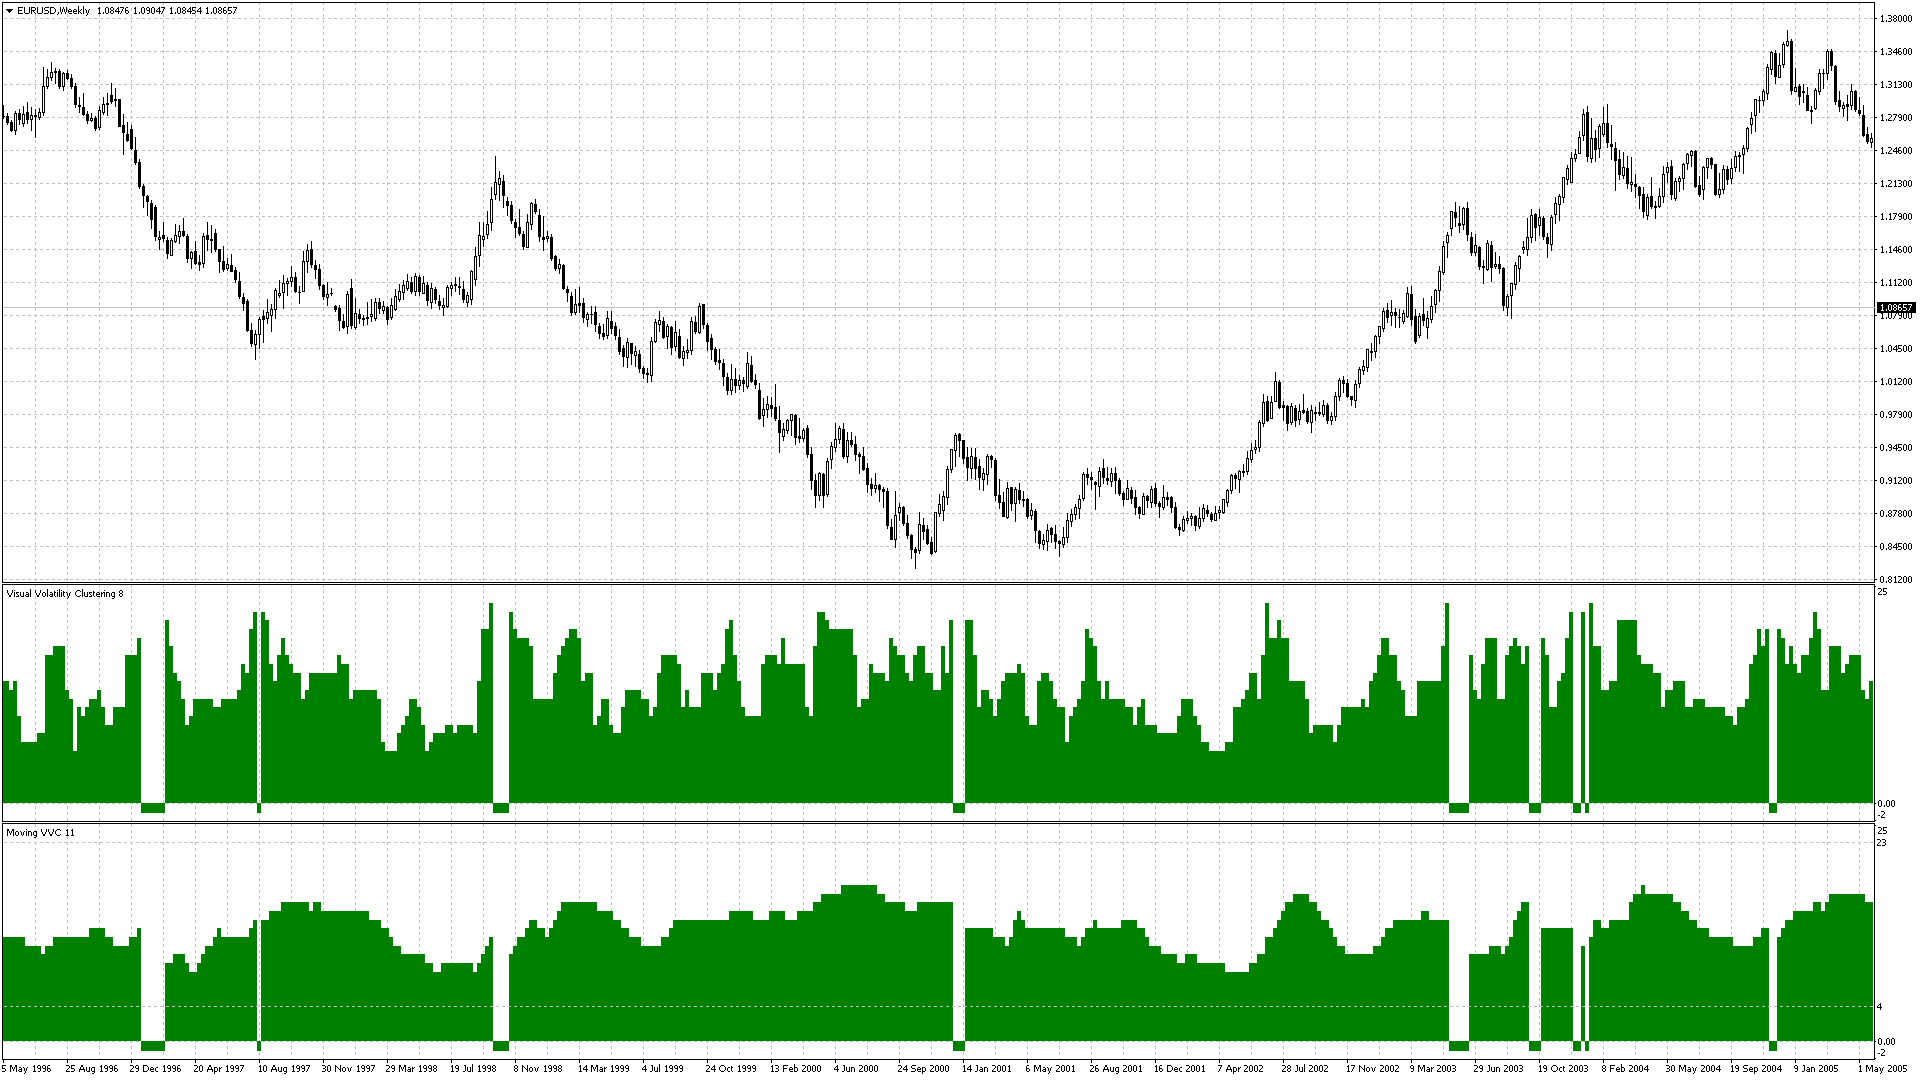
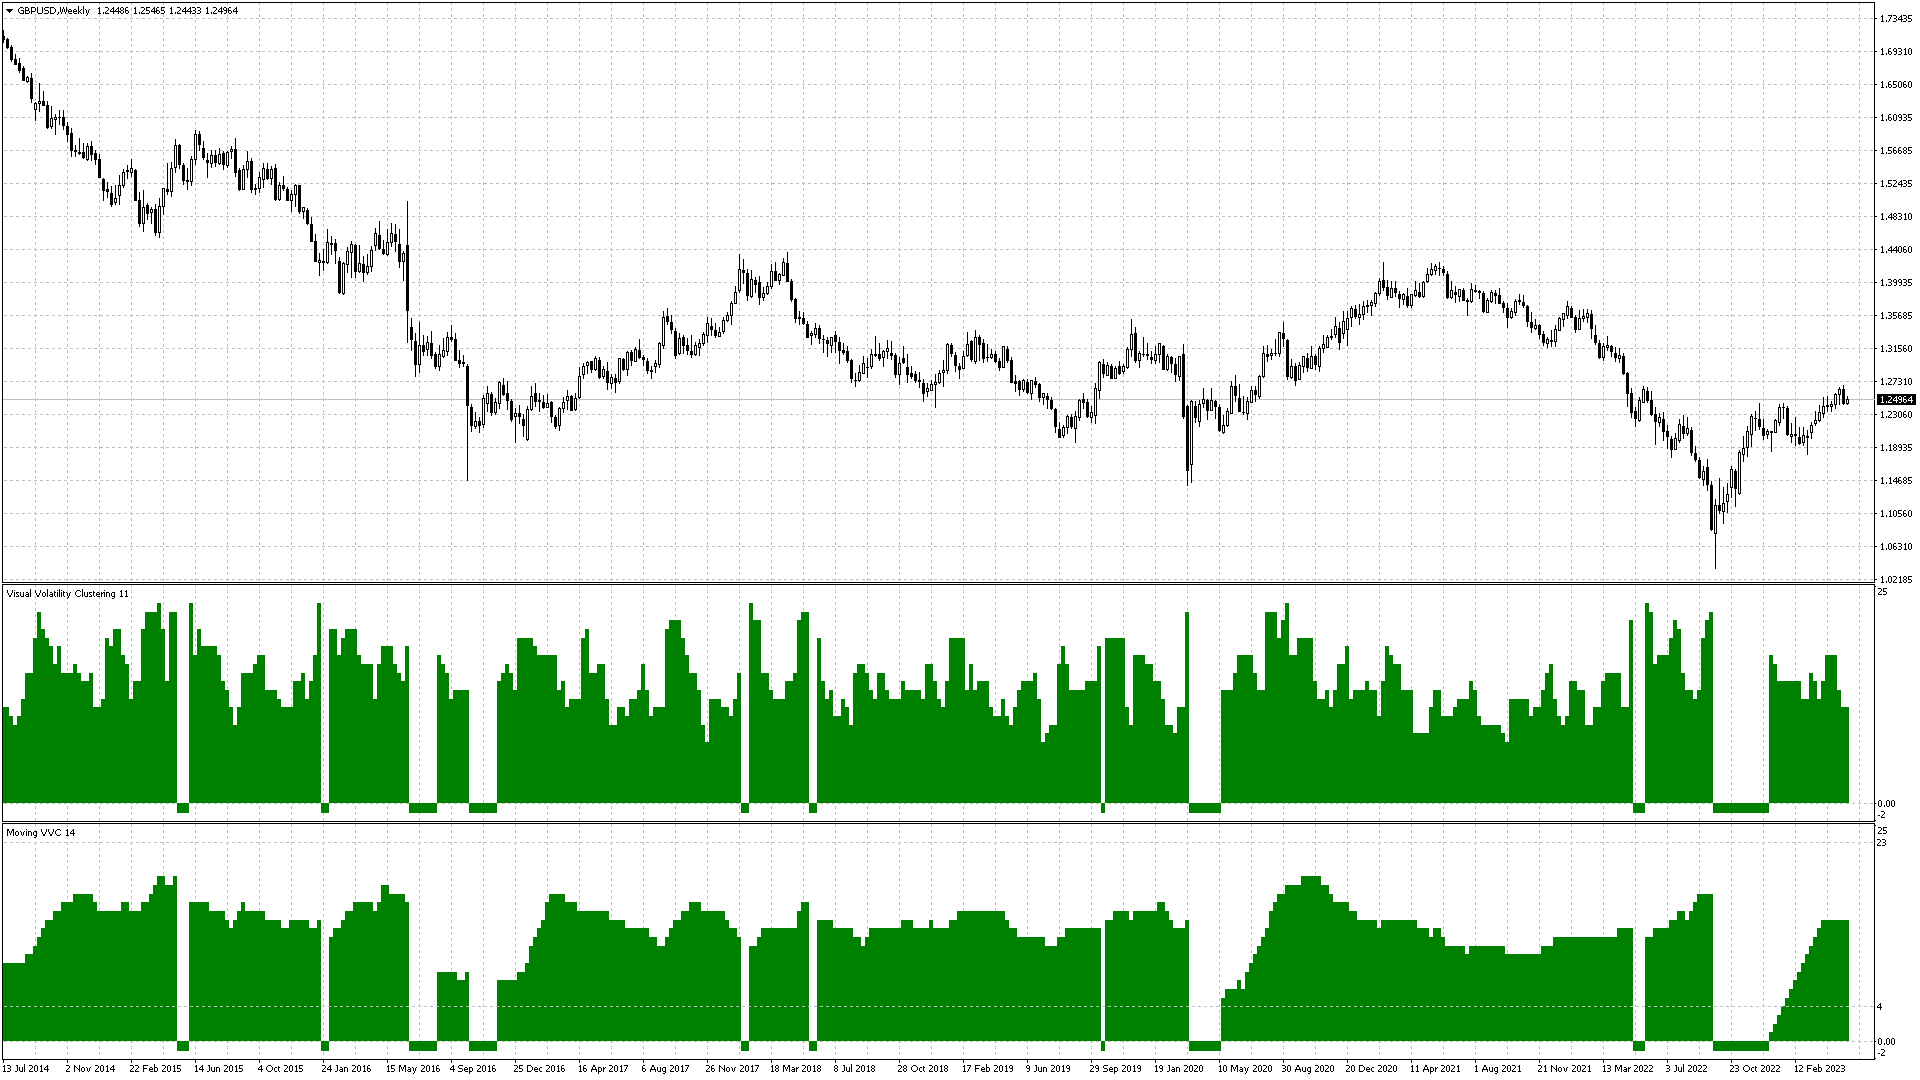
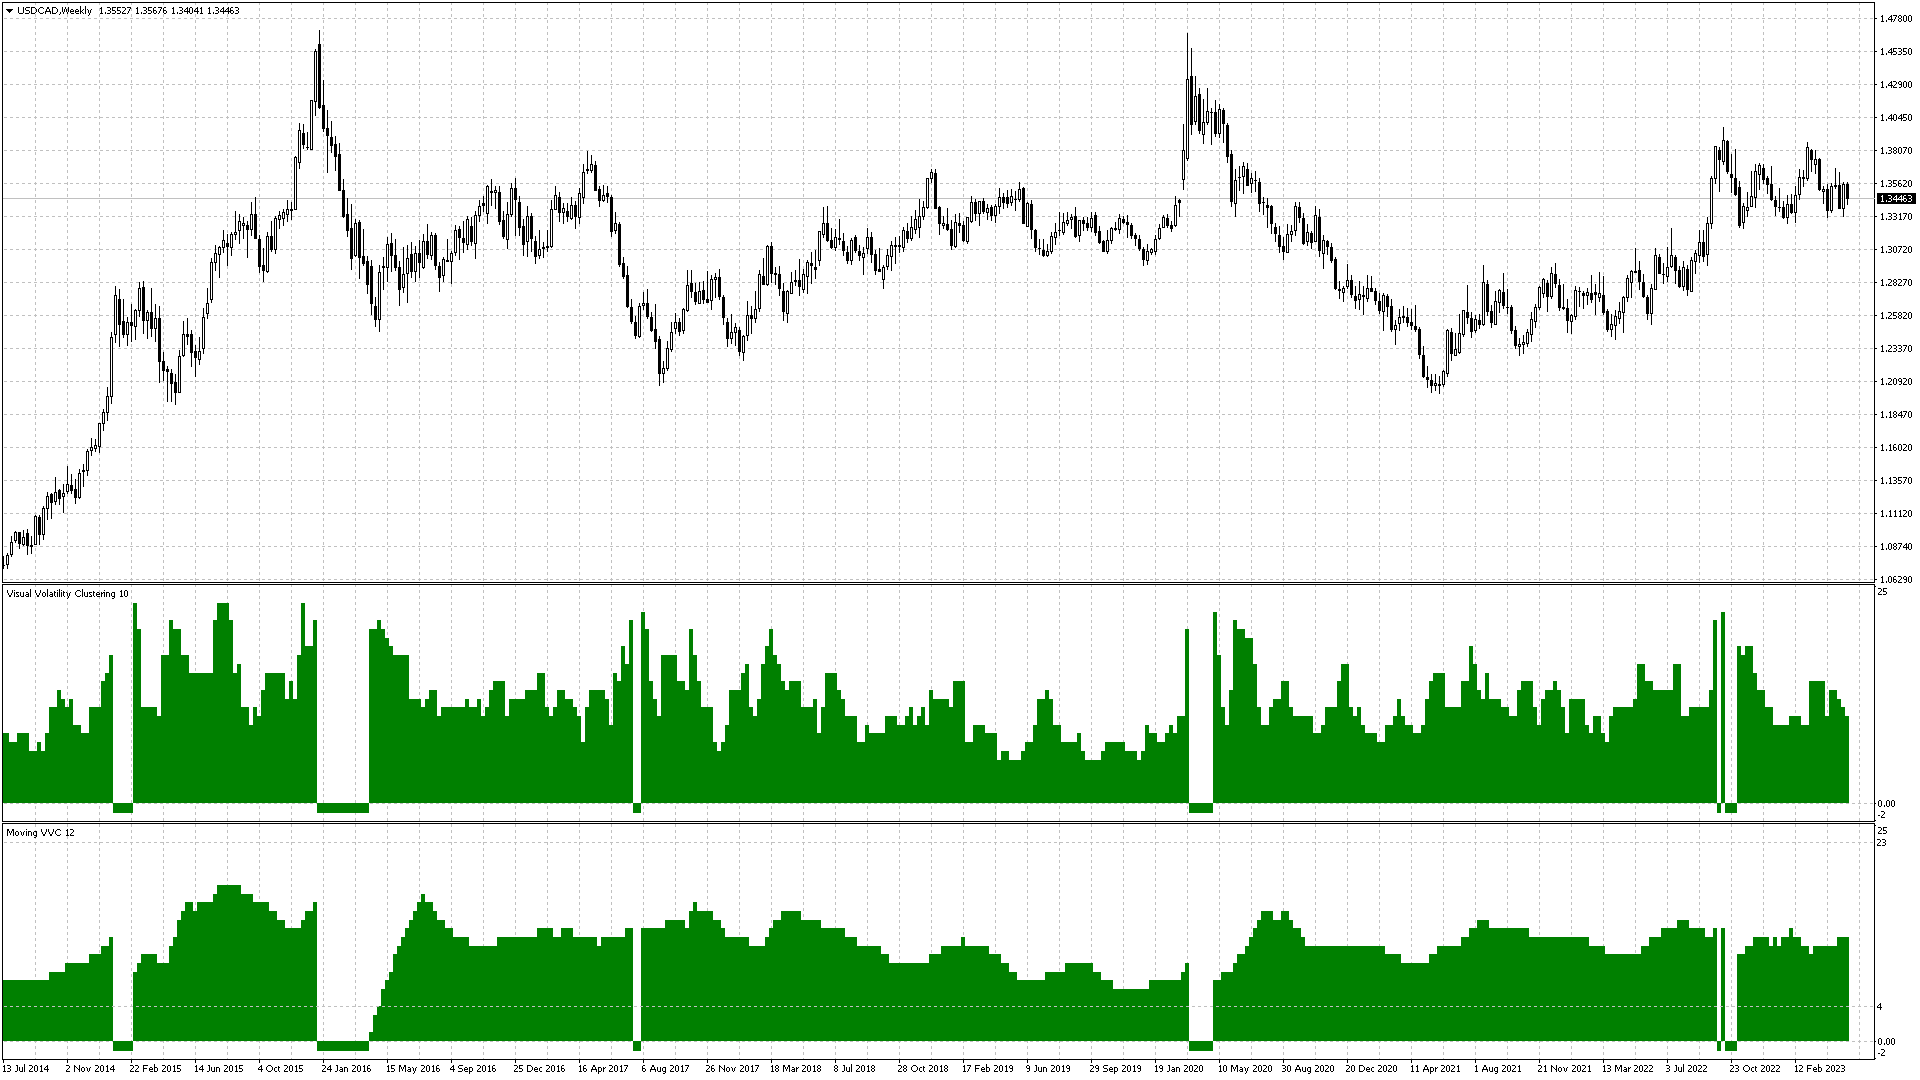
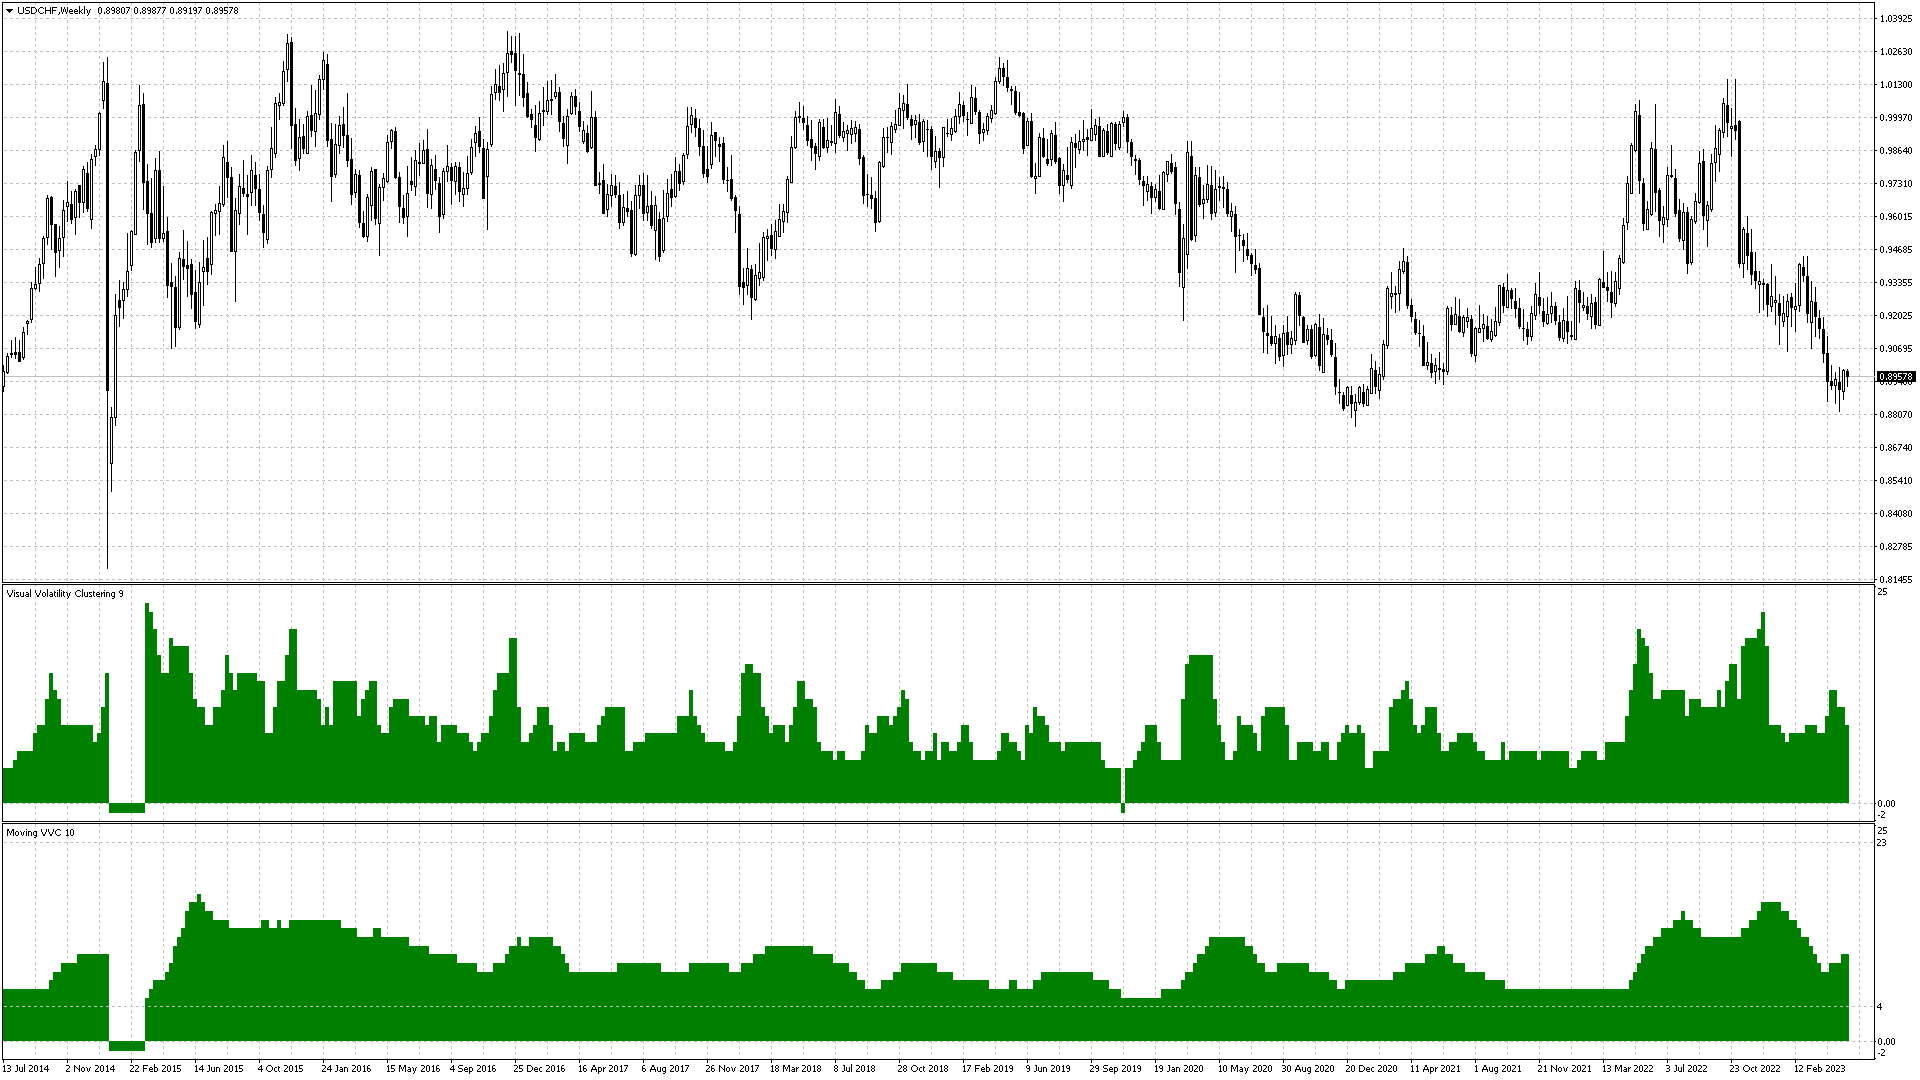
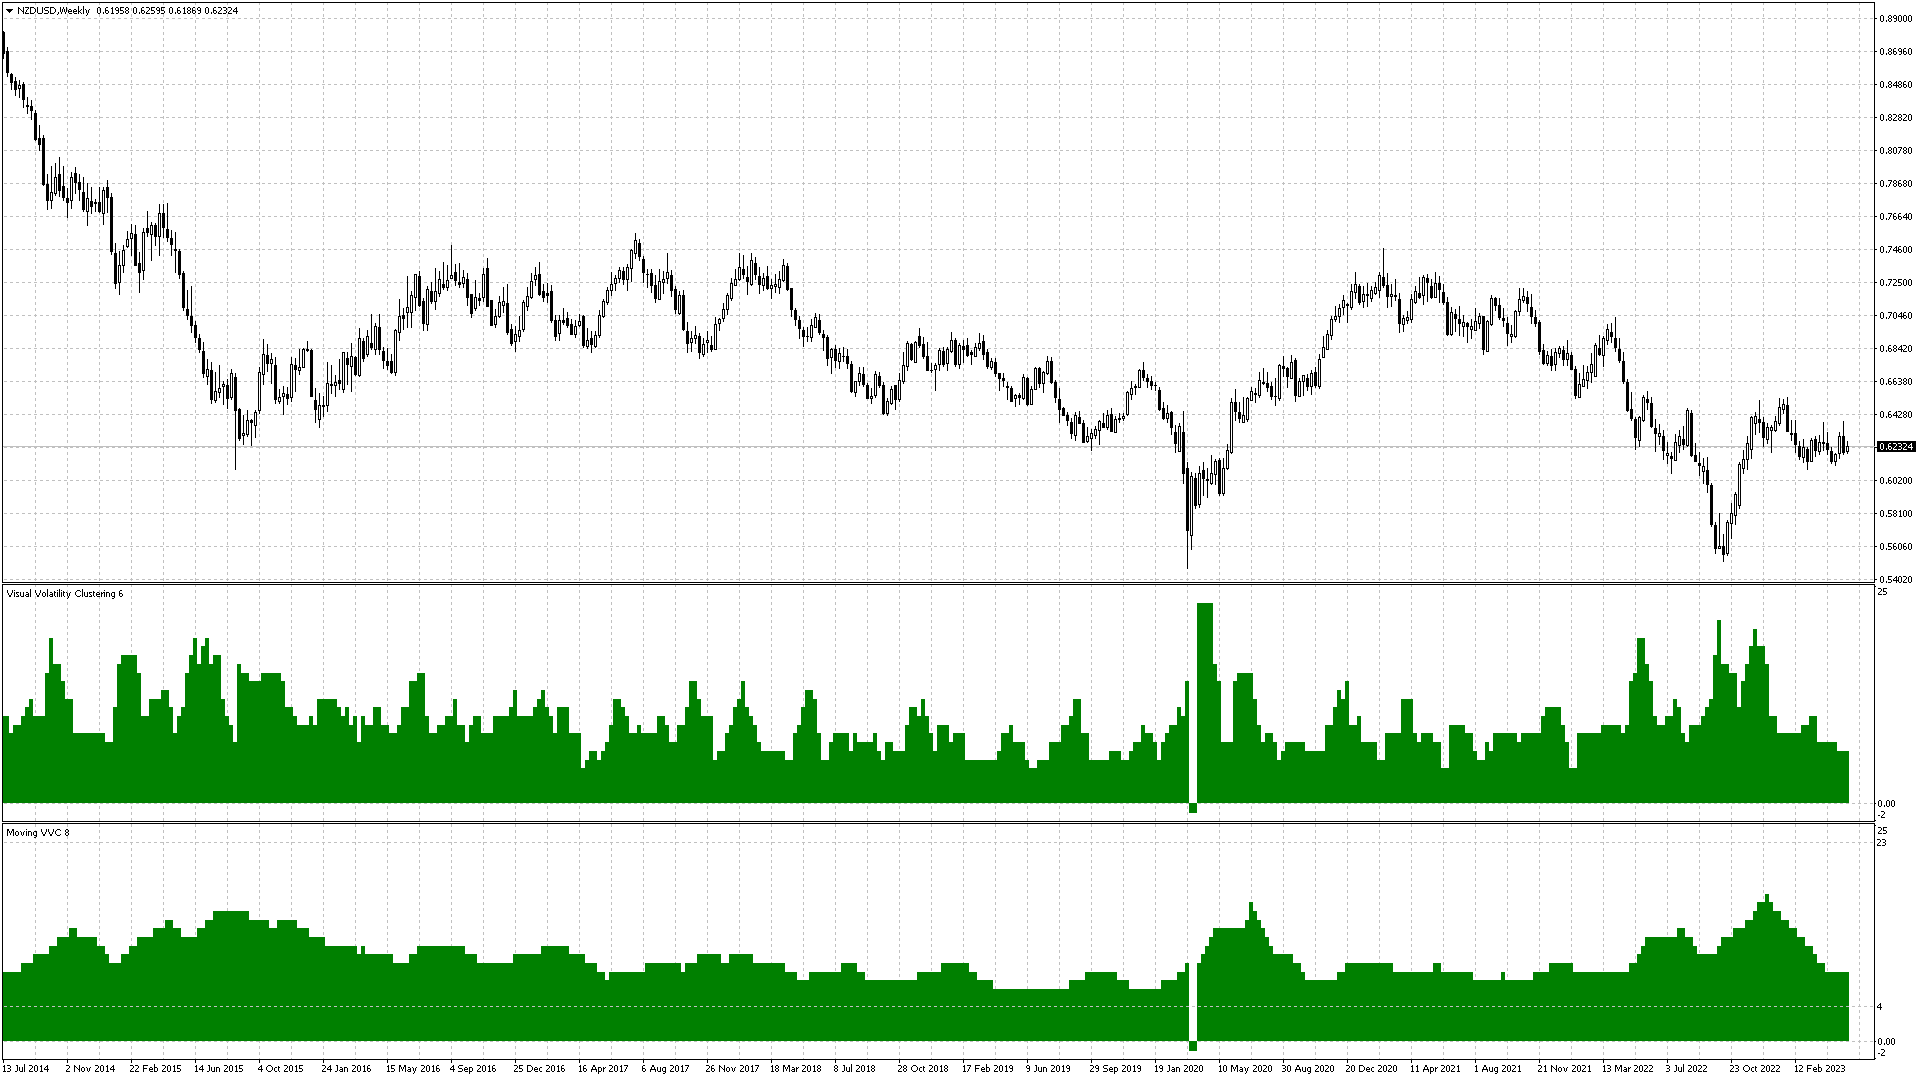
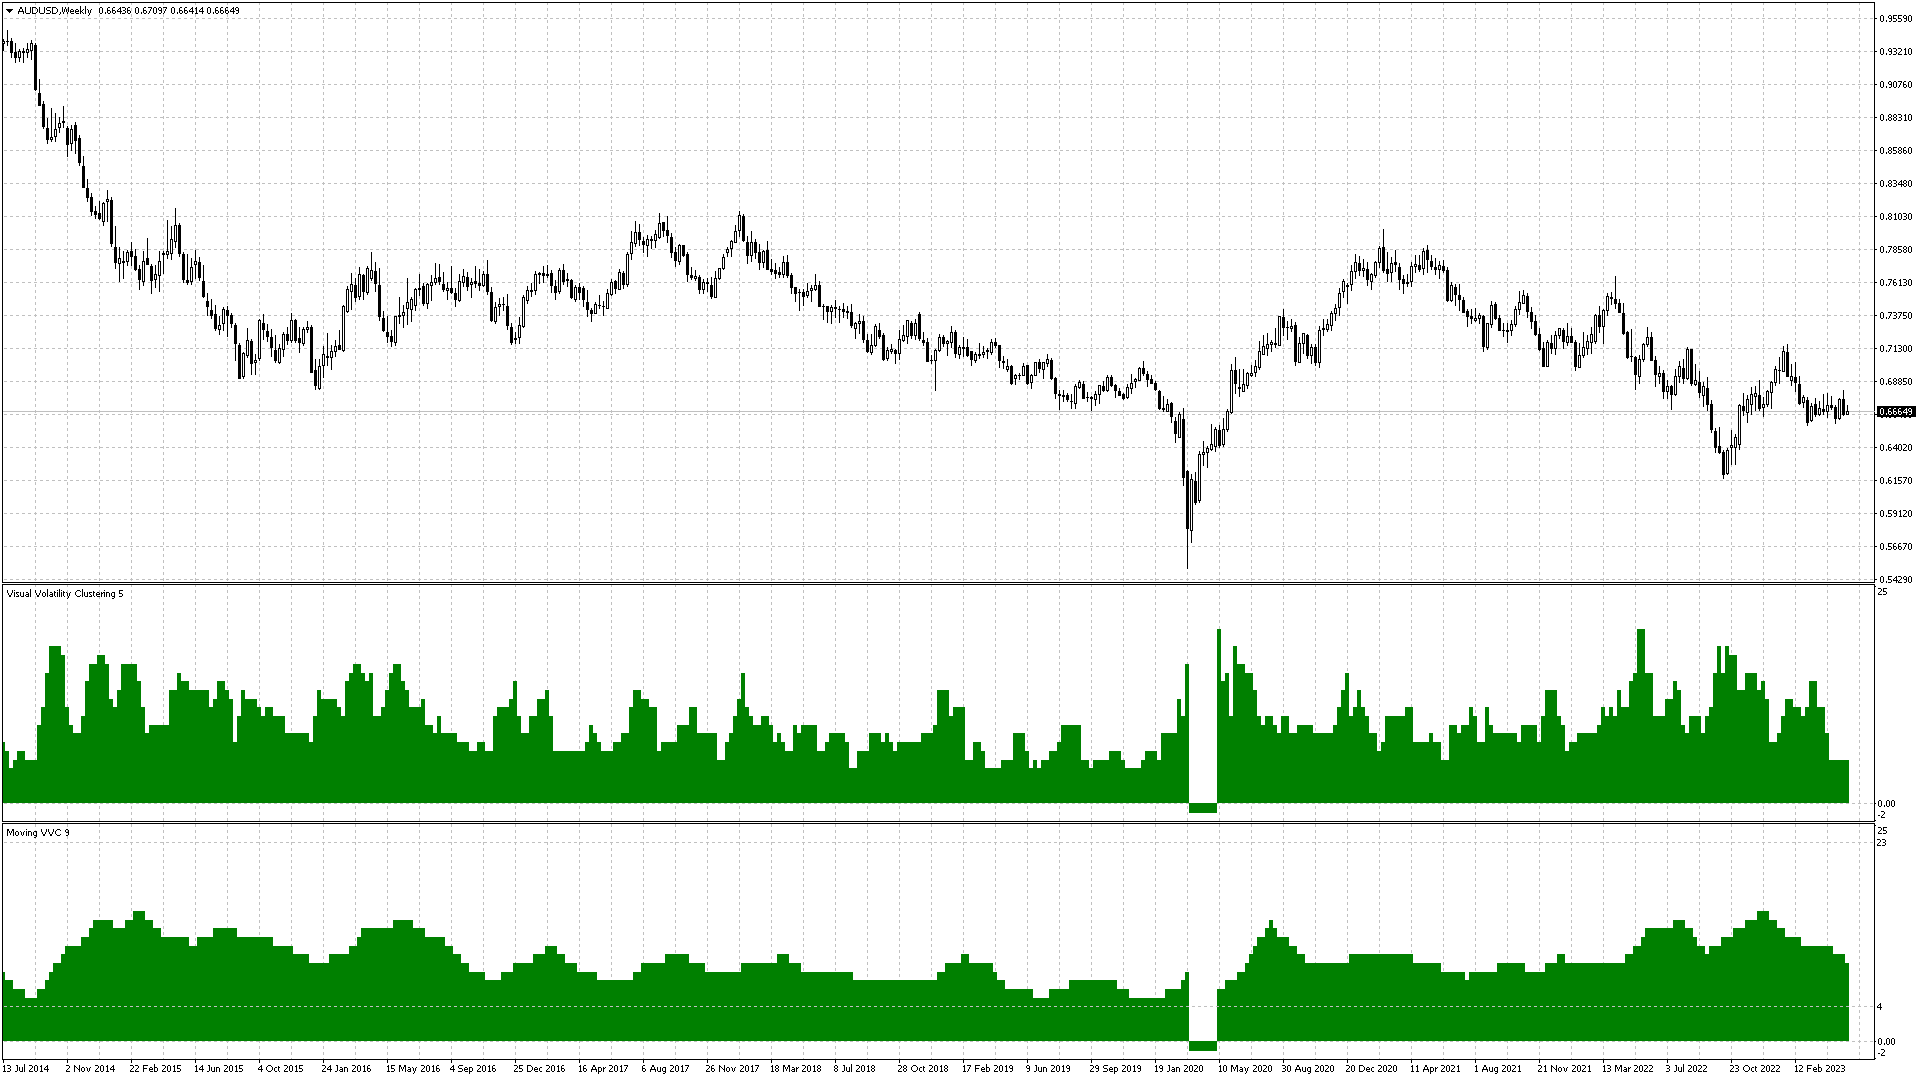
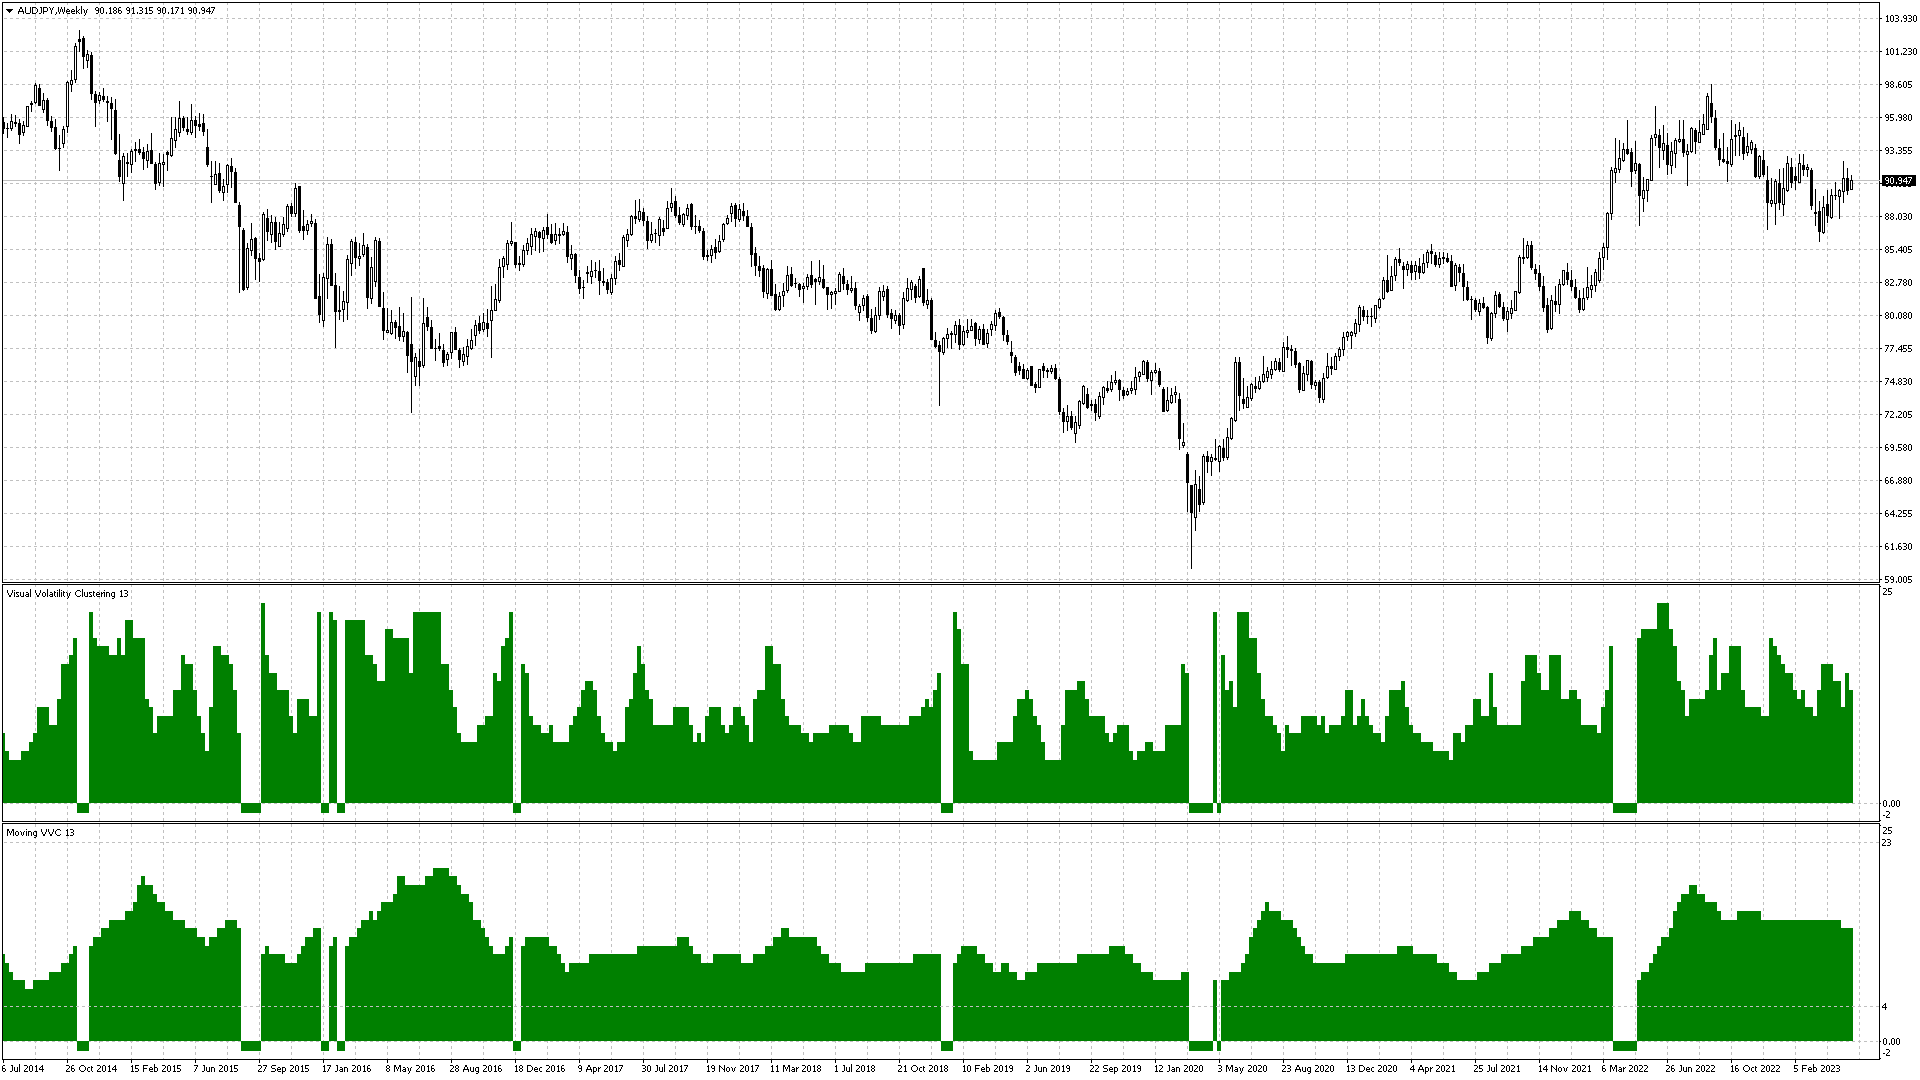
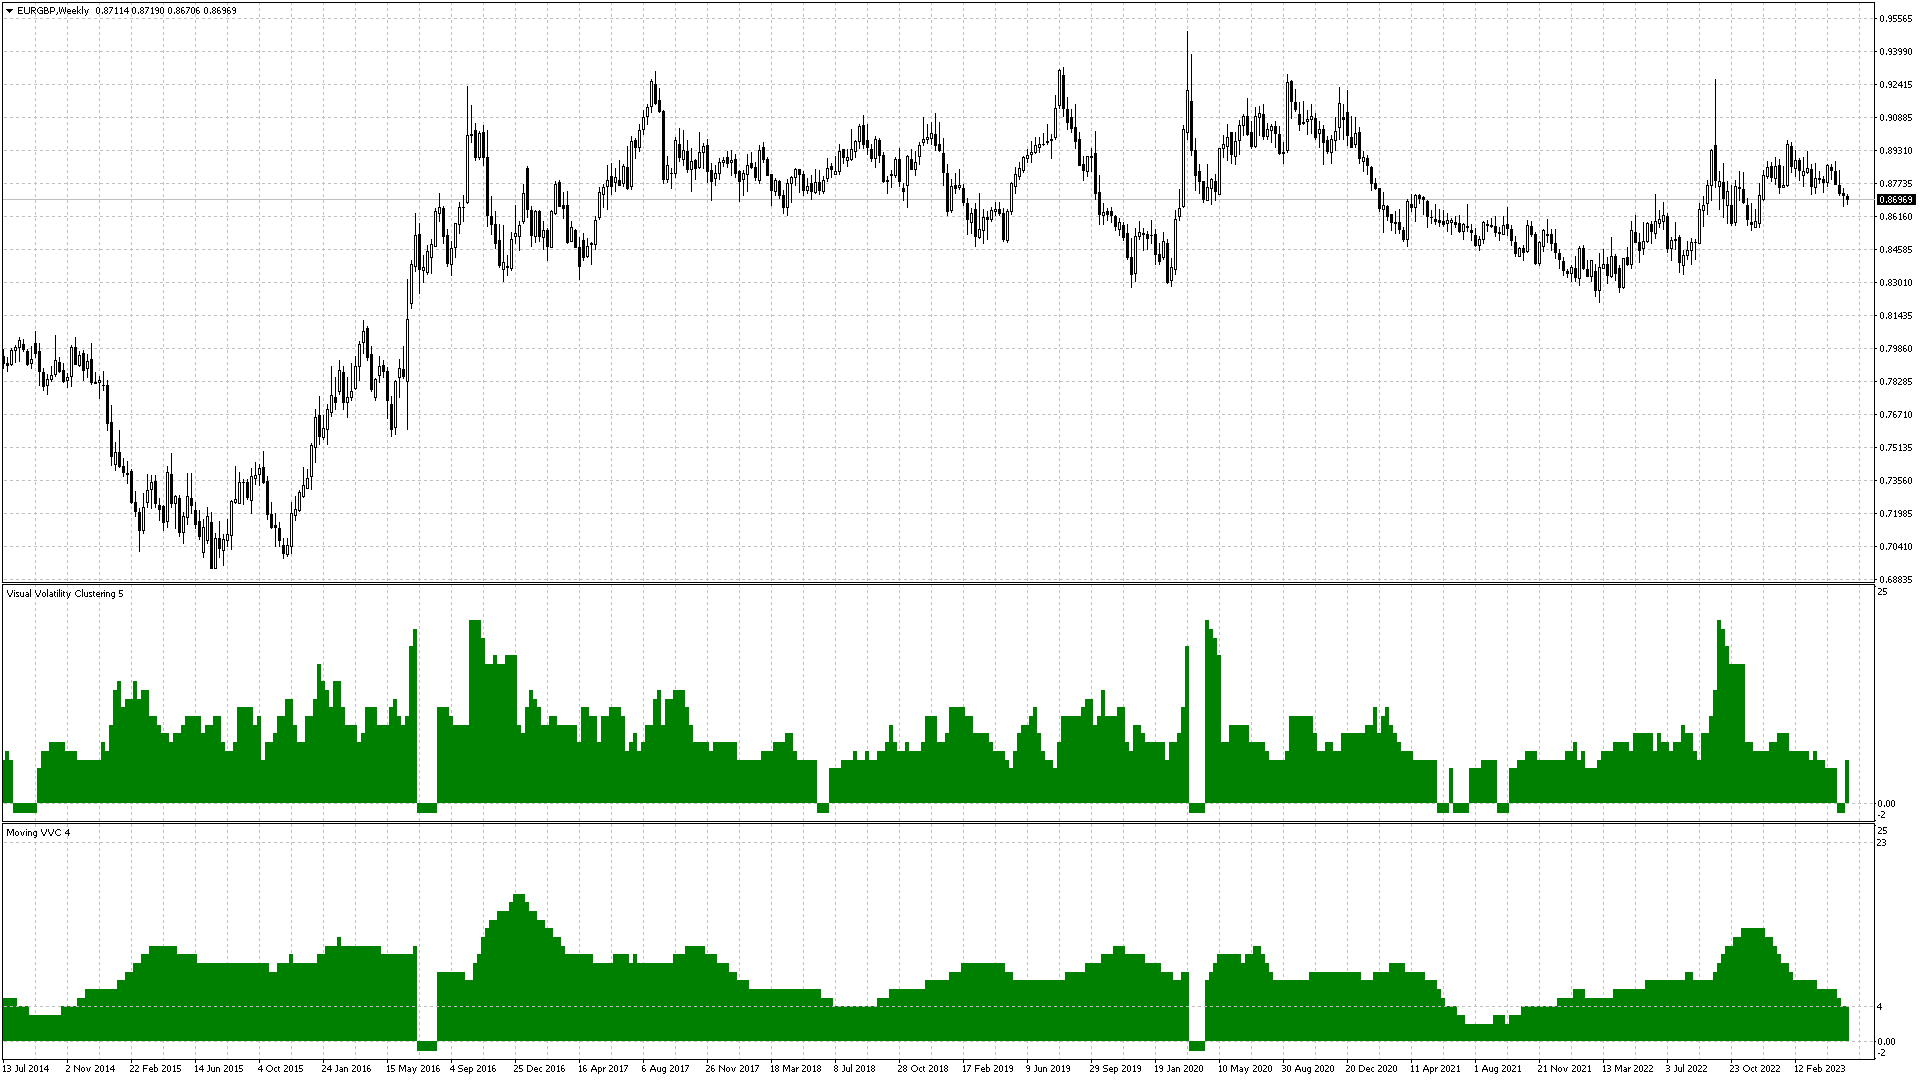
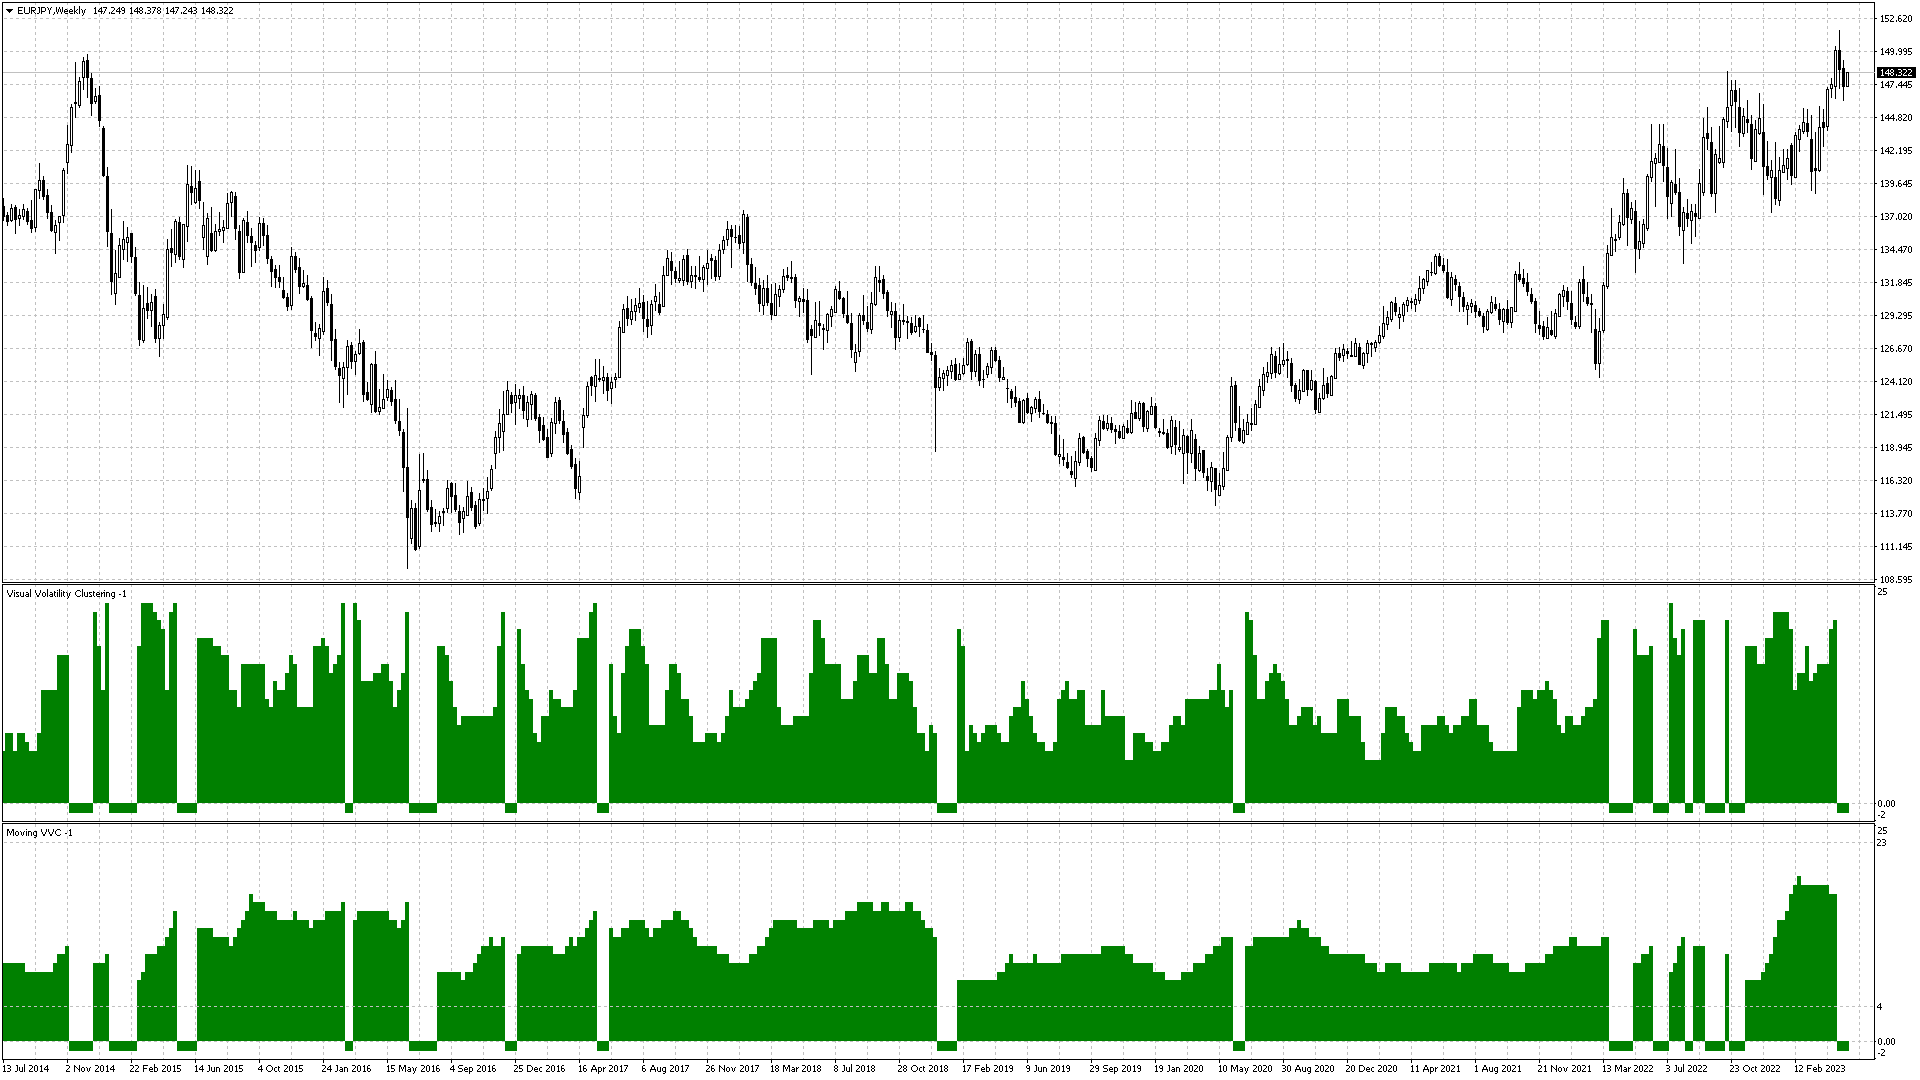
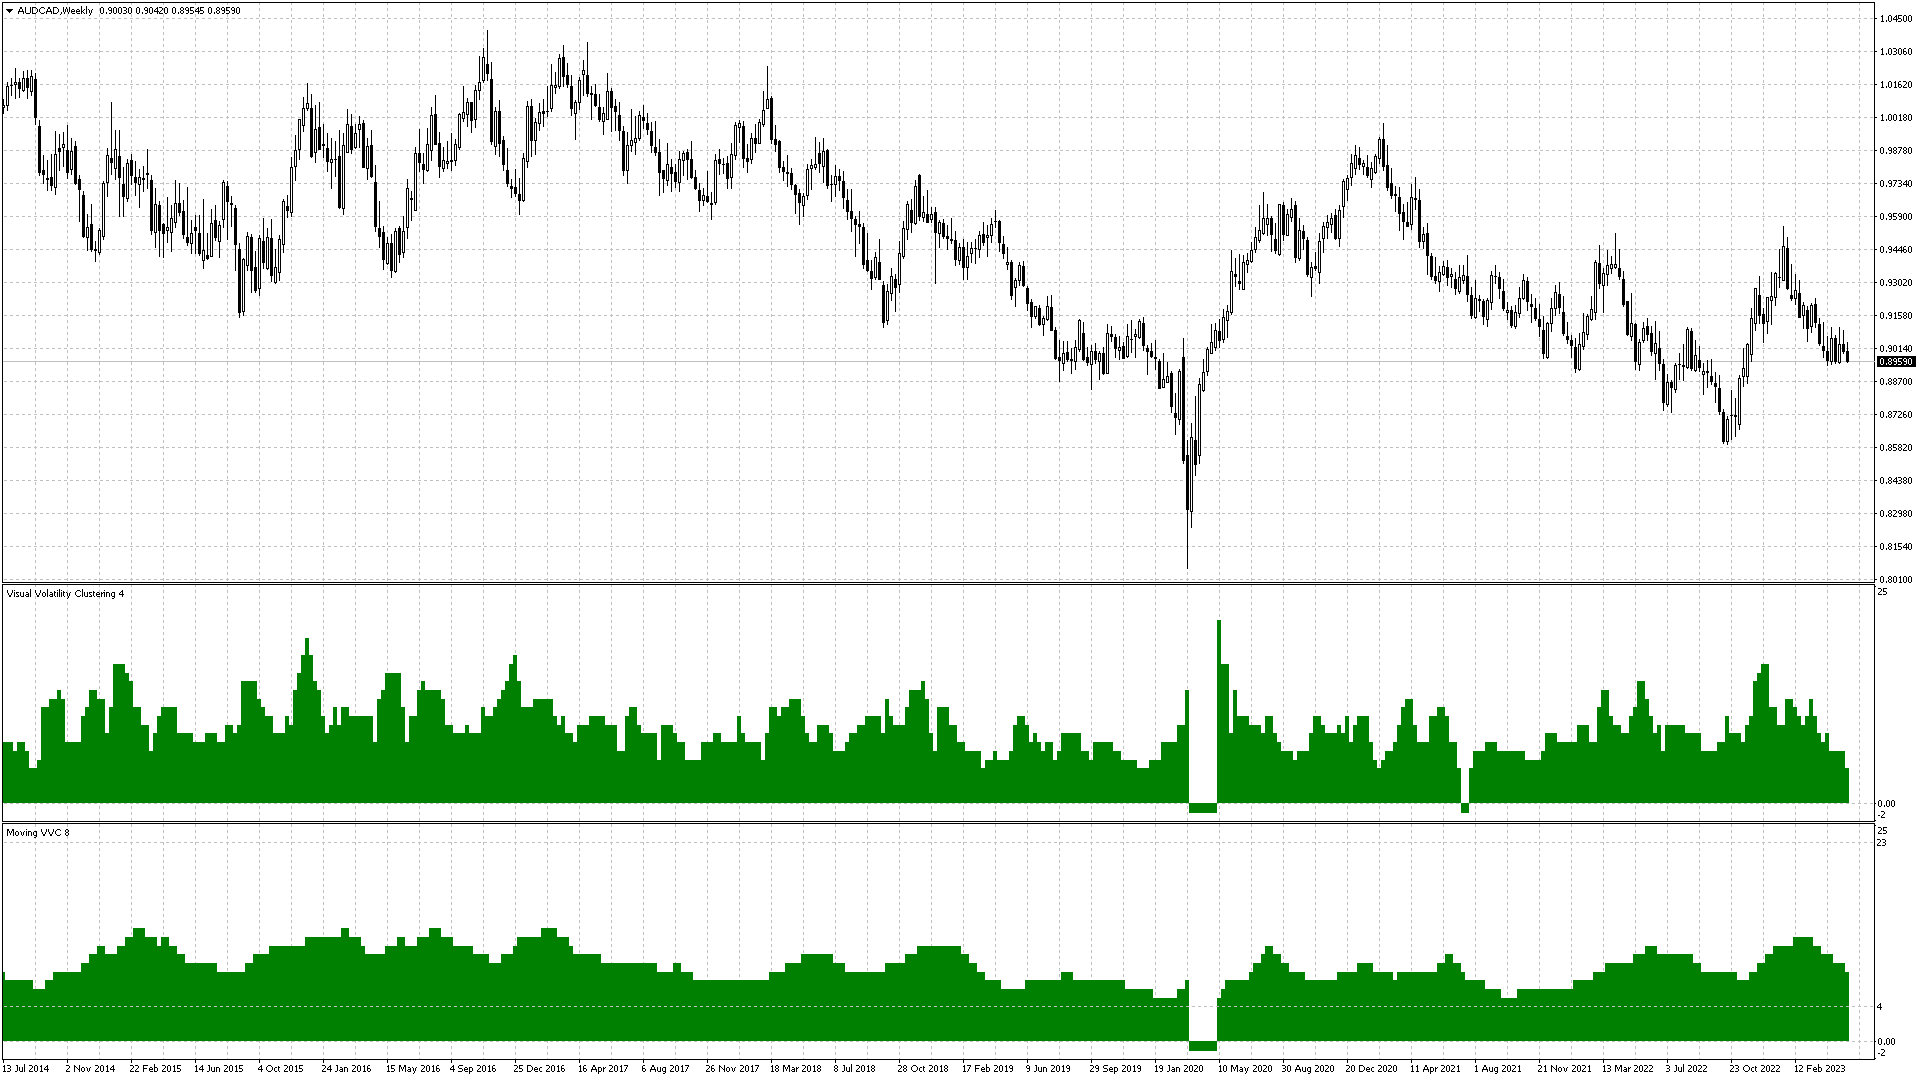
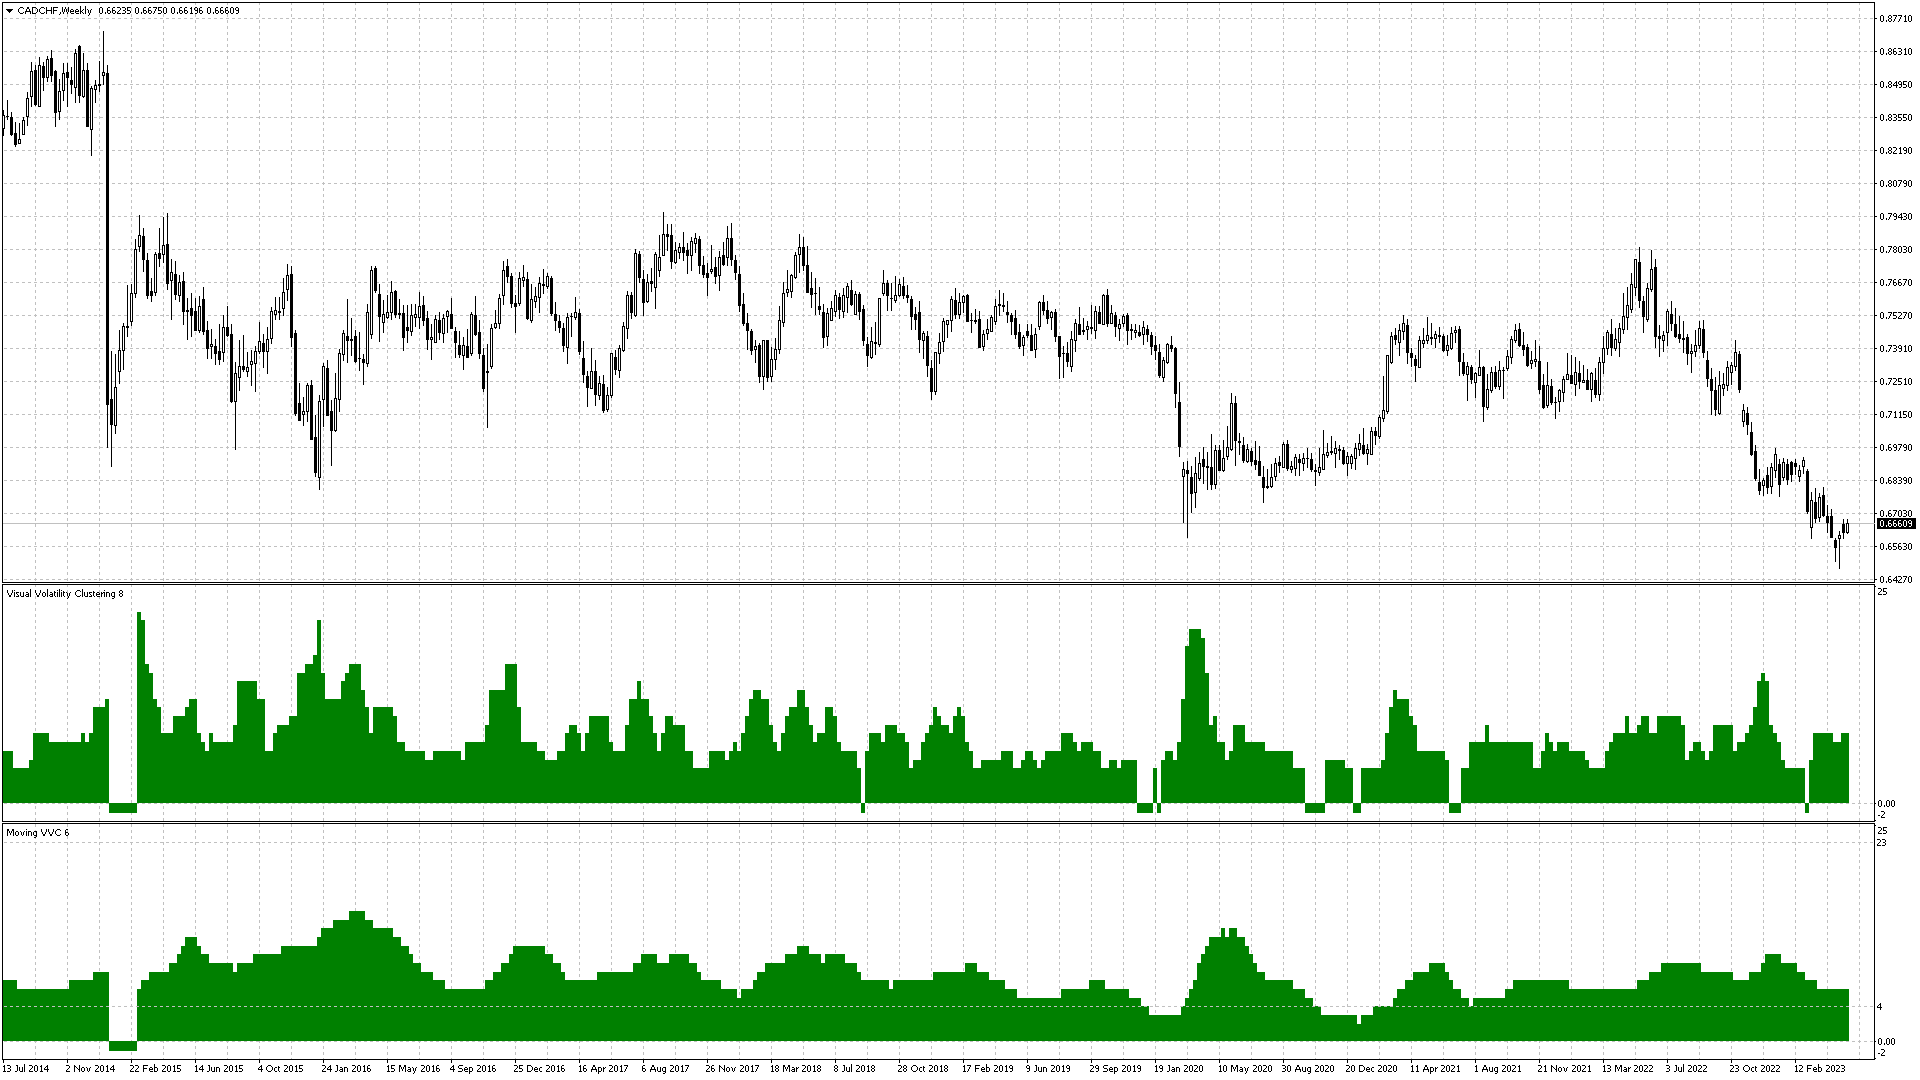
The Visual Volatility Clustering indicator clusters the market based on volatility. The indicator does not redraw and gives accurate data, does not use closing prices. Uses the opening prices or the highs or lows of the previous completed bar. Therefore, all information will be clear and unambiguous. The essence of the indicator is to divide the price market into certain areas according to a similar type of volatility. This can be done in any way. In this example, the indicator is configured for the time period W1 and 24 clusters.
- What does it mean? This means that the entire history is divided into 24 similar volatility types.
- How can it be used? For example, in order to create a bot that will change its settings depending on the cluster, or in manual trading - when changing the cluster, view the bot settings.
Thus, the bot can only learn from its own cluster, and not from the linear history preceding the current period. Such training of the bot has a more potentially correct character, since its settings will be adapted to work on certain historical sections with a similar type of volatility.
For clustering, it is reasonable to use large periods, such as W1, so that you do not change the settings of manual or automated trading very often. Also, 24 clusters are potential 24 areas for work or just 24 different strategies for one currency pair.
This indicator is different in that it can average clusters with a certain period, in the screenshots you see two indicators, one with the Moving period = 1, and the second with the Moving period = 14. Using averaging, we can reduce the number of clusters and at the same time reduce the frequency of cluster change reduce the switching of clusters and, accordingly, your strategies.
Pay attention to the chart, you can see price dips! This can be used as a high filter and not enter the market at that time. These dips are detected even before they appear! That is, in advance.
For those who are interested in the indicator, there is a version for MT4 and MT5.
Options.
- Moving - Cluster averaging period.
- IgnoreZero - Ignore dips, don't average so that the dip is preserved.
- PrintMovingOn - Print results in the message section. TimeLimitOn - Enable clustering on a limited piece of history.
- TimeStart - The beginning of the story.
- TimeFinal - End of story.
- RedundantOn - Take into account the existence of redundant bars that occur on Sunday with some brokers. To ensure that the indicator displays are the same for different brokers.
- Normalize - Cluster normalization, rounding to 0 decimal places in cluster calculation. For ease of understanding.
- ClusteringCount - How many clusters to split the market into.
- WindowLength - Number of bars back in history to calculate volatility.
- Overlapping - Cluster overload. That is, the percentage possibility when one cluster overlaps another. This is visible only in the text report, but not on the graph.
- MinBorder - The minimum volatility window considering the algorithm.
- MaxBorder - The maximum volatility window considering the algorithm.
- MinClustering - The minimum clustering filter considering the algorithm.
- MaxClustering - The maximum clustering filter considering the algorithm.
- PrintOn - Print results in the message section.