Dynamic Pivot Zones

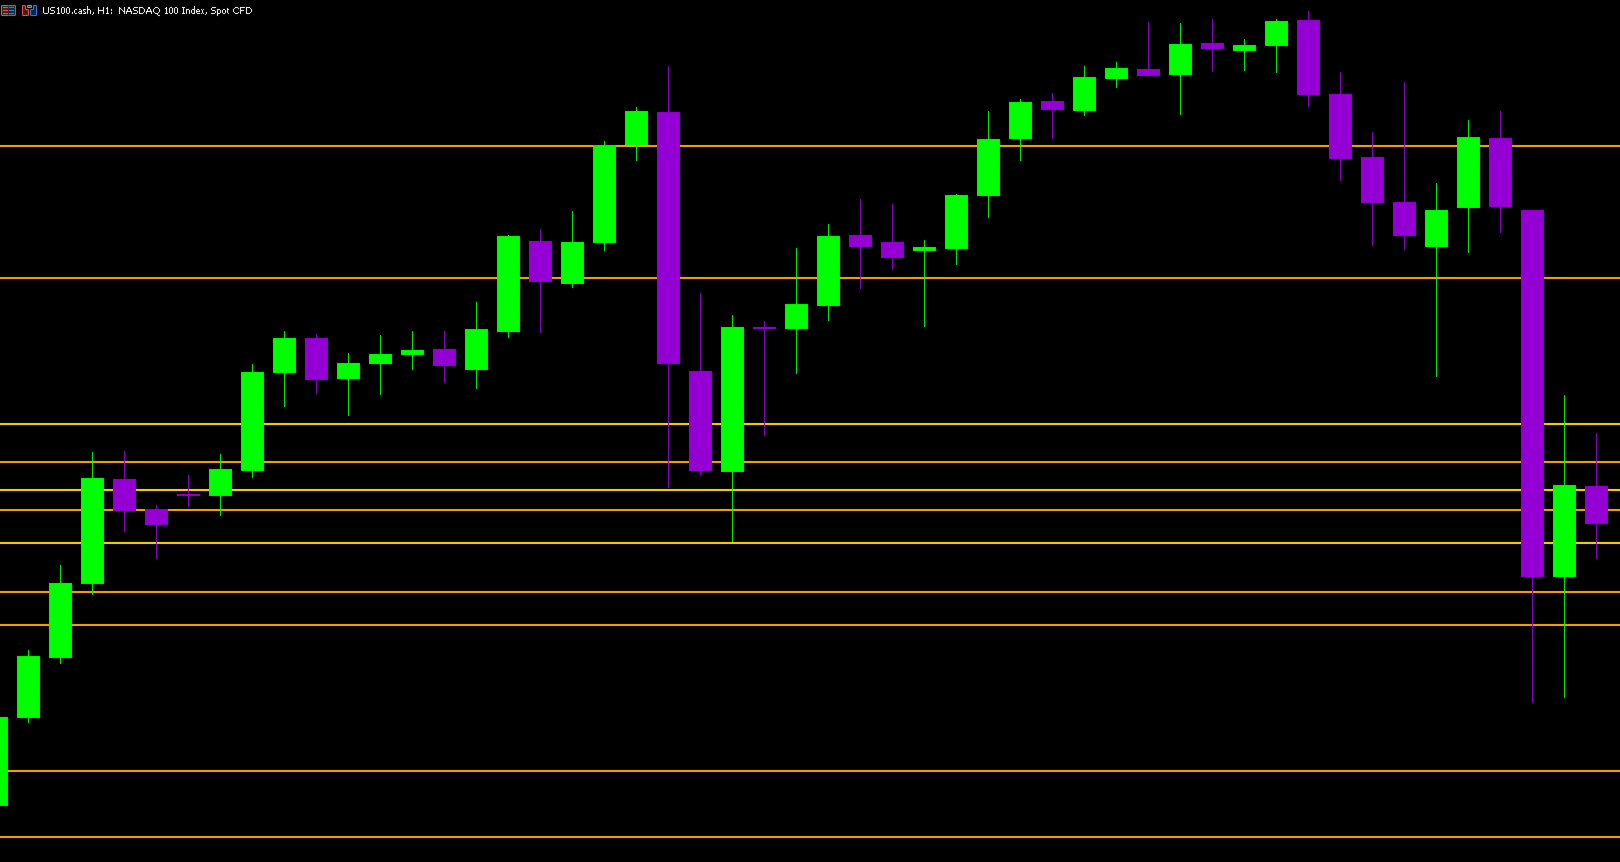
Dynamic Pivot Zones – Your Level Assistant on the Chart

This indicator is a bit like a GPS for your trading. It shows you where the price likes to hang out, where it gets nervous, and where it flies through. No more calculating pivots by hand or guessing support and resistance levels.

What it does:

  • Automatically plots H1, H4, and D1 pivots.

  • Shows support and resistance zones: R1, R2, S1, S2.

  • Lines are colored and easy to read, so you can instantly see what’s hot or cold.

Why you’ll love it:

  • Drop the indicator on your chart, and bam – it comes alive.

  • No more spending hours hunting for key levels.

  • You instantly see where the price might bounce or break.

It’s simple, effective, and gives you a serious helping hand for your trades.


Önerilen ürünler
Important Lines
Terence Gronowski
4.88 (24)
This indicator displays Pivot-Lines, preday high and low, preday close and the minimum and maximum of the previous hour. You just have to put this single indicator to the chart to have all these important lines, no need to setup many single indicators. Why certain lines are important Preday high and low : These are watched by traders who trade in a daily chart. Very often, if price climbs over or falls under a preday low/high there is an acceleration in buying/selling. It is a breakout out of a
FREE
Donchian Breakout And Rsi
Mattia Impicciatore
4.5 (2)
Genel Açıklama Bu gösterge, klasik Donchian Kanalı ’nın geliştirilmiş bir versiyonudur ve gerçek işlem için pratik işlevlerle zenginleştirilmiştir. Standart üç çizgiye (üst, alt ve orta çizgi) ek olarak sistem breakout (fiyat kırılımı) noktalarını tespit eder ve bunları grafikte oklarla görsel olarak gösterir. Ayrıca grafiği sadeleştirmek için mevcut trend yönünün tersindeki çizgi yalnızca görüntülenir. Gösterge şunları içerir: Görsel sinyaller : Kırılım sırasında renkli oklar Otomatik bildiriml
FREE
FlatBreakout MT5 (Free Version) Flat Range Detector and Breakout Panel for MT5 — GBPUSD Only FlatBreakout MT5   is the free version of the professional FlatBreakoutPro MT5 indicator, specially designed for flat (range) detection and breakout signals on the   GBPUSD   pair only. Perfect for traders who want to experience the unique fractal logic of FlatBreakout MT5 and test breakout signals on a live market without limitations. Who Is This Product For? For traders who prefer to trade breakout of
FREE
Pivot MT5
Dmitrij Isaenko
The indicator draws daily support and resistance lines on the chart, as well as the Pivot level (reversal level). Adapted to work in MT5 The standard timeframe for calculating support and resistance levels is D1. You can choose other timeframes according to your strategy (for example, for M1-M15, the optimal timeframe for calculations is H1) The function for calculating support and resistance levels has been updated; in this calculation option, fibonacci levels are taken into account, respec
FREE
Pivot Point Fibo RSJ, Fibonacci oranlarını kullanarak günün destek ve direnç çizgilerini izleyen bir göstergedir. Bu muhteşem gösterge, Fibonacci oranlarını kullanarak Pivot Point üzerinden 7 seviyeye kadar destek ve direnç oluşturur. Fiyatların, bir operasyonun olası giriş/çıkış noktalarını algılamanın mümkün olduğu bu destek ve direncin her bir düzeyine uyması harika. Özellikleri 7 seviyeye kadar destek ve 7 seviye direnç Seviyelerin renklerini ayrı ayrı ayarlayın Girişler Pivot Tipi Pivo
FREE
Free automatic Fibonacci is an indicator that automatically plots a Fibonacci retracement based on the number of bars you select on the BarsToScan setting in the indicator. The Fibonacci is automatically updated in real time as new highest and lowest values appears amongst the selected bars. You can select which level values to be displayed in the indicator settings. You can also select the color of the levels thus enabling the trader to be able to attach the indicator several times with differe
FREE
ZigZag WaveSize MT4'ün önceki sürümünün geliştirilmesi  ZigZag WaveSize MT4 ZigZag WaveSize -  noktalar cinsinden dalga uzunluğu bilgisi, seviyeler ve farklı uyarı mantığı eklenmiş değiştirilmiş standart ZigZag göstergesi Genel İyileştirmeler: MetaTrader 5 için kod uyarlaması Grafik nesneleriyle çalışmanın optimize edilmesi Yeni Özellikler: Ekstremumlarda yatay seviyeler Seviye tipi seçimi: yatay/ışınlar/bölümler Likid seviyeler filtresi (fiyat tarafından test edilmemiş) Kırılma için tampon: y
FREE
"Haven Key Levels PDH PDL"   göstergesi, yatırımcıların grafikteki kilit seviyeleri görselleştirmesine yardımcı olur. Aşağıdaki seviyeleri otomatik olarak işaretler: DO (Daily Open)   — Günlük Açılış seviyesi. NYM (New York Midnight)   — New York Gece Yarısı seviyesi. PDH (Previous Day High)   — Önceki Günün En Yüksek seviyesi. PDL (Previous Day Low)   — Önceki Günün En Düşük seviyesi. WO (Weekly Open)   — Haftalık Açılış seviyesi. MO (Monthly Open)   — Aylık Açılış seviyesi. PWH (Previous Week
FREE
Statistical Arbitrage Spread Generator for Cointegration [MT5] What is Pair Trading? Pair trading is a market-neutral strategy that looks to exploit the relative price movement between two correlated assets — instead of betting on the direction of the market. The idea? When two assets that usually move together diverge beyond a statistically significant threshold, one is likely mispriced. You sell the expensive one, buy the cheap one , and profit when they converge again. It’s a statistica
FREE
This indicator is stand alone version from  MP Pivot Levels  (All in one) containing Woodie Pivots. Woodie’s pivot points are made up of multiple key levels, calculated from past price points, in order to frame trades in a simplistic manner. The key levels include the ‘pivot’ itself, and multiple support and resistance levels (usually up to three each). Traders use these levels as a guide for future price movements when setting up trades. The pivot : (Previous high + previous low + 2 x previous
FREE
The utility draws pivot levels based on a selection from day week month The previous candlestick of the selected timeframe is taken and the values for the levels are calculated using the following formulas: Pivot = (high + close + low) / 3 R1 = ( 2 * Pivot) - low S1 = ( 2 * Pivot) - high R2 = Pivot + (R1 -S1) R3 = high + ( 2 * (Pivot - low)) S2 = Pivot - (R1 - S1) S3 = low - ( 2 * (high - Pivot)); The style and thickness for all lines are adjusted. The colors for the R, Pivot and S lines ar
FREE
PROMETHEUS TECHNICAN VERSION Free | By THE SONS A gift from The Sons — no strings, no trial, no expiry. Every trader deserves access to professional-grade market intelligence. That belief is why Prometheus Technical Version exists, and why it costs nothing. Consider it our handshake to the trading community. What You're Getting This is not a simplified tool dressed up as a gift. Prometheus Technican Version is a fully built, institutional-quality technical analysis indicator running a dual-model
FREE
Pivot Points are used by Forex traders to find support and resistance levels based on the previous day's price action. There are various ways to calculate pivot points, including averaging the open, high, low, and close of the previous day's chart price. Forex Traders use a combination of pivot points with moving averages to find trading opportunities in the currency markets. Pivot points are very useful tools that use the previous bars' highs, lows and closings to project support and resist
FREE
PZ Penta O MT5
PZ TRADING SLU
3.5 (4)
The Penta-O is a 6-point retracement harmonacci pattern which usually precedes big market movements. Penta-O patterns can expand and repaint quite a bit. To make things easier this indicator implements a twist: it waits for a donchian breakout in the right direction before signaling the trade. The end result is an otherwise repainting indicator with a very reliable trading signal. The donchian breakout period is entered as an input. [ Installation Guide | Update Guide | Troubleshooting | FAQ | A
FREE
Daily Support and Resistance Levels 는 클래식 피벗 포인트 방식으로 일중 거래 핵심 가격 레벨을 자동 계산/표시하는 전문 지표입니다. 주요 기능: 피벗 포인트(PP) 자동 계산 3개의 저항 레벨(R1, R2, R3) 3개의 지지 레벨(S1, S2, S3) 전일 고가/저가 표시 실시간 정보 패널 상승/하락 바이어스 표시 최근 레벨까지 거리 표시 색상/표시 완전 사용자 설정 매일 자동 업데이트 모든 타임프레임 지원 계산 방식: 전일 고가/저가/종가 기반 클래식 피벗 포인트. 트레이딩 활용: 지지/저항 반등 매매 돌파 전략 레인지 거래 방향성 판단 목표가 설정 사용 방법: 차트에 인디케이터 적용 레벨 자동 생성 가격 > PP = 상승 바이어스 가격 < PP = 하락 바이어스 S1-S3 = 지지 구간 R1-R3 = 저항 구간 설정 옵션: 피벗/지지/저항 색상 라인 굵기/스타일 가격 라벨 표시/숨기기 정보 패널 ON/OFF 패널 위치/폰트 크기 전일 고가/저가 표
FREE
DF Fib Trader Pro DF Fib Trader Pro, MetaTrader 5 için tasarlanmış otomatik bir işlem sistemidir. Giriş ve çıkış noktalarını tanımlamak için Fibonacci tabanlı fiyat seviyelerini trend ve yapı analiziyle birleştirir. EA hem uzun hem de kısa pozisyonları destekler ve yerleşik risk yönetimi parametreleri içerir. Temel Özellikler: • Giriş, SL ve TP noktalarını çizmek için Fibonacci geri çekilme ve uzatma mantığını kullanır. • Yapılandırılabilir lot büyüklüğü ve zarar durdurma/kâr alma seviyeleri •
FREE
The   Pivot Point indicator   automatically calculates and displays the pivot point line and support and resistance levels. Pivot can be calculated according to the Classic, Floor, Fibonacci, Woodie, Camarilla or DeMark formula. It is also possible to select the period for calculating the indicator. A trader can choose from daily, weekly, monthly, or user-defined periods. Types of pivots Classic Floor Fibonacci Woodie Camarilla DeMark Main features The indicator shows the current and historic
FREE
Bounce Zone MT5
Nguyen Thanh Cong
4.56 (9)
Introduction The Bounce Zone indicator is a cutting-edge non-repainting technical tool built to identify key areas on the price chart where market sentiment is likely to cause a significant price reversal. Using advanced algorithms and historical price data analysis, this indicator pinpoints potential bounce zones. Combined with other entry signal, this indicator can help forex traders place the best trades possible Signal A possible buy signal is generated when price is in the green zone an
FREE
LT Donchian Channel
Thiago Duarte
4.86 (7)
Donchian Channel is an indicator created by Richard Donchian. It is formed by taking the highest high and the lowest low of the last specified period in candles. The area between high and low is the channel for the chosen period. Its configuration is simple. It is possible to have the average between the upper and lower lines, plus you have alerts when price hits one side. If you have any questions or find any bugs, please contact me. Enjoy!
FREE
Follow The Line MT5
Oliver Gideon Amofa Appiah
4.6 (35)
This indicator obeys the popular maxim that: "THE TREND IS YOUR FRIEND" It paints a GREEN line for BUY and also paints a RED line for SELL. (you can change the colors). It gives alarms and alerts of all kinds. IT DOES NOT REPAINT and can be used for all currency pairs and timeframes. Yes, as easy and simple as that. Even a newbie can use it to make great and reliable trades. NB: For best results, get my other premium indicators for more powerful and reliable signals. Get them here: https://www.m
FREE
MACD Enhanced
Nikita Berdnikov
5 (3)
Introducing the MACD  Enhanced – an advanced MACD (Moving Average Convergence Divergence) indicator that provides traders with extended capabilities for trend and momentum analysis in financial markets. The indicator uses the difference between the fast and slow exponential moving averages to determine momentum, direction, and strength of the trend, creating clear visual signals for potential entry and exit points. Attention! To achieve the best results, it is recommended to adapt the indicator
FREE
This indicator is an automated version of the Fibonacci retracement (Fib) indicator. Deciding the best areas to use when drawing the fib can be tricky and this  indicator was made with that in mind. When you drop it on the chart it will automatically choose the best points to draw the fib with, but in case you aren't satisfied with those regions, you can adjust it as you wish.
FREE
Hunter’s Scope: Volatilite ve Trend Gücü Göstergesi (MT5) Hunter’s Scope; yönsel güç ve volatiliteyi filtreleyerek fiyat genişlemesini belirleyen, MetaTrader 5 için yüksek momentumlu bir göstergedir. Önemli dürtüsel (impulse) mumları tespit etmek için tasarlanmış olup, momentum tabanlı işlemler için net ve objektif sinyaller sağlar. Temel Mantık: Çift Katmanlı Filtre Gecikmeli kesişimler yerine Hunter’s Scope, iki yönlü bir doğrulama modeli kullanır: Trend Gücü (ADX): Sinyaller yalnızca ADX kull
Strifor Pivot ATR Target
Strifor (Mauritius) Ltd
5 (4)
Strifor Pivot ATR Target MetaTrader 5 için ATR hedefli Pivot göstergesi ve analiz paneli Strifor Pivot ATR Target , günlük ve orta vadeli işlemler için tasarlanmış bir araçtır. Klasik pivot seviyelerini dinamik ATR hedefleri ve gelişmiş analiz paneli ile birleştirir. Bu gösterge, işlem aralığını, olası fiyat tepki bölgelerini ve hareket potansiyelini önceden değerlendirmenize yardımcı olur ve manuel hesaplamaları ve subjektif varsayımları ortadan kaldırır. Ana Özellikler Pivot seviyelerinin oto
FREE
Are you tired of drawing trendlines every time you're analyzing charts? Or perhaps you would like more consistency in your technical analysis. Then this is for you. This indicator will draw trend lines automatically when dropped on a chart. How it works Works similar to standard deviation channel found on mt4 and mt5. It has 2 parameters: 1. Starting Bar 2. Number of bars for calculation The   starting bar   is the bar which drawing of the trend lines will begin, while the   number of bars for c
FREE
Easy Correlations Indicator The Easy Correlations Indicator is designed to help traders analyze the relationship between two correlated instruments. By monitoring the distance between their Relative Strength Index (RSI) values, the indicator highlights situations where one instrument has moved significantly further than the other. This creates potential trading opportunities: Sell the stronger instrument (overstretched RSI) Buy the weaker instrument (lagging RSI) Because the positions are opened
FREE
Girassol Sunflower MT5 Indicator
Saullo De Oliveira Pacheco
3.86 (7)
This is the famous Sunflower indicator for Metatrader5. This indicator marks possible tops and bottoms on price charts. The indicator identifies tops and bottoms in the asset's price history, keep in mind that the current sunflower of the last candle repaints, as it is not possible to identify a top until the market reverses and it is also not possible to identify a bottom without the market stop falling and start rising. If you are looking for a professional programmer for Metatrader5, please
FREE
High Low Open Close
Alexandre Borela
4.98 (44)
Bu projeyi seviyorsanız, 5 yıldız incelemesi bırakın. Bu gösterge açık, yüksek, düşük ve belirtilen fiyatlar için çizer Dönem ve belirli bir zaman bölgesi için ayarlanabilir. Bunlar birçok kurumsal ve profesyonel tarafından görünen önemli seviyelerdir. tüccarlar ve daha fazla olabileceği yerleri bilmeniz için yararlı olabilir Aktif. Mevcut dönemler şunlardır: Önceki gün. Önceki Hafta. Önceki Ay. Previous Quarter. Önceki yıl. Veya: Mevcut gün. Hafta. Şimdi Ay. Şimdiki Mahallesi. Bugün yıl.
FREE
PZ Pivot Points MT5
PZ TRADING SLU
4.91 (22)
This indicator displays pivot points in the chart, including historical vales, and supports many calculation modes for Pivot Points and S/R levels. [ Installation Guide | Update Guide | Troubleshooting | FAQ | All Products  |  Get Help ] It plots historical levels for backtesting purposes It allows you to select the reference timeframe It implements different Pivot Point calculation modes It implements different SR calculation modes It implements customizable colors and sizes Calculation Mod
FREE
Raymond Cloudy Day Indicator for MT5 – Pivot-Based Reversal and Trend Levels Raymond Cloudy Day Indicator is a pivot-based level indicator for MetaTrader 5 (MT5). It was developed by Ngo The Hung based on Raymond’s original idea and is designed to give a structured view of potential reversal zones, trend extensions and support/resistance levels directly on the chart. The default settings are optimised for XAUUSD on the H1 timeframe, but the indicator can be tested and adjusted for other symbols
FREE
Bu ürünün alıcıları ayrıca şunları da satın alıyor
ARIPoint
Temirlan Kdyrkhan
1 (1)
ARIPoint is a powerful trading companion designed to generate high-probability entry signals with dynamic TP/SL/DP levels based on volatility. Built-in performance tracking shows win/loss stats, PP1/PP2 hits, and success rates all updated live. Key Features: Buy/Sell signals with adaptive volatility bands Real-time TP/SL/DP levels based on ATR Built-in MA Filter with optional ATR/StdDev volatility Performance stats panel (Success, Profit/Loss, PP1/PP2) Alerts via popup, sound, push, or email Cu
SuperScalp Pro
Van Minh Nguyen
4.57 (21)
SuperScalp Pro – Gelişmiş Çoklu Filtre Scalping Gösterge Sistemi SuperScalp Pro, işlem fırsatlarını belirlemeye yardımcı olmak için klasik Supertrend ile birden fazla akıllı onay filtresini birleştiren gelişmiş bir scalping göstergesidir. M1’den H4’e kadar farklı zaman dilimlerinde verimli şekilde çalışır ve XAUUSD, BTCUSD ile majör Forex pariteleri için optimize edilmiştir. Gösterge, net Al ve Sat sinyalleri sunar ve ATR tabanlı otomatik giriş fiyatı, stop loss ve take profit seviyeleri hesapla
Divergence Bomber
Ihor Otkydach
4.9 (87)
Bu göstergeyi satın alan herkese aşağıdaki ekstra içerikler ücretsiz olarak sunulmaktadır: Her işlemi otomatik olarak yöneten, Stop Loss ve Take Profit seviyelerini ayarlayan ve işlemleri strateji kurallarına göre kapatan özel yardımcı araç: "Bomber Utility" Göstergenin farklı varlıklar üzerinde kullanılmasına yönelik ayar dosyaları (set dosyaları) Bomber Utility için 3 farklı modda kullanım sunan ayar dosyaları: "Minimum Risk", "Dengeli Risk" ve "Bekle-Gör Stratejisi" Bu ticaret stratejisini hı
Entry In The Zone and SMC Multi Timeframe is a real-time 2-in-1 market analysis tool that combines market structure analysis and a No Repaint BUY / SELL signal system into a single indicator, built on Smart Money Concepts (SMC) — a widely adopted framework used by professional traders to understand market structure. This indicator helps you see the market more clearly, make decisions based on structure rather than guesswork, and focus on high-probability zones where price is more likely to react
Grabber System MT5
Ihor Otkydach
4.83 (23)
Size mükemmel bir teknik gösterge olan Grabber’ı tanıtıyorum. Bu araç, kullanıma hazır bir “her şey dahil” işlem stratejisi olarak çalışır. Tek bir yazılım kodu içinde güçlü piyasa teknik analiz araçları, işlem sinyalleri (oklar), uyarı işlevleri ve push bildirimleri entegre edilmiştir. Bu göstergeyi satın alan herkes aşağıdaki hediyeleri ücretsiz olarak alır: Açık emirleri otomatik yönetmek için Grabber Yardımcı Aracı Kurulum, yapılandırma ve nasıl işlem yapılacağını adım adım anlatan video kıl
Power Candles V3 - İlk Kendi Kendini Optimize Eden Güç Göstergesi Power Candles V3 , güç analizini doğrudan işlem yapılabilir bir sisteme dönüştürür. Gösterge artık grafiğinizi yalnızca piyasa gücüne göre renklendirmekle kalmaz; arka planda canlı bir otomatik optimizasyon çalıştırır ve sembolünüz için en iyi Stop Loss, Take Profit ve sinyal eşiğini size sunar. Tek tıklama ile bu ayar canlı işlem için devreye girer. Bu araç Stein Investments ekosisteminin bir parçasıdır.  18 aracın tümünü keşfed
Gold Entry Sniper
Tahir Mehmood
5 (8)
Gold Entry Sniper – Altın Scalping & Swing Trading için Profesyonel Çoklu Zaman Çerçeveli ATR Paneli Gold Entry Sniper , XAUUSD ve diğer enstrümanlar için doğru al/sat sinyalleri veren, ATR Trailing Stop mantığı ve çoklu zaman çerçevesi analizi ile geliştirilmiş gelişmiş bir MetaTrader 5 göstergesidir. Temel Özellikler ve Avantajlar Çoklu Zaman Çerçevesi Analizi – M1, M5, M15 trendlerini tek panelde gösterir. ATR Tabanlı Trailing Stop – Volatiliteye göre dinamik olarak ayarlanır. Profesyonel Gra
Bu indikatörü satın alırsanız, Profesyonel Trade Manager’ımı  + EA ÜCRETSİZ olarak alacaksınız. Öncelikle, bu Ticaret Sistemi'nin Non-Repainting, Non-Redrawing ve Non-Lagging Göstergesi olduğunu vurgulamak önemlidir, bu da hem manuel hem de robot ticareti için ideal hale getirir. Online kurs, kılavuz ve ön ayarları indir. "Smart Trend Trading System MT5", yeni ve deneyimli tüccarlar için özelleştirilmiş kapsamlı bir ticaret çözümüdür. 10'dan fazla premium göstergeyi birleştiriyor ve 7'den fazla
SignalTech MT5 is a trading system for EURUSD, USDCHF, USDJPY, AUDUSD, NZDUSD, EURJPY, AUDJPY, NZDJPY, CADJPY H2 and H3 Timeframe.  It can generate signals with Buy/Sell Arrows and Pop-Up/Sound Alerts. Each signal has clear Entry and Stop Loss levels, which should be automatically flagged on the chart, as well as potential Targets 1, 2, and 3. The Entry and TP levels are fixed after the trade is taken. The exit level is dynamic. If there are signs of a potential short-term trend reversal, the
Quantum TrendPulse
Bogdan Ion Puscasu
5 (23)
SuperTrend   ,   RSI   ve   Stochastic'in   gücünü tek bir kapsamlı göstergede birleştirerek işlem potansiyelinizi en üst düzeye çıkaran nihai işlem aracı olan   Quantum TrendPulse'u   tanıtıyoruz. Hassasiyet ve verimlilik arayan yatırımcılar için tasarlanan bu gösterge, piyasa trendlerini, momentum değişimlerini ve en uygun giriş ve çıkış noktalarını güvenle belirlemenize yardımcı olur. Temel Özellikler: SuperTrend Entegrasyonu:   Güncel piyasa trendlerini kolayca takip edin ve karlılık dalgası
Gann Made Easy , bay teorisini kullanarak ticaretin en iyi ilkelerine dayanan, profesyonel ve kullanımı kolay bir Forex ticaret sistemidir. WD Gann. Gösterge, Zararı Durdur ve Kâr Al Seviyeleri dahil olmak üzere doğru SATIN AL ve SAT sinyalleri sağlar. PUSH bildirimlerini kullanarak hareket halindeyken bile işlem yapabilirsiniz. Satın alma işleminden sonra, alım satım talimatlarını ve harika ek göstergeleri ücretsiz olarak almak için lütfen benimle iletişime geçin! Muhtemelen Gann ticaret yöntem
Trend Screener Pro MT5
STE S.S.COMPANY
4.85 (104)
Trend Göstergesi, Trend Alım Satım ve Filtreleme için Çığır Açan Benzersiz Çözüm, Tüm Önemli Trend Özellikleriyle Tek Bir Araç İçinde Yerleştirildi! Forex, emtialar, kripto para birimleri, endeksler ve hisse senetleri gibi tüm sembollerde/araçlarda kullanılabilen %100 yeniden boyamayan çoklu zaman çerçevesi ve Çoklu para birimi göstergesidir. Trend Screener, grafikte noktalarla ok trend sinyalleri sağlayan etkili bir trend trend göstergesidir. Trend analizörü göstergesinde bulunan özellikler: 1.
Tanıtım       Quantum Breakout PRO   , Breakout Bölgeleri ile ticaret yapma şeklinizi değiştiren çığır açan MQL5 Göstergesi! 13 yılı aşkın ticaret tecrübesine sahip deneyimli tüccarlardan oluşan bir ekip tarafından geliştirilmiştir.       Kuantum Breakout PRO       yenilikçi ve dinamik koparma bölgesi stratejisiyle ticaret yolculuğunuzu yeni zirvelere taşımak için tasarlanmıştır. Kuantum Breakout Göstergesi, size 5 kar hedefi bölgesi ile kırılma bölgelerinde sinyal okları ve kırılma kutusuna da
Top indicator for MT5   providing accurate signals to enter a trade without repainting! It can be applied to any financial assets:   forex, cryptocurrencies, metals, stocks, indices .  Watch  the video  (6:22) with an example of processing only one signal that paid off the indicator! MT4 version is here It will provide pretty accurate trading signals and tell you when it's best to open a trade and close it. Most traders improve their trading results during the first trading week with the help of
Azimuth Pro
Ottaviano De Cicco
5 (7)
Azimuth Pro V2: Synthetic Fractal Structure and Confirmed Entries for MT5 Overview Azimuth Pro is a multi-level swing structure indicator by Merkava Labs . Four nested swing layers, swing-anchored VWAP, ABC pattern detection, three-timeframe structural filtering, and closed-bar confirmed entries — one chart, one workflow from micro-swings to macro-cycles. This is not a blind signal product. It is a structure-first workflow for traders who care about location, context, and timing. V2 Launch Offe
Meravith MT5
Ivan Stefanov
5 (1)
Göstergе, herhangi bir noktadan hacmi analiz eder ve bu hacim için piyasanın tükeniş seviyelerini hesaplar. Meravith’in ana çizgileri: Boğa hacim tükeniş çizgisi – hedef olarak kullanılır. Ayı hacim tükeniş çizgisi – hedef olarak kullanılır. Trend çizgisi – piyasa trendini gösterir. Piyasanın boğa mı ayı mı olduğuna bağlı olarak rengi değişir ve trend desteği görevi görür. Nasıl kullanılır: Mor dikey çizgiye çift tıklayın ve istediğiniz konuma taşıyın. Her şeyi analiz edebilirsiniz – trendleri v
Btmm state engine pro
Garry James Goodchild
5 (4)
BTMM State Engine Pro is a MetaTrader 5 indicator for traders who use the Beat The Market Maker approach: Asian session context, kill zone timing, level progression, peak formation detection, and a multi-pair scanner from a single chart. It combines cycle state logic with a built-in scanner dashboard so you do not need the same tool on many charts at once. What it does Draws the Asian session range; session times can follow broker server offset or be set in inputs. Tracks level progression (L
FX Trend MT5 NG
Daniel Stein
5 (4)
FX Trend NG: Yeni Nesil Çoklu Piyasa Trend Zekâsı Genel Bakış FX Trend NG , çoklu zaman dilimlerinde çalışan profesyonel bir trend analiz ve piyasa izleme aracıdır. Piyasanın yapısını saniyeler içinde anlamanızı sağlar. Birden fazla grafik arasında geçiş yapmak yerine, hangi enstrümanların trendde olduğunu, momentumun nerede zayıfladığını ve hangi zaman dilimlerinin uyumlu olduğunu anında görebilirsiniz. Lansman Teklifi – FX Trend NG sadece $30 (6 Ay) veya $80 Ömür Boyu Lisans ile edinin. Zate
Atomic Analyst MT5
Issam Kassas
3.94 (31)
Öncelikle belirtmek gerekir ki bu Ticaret Göstergesi Yeniden Çizim Yapmaz, Gecikmez ve Gecikme Göstermez, bu da hem manuel hem de robot ticareti için ideal hale getirir. Kullanıcı kılavuzu: ayarlar, girişler ve strateji. Atom Analisti, Piyasada Daha İyi Bir Avantaj Bulmak İçin Fiyatın Gücünü ve Momentumunu Kullanan PA Fiyat Hareketi Göstergesidir. Gürültüleri ve Yanlış Sinyalleri Kaldırmaya ve Ticaret Potansiyelini Artırmaya Yardımcı Olan Gelişmiş Filtrelerle Donatılmıştır. Birden fazla katmanl
OmniSync Projection
Antonio-alin Teculescu
5 (1)
Chronos Fractal Engine is an innovative price projection indicator for MetaTrader 5, designed to transform your technical analysis by intelligently identifying and projecting historical price patterns. Built upon an advanced correlation algorithm and the fractal principles of the market, this powerful tool visualizes potential future price movements, giving you a unique edge in your trading decisions. What is Chronos Fractal Engine? At its core, the Chronos Fractal Engine employs a sophisticat
Önce dürüst olalım. Hiçbir gösterge tek başına sizi kârlı yapmaz. Eğer biri size aksini söylüyorsa, size bir hayal satıyordur. Mükemmel al/sat okları gösteren her gösterge, kusursuzmuş gibi görünecek şekilde yapılabilir — sadece geçmişin doğru bir bölümünü yakınlaştırıp kazanan işlemleri ekran görüntüsü almanız yeterlidir. Biz bunu yapmıyoruz.  SMC Intraday Formula bir araçtır. Piyasa yapısını sizin için okur, en yüksek olasılıklı fiyat bölgelerini belirler ve şu anda akıllı paranın izinin nası
RelicusRoad Pro: Kantitatif Piyasa İşletim Sistemi ÖMÜR BOYU ERİŞİMDE %70 İNDİRİM (SINIRLI SÜRE) - 2.000+ TRADER'A KATILIN Neden çoğu trader "mükemmel" indikatörlere rağmen başarısız olur? Çünkü tekil kavramları boşlukta trade ederler. Bağlamı olmayan bir sinyal kumardır. Sürekli kazanmak için KONFLÜANS (UYUM) gerekir. RelicusRoad Pro basit bir ok indikatörü değildir. Tam bir Kantitatif Piyasa Ekosistemi dir. Tescilli volatilite modellemesini kullanarak fiyatın ilerlediği "Adil Değer Yolu"nu har
Crystal Heikin Ashi Signals
Muhammad Jawad Shabir
5 (2)
Crystal Heikin Ashi Signals - Professional Trend & Signal Detection Indicator Advanced Heikin Ashi Visualization with Intelligent Signal System for Manual & Automated Trading Final Price: $149 ---------> Price goes up $10 after every 10 sales . Limited slots available — act fast . Overview Crystal Heikin Ashi Signals is a professional-grade MetaTrader 5 indicator that combines pure Heikin Ashi candle visualization with an advanced momentum-shift detection system. Designed for both manual traders
Trend indicator AI mt5
Ramil Minniakhmetov
5 (17)
Trend Ai göstergesi, trend tanımlamasını işlem yapılabilir giriş noktaları ve geri dönüş uyarılarıyla birleştirerek bir yatırımcının piyasa analizini geliştirecek harika bir araçtır. Bu gösterge, kullanıcıların forex piyasasının karmaşıklıklarında güvenle ve hassasiyetle yol almalarını sağlar. Birincil sinyallerin ötesinde, Trend Ai göstergesi geri çekilmeler veya düzeltmeler sırasında ortaya çıkan ikincil giriş noktalarını belirleyerek, yatırımcıların belirlenen trend içindeki fiyat düzeltmele
Market Structure Order Block Dashboard MT5, piyasa yapısını ve ana fiyat reaksiyon bölgelerini doğrudan grafikte okumak isteyen traderlar için tasarlanmış bir MT5 göstergesidir. BOS, ChoCH, Order Blocks, Fair Value Gaps (FVG), Likidite, Kill Zones, Volume Profile ve hızlı analiz için kompakt bir paneli bir araya getirir. Bu gösterge, piyasa yapısını, ICT ve Smart Money kavramlarını karar çerçevesi olarak kullanan traderlara yöneliktir. Trend devamlarını, olası tersine dönüşleri, fiyat dengesizli
FX Levels MT5
Daniel Stein
5 (13)
FX Levels: Tüm Piyasalar İçin Son Derece Hassas Destek ve Direnç Hızlı Bakış Döviz kurları, endeksler, hisseler veya emtialar gibi herhangi bir piyasada güvenilir destek ve direnç seviyeleri belirlemek mi istiyorsunuz? FX Levels geleneksel “Lighthouse” yöntemini ileri düzey bir dinamik yaklaşımla birleştirerek neredeyse evrensel bir doğruluk sağlar. Gerçek broker deneyimimize ve otomatik günlük güncellemeler ile gerçek zamanlı güncellemelerin birleşimine dayalı olarak, FX Levels size dönüş nok
Bill Williams Advanced
Siarhei Vashchylka
5 (11)
Bill Williams Advanced is designed for automatic chart analysis using Bill Williams' "Profitunity" system. The indicator analyzes four timeframes at once. Manual (Be sure to read before purchasing) Advantages 1. Analyzes the chart using Bill Williams' "Profitunity" system. Signals are displayed in a table in the corner of the screen and on the price chart. 2. Finds all known AO and AC signals, as well as zone signals. Equipped with a trend filter based on the Alligator. 3. Finds "Divergence Bar
Bu gösterge paneli, seçilen semboller için mevcut en son   harmonik kalıpları   gösterir, böylece zamandan tasarruf edersiniz ve daha verimli olursunuz /   MT4 sürümü . Ücretsiz Gösterge:   Basic Harmonic Pattern Gösterge sütunları Symbol :   seçilen semboller görünecektir Trend:   yükseliş veya düşüş Pattern :   desen türü (gartley, kelebek, yarasa, yengeç, köpekbalığı, cypher veya ABCD) Entry :   giriş fiyatı SL:   zararı durdur fiyatı TP1:   1. kar alma fiyatı TP2:   2. kar alma fiyatı TP
ARICoins
Temirlan Kdyrkhan
ARICoin is a powerful trading companion designed to generate high-probability entry signals with dynamic TP/SL/DP levels based on volatility. Built-in performance tracking shows win/loss stats, PP1/PP2 hits, and success rates all updated live. Key Features: Buy/Sell signals with adaptive volatility bands Real-time TP/SL/DP levels based on ATR Built-in MA Filter with optional ATR/StdDev volatility Performance stats panel (Success, Profit/Loss, PP1/PP2) Alerts via popup, sound, push, or email Cust
IX Power MT5
Daniel Stein
4.92 (13)
IX Power: Endeksler, Emtialar, Kripto Paralar ve Forex Piyasaları için İçgörüler Genel Bakış IX Power , endeksler, emtialar, kripto paralar ve forex sembollerinin gücünü analiz etmek için tasarlanmış çok yönlü bir araçtır. FX Power , tüm kullanılabilir döviz çiftlerinin verilerini kullanarak döviz çiftleri için maksimum doğruluk sağlarken, IX Power yalnızca temel sembolün piyasa verilerine odaklanır. Bu, IX Power 'ı forex dışındaki piyasalar için ideal ve daha basit forex analizleri için güven
Yazarın diğer ürünleri
Volume Profile Density V2.40 Fiyat seviyelerine göre işlem hacmini gösterir ve kurumsal ilgiyi çeken bölgeleri ortaya çıkarır. Klasik hacim göstergelerinden farklı olarak, hacmin gerçekte nerede yoğunlaştığını gösterir. Temel ilkeler: Yatay çubuklar = her fiyat seviyesindeki işlem hacmi Daha uzun çubuk → daha yüksek hacim Kırmızı bölgeler = güçlü destek / direnç alanları Ana kullanımlar: Gerçek destek ve direnç bölgelerini belirleme POC (Point of Control) tespiti Değer Alanı (toplam hacmin %70’i
FREE
Iceblock Volume
Vincent Jose Proenca
5 (1)
Kısa ifade: Iceblock — fiyat hareketinin az olduğu fakat işlem hacminin yüksek olduğu kümeleri tespit eden MT4 göstergesi (buzdağı benzeri davranış). TF: Tüm zaman dilimlerinde çalışır (M1–D1). Parite: Forex, endeksler, altın ve CFD’lerle uyumlu. Ayarlar: VolumeLookback – ortalama hacim hesabı için mum sayısı VolumeThreshold – anormal yüksek hacmi belirleyen çarpan ClusterSize – küme doğrulaması için bitişik mum sayısı RangeComparisonPeriod – mum aralıklarının (high–low) ortalaması için dönem
FREE
CustomBreakout
Vincent Jose Proenca
Range Breakout EA – Simple Description Concept An automated trading robot for MetaTrader 5 that exploits range breakouts with two key periods: Features Automatic market hours management Customizable Stop Loss and Take Profit Smart Trailing Stop Built-in testing mode for simulation Detailed logs for monitoring How It Works Records extreme prices at the start of the day Waits for a breakout of the secondary range Opens a position in the breakout direction Automatically manages the trade (SL/TP/Tr
FREE
VWAP_PC_MQL5 — MT5 üzerinde hacim ağırlıklı ortalama fiyatı (VWAP) gösteren basit, el yapımı bir gösterge. TF: Tüm zaman dilimlerinde çalışır. Parite: Forex, endeks, emtia ve hisse senetleriyle uyumlu. Ayarlar: AppliedPrice – hesaplama için kullanılan fiyat türü LineColor / Width / Style – çizgi görünümü SessionReset – günlük sıfırlama veya sürekli mod Çalışma prensibi (VWAP): VWAP (Volume Weighted Average Price) = (Fiyat × Hacim toplamı) / (Hacim toplamı) Fiyat VWAP’ın üzerindeyse alıcılar b
FREE
Pivot PDHL Levels
Vincent Jose Proenca
AutoPivot – Otomatik Pivot Noktaları Göstergesi MT4 göstergesi, pivot noktalarını (PP, R1/R2/R3, S1/S2/S3) ve önceki günün seviyelerini (PDH/PDL) gösterir. Ana özellikler: Grafiğin zaman dilimine (H4/D1/W1) göre otomatik uyum PDH/PDL ile en yakın destek/direnç seviyesi arasındaki bölgeler 8 önceden ayarlanmış renk teması Renkler, çizgi stilleri ve bölge saydamlığı tamamen özelleştirilebilir Fiyat gösterimi isteğe bağlı kompakt etiketler Yapılandırılabilir otomatik güncellemeler Seviyeler, standa
PDHL – simply displays the highs and lows of previous days directly on your chart, providing a quick and visual reference of past key levels. The indicator is lightweight and easily customizable , allowing you to adjust the number of days displayed, the colors, as well as the style and thickness of the lines to suit your preferences. It is designed to be simple and practical, but may not work on all instruments or platforms . Only teste Tested only with CFDs
FREE
Volume-to-Price Movement Oscillator (VP Oscillator) for MT5 The VP Oscillator highlights the balance (or imbalance) between trading volume and price movement, helping traders spot hidden accumulation, distribution, or weakening trends. How It Works: Calculates each bar’s price range (High–Low) and tick volume. Normalizes both values over a set period (default: 14). Plots the absolute difference between them ×100 — showing how closely price action aligns with trading activity. Interpretation: Hig
FREE
VMS Oscillator
Vincent Jose Proenca
Volume & Move Strength (VMS) Indicator for MT5 The VMS Indicator displays the relationship between trading volume and price movement strength, helping traders assess how well market activity supports price action. How It Works: Measures tick volume as trading activity. Calculates move strength using a normalized True Range (%). Both values can be smoothed (default: 5) and optionally normalized (0–100) for consistency across markets. Plots two lines in a separate window: Blue (Volume) – trading a
FREE
VolumeSR MT4
Vincent Jose Proenca
his indicator automatically identifies key support and resistance levels by analyzing volume patterns. Unlike traditional S/R tools that rely only on price, Volume S/R finds levels where the market truly reacted.   DETECTION LOGIC: - High Volume Zones: Price levels where strong buying/selling occurred - Low Volume Zones: Areas of weak interest - potential breakout or reversal zones   SMART FILTERING: - Nearby levels are automatically merged to avoid chart clutter - Maximum levels limit keeps yo
FREE
Custom Box CFDs
Vincent Jose Proenca
Range Box Indicator for Trading Sessions This indicator allows traders to visualize and analyze specific time ranges directly on their chart by drawing rectangular boxes for each trading session. Key Features: Customizable session interval: set your own session start and end times. Number of days displayed: choose how many past sessions are visible. Default color and special color for Monday: easily highlight weekly patterns. Adjustable border width: customize the appearance of the rectangles to
FREE
This indicator allows you to number bars within a trading session for CFDs. It works on GER40, UK100, US30, US100, and US500 and is fully customizable to fit your trading style and chart preferences. Key Features & Parameters: Customizable session interval: define your own session start and end times Option to hide even numbers for a cleaner chart Adjust number distance to position the bar numbers as you prefer Font size and color: choose the size and color that suit your chart Number of days di
FREE
STRUCTURAL TREND LINES - MT4/MT5 Indicator Simple indicator that automatically draws trend lines based on market structure. Features: - 3 degrees of structure detection (short, medium, long term) - Configurable swing strength for each degree - Single color per degree for clean visualization - Adjustable number of lines per degree - Customizable colors and line widths How it works: The indicator identifies swing highs and lows based on the strength parameter, then connects these points to crea
FREE
indicator that numbers the bars (candles) in a custom trading session. The indicator allows: Defining the session start time (StartHour and StartMinute) Displaying numbers only on odd bars (if AfficherUniquementImpairs is true) Displaying numbers on the last N days (NbJours) Customizing the color and font size of the text The indicator will loop through the bars of the last N days and, for each day, start counting from the session start time. It will display the bar number (starting at 1) belo
FREE
Adaptive Flow MAs
Vincent Jose Proenca
Adaptive Flow MAs is a moving average indicator designed to naturally adjust to market movements. Unlike traditional averages, it dynamically adapts its periods based on recent volatility and the current trend. The EMA closely follows rapid price swings to capture every impulse, while the SMA remains smoother, providing a stable and reliable reference. With a clean display showing the current adaptive periods, this tool helps traders feel the “flow” of the market without visual clutter. It’s cr
FREE
STRUCTURAL TREND LINES - MT4 Indicator Simple indicator that automatically draws trend lines based on market structure. Features: - 3 degrees of structure detection (short, medium, long term) - Configurable swing strength for each degree - Single color per degree for clean visualization - Adjustable number of lines per degree - Customizable colors and line widths How it works: The indicator identifies swing highs and lows based on the strength parameter, then connects these points to create t
FREE
The Candle Activity Visualizer turns your chart into a dynamic heatmap, giving you a clear view of buying and selling pressure. In-Depth Market Insight: Active Zone Detection: The algorithm highlights areas where high volume builds up within a narrow price range, revealing key pressure zones. Real-Time Intensity: Colors adjust in real time, shifting smoothly from cool tones to warmer shades as activity increases. Visual Customization: 5 Color Palettes: Choose from five professionally designed th
Rainbow Price Visualizer v1.21 See where the market really breathes. Turns your MT4 chart into an ultra-precise heatmap that highlights price zones favored by big players. Why it matters 300 price levels at 0.2‑pip resolution — microscopic detail. 8 visual themes (Rainbow, Fire, Ocean…) for instant readibility. Smart opacity: low noise fades, real zones pop. Lightweight rendering with automatic cleanup. Fully customizable: saturation, opacity, resolution, history depth. Bands project into the f
Baloncuk Göstergesi — Fiyat Yavaşlaması + Hacim Sıçraması Fiyat aniden yavaşladığında ve aynı anda hacim yükseldiğinde grafikte renkli kareler gösteren basit bir görsel araç. (Doldurma fonksiyonu ve konsantrik baloncuk efekti içerir) Piyasanın hareket etmeye hazırlanacağı önemli anları tespit etmeye yardımcı olur. Göstergenin yaptığı şeyler: Piyasanın hareket etmeden önce “tereddüt ettiği” anları tespit eder Büyük hacim girişlerinin fiyatı çok fazla hareket ettirmediği noktaları gösterir Olası k
Institutional Flow Indicator A smart volume-based tool that detects institutional activity zones through direct order flow patterns. It reveals where large institutions operate. An advanced volume indicator that filters out noise to identify probable institutional patterns. Key Features Smart cluster detection Automatic identification Signal classification: Violet / Yellow – Institutional Zone – Strong, sustained institutional activity Red / Green – Strong Signal – Significant buying/selling pre
AMD Adaptive MA MT4
Vincent Jose Proenca
5 (1)
AMD Uyarlanabilir Hareketli Ortalama (AAMA) AAMA, MetaTrader 4 için geliştirilmiş, piyasa koşullarına göre tepkisini otomatik olarak ayarlayan bir uyarlanabilir hareketli ortalama göstergesidir. Temel Özellikler: Kaufman Verimlilik Oranı’na dayalı uyarlanabilir hareketli ortalama – güçlü trendlerde hızlı tepki verir, yatay piyasalarda gürültüyü filtreler 4 AMD piyasa aşamasının otomatik tespiti: Birikim (Accumulation), Yükseliş (Markup), Dağıtım (Distribution), Düşüş (Markdown) ATR aracılığıyla
STRUCTURAL TREND LINES - MT4 Indicator Simple indicator that automatically draws trend lines based on market structure. Features: - 3 degrees of structure detection (short, medium, long term) - Configurable swing strength for each degree - Single color per degree for clean visualization - Adjustable number of lines per degree - Customizable colors and line widths How it works: The indicator identifies swing highs and lows based on the strength parameter, then connects these points to create t
Volume Profil MT4
Vincent Jose Proenca
Volume Profile Rectangle – Ürün Açıklaması Özet Seçilen bir alan içindeki her fiyat seviyesindeki işlem hacminin yatay analizini gösteren interaktif bir hacim profili göstergesidir . Otomatik olarak taşınabilir bir dikdörtgen oluşturur ve yükseliş (bullish) ve düşüş (bearish) hacim dağılımını renkli çubuklarla gösterir. Neler yapar: Yatay hacmi gösterir : Her fiyat seviyesindeki hacim dağılımını yatay çubuklar şeklinde görselleştirir Yükseliş/Düşüş analizi : Çubukları yeşil (yükseliş hacmi baskı
Proxy OrderFlow MT4
Vincent Jose Proenca
5 (1)
Tick-spread dengesizliğine dayalı gösterge. TF: Tüm zaman dilimlerinde çalışır (M1’den D1’e). Parite: Forex, endeksler, altın ve CFD’lerle uyumludur (JPY, Altın ve CFD enstrümanları için otomatik ayar). Ayarlar: TickWindow (200) – tik gözlem penceresi SpreadWeight (1.5) – spread ağırlığı NormalizationPeriod (20) – normalizasyon periyodu (z-score) Overbought / Oversold (±3.0) – uyarı eşikleri AlertCooldown (300s) – uyarılar arasındaki bekleme süresi Sonuç: Proxy Order Flow – Imbalance Tick-Spr
Nexus Signal System
Vincent Jose Proenca
TEKNİK AÇIKLAMA Nexus Signal System, MT4 için 12 teknik kriteri birleştirerek ticaret sinyalleri üreten bir göstergedir. Sistem, bir sinyali doğrulamadan önce birden fazla faktörün (trend, momentum, hacim, destek/direnç bölgeleri) birleşimini analiz eder; bu sayede yalnızca tek bir kriter kullanan göstergelere kıyasla yanlış sinyallerin sayısı azalır. ANALİZ KRİTERLERİ (0–15 Puan): Formasyon tespiti (pin bar, engulfing) Çoklu Zaman Çerçevesi Analizi (üst zaman diliminde trend doğrulama) ADX Piya
VR Signal
Vincent Jose Proenca
VolumeRejectionSignals v5.0 Gelişmiş Hacim Analiz Göstergesi Genel Açıklama VolumeRejectionSignals v5.0, hacim retlerini derinlemesine analiz ederek önemli fiyat hareketlerini doğru bir şekilde tespit etmek için tasarlanmış gelişmiş bir teknik göstergedir. Emir akışı dinamikleri ve piyasa yapısını birleştirerek, alım veya satım baskısının azaldığı bölgeleri tespit eder ve trend dönüşlerini veya hızlanmalarını önceden tahmin etmeyi sağlar. Akıllı Puanlama Sistemi Göstergeler, her sinyalin kalit
Liquidity Compression MT4
Vincent Jose Proenca
5 (1)
Kurumsal Likidite Sıkışma Göstergesi Bu gösterge, Bollinger Bantlarının normalize edilmiş genişliğini, hacmi ve ortalama spread’i kullanarak likidite daralmasını gerçek zamanlı olarak ölçer ve fiyat kırılmalarından önceki sıkışma evrelerini tespit eder. Görünüm: Profesyonel tarzda ayrı bir pencerede “Compression Score” histogramı ve “Threshold” referans çizgisi. Temel Özellikler Erken tespit: Fiyat hareketlerinden önce daralma bölgelerini belirler. Çok faktörlü ölçüm: Normalize edilmiş Bollinge
Mean Reversion Probability – İstatistiksel Dönüş Göstergesi Kısa açıklama Piyasa yorgunluk bölgelerini nicel hassasiyetle tanımlayan, 200 hareketli ortalamaya geri dönüş olasılığını tarihsel aşırılıklar analizine dayanarak hesaplayan kurumsal bir göstergedir. Temel Özellikler Gelişmiş istatistiksel analiz – Gerçek olasılıkları hesaplamak için 500+ tarihsel aşırılık veritabanı oluşturur Olasılık skoru 0–99% – Ortalama dönüş olasılığını kesin olarak ölçer Yorgunluk tespiti – Aşırılığın süresini
WBP Chart Signals
Vincent Jose Proenca
WBP Chart Signals – Çok zaman dilimli alım/satım baskı göstergesi Açıklama: WBP Chart Signals, hacim, spread ve fiyat hareketini analiz ederek piyasa baskısını ölçen gelişmiş bir göstergedir. Çok zaman dilimli onay ve kurumsal analiz tarzı ile hassas sinyaller arayan yatırımcılar için idealdir. Ana Özellikler: Weighted Buy Pressure (WBP): VWAP, MA200, hacim gücü, likidite ve momentumu birleştiren özel algoritma Çok zaman dilimli analiz: Üst zaman diliminde otomatik onay Gerçek zamanlı çok sembo
ARB , yüksek olasılıklı kırılma (breakout) fırsatlarını belirlemek için tasarlanmış bir göstergedir. Adaptif ATR kanal sistemi ve hassas çok faktörlü puanlama modeli (0–100) sayesinde çalışır. Volatilite, hacim, momentum ve çoklu zaman dilimi trendini birleştirerek, filtrelenmiş, görsel ve gerçek zamanlı olarak kullanılabilir sinyaller sunar. ÇALIŞMA PRENSİPLERİ Gösterge, Adaptive Range Breakout (ARB) kavramına dayanır — bu modern kırılma ticareti yaklaşımı, piyasa volatilitesine (ATR) ve fiyatı
Filtrele:
Değerlendirme yok
Değerlendirmeye yanıt