VolumeSR MT4

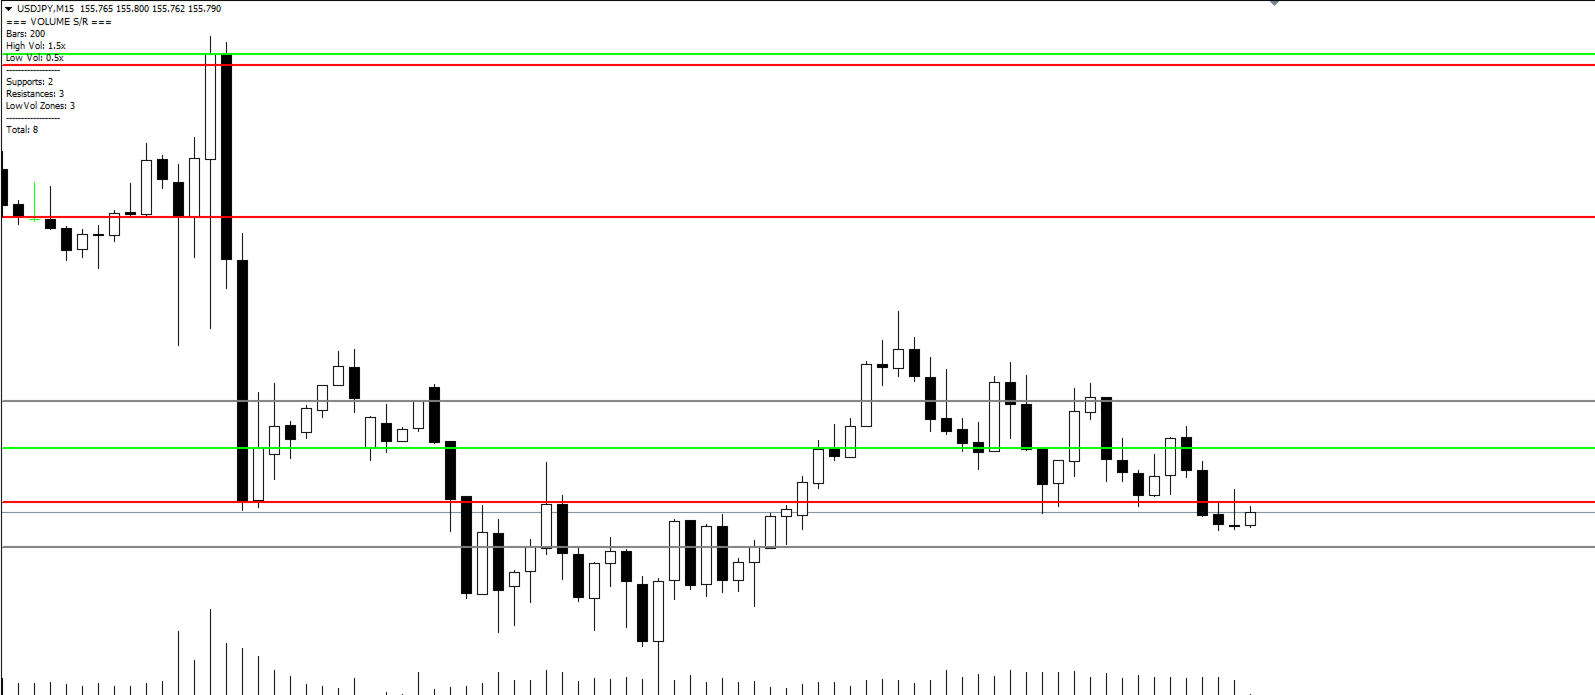
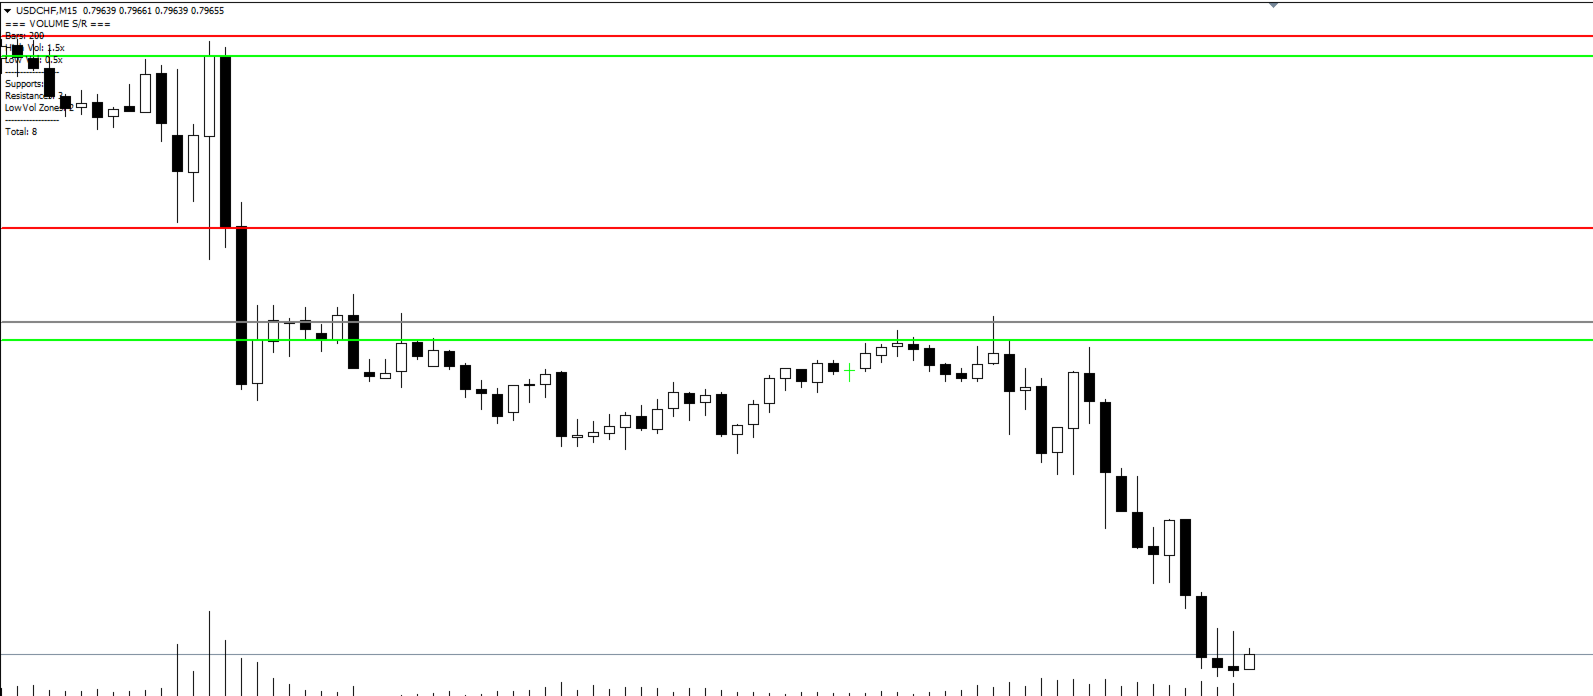
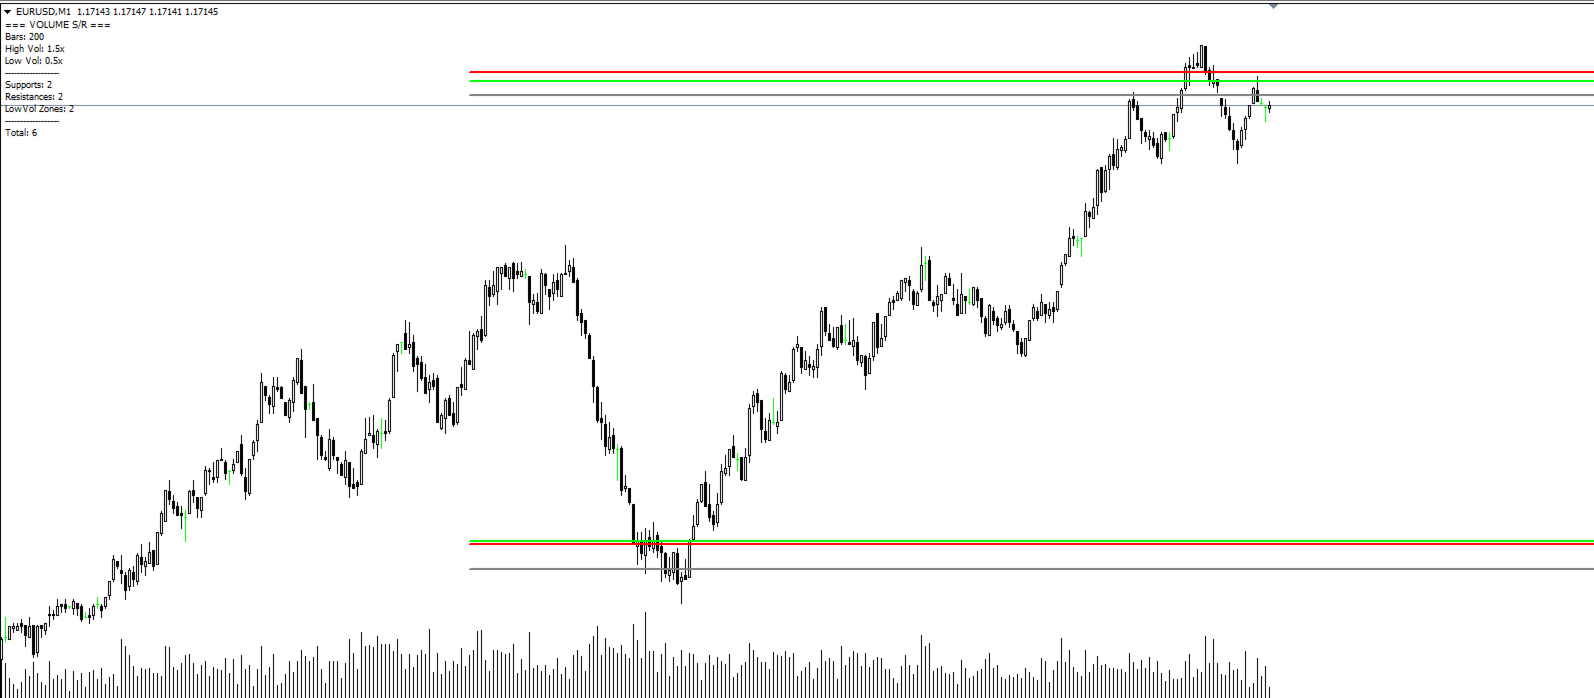
his indicator automatically identifies key support and resistance levels by analyzing volume patterns. Unlike traditional S/R tools that rely only on price, Volume S/R finds levels where the market truly reacted.
 
DETECTION LOGIC:
- High Volume Zones: Price levels where strong buying/selling occurred
- Low Volume Zones: Areas of weak interest - potential breakout or reversal zones
 
SMART FILTERING:
- Nearby levels are automatically merged to avoid chart clutter
- Maximum levels limit keeps your chart clean
- Distance filter prevents overlapping lines
 
COLOR CODING:
- GREEN: Support levels (high volume bullish reaction)
- RED: Resistance levels (high volume bearish reaction)
- GRAY: Low volume zones (potential breakout areas)
 
FULLY CUSTOMIZABLE:
- Lookback period (default 200 bars)
- Volume thresholds (high/low sensitivity)
- Minimum distance between levels
- Line colors, width and style
- Optional labels
 
 FEATURES:
- Auto-updates on each new bar
- Clean, non-repainting display
- Low CPU usage
- Works on all timeframes and instruments
 
Perfect for: Scalping, Day Trading, Swing Trading
Best on: Forex, Gold, Indices, Crypto

Önerilen ürünler
BE auto
Muhammad Ridzuan Mohd Radzali
5 (2)
Indicator automatically draw bullish and bearish engulfing without any rules. Bearish and Bullish engulf is well known area for supply and demand area marking. This indicator can be used in any strategy that required supply demand zone. Show Last Engulf : Enable this option to show unfresh engulfing  Candle to calculate : set 0 will load all history bar and can use up more memory Bearish Engulfing Colour : Pick any colour that suit Bearish Engulfing Colour  : Pick any colour that suit -Use this
FREE
The Auto Fibonacci Indicator is a professional technical analysis tool that automatically draws Fibonacci retracement levels based on the most recent closed Daily (D1) or 4-Hour (H4) candle. These levels are widely used by traders to identify key support , resistance , and trend reversal zones . This version is designed for manual trading and supports a powerful trading strategy using Fibonacci levels combined with a 50-period EMA (Exponential Moving Average) , which you can easily add from MT4
FREE
Three Bar Reversal
Yury Emeliyanov
3 (2)
Three Bar Reversal (MT4) — free indicator Three Bar Reversal is a simple and effective MetaTrader 4 indicator that detects the classic three-bar reversal candlestick pattern with additional filtering based on ATR and candle body sizes. Arrows are displayed on the last closed candle of the pattern, and push notifications are also sent. An automated trading robot Three Bar Reversal EA has been developed based on this indicator. The indicator works on all currency pairs and timeframes but pe
FREE
WH DrawFib Pro MT4
Wissam Hussein
5 (7)
Grafiklerinize manuel olarak Fibonacci seviyeleri çizmekten sıkıldınız mı? Ticaretinizdeki temel destek ve direnç seviyelerini belirlemenin uygun ve etkili bir yolunu mu arıyorsunuz? Başka yerde arama!   Otomatik fibonacci   seviyeleri   yapan nihai MetaTrader 4 göstergesi olan DrawFib Pro ile tanışın       grafikleriniz üzerinde çizim yapar ve bu seviyeler aşıldığında zamanında uyarılar sağlar. DrawFib Pro ile ticaret stratejilerinizi geliştirebilir, zamandan tasarruf edebilir ve daha bilinçli
FREE
This indicator allows to analyze a chart using the rule of supple and demand. You will see zones of sales and purchases and determine the most profitable points to open positions. The indicator is based on the principle of market fractality. Chart zones show places where a strong buyer or seller has made the price reverse and change its direction. The indicator has several types of zones calculation. Color and type of zones displaying are set as desired. The zone width can be displayed in pips.
FREE
MQLTA Support Resistance Lines is an indicator that calculates the historical levels of Support and Resistance and display them as Lines on chart. It will also Alert you if the price is in a Safe or Dangerous zone to trade and show you the distance to the next level. The indicator is ideal to be used in other Expert Advisor through the iCustom function. This DEMO only works with AUDNZD, the full product can be found at https://www.mql5.com/en/market/product/26328 How does it work? The indicator
FREE
Extremum Reverse Bar
Yurij Izyumov
2.8 (5)
This indicator has been created for finding the probable reversal points of the symbol price. A small candlestick reversal pattern is used it its operation in conjunction with a filter of extremums. The indicator is not redrawn! If the extremum filter is disabled, the indicator shows all points that have a pattern. If the extremum filter is enabled, the condition works – if the history Previous bars 1 candles back contains higher candles and they are farther than the Previous bars 2 candle, such
FREE
This indicator scans for you up to 30 trading instruments and up to 8 timeframes for occurrences of the high probability reversal patterns: Double Tops/Bottoms with fake breakouts . Please read also the blog post " Professional Trading With Double Tops/Bottoms And Divergences! " which explains the concepts behind the ULTIMATE Double Top/Bottom indicator and how you can use a professional top-down approach. This FREE Version of the Scanner scans only EURUSD and GBPUSD. The full version of the sca
FREE
Candle GAP
Thushara Dissanayake
3 (1)
Mum GAP   göstergesi, haftanın her günü için mum boşluklarını otomatik olarak belirlediğinden,   Boşluk Ticareti Stratejilerini   kullanan tacirler için önemli bir araçtır. Boşluk, art arda iki günün kapanış ve açılış arasındaki fiyat seviyesi farkını ifade eder. Bu gösterge dört tür boşluk modelini tanır: Ortak, Koparma, Devam ve Tükenme. Tüccarlar, bu göstergeyi herhangi bir tabloya dahil ederek sinyallerini doğrulayabilir ve alım satım kararlarını geliştirebilir. Mum GAP göstergesinin temel ö
FREE
The Support & Resistance Breakout Indicator with Smart Alerts a utomatically identifies key support and resistance levels using fractal detection, and receive instant breakout signals enhanced by RSI/CCI confirmation filters. This versatile tool includes   push notifications, email alerts, pop-up alerts, and sound alerts  so you never miss a trading opportunity. Key Features: Dynamic Level Detection  – Draws real-time support and resistance based on market fractals. Breakout Arrows  – Clear vis
FREE
.....................................hi....................... ................for showing high s and low s and support and resistanses .....................we have a lot of ways............................... it can be helpful for finding trends , higher highs , higher lows , lower highs , lower lows .......................today i write on of thems.......................... ........................you can enter the number of last support and resistanses .........................and it will dra
FREE
Basic Harmonic Pattern
Mehran Sepah Mansoor
4.58 (59)
Bu gösterge, piyasanın tersine dönme noktalarını tahmin eden en popüler Harmonik Kalıpları tanımlar. Bu harmonik modeller, forex piyasasında sürekli tekrar eden ve gelecekteki olası fiyat hareketlerini öneren fiyat oluşumlarıdır / Ücretsiz MT5 Sürümü Buna ek olarak, bu gösterge yerleşik bir piyasaya giriş sinyalinin yanı sıra çeşitli kar alma ve zararı durdurma sinyallerine de sahiptir. Harmonik formasyon göstergesi kendi başına al/sat sinyalleri sağlayabilse de, bu sinyallerin diğer teknik gö
FREE
This indicator shows the latest untouched support and resistance as horizontal lines. The indicator can show support/resistance from higher timeframes. With this indicator you can e.g. easily see the support/resistance of the timeframes H4, D1 and W1 on a H1 chart, which can be a big advantage while time your entry on H1. This is the FREE version of the indicator: Support Resistance Multi Time Frame The free version works only on EURUSD and GBPUSD! Parameters referenceTF: the timeframe from whi
FREE
Railway Tracks Pattern — Reversal Pattern Indicator Railway Tracks Pattern is an indicator that automatically detects a powerful two-candle reversal pattern on the chart. It looks for two candles with opposite directions (bullish and bearish), similar in size, and with minimal wicks — a clear sign of momentum shift. How it works: The first candle is strong and directional. The second candle moves in the opposite direction and is of similar size. Both candles have small shadows (wicks). The
FREE
PZ Fibonacci
PZ TRADING SLU
4.8 (10)
Are you tired of plotting fibonacci retracements or extensions manually? This indicator displays fibonacci retracements or extensions automatically, calculated from two different price points, without human intervention or manual object anchoring.  [ Installation Guide | Update Guide | Troubleshooting | FAQ | All Products ] Easy to use Manual anchoring is not needed Perfect for price confluence studies The indicator evaluates if retracements or extensions are needed Once drawn, you can manually
FREE
PZ Trendlines
PZ TRADING SLU
4.27 (11)
Tired of plotting trendlines? The PZ TrendLines indicator applies a mechanical approach to the construction of trend lines for you! [ Installation Guide | Update Guide | Troubleshooting | FAQ | All Products ] It can draw up to 18 trendlines Trendlines can be optionally based on fractals Each line represents a breakout level Each trendline can be broken or rejected Configurable amount of lines Configurable colors Author Arturo López Pérez, private investor and speculator, software engineer and
FREE
MQLTA Support Resistance Lines
MQL4 Trading Automation
4.27 (11)
MQLTA Support Resistance Lines is an indicator that calculates the historical levels of Support and Resistance and display them as Lines on chart. It will also Alert you if the price is in a Safe or Dangerous zone to trade and show you the distance to the next level. The indicator is ideal to be used in other Expert Advisor through the iCustom function. This indicator can be tested LIVE on AUDNZD with the following DEMO https://www.mql5.com/en/market/product/26572 How does it work? The indicato
FREE
Fiyat Dalga Modeli   MT4 --(ABCD Modeli)--   hoş geldiniz     ABCD modeli, teknik analiz dünyasında güçlü ve yaygın olarak kullanılan bir ticaret modelidir. Tüccarların piyasadaki potansiyel alım ve satım fırsatlarını belirlemek için kullandıkları uyumlu bir fiyat modelidir. ABCD modeliyle, tüccarlar potansiyel fiyat hareketlerini tahmin edebilir ve alım satımlara ne zaman girip çıkacakları konusunda bilinçli kararlar verebilir. EA Sürümü :   Price Wave EA MT4 MT5 sürümü:   Price Wave Patter
FREE
Predictor PRO MT4
Evgenii Aksenov
5 (2)
A new generation PROgressive indicator from INFINITY. Predictor PRO uses its own entry and exit calculation strategy. Indicator without redrawing signals! This is very important for real trading. The indicator can be used for any currency pairs, metals, cryptocurrencies or indices. The best time of the H1 chart. Unlike other indicators, Predictor PRO shows shows the Buy/Sell entry point and the Close exit point. Calculating the profit of all signals in points on the panel helps to choose the
FREE
Pivot Point Fibo RSJ, Fibonacci oranlarını kullanarak günün destek ve direnç çizgilerini izleyen bir göstergedir. Bu muhteşem gösterge, Fibonacci oranlarını kullanarak Pivot Point üzerinden 7 seviyeye kadar destek ve direnç oluşturur. Fiyatların, bir operasyonun olası giriş/çıkış noktalarını algılamanın mümkün olduğu bu destek ve direncin her bir düzeyine uyması harika. Özellikleri 7 seviyeye kadar destek ve 7 seviye direnç Seviyelerin renklerini ayrı ayrı ayarlayın Girişler Pivot Tipi Pivo
FREE
Harmonik desenler, piyasa dönüm noktalarını tahmin etmek için en uygun olanlardır. Yüksek başarı oranı ve bir günde birçok işlem fırsatı sunarlar. Göstergemiz, harmonik ticaret literatürüne dayanarak en popüler harmonik desenleri tanımlar. ÖNEMLİ NOTLAR: Gösterge yeniden çizmez, gecikmez (D noktasında bir desen algılar) ve yeniden çizilmez (desen ya geçerli ya da iptal edilir). NASIL KULLANILIR: Göstergenizi MT5 grafiğinize sürükleyip bırakın. Desen algılama ayarını TRUE (ABCD; Gartley) olarak a
FREE
PZ Chart Overlay
PZ TRADING SLU
5 (1)
Master the market: harness the power of statistical arbitrage This indicator showcases the price action of multiple instruments on a single chart, enabling you to compare the fluctuations of different assets and seamlessly implement statistical arbitrage strategies. Its main usage is to find correlated symbols which are temporarily out of whack. [ Installation Guide | Update Guide | Troubleshooting | FAQ | All Products ] Find overbought or oversold currency pairs easily Plot up to six currency
FREE
PPR and Engulfing
Yury Emeliyanov
5 (2)
PPR ve Engulfing , MetaTrader 4 (MT4) ticaret platformunda "PPR" ve "Engulfing" desenlerini tanımlamak için tasarlanmış benzersiz bir teknik göstergedir. Bu desenler, potansiyel trend dönüşlerini veya devamlarını gösterebilir ve traderlara piyasaya giriş ve çıkış için değerli sinyaller sağlar. Temel Özellikler: Otomatik Desen Tespiti : Göstergesi, PPR ve Engulfing desenlerini otomatik olarak tanımlar ve grafikte oklarla işaretler. Görsel Sinyaller : Yukarıya doğru yeşil oklar alım noktalarını, a
FREE
Free automatic Fibonacci is an indicator that automatically plots a Fibonacci retracement based on the number of bars you select on the BarsToScan setting in the indicator. The Fibonacci is automatically updated in real time as new highest and lowest values appears amongst the selected bars. You can select which level values to be displayed in the indicator settings. You can also select the color of the levels thus enabling the trader to be able to attach the indicator several times with differe
FREE
Follow The Line
Oliver Gideon Amofa Appiah
3.94 (16)
FOLLOW THE LINE GET THE FULL VERSION HERE: https://www.mql5.com/en/market/product/36024 This indicator obeys the popular maxim that: "THE TREND IS YOUR FRIEND" It paints a GREEN line for BUY and also paints a RED line for SELL.  It gives alarms and alerts of all kinds. IT DOES NOT REPAINT and can be used for all currency pairs and timeframes. Yes, as easy and simple as that. Even a newbie can use it to make great and reliable trades. NB: For best results, get my other premium indicators for more
FREE
Candle Pattern Finder Candle Pattern Finder is a powerful MT4 indicator designed to help traders easily detect key candlestick patterns in real-time. Whether you're trading trends, reversals, or consolidations, this tool highlights important price action signals directly on the chart — helping you make faster and more confident trading decisions. Detects popular candlestick patterns: Bullish/Bearish Engulfing Hammer & Inverted Hammer Shooting Star & Hanging Man Three White Soldiers Three Black
FREE
The indicator allows you to trade binary options. The recommended time frame is М1 and the expiration time is 1,2,3 minutes. The indicator suitable for auto and manual trading. A possible signal is specified as a arrows above/under a candle. You should wait until the candle closes! Arrows are not re-painted Trade sessions: TOKYO section (Half-end) Currency pairs: USD/JPY Working time frame: M1 Expiration time: 1,2,3 minutes. The indicator also shows good results when using the martingale strateg
FREE
UPD1 D Levels
Vitaliy Kuznetsov
5 (3)
Seviye göstergesi bir önceki günün verilerine dayanır. Matematiksel formül giriş ve çıkış seviyelerini belirler.  Ticaret önerileri. Seviyeler, volatilite göründüğünde Avrupa seansının başında işlem görür. Yetersiz volatilite durumunda, çıkmak için kar almanın yarısını kullanın. Fiyat yarı karla tersine dönerse, tersine döndüğünde de yarı kar alma seviyesinde bir hedef arayın. Fiyat giriş seviyesinden sıçradıysa, ters yönde fiyat ikinci alım karına ulaşabilir. Her zaman bir kopuşa girmemelisi
FREE
Ppr PA
Yury Emeliyanov
4.5 (2)
"Ppr PA" is a unique technical indicator created to identify "PPR" patterns on the currency charts of the MT4 trading platform. These patterns can indicate possible reversals or continuation of the trend, providing traders with valuable signals to enter the market. Features: Automatic PPR Detection:   The indicator automatically identifies and marks PPR patterns with arrows on the chart. Visual Signals:   Green and red arrows indicate the optimal points for buying and selling, respectively. Ar
FREE
Aroon Classic
Etsushi Ishizuka
Aroon Classic Göstergesinin Genel Bakışı Aroon Classic göstergesi, bir grafikte trendin oluşumunu ve devamlılığını nicel olarak belirleyen teknik bir araçtır. Trend gücünü ve dönüş noktalarını 0–100 aralığında göstermek için “Aroon Up” ve “Aroon Down” olmak üzere iki çizgi kullanır. Yüksek bir Aroon Up değeri güçlü bir yükseliş trendini, yüksek bir Aroon Down değeri ise güçlü bir düşüş trendini işaret eder. Öne Çıkan Özellikler Trend başlangıcını ve dönüşünü görsel olarak ayırt eder Hesaplama pe
FREE
Bu ürünün alıcıları ayrıca şunları da satın alıyor
Gann Made Easy
Oleg Rodin
4.83 (156)
Gann Made Easy , bay teorisini kullanarak ticaretin en iyi ilkelerine dayanan, profesyonel ve kullanımı kolay bir Forex ticaret sistemidir. WD Gann. Gösterge, Zararı Durdur ve Kâr Al Seviyeleri dahil olmak üzere doğru SATIN AL ve SAT sinyalleri sağlar. PUSH bildirimlerini kullanarak hareket halindeyken bile işlem yapabilirsiniz. Satın alma işleminden sonra, alım satım talimatlarını ve harika ek göstergeleri ücretsiz olarak almak için lütfen benimle iletişime geçin! Muhtemelen Gann ticaret yöntem
Scalper Inside PRO
Alexey Minkov
4.74 (69)
An exclusive indicator that utilizes an innovative algorithm to swiftly and accurately determine the market trend. The indicator automatically calculates opening, closing, and profit levels, providing detailed trading statistics. With these features, you can choose the most appropriate trading instrument for the current market conditions. Additionally, you can easily integrate your own arrow indicators into Scalper Inside Pro to quickly evaluate their statistics and profitability. Scalper Inside
M1 Sniper
Oleg Rodin
5 (20)
M1 SNIPER kullanımı kolay bir işlem göstergesi sistemidir. M1 zaman dilimi için tasarlanmış bir ok göstergesidir. Gösterge, M1 zaman diliminde scalping için bağımsız bir sistem olarak kullanılabilir ve mevcut işlem sisteminizin bir parçası olarak kullanılabilir. Bu işlem sistemi özellikle M1'de işlem yapmak için tasarlanmış olsa da, diğer zaman dilimleriyle de kullanılabilir. Başlangıçta bu yöntemi XAUUSD ve BTCUSD ticareti için tasarladım. Ancak bu yöntemi diğer piyasalarda işlem yaparken de ya
Atomic Analyst
Issam Kassas
5 (4)
Öncelikle belirtmek gerekir ki bu Ticaret Göstergesi Yeniden Çizim Yapmaz, Gecikmez ve Gecikme Göstermez, bu da hem manuel hem de robot ticareti için ideal hale getirir. Kullanıcı kılavuzu: ayarlar, girişler ve strateji. Atom Analisti, Piyasada Daha İyi Bir Avantaj Bulmak İçin Fiyatın Gücünü ve Momentumunu Kullanan PA Fiyat Hareketi Göstergesidir. Gürültüleri ve Yanlış Sinyalleri Kaldırmaya ve Ticaret Potansiyelini Artırmaya Yardımcı Olan Gelişmiş Filtrelerle Donatılmıştır. Birden fazla katman
Linear Trend Predictor - Giriş noktalarını ve yön destek çizgilerini birleştiren bir trend göstergesi. Yüksek/Düşük fiyat kanalını kırma prensibiyle çalışır. Gösterge algoritması piyasa gürültüsünü filtreler, oynaklığı ve piyasa dinamiklerini dikkate alır. Gösterge yetenekleri  Düzeltme yöntemleri kullanılarak piyasa trendi ve ALIM veya SATIŞ emirlerinin açılabileceği giriş noktaları gösterilir.  Herhangi bir zaman dilimindeki grafikleri analiz ederek kısa ve uzun vadeli piyasa hareketlerini
" Dynamic Scalper System " göstergesi, trend dalgaları içinde işlem yapmak için scalping yöntemi için tasarlanmıştır. Başlıca döviz çiftleri ve altın üzerinde test edilmiştir, diğer işlem araçlarıyla uyumluluğu mümkündür. Ek fiyat hareketi desteğiyle trend boyunca pozisyonların kısa vadeli açılması için sinyaller sağlar. Göstergenin prensibi. Büyük oklar trend yönünü belirler. Küçük oklar şeklinde scalping için sinyaller üreten bir algoritma trend dalgaları içinde çalışır. Kırmızı oklar yüksel
Trend Screener
STE S.S.COMPANY
4.79 (95)
Trend Göstergesi, Trend Alım Satım ve Filtreleme için Çığır Açan Benzersiz Çözüm, Tüm Önemli Trend Özellikleriyle Tek Bir Araç İçinde Yerleştirildi! Forex, emtialar, kripto para birimleri, endeksler ve hisse senetleri gibi tüm sembollerde/araçlarda kullanılabilen %100 yeniden boyamayan çoklu zaman çerçevesi ve Çoklu para birimi göstergesidir. SINIRLI SÜRELİ TEKLİF: Destek ve Direnç Tarama Göstergesi sadece 50$ ve ömür boyu mevcuttur. (Orijinal fiyat 250$) (teklif uzatıldı) Trend Screener, grafik
Trend Lines PRO
Roman Podpora
5 (1)
TREND ÇİZGİLERİ PRO     Piyasanın gerçek yön değişimini anlamaya yardımcı olur. Gösterge, gerçek trend dönüşlerini ve büyük oyuncuların piyasaya yeniden girdiği noktaları gösterir. Anlıyorsun     BOS hatları  Daha yüksek zaman dilimlerindeki trend değişiklikleri ve önemli seviyeler, karmaşık ayarlar veya gereksiz gürültü olmadan gösterilir. Sinyaller yeniden çizilmez ve çubuk kapandıktan sonra grafikte kalır. VERSION MT 5     -    RFI LEVELS PRO  göstergesiyle birlikte kullanıldığında maksimum p
NAM Order Blocks
NAM TECH GROUP, CORP.
3.67 (3)
MT4 Multi-timeframe Order Blocks detection indicator. Features - Fully customizable on chart control panel, provides complete interaction. - Hide and show control panel wherever you want. - Detect OBs on multiple timeframes. - Select OBs quantity to display. - Different OBs user interface. - Different filters on OBs. - OB proximity alert. - ADR High and Low lines. - Notification service (Screen alerts | Push notifications). Summary Order block is a market behavior that indicates order collection
GOLD Impulse with Alert
Bernhard Schweigert
4.67 (12)
Bu gösterge, 2 ürünümüz Advanced Currency IMPULSE with ALERT  +   Currency Strength Exotics  'in süper bir kombinasyonudur. Tüm zaman dilimleri için çalışır ve 8 ana para birimi artı bir Sembol için grafiksel olarak güç veya zayıflık dürtüsünü gösterir! Bu Gösterge, Altın, Egzotik Çiftler, Emtialar, Endeksler veya Vadeli İşlemler gibi herhangi bir sembol için para birimi gücü ivmesini göstermek için uzmanlaşmıştır. Türünün ilk örneğidir, Altın, Gümüş, Petrol, DAX, US30, MXN, TRY, CNH vb. içi
MTF Supply Demand Zones
Georgios Kalomoiropoulos
4.82 (22)
Yeni Nesil Otomatik Arz ve Talep Bölgeleri. Her Grafikte Çalışan Yeni ve Yenilikçi Algoritma. Tüm Bölgeler Piyasanın Fiyat Hareketine Göre Dinamik Olarak Oluşturulmaktadır. İKİ TÜR UYARI --> 1) FİYAT BİR BÖLGEYE ÇIKTIĞINDA 2) YENİ BİR BÖLGE OLUŞTURDUĞUNDA Bir tane daha işe yaramaz gösterge almazsın. Kanıtlanmış Sonuçlarla eksiksiz bir Ticaret Stratejisi elde edersiniz.     Yeni özellikler:     Fiyat Arz/Talep Bölgesine ulaştığında uyarılar     Yeni bir Arz/Talep Bölgesi oluşturulduğunda
MetaForecast M4
Vahidreza Heidar Gholami
5 (2)
MetaForecast, fiyat verilerindeki harmonileri kullanarak herhangi bir piyasanın geleceğini tahmin eder ve görselleştirir. Piyasa her zaman tahmin edilemezken, fiyatlarda bir desen varsa, MetaForecast geleceği mümkün olduğunca doğru bir şekilde tahmin edebilir. Benzer ürünlere göre, MetaForecast piyasa eğilimlerini analiz ederek daha kesin sonuçlar üretebilir. Giriş Parametreleri Past size (Geçmiş boyut) MetaForecast'ın gelecekteki tahminler oluşturmak için kullandığı çubuk sayısını belirtir. Mo
Introducing the Delta Volume Profile Indicator - Unleash the Power of Institutional Precision!  Technical Indicator: Are you ready to trade like the pros? The Delta Volume Profile Indicator is no ordinary tool. It’s a high-precision, cutting-edge indicator that puts the power of institutional-grade trading in your hands. This unique indicator analyses delta volume distribution in real-time, revealing the market's hidden buy/sell imbalances that the biggest financial institutions rely on to antic
RFI levels PRO
Roman Podpora
5 (1)
Bu gösterge, fiyat dönüş noktalarını ve fiyat geri dönüş bölgelerini doğru bir şekilde gösterir.       Başlıca oyuncular   . Yeni trendlerin nerede oluştuğunu görüyorsunuz ve her işlem üzerinde kontrolü elinizde tutarak, azami hassasiyetle kararlar alıyorsunuz. TREND LINES PRO   göstergesiyle birlikte kullanıldığında maksimum potansiyelini ortaya koyar.  VERSION MT5 Göstergenin gösterdiği şey: Yeni bir trendin başlangıcında aktivasyonla birlikte tersine dönüş yapıları ve tersine dönüş seviyeler
TPSpro RFI Levels
Roman Podpora
4.86 (28)
TALİMATLAR RUS  /  TALİMATLAR   ENG  /  Sürüm MT5 Ana fonksiyonları: Satıcı ve alıcıların aktif bölgelerini görüntüler! Gösterge, satın alma ve satışlar için tüm doğru ilk dürtü seviyelerini/bölgelerini görüntüler. Giriş noktaları arayışının başladığı bu seviyeler/bölgeler etkinleştirildiğinde, seviyeler renk değiştirir ve belirli renklerle doldurulur. Ayrıca, durumun daha sezgisel bir şekilde algılanması için oklar görünür. LOGIC AI - Bir şablonu etkinleştirirken giriş noktalarını aramak için
Adaptive Volatility Range [AVR] is a powerful tool for identifying key trend reversal points. AVR accurately reflects the Average True Range (ATR) of volatility, taking into account the Volume-Weighted Average Price (VWAP). The indicator adapts to any market volatility by calculating the average volatility over a specific period, ensuring a stable rate of profitable trades. You receive not just an indicator but a professional automated trading system , AVR-EA . Advantages: Automated Trading Sys
Dynamic Forex28 Navigator
Bernhard Schweigert
4.43 (7)
Dynamic Forex28 Navigator - Yeni Nesil Forex Ticaret Aracı. ŞU ANDA %49 İNDİRİM. Dynamic Forex28 Navigator, uzun zamandır popüler olan göstergelerimizin evrimidir ve üçünün gücünü tek bir göstergede birleştirir: Gelişmiş Döviz Gücü28 Göstergesi (695 inceleme) + Gelişmiş Döviz İMPULS ve UYARI (520 inceleme) + CS28 Kombo Sinyalleri (Bonus). Gösterge hakkında ayrıntılar https://www.mql5.com/en/blogs/post/758844 Yeni Nesil Güç Göstergesi Ne Sunuyor?  Orijinallerde sevdiğiniz her şey, şimdi yeni
Super Reversal Indicator with Alert Genel Bakış Super Reversal Indicator with Alert, stokastik momentum, arz ve talep bölgeleri ve fiyat reddi sinyallerini birleştirerek yüksek olasılıklı piyasa dönüş noktalarını belirlemek için tasarlanmış çoklu zaman dilimli bir işlem aracıdır. Bu gösterge, net görsel sinyaller ve gerçek zamanlı uyarılar ile yatırımcıların piyasadaki olası dönüş noktalarını tespit etmesine yardımcı olur. Temel Özellikler Çoklu Zaman Dilimli Stokastik Analiz Daha yüksek zaman d
MT5 Versiyonu Burada Mevcut: https://www.mql5.com/en/market/product/50048 Telegram Kanalı ve Grubu: https://t.me/bluedigitsfx V.I.P Grup Erişimi: Ücretli ürünlerimizden herhangi birinin ödeme kanıtını özel mesaj ile gönderin Önerilen Broker: https://bit.ly/BlueDigitsFxStarTrader BlueDigitsFx Easy 123 System — MT4 için Güçlü Tersine Dönüş ve Kopuş Tespiti Piyasa yapısındaki değişimleri, kopuşları ve trend dönüşlerini kolayca tespit etmek için tasarlanmış, baştan sona non-repaint (yeniden çiz
Advanced Supply Demand
Bernhard Schweigert
4.91 (299)
Özel Ticaret –%40 İndirim Yeni Başlayanlar veya Uzman Yatırımcılar İçin En İyi Çözüm! Bu gösterge, bir dizi özel özellik ve yeni bir formül içerdiği için benzersiz, yüksek kaliteli ve uygun fiyatlı bir işlem aracıdır. Bu güncelleme ile çift zaman dilimi bölgeleri gösterebileceksiniz. Sadece daha yüksek bir zaman dilimini değil, hem grafik zaman dilimini hem de daha yüksek zaman dilimini gösterebileceksiniz: İÇ İÇE GEÇMİŞ BÖLGELER GÖSTERİYOR. Tüm Arz Talep yatırımcıları buna bayılacak. :) Önem
Fiyat tersine döndükçe ve geri çekildikçe piyasa yapısından elde edilen kâr değişir. Piyasa yapısını tersine çevirme uyarısı göstergesi, bir trendin veya fiyat hareketinin ne zaman tükenmeye yaklaştığını ve tersine dönmeye hazır olduğunu tanımlar. Genellikle bir geri dönüş veya büyük bir geri çekilme meydana gelmek üzereyken meydana gelen piyasa yapısındaki değişiklikler konusunda sizi uyarır. Gösterge, olası bir tükenme noktasının yakınında her yeni yüksek veya düşük oluştuğunda, başlangıçta
Currency Strength Wizard , başarılı ticaret için size hepsi bir arada çözüm sağlayan çok güçlü bir göstergedir. Gösterge, birden çok zaman dilimindeki tüm para birimlerinin verilerini kullanarak şu veya bu forex çiftinin gücünü hesaplar. Bu veriler, şu veya bu para biriminin gücünü görmek için kullanabileceğiniz, kullanımı kolay para birimi endeksi ve para birimi güç hatları biçiminde temsil edilir. İhtiyacınız olan tek şey, işlem yapmak istediğiniz tabloya göstergeyi eklemektir ve gösterge size
Volatility Trend System - girişler için sinyaller veren bir ticaret sistemi. Oynaklık sistemi, trend yönünde doğrusal ve noktasal sinyaller ve ayrıca yeniden çizme ve gecikme olmaksızın trendden çıkmak için sinyaller verir. Trend göstergesi, orta vadeli trendin yönünü izler, yönünü ve değişimini gösterir. Sinyal göstergesi volatilitedeki değişikliklere dayalıdır ve piyasa girişlerini gösterir. Gösterge, çeşitli uyarı türleri ile donatılmıştır. Çeşitli alım satım araçlarına ve zaman dilimlerine
Super Signal Market Slayer Repaint Yok | Yüksek Hassasiyet | Çok Piyasaya Uyumlu Akıllı Trend Göstergesi Trading’de asıl zorluk emir vermek değil, piyasa gürültüsü içinde trendin ne zaman başladığını net şekilde görmektir. Market Slayer bu amaçla geliştirildi. Bu gösterge, gün içi işlemler için tasarlanmış repaint yapmayan akıllı bir indikatördür. Çok katmanlı onay ve trend filtreleme sayesinde yalnızca kritik anlarda net ve güvenilir Buy / Sell sinyalleri üretir. Temel Avantajlar Repaint yok B
TrendLine PRO MT4
Evgenii Aksenov
4.83 (167)
Trend Line PRO   göstergesi bağımsız bir işlem stratejisidir. Trend değişimini, işleme giriş noktasını gösterir ve ayrıca üç seviyede Kar Al ve Zarar Durdur korumasını otomatik olarak hesaplar. Trend Line PRO , tüm Meta Trader sembolleri için mükemmeldir: para birimleri, metaller, kripto para birimleri, hisse senetleri ve endeksler. Gösterge, gerçek hesaplarda işlem yaparken kullanılır ve bu da stratejinin güvenilirliğini doğrular. Trend Line PRO   ve gerçek Sinyal kullanan robotlar burada bu
Stratos Pali
Michela Russo
4.43 (7)
Stratos Pali Indicator   is a revolutionary tool designed to enhance your trading strategy by accurately identifying market trends. This sophisticated indicator uses a unique algorithm to generate a complete histogram, which records when the trend is Long or Short. When a trend reversal occurs, an arrow appears, indicating the new direction of the trend. Important Information Revealed Leave a review and contact me via mql5 message to receive My Top 5 set files for Stratos Pali at no cost! Dow
FX Power MT4 NG
Daniel Stein
4.95 (21)
FX Power: Daha Akıllı Ticaret Kararları için Para Birimlerinin Gücünü Analiz Edin Genel Bakış FX Power , her piyasa koşulunda başlıca para birimlerinin ve altının gerçek gücünü anlamak için vazgeçilmez bir araçtır. Güçlü para birimlerini alıp zayıf olanları satarak, FX Power ticaret kararlarınızı basitleştirir ve yüksek olasılıklı fırsatları ortaya çıkarır. İster trendlere sadık kalın ister Delta'nın aşırı değerlerini kullanarak tersine dönüşleri öngörün, bu araç ticaret tarzınıza mükemmel bir
Matrix Arrow Indicator MT4
Juvenille Emperor Limited
5 (3)
Matrix Arrow Indicator MT4 , forex, emtialar, kripto para birimleri, endeksler, hisse senetlerigibi tüm sembollerde/araçlarda kullanılabilen %100 yeniden boyamayan çoklu zaman çerçevesi göstergesini izleyen benzersiz bir 10'u 1 arada trenddir.  Matrix Arrow Indicator MT4 , mevcut eğilimi erken aşamalarında belirleyecek ve aşağıdakiler gibi 10'a kadar standart göstergeden bilgi ve veri toplayacaktır: Ortalama Yönlü Hareket Endeksi (ADX) Emtia Kanal Endeksi (CCI) Klasik Heiken Ashi mumları Hareke
Scalper Vault
Oleg Rodin
5 (36)
Scalper Vault , başarılı bir scalping için ihtiyacınız olan her şeyi size sağlayan profesyonel bir scalping sistemidir. Bu gösterge, forex ve ikili opsiyon tüccarları tarafından kullanılabilecek eksiksiz bir ticaret sistemidir. Önerilen zaman çerçevesi M5'tir. Sistem size trend yönünde doğru ok sinyalleri sağlar. Ayrıca size üst ve alt sinyaller ve Gann piyasa seviyeleri sağlar. Göstergeler, PUSH bildirimleri dahil her türlü uyarıyı sağlar. Göstergeyi satın aldıktan sonra lütfen benimle iletişim
After purchase, contact me privately to receive 7 days of free testing with EA Forex Proton. This advanced MT4 trading robot automatically executes signals from any MT4 indicator, including Market Makers. The latest version also includes AI integration, allowing each trade signal to be analyzed using Artificial Intelligence. Market Makers is a powerful price action trading system designed to identify high-probability Buy and Sell opportunities based on market momentum, volatility, and price po
Yazarın diğer ürünleri
Volume Profile Density V2.40 Fiyat seviyelerine göre işlem hacmini gösterir ve kurumsal ilgiyi çeken bölgeleri ortaya çıkarır. Klasik hacim göstergelerinden farklı olarak, hacmin gerçekte nerede yoğunlaştığını gösterir. Temel ilkeler: Yatay çubuklar = her fiyat seviyesindeki işlem hacmi Daha uzun çubuk → daha yüksek hacim Kırmızı bölgeler = güçlü destek / direnç alanları Ana kullanımlar: Gerçek destek ve direnç bölgelerini belirleme POC (Point of Control) tespiti Değer Alanı (toplam hacmin %70’i
FREE
Iceblock Volume
Vincent Jose Proenca
5 (1)
Kısa ifade: Iceblock — fiyat hareketinin az olduğu fakat işlem hacminin yüksek olduğu kümeleri tespit eden MT4 göstergesi (buzdağı benzeri davranış). TF: Tüm zaman dilimlerinde çalışır (M1–D1). Parite: Forex, endeksler, altın ve CFD’lerle uyumlu. Ayarlar: VolumeLookback – ortalama hacim hesabı için mum sayısı VolumeThreshold – anormal yüksek hacmi belirleyen çarpan ClusterSize – küme doğrulaması için bitişik mum sayısı RangeComparisonPeriod – mum aralıklarının (high–low) ortalaması için dönem
FREE
VWAP_PC_MQL5 — MT5 üzerinde hacim ağırlıklı ortalama fiyatı (VWAP) gösteren basit, el yapımı bir gösterge. TF: Tüm zaman dilimlerinde çalışır. Parite: Forex, endeks, emtia ve hisse senetleriyle uyumlu. Ayarlar: AppliedPrice – hesaplama için kullanılan fiyat türü LineColor / Width / Style – çizgi görünümü SessionReset – günlük sıfırlama veya sürekli mod Çalışma prensibi (VWAP): VWAP (Volume Weighted Average Price) = (Fiyat × Hacim toplamı) / (Hacim toplamı) Fiyat VWAP’ın üzerindeyse alıcılar b
FREE
CustomBreakout
Vincent Jose Proenca
Range Breakout EA – Simple Description Concept An automated trading robot for MetaTrader 5 that exploits range breakouts with two key periods: Features Automatic market hours management Customizable Stop Loss and Take Profit Smart Trailing Stop Built-in testing mode for simulation Detailed logs for monitoring How It Works Records extreme prices at the start of the day Waits for a breakout of the secondary range Opens a position in the breakout direction Automatically manages the trade (SL/TP/Tr
FREE
Pivot PDHL Levels
Vincent Jose Proenca
AutoPivot – Otomatik Pivot Noktaları Göstergesi MT4 göstergesi, pivot noktalarını (PP, R1/R2/R3, S1/S2/S3) ve önceki günün seviyelerini (PDH/PDL) gösterir. Ana özellikler: Grafiğin zaman dilimine (H4/D1/W1) göre otomatik uyum PDH/PDL ile en yakın destek/direnç seviyesi arasındaki bölgeler 8 önceden ayarlanmış renk teması Renkler, çizgi stilleri ve bölge saydamlığı tamamen özelleştirilebilir Fiyat gösterimi isteğe bağlı kompakt etiketler Yapılandırılabilir otomatik güncellemeler Seviyeler, standa
PDHL – simply displays the highs and lows of previous days directly on your chart, providing a quick and visual reference of past key levels. The indicator is lightweight and easily customizable , allowing you to adjust the number of days displayed, the colors, as well as the style and thickness of the lines to suit your preferences. It is designed to be simple and practical, but may not work on all instruments or platforms . Only teste Tested only with CFDs
FREE
Volume-to-Price Movement Oscillator (VP Oscillator) for MT5 The VP Oscillator highlights the balance (or imbalance) between trading volume and price movement, helping traders spot hidden accumulation, distribution, or weakening trends. How It Works: Calculates each bar’s price range (High–Low) and tick volume. Normalizes both values over a set period (default: 14). Plots the absolute difference between them ×100 — showing how closely price action aligns with trading activity. Interpretation: Hig
FREE
VMS Oscillator
Vincent Jose Proenca
Volume & Move Strength (VMS) Indicator for MT5 The VMS Indicator displays the relationship between trading volume and price movement strength, helping traders assess how well market activity supports price action. How It Works: Measures tick volume as trading activity. Calculates move strength using a normalized True Range (%). Both values can be smoothed (default: 5) and optionally normalized (0–100) for consistency across markets. Plots two lines in a separate window: Blue (Volume) – trading a
FREE
This indicator allows you to number bars within a trading session for CFDs. It works on GER40, UK100, US30, US100, and US500 and is fully customizable to fit your trading style and chart preferences. Key Features & Parameters: Customizable session interval: define your own session start and end times Option to hide even numbers for a cleaner chart Adjust number distance to position the bar numbers as you prefer Font size and color: choose the size and color that suit your chart Number of days di
FREE
Dynamic Pivot Zones
Vincent Jose Proenca
Dynamic Pivot Zones – Your Level Assistant on the Chart This indicator is a bit like a GPS for your trading . It shows you where the price likes to hang out, where it gets nervous, and where it flies through. No more calculating pivots by hand or guessing support and resistance levels. What it does: Automatically plots H1, H4, and D1 pivots . Shows support and resistance zones : R1, R2, S1, S2. Lines are colored and easy to read , so you can instantly see what’s hot or cold. Why you’ll love it:
FREE
Custom Box CFDs
Vincent Jose Proenca
Range Box Indicator for Trading Sessions This indicator allows traders to visualize and analyze specific time ranges directly on their chart by drawing rectangular boxes for each trading session. Key Features: Customizable session interval: set your own session start and end times. Number of days displayed: choose how many past sessions are visible. Default color and special color for Monday: easily highlight weekly patterns. Adjustable border width: customize the appearance of the rectangles to
FREE
indicator that numbers the bars (candles) in a custom trading session. The indicator allows: Defining the session start time (StartHour and StartMinute) Displaying numbers only on odd bars (if AfficherUniquementImpairs is true) Displaying numbers on the last N days (NbJours) Customizing the color and font size of the text The indicator will loop through the bars of the last N days and, for each day, start counting from the session start time. It will display the bar number (starting at 1) belo
FREE
STRUCTURAL TREND LINES - MT4/MT5 Indicator Simple indicator that automatically draws trend lines based on market structure. Features: - 3 degrees of structure detection (short, medium, long term) - Configurable swing strength for each degree - Single color per degree for clean visualization - Adjustable number of lines per degree - Customizable colors and line widths How it works: The indicator identifies swing highs and lows based on the strength parameter, then connects these points to crea
FREE
Adaptive Flow MAs
Vincent Jose Proenca
Adaptive Flow MAs is a moving average indicator designed to naturally adjust to market movements. Unlike traditional averages, it dynamically adapts its periods based on recent volatility and the current trend. The EMA closely follows rapid price swings to capture every impulse, while the SMA remains smoother, providing a stable and reliable reference. With a clean display showing the current adaptive periods, this tool helps traders feel the “flow” of the market without visual clutter. It’s cr
FREE
STRUCTURAL TREND LINES - MT4 Indicator Simple indicator that automatically draws trend lines based on market structure. Features: - 3 degrees of structure detection (short, medium, long term) - Configurable swing strength for each degree - Single color per degree for clean visualization - Adjustable number of lines per degree - Customizable colors and line widths How it works: The indicator identifies swing highs and lows based on the strength parameter, then connects these points to create t
FREE
The Candle Activity Visualizer turns your chart into a dynamic heatmap, giving you a clear view of buying and selling pressure. In-Depth Market Insight: Active Zone Detection: The algorithm highlights areas where high volume builds up within a narrow price range, revealing key pressure zones. Real-Time Intensity: Colors adjust in real time, shifting smoothly from cool tones to warmer shades as activity increases. Visual Customization: 5 Color Palettes: Choose from five professionally designed th
Rainbow Price Visualizer v1.21 See where the market really breathes. Turns your MT4 chart into an ultra-precise heatmap that highlights price zones favored by big players. Why it matters 300 price levels at 0.2‑pip resolution — microscopic detail. 8 visual themes (Rainbow, Fire, Ocean…) for instant readibility. Smart opacity: low noise fades, real zones pop. Lightweight rendering with automatic cleanup. Fully customizable: saturation, opacity, resolution, history depth. Bands project into the f
Baloncuk Göstergesi — Fiyat Yavaşlaması + Hacim Sıçraması Fiyat aniden yavaşladığında ve aynı anda hacim yükseldiğinde grafikte renkli kareler gösteren basit bir görsel araç. (Doldurma fonksiyonu ve konsantrik baloncuk efekti içerir) Piyasanın hareket etmeye hazırlanacağı önemli anları tespit etmeye yardımcı olur. Göstergenin yaptığı şeyler: Piyasanın hareket etmeden önce “tereddüt ettiği” anları tespit eder Büyük hacim girişlerinin fiyatı çok fazla hareket ettirmediği noktaları gösterir Olası k
Institutional Flow Indicator A smart volume-based tool that detects institutional activity zones through direct order flow patterns. It reveals where large institutions operate. An advanced volume indicator that filters out noise to identify probable institutional patterns. Key Features Smart cluster detection Automatic identification Signal classification: Violet / Yellow – Institutional Zone – Strong, sustained institutional activity Red / Green – Strong Signal – Significant buying/selling pre
AMD Adaptive MA MT4
Vincent Jose Proenca
5 (1)
AMD Uyarlanabilir Hareketli Ortalama (AAMA) AAMA, MetaTrader 4 için geliştirilmiş, piyasa koşullarına göre tepkisini otomatik olarak ayarlayan bir uyarlanabilir hareketli ortalama göstergesidir. Temel Özellikler: Kaufman Verimlilik Oranı’na dayalı uyarlanabilir hareketli ortalama – güçlü trendlerde hızlı tepki verir, yatay piyasalarda gürültüyü filtreler 4 AMD piyasa aşamasının otomatik tespiti: Birikim (Accumulation), Yükseliş (Markup), Dağıtım (Distribution), Düşüş (Markdown) ATR aracılığıyla
STRUCTURAL TREND LINES - MT4 Indicator Simple indicator that automatically draws trend lines based on market structure. Features: - 3 degrees of structure detection (short, medium, long term) - Configurable swing strength for each degree - Single color per degree for clean visualization - Adjustable number of lines per degree - Customizable colors and line widths How it works: The indicator identifies swing highs and lows based on the strength parameter, then connects these points to create t
Volume Profil MT4
Vincent Jose Proenca
Volume Profile Rectangle – Ürün Açıklaması Özet Seçilen bir alan içindeki her fiyat seviyesindeki işlem hacminin yatay analizini gösteren interaktif bir hacim profili göstergesidir . Otomatik olarak taşınabilir bir dikdörtgen oluşturur ve yükseliş (bullish) ve düşüş (bearish) hacim dağılımını renkli çubuklarla gösterir. Neler yapar: Yatay hacmi gösterir : Her fiyat seviyesindeki hacim dağılımını yatay çubuklar şeklinde görselleştirir Yükseliş/Düşüş analizi : Çubukları yeşil (yükseliş hacmi baskı
Proxy OrderFlow MT4
Vincent Jose Proenca
5 (1)
Tick-spread dengesizliğine dayalı gösterge. TF: Tüm zaman dilimlerinde çalışır (M1’den D1’e). Parite: Forex, endeksler, altın ve CFD’lerle uyumludur (JPY, Altın ve CFD enstrümanları için otomatik ayar). Ayarlar: TickWindow (200) – tik gözlem penceresi SpreadWeight (1.5) – spread ağırlığı NormalizationPeriod (20) – normalizasyon periyodu (z-score) Overbought / Oversold (±3.0) – uyarı eşikleri AlertCooldown (300s) – uyarılar arasındaki bekleme süresi Sonuç: Proxy Order Flow – Imbalance Tick-Spr
Nexus Signal System
Vincent Jose Proenca
TEKNİK AÇIKLAMA Nexus Signal System, MT4 için 12 teknik kriteri birleştirerek ticaret sinyalleri üreten bir göstergedir. Sistem, bir sinyali doğrulamadan önce birden fazla faktörün (trend, momentum, hacim, destek/direnç bölgeleri) birleşimini analiz eder; bu sayede yalnızca tek bir kriter kullanan göstergelere kıyasla yanlış sinyallerin sayısı azalır. ANALİZ KRİTERLERİ (0–15 Puan): Formasyon tespiti (pin bar, engulfing) Çoklu Zaman Çerçevesi Analizi (üst zaman diliminde trend doğrulama) ADX Piya
VR Signal
Vincent Jose Proenca
VolumeRejectionSignals v5.0 Gelişmiş Hacim Analiz Göstergesi Genel Açıklama VolumeRejectionSignals v5.0, hacim retlerini derinlemesine analiz ederek önemli fiyat hareketlerini doğru bir şekilde tespit etmek için tasarlanmış gelişmiş bir teknik göstergedir. Emir akışı dinamikleri ve piyasa yapısını birleştirerek, alım veya satım baskısının azaldığı bölgeleri tespit eder ve trend dönüşlerini veya hızlanmalarını önceden tahmin etmeyi sağlar. Akıllı Puanlama Sistemi Göstergeler, her sinyalin kalit
Liquidity Compression MT4
Vincent Jose Proenca
5 (1)
Kurumsal Likidite Sıkışma Göstergesi Bu gösterge, Bollinger Bantlarının normalize edilmiş genişliğini, hacmi ve ortalama spread’i kullanarak likidite daralmasını gerçek zamanlı olarak ölçer ve fiyat kırılmalarından önceki sıkışma evrelerini tespit eder. Görünüm: Profesyonel tarzda ayrı bir pencerede “Compression Score” histogramı ve “Threshold” referans çizgisi. Temel Özellikler Erken tespit: Fiyat hareketlerinden önce daralma bölgelerini belirler. Çok faktörlü ölçüm: Normalize edilmiş Bollinge
Mean Reversion Probability – İstatistiksel Dönüş Göstergesi Kısa açıklama Piyasa yorgunluk bölgelerini nicel hassasiyetle tanımlayan, 200 hareketli ortalamaya geri dönüş olasılığını tarihsel aşırılıklar analizine dayanarak hesaplayan kurumsal bir göstergedir. Temel Özellikler Gelişmiş istatistiksel analiz – Gerçek olasılıkları hesaplamak için 500+ tarihsel aşırılık veritabanı oluşturur Olasılık skoru 0–99% – Ortalama dönüş olasılığını kesin olarak ölçer Yorgunluk tespiti – Aşırılığın süresini
WBP Chart Signals
Vincent Jose Proenca
WBP Chart Signals – Çok zaman dilimli alım/satım baskı göstergesi Açıklama: WBP Chart Signals, hacim, spread ve fiyat hareketini analiz ederek piyasa baskısını ölçen gelişmiş bir göstergedir. Çok zaman dilimli onay ve kurumsal analiz tarzı ile hassas sinyaller arayan yatırımcılar için idealdir. Ana Özellikler: Weighted Buy Pressure (WBP): VWAP, MA200, hacim gücü, likidite ve momentumu birleştiren özel algoritma Çok zaman dilimli analiz: Üst zaman diliminde otomatik onay Gerçek zamanlı çok sembo
ARB , yüksek olasılıklı kırılma (breakout) fırsatlarını belirlemek için tasarlanmış bir göstergedir. Adaptif ATR kanal sistemi ve hassas çok faktörlü puanlama modeli (0–100) sayesinde çalışır. Volatilite, hacim, momentum ve çoklu zaman dilimi trendini birleştirerek, filtrelenmiş, görsel ve gerçek zamanlı olarak kullanılabilir sinyaller sunar. ÇALIŞMA PRENSİPLERİ Gösterge, Adaptive Range Breakout (ARB) kavramına dayanır — bu modern kırılma ticareti yaklaşımı, piyasa volatilitesine (ATR) ve fiyatı
Filtrele:
Değerlendirme yok
Değerlendirmeye yanıt