Visual Volatility Clustering mt5

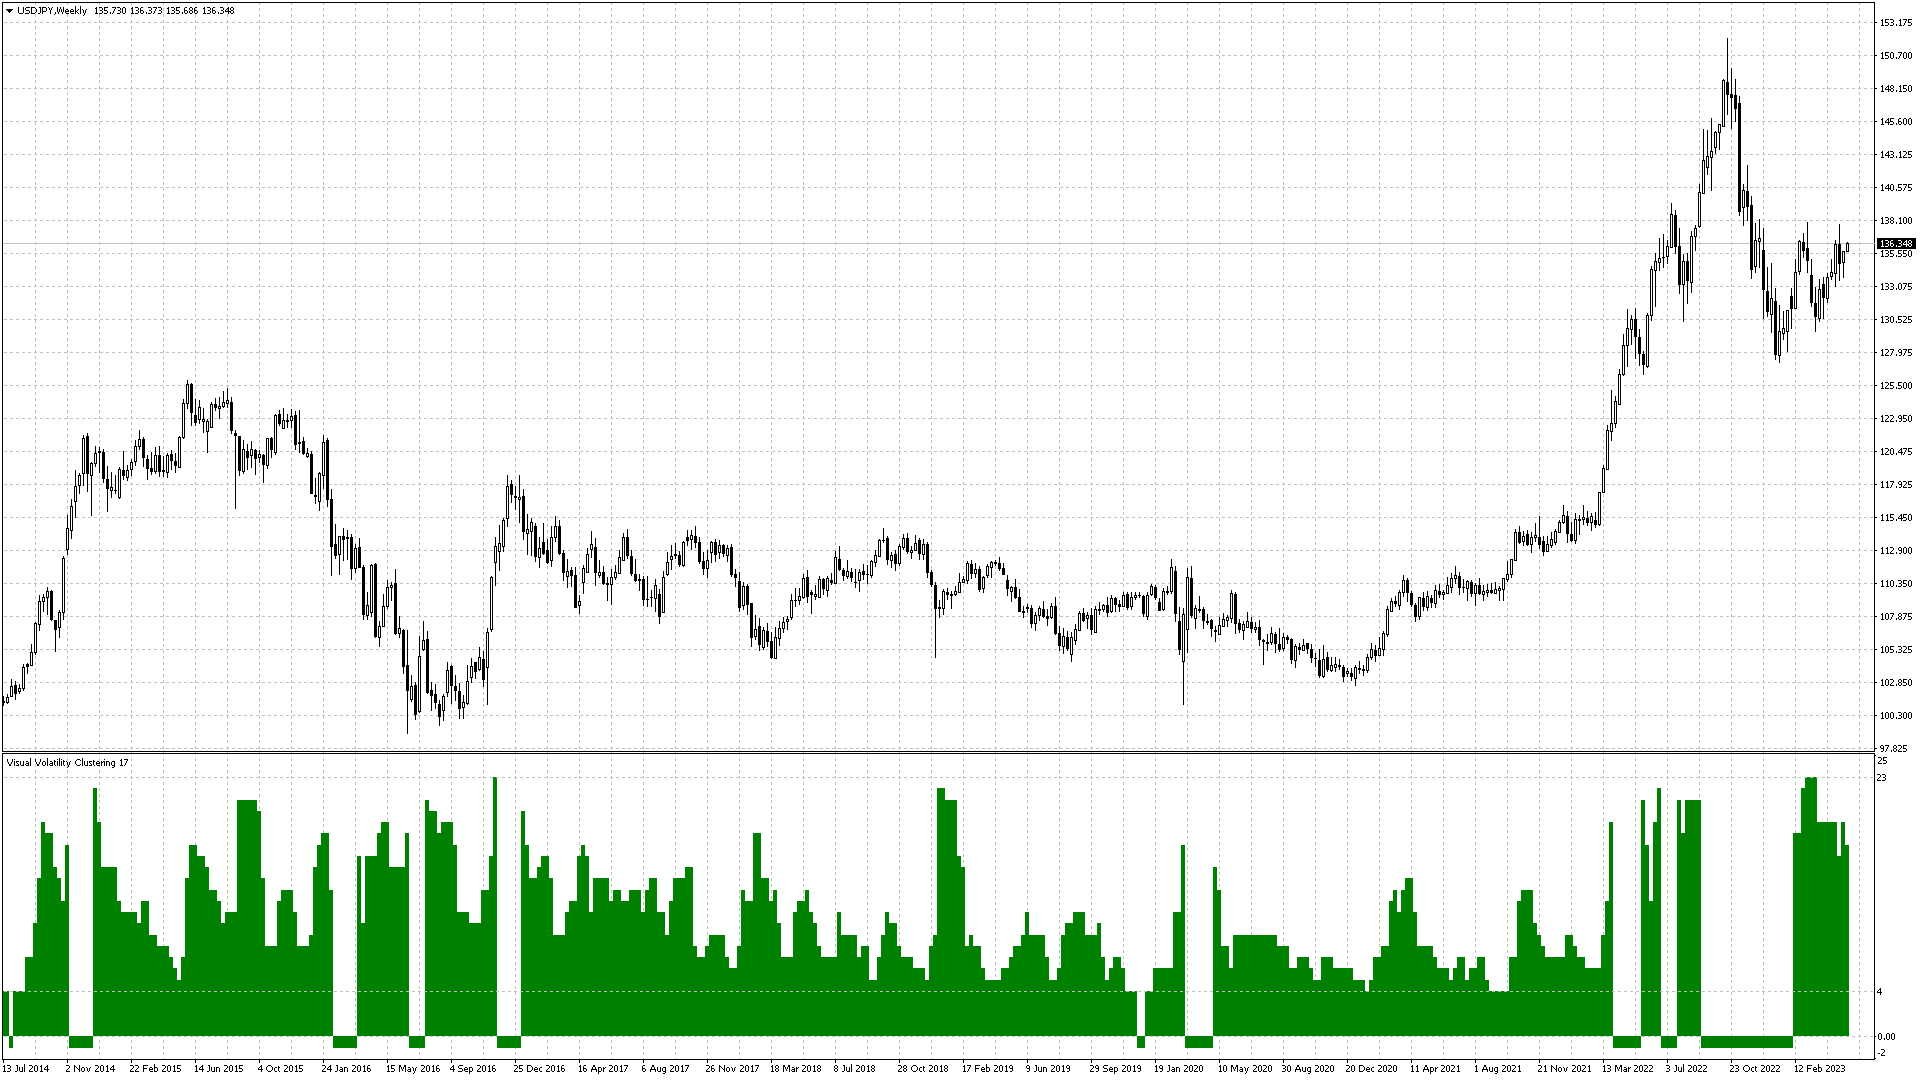
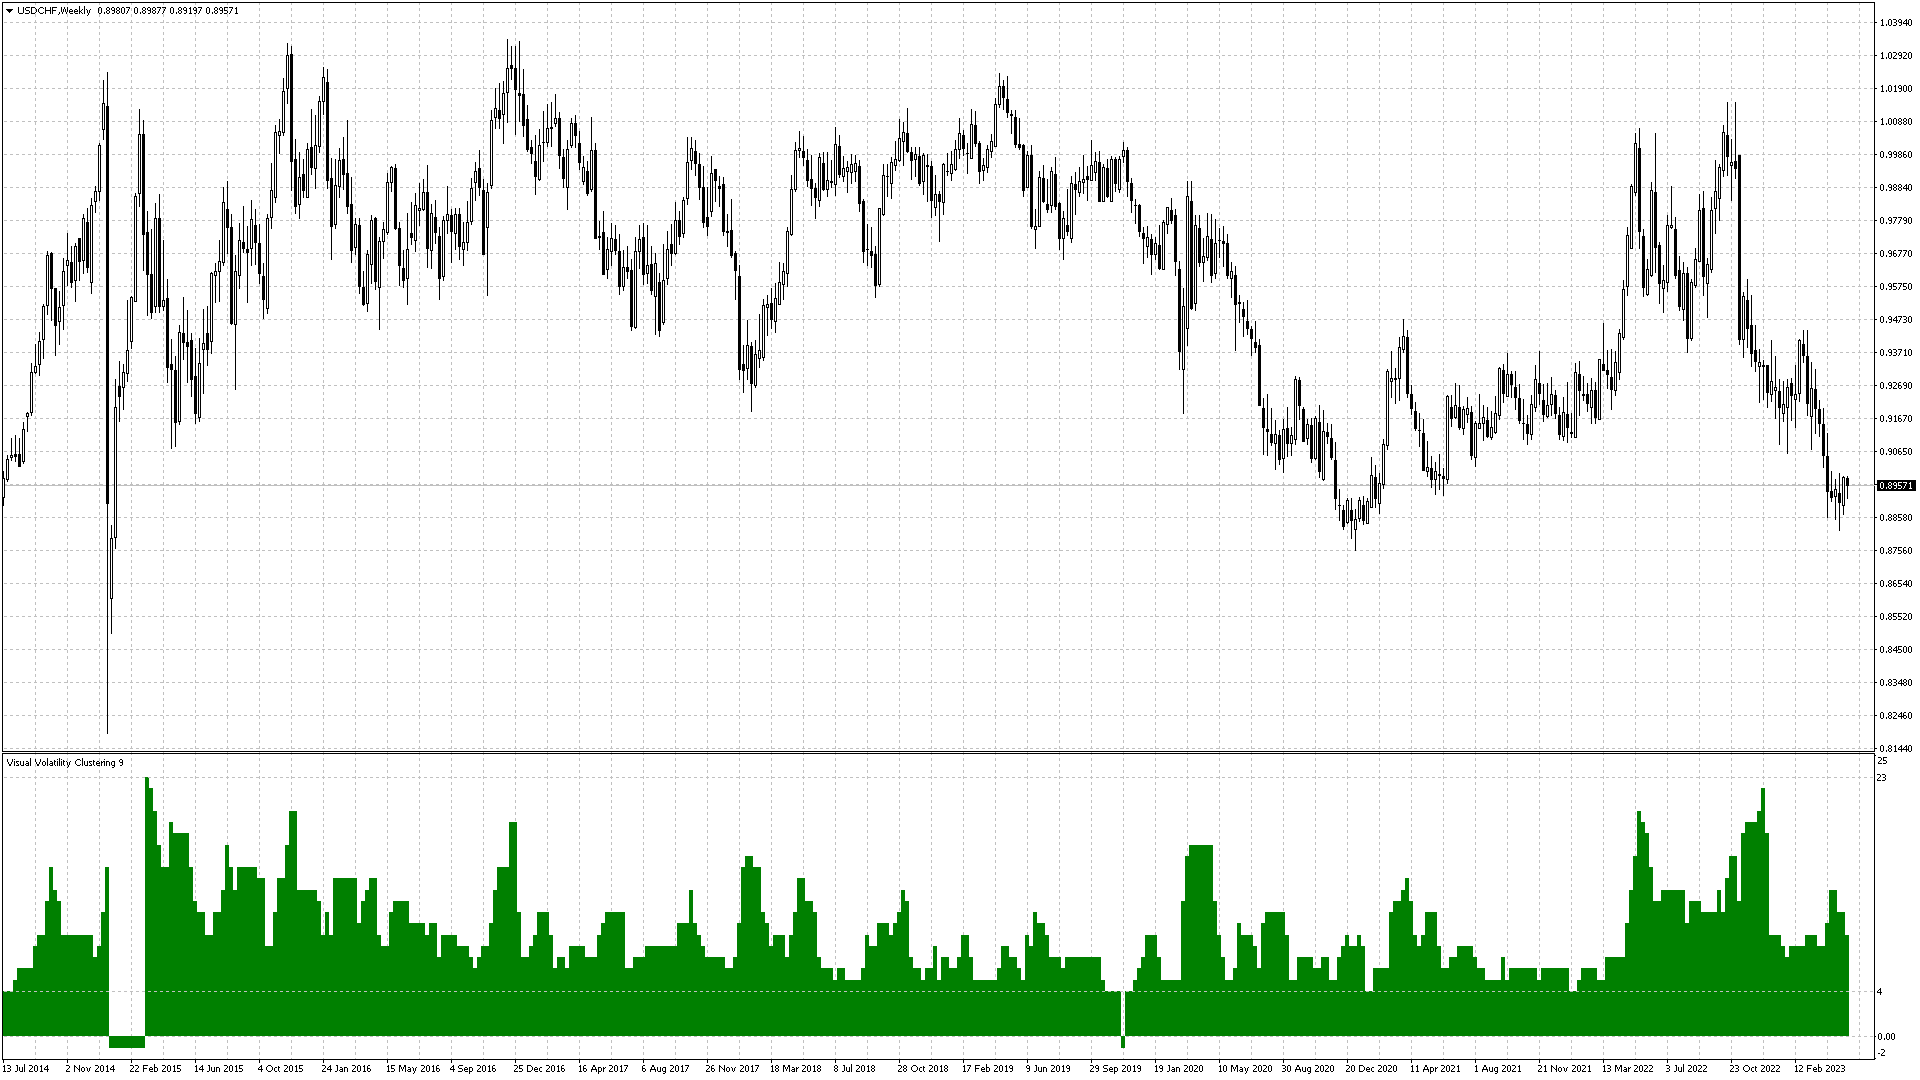
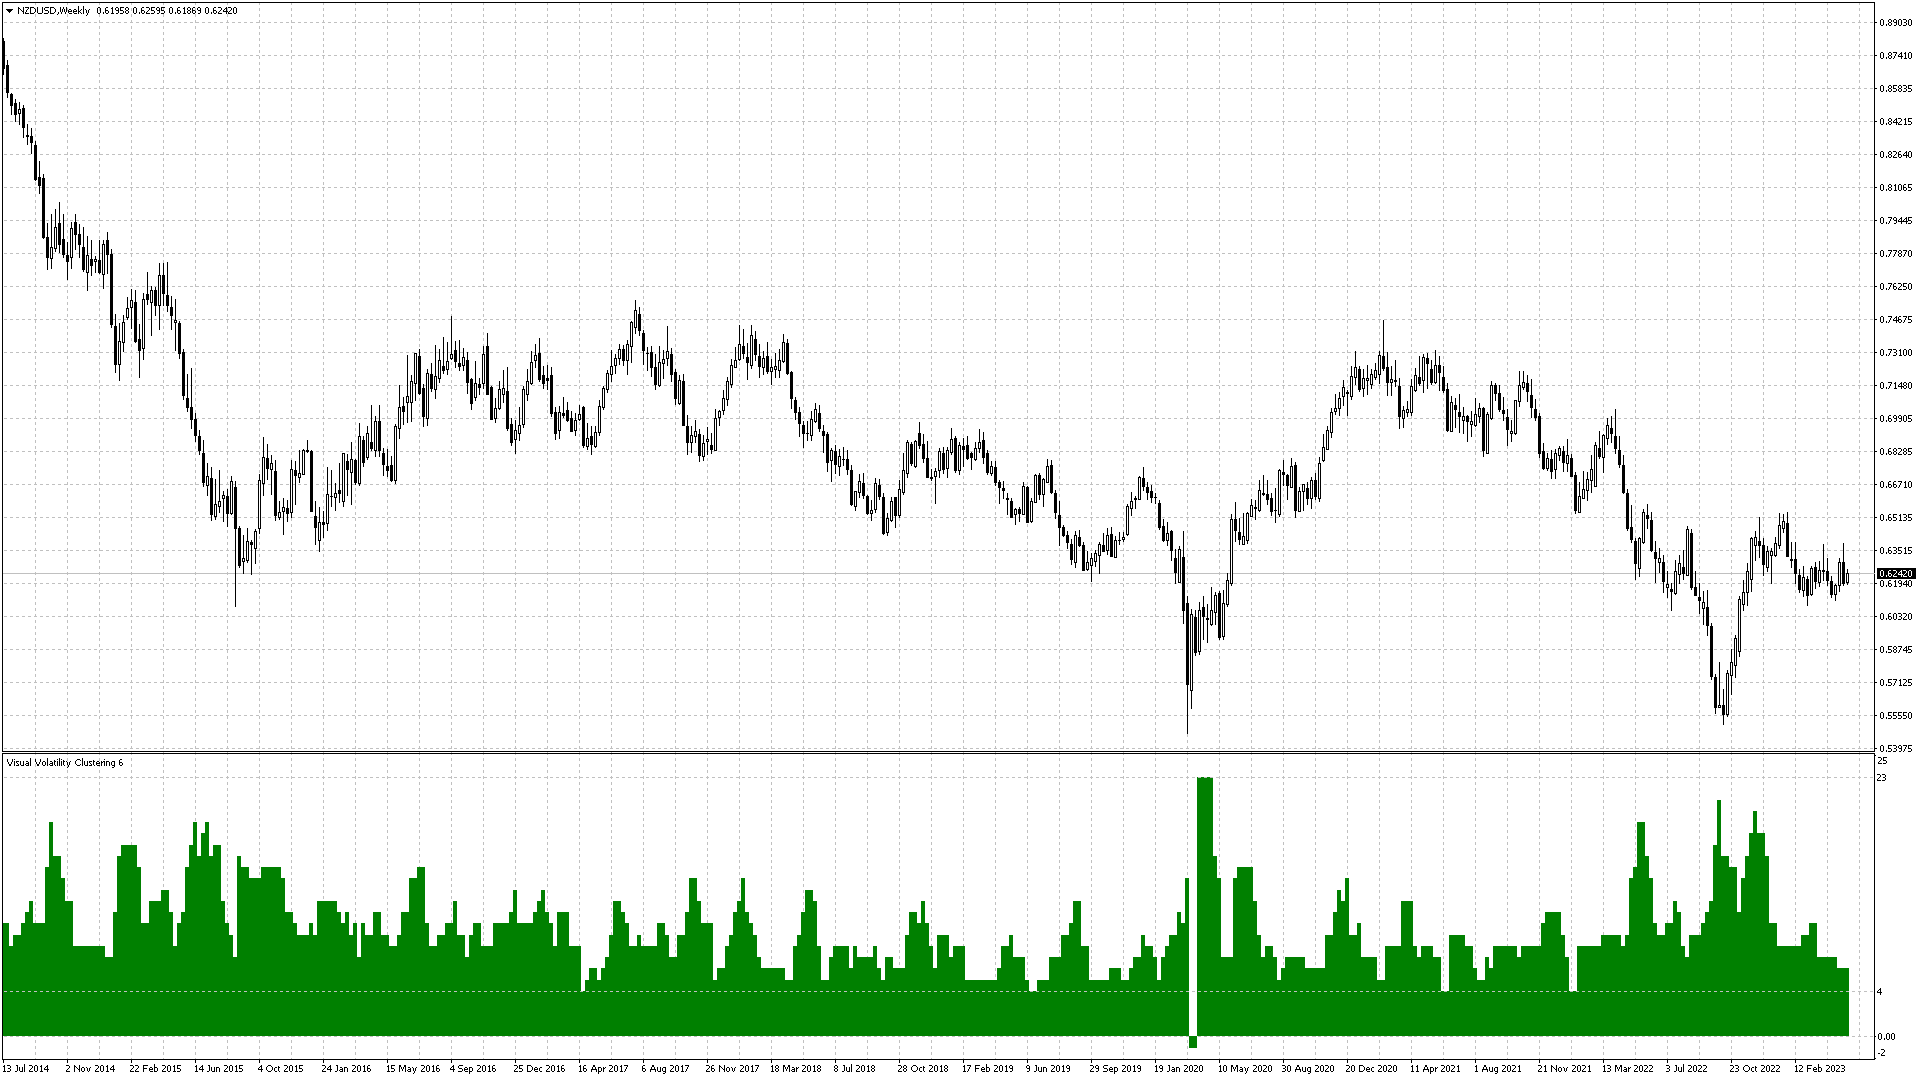
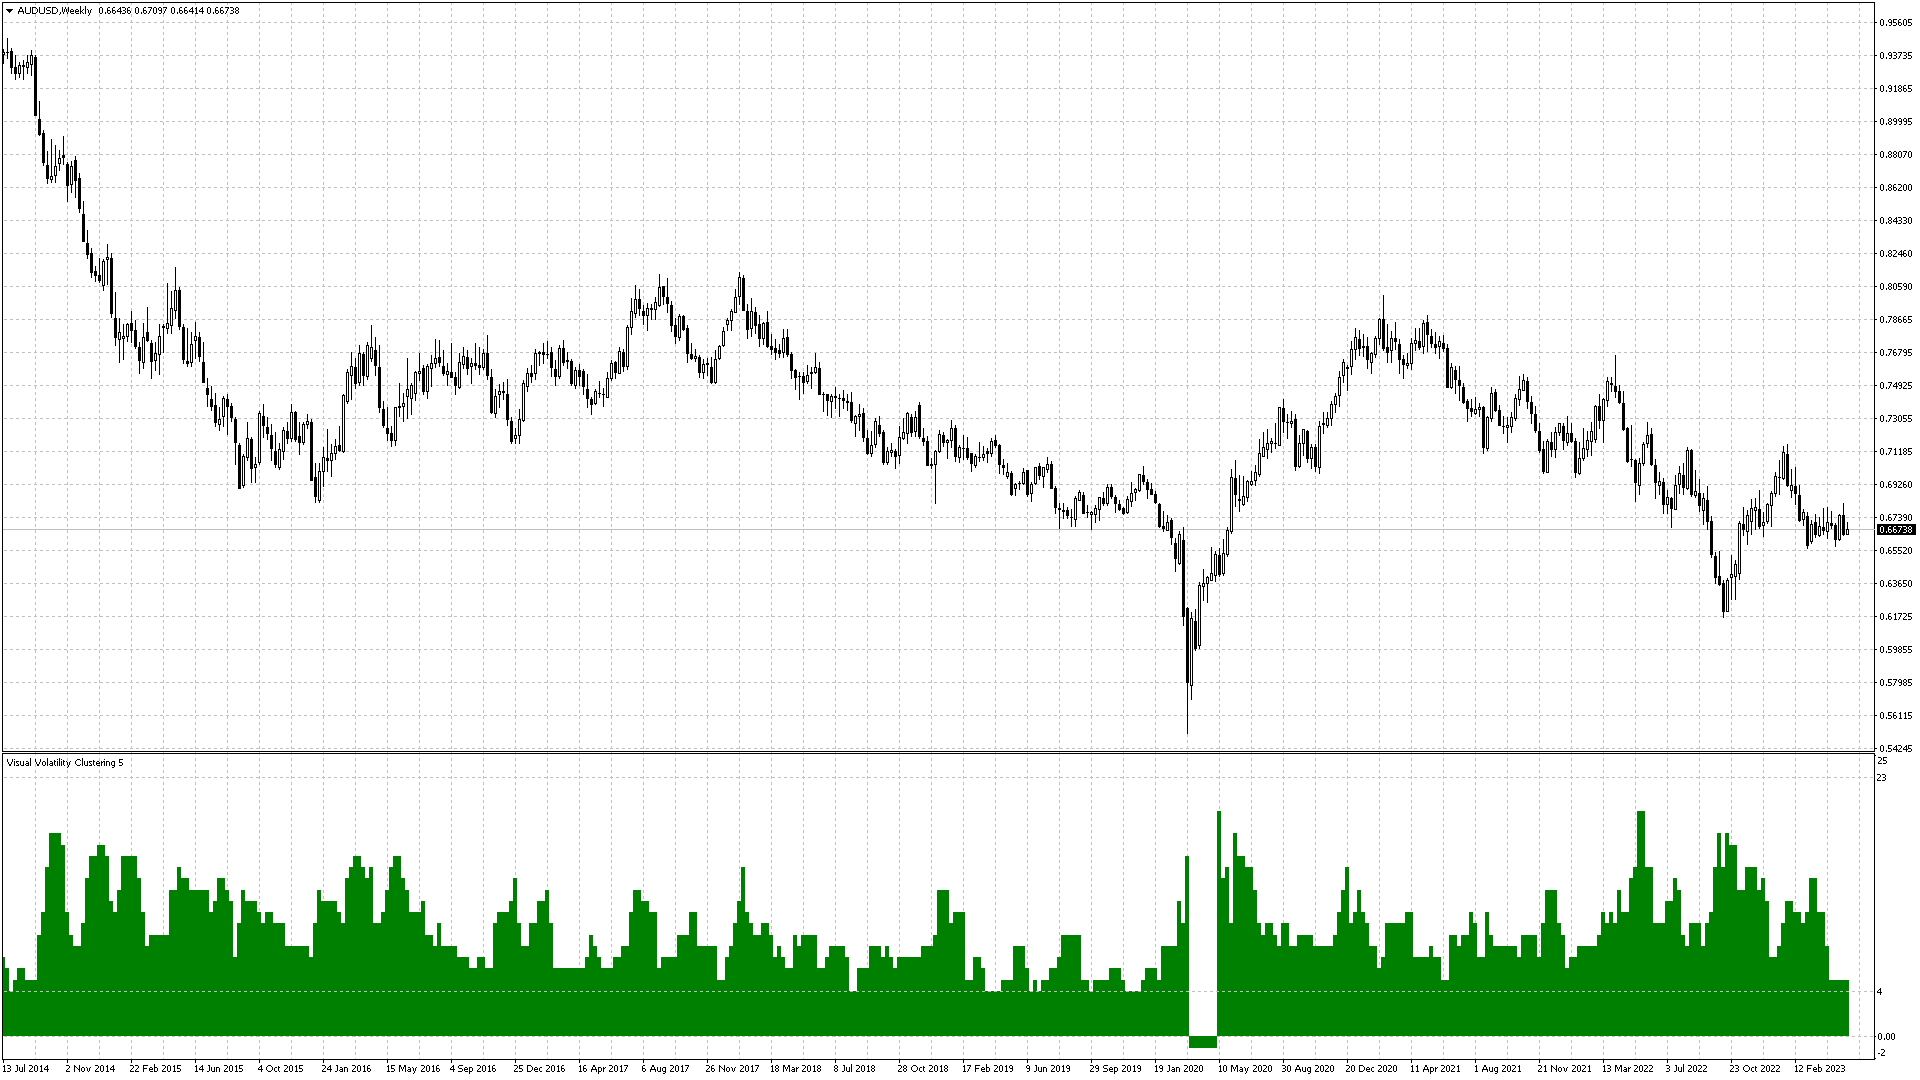
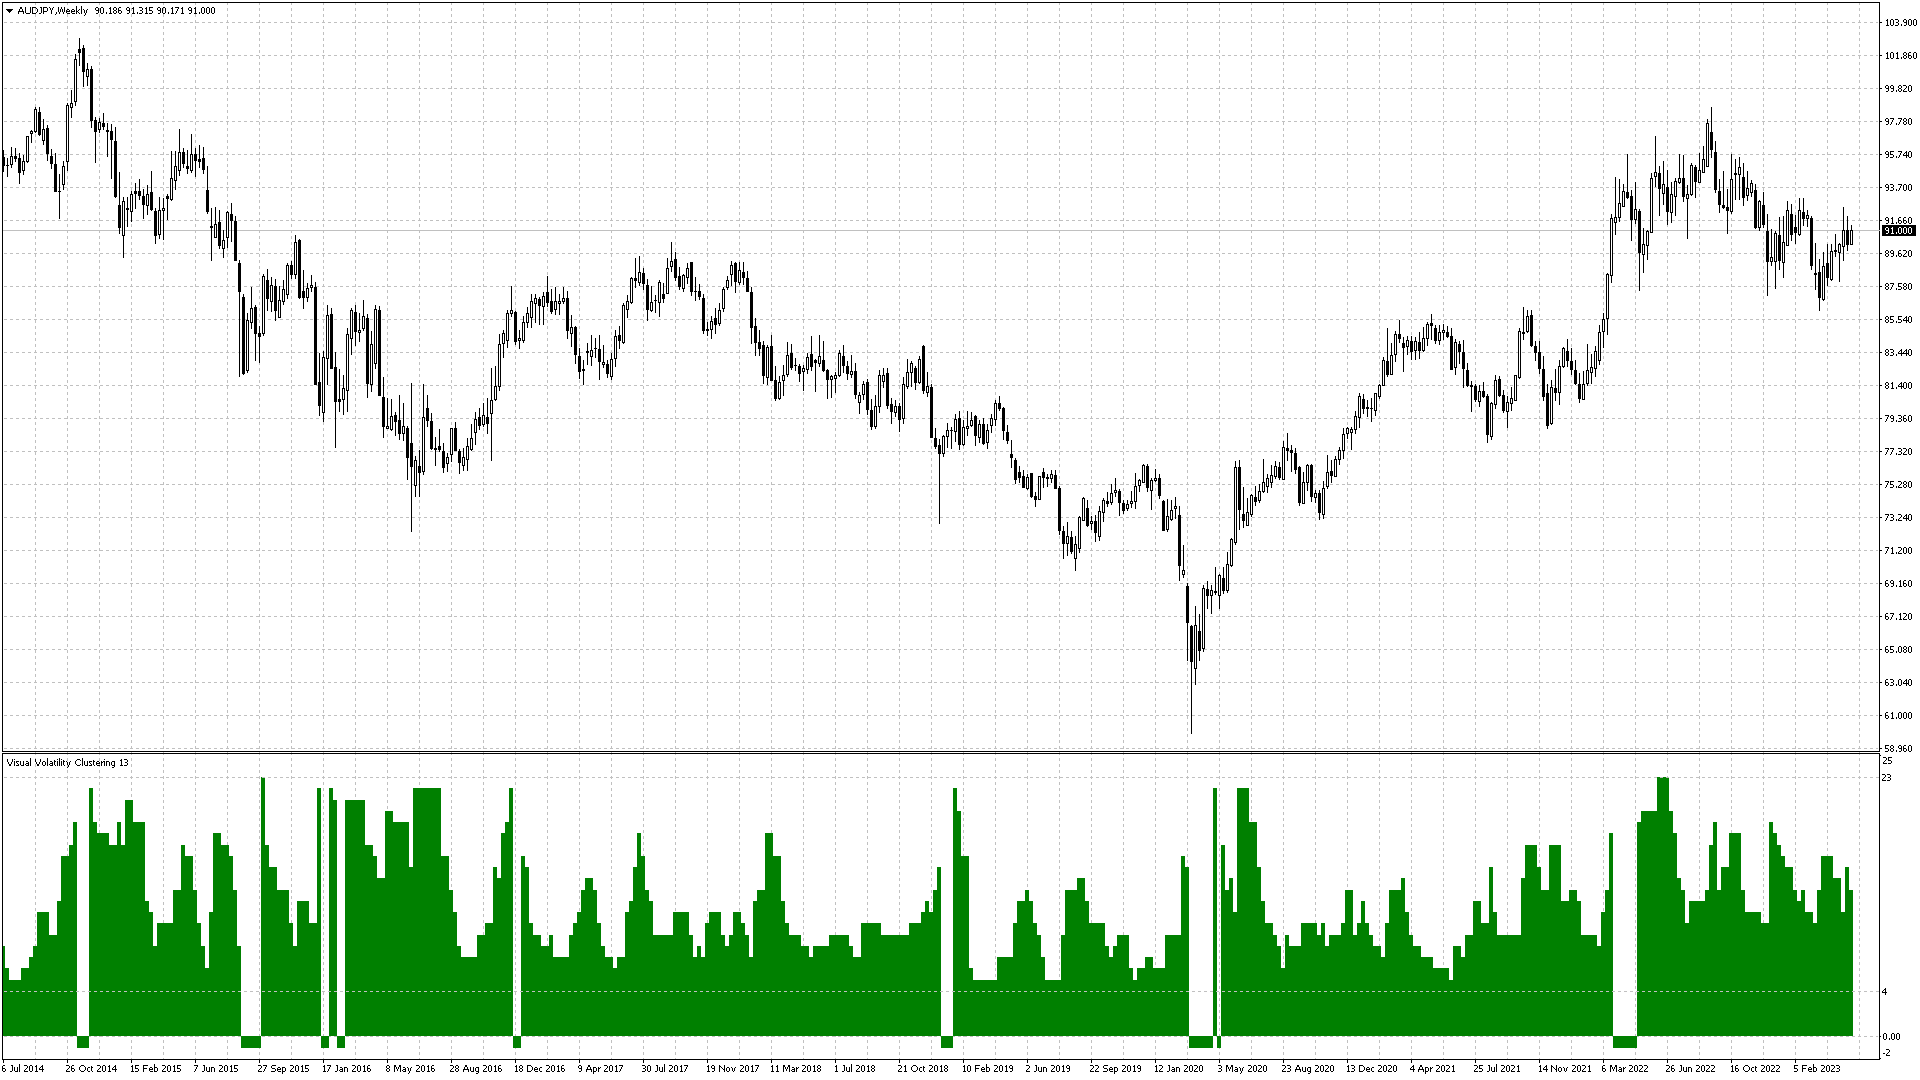
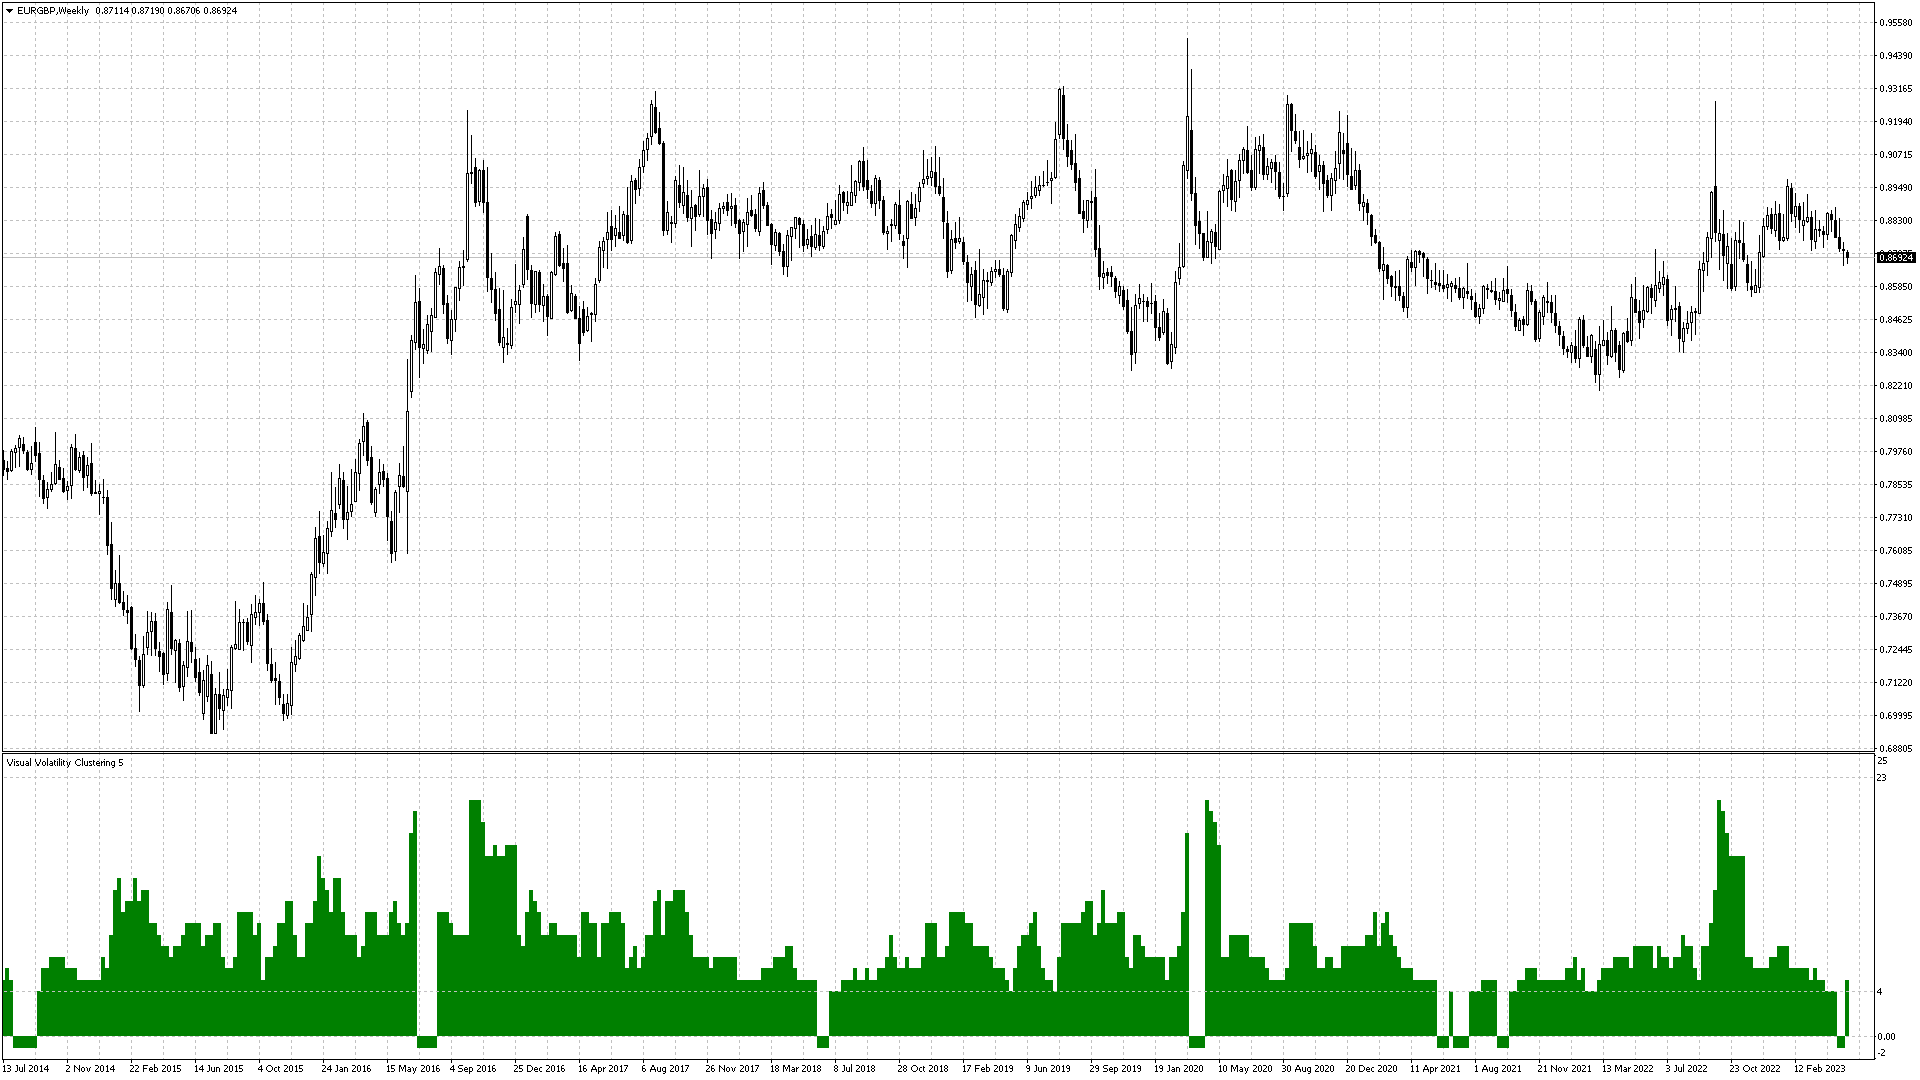
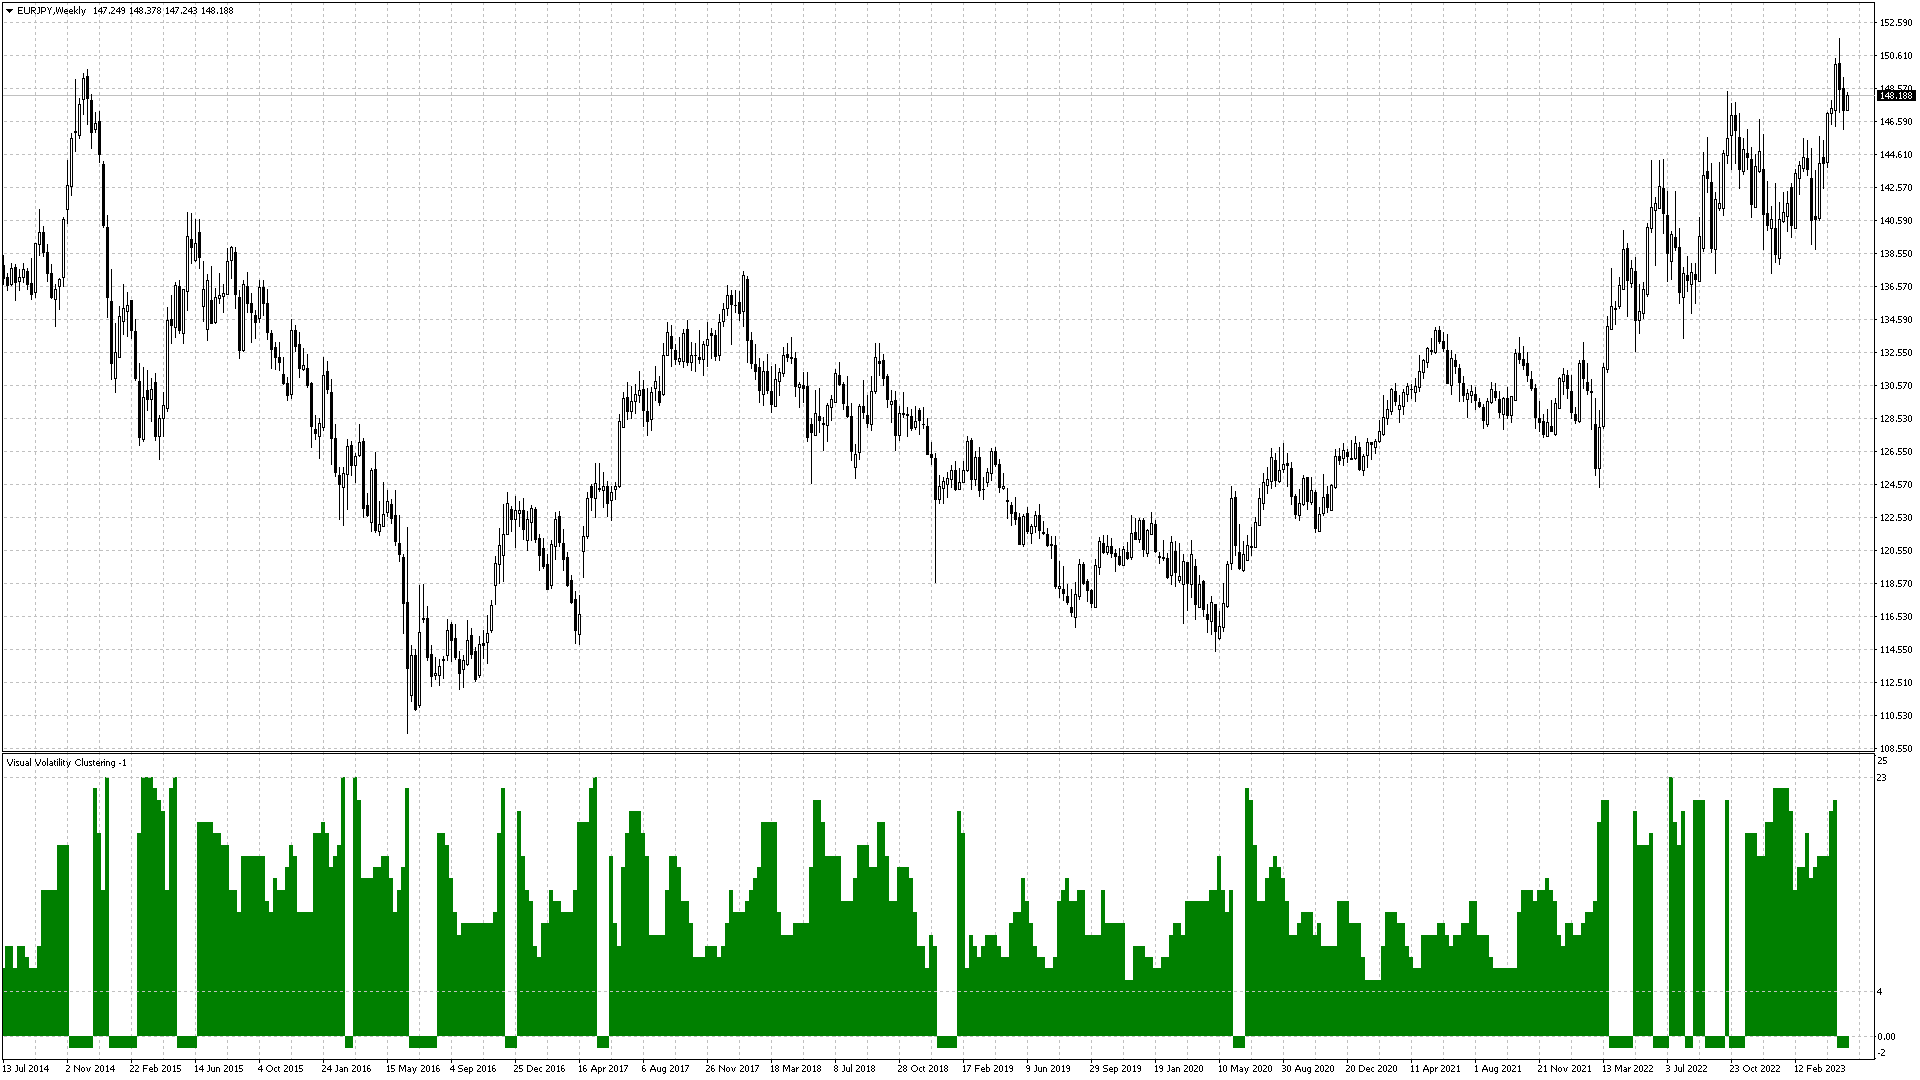
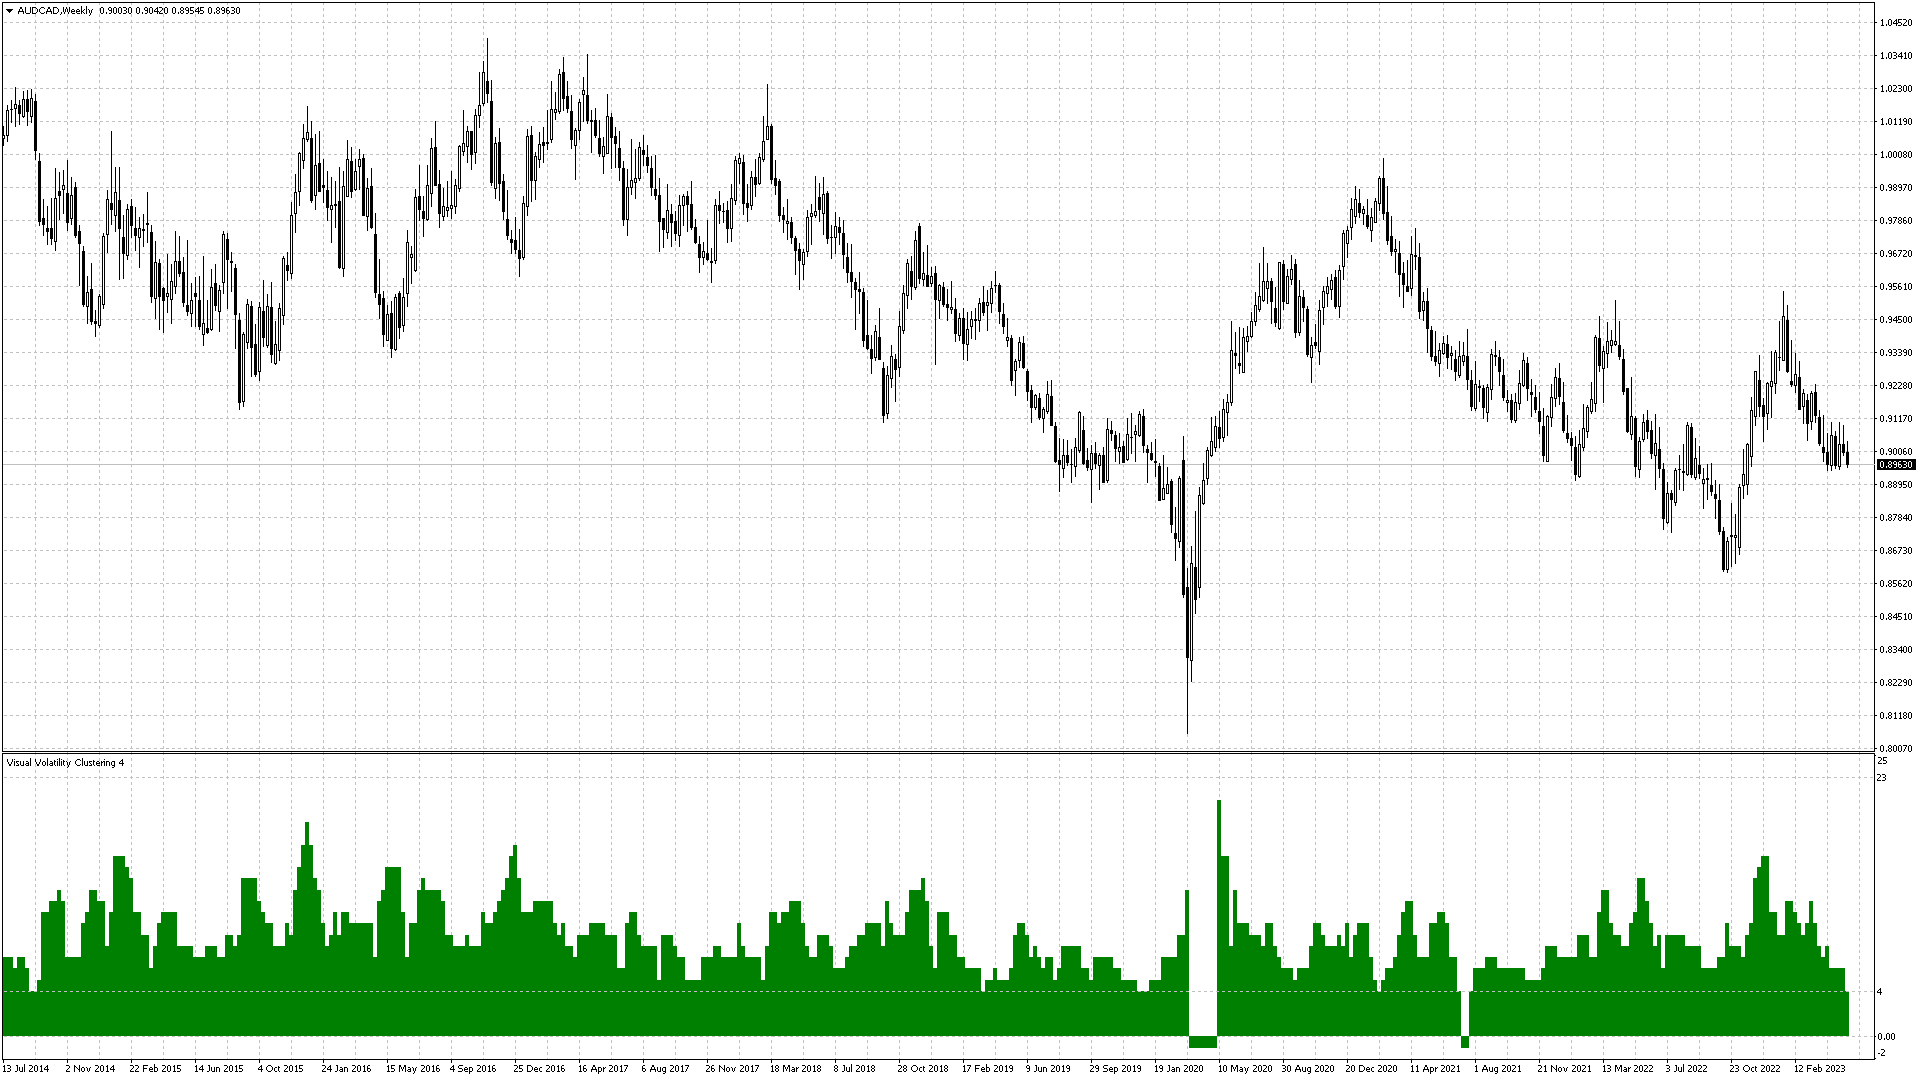
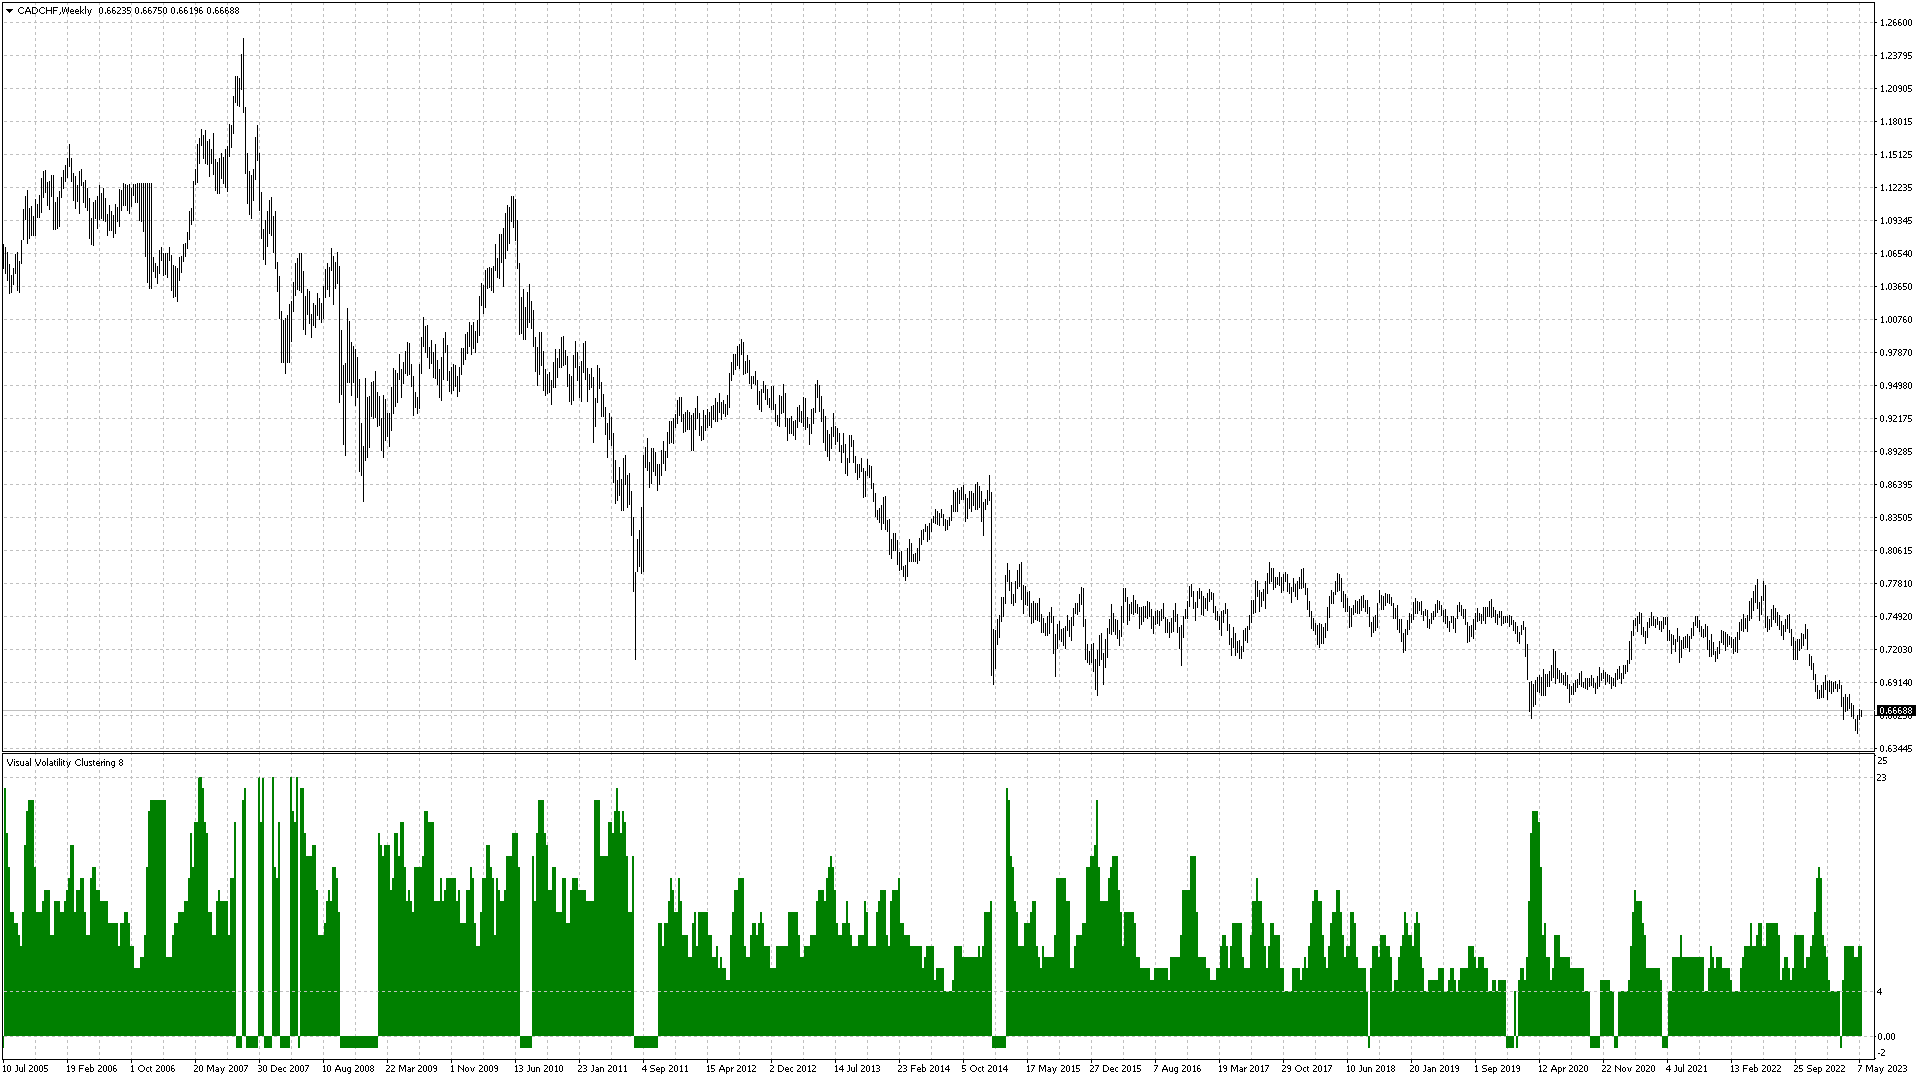
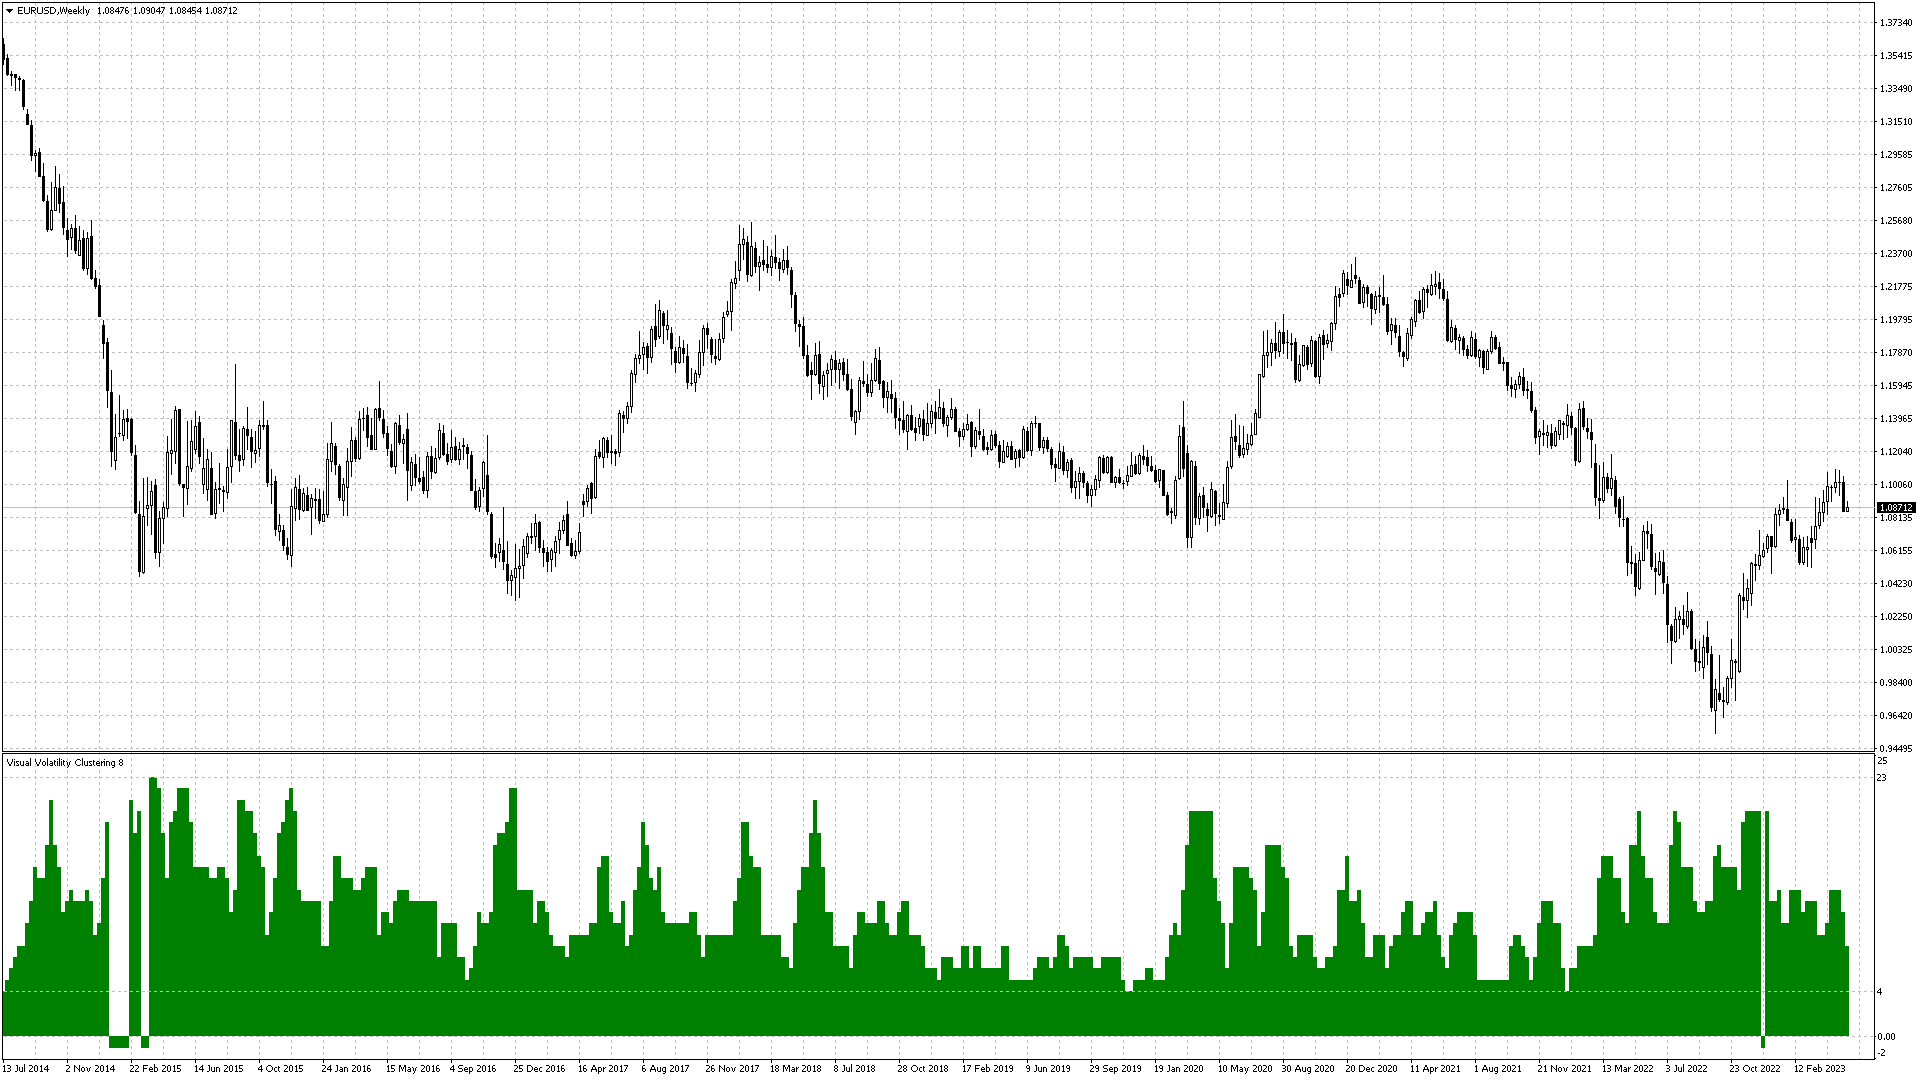
The Visual Volatility Clustering indicator clusters the market based on volatility. The indicator does not redraw and gives accurate data, does not use closing prices. Uses the opening prices or the highs or lows of the previous completed bar. Therefore, all information will be clear and unambiguous. The essence of the indicator is to divide the price market into certain areas according to a similar type of volatility. This can be done in any way. In this example, the indicator is configured for the time period W1 and 24 clusters.
  • What does it mean? This means that the entire history is divided into 24 similar volatility types.
  • How can it be used? For example, in order to create a bot that will change its settings depending on the cluster, or in manual trading - when changing the cluster, view the bot settings.
Thus, the bot can only learn from its own cluster, and not from the linear history preceding the current period. Such training of the bot has a more potentially correct character, since its settings will be adapted to work on certain historical sections with a similar type of volatility.

For clustering, it is reasonable to use large periods, such as W1, so that you do not change the settings of manual or automated trading very often. Also, 24 clusters are potential 24 areas for work or just 24 different strategies for one currency pair.

Pay attention to the chart, you can see price dips! This can be used as a high filter and not enter the market at that time. These dips are detected even before they appear! That is, in advance.

For those who are interested in the indicator, there is a version for MT4 and MT5.

Options.
  • TimeLimitOn - Enable clustering on a limited piece of history.
  • TimeStart - The beginning of the story.
  • TimeFinal - End of story.
  • RedundantOn - Take into account the existence of redundant bars that occur on Sunday with some brokers. To ensure that the indicator displays are the same for different brokers.
  • Normalize - Cluster normalization, rounding to 0 decimal places in cluster calculation. For ease of understanding.
  • ClusteringCount - How many clusters to split the market into.
  • WindowLength - Number of bars back in history to calculate volatility.
  • Overlapping - Cluster overload. That is, the percentage possibility when one cluster overlaps another. This is visible only in the text report, but not on the graph.
  • MinBorder - The minimum volatility window considering the algorithm.
  • MaxBorder - The maximum volatility window considering the algorithm.
  • MinClustering - The minimum clustering filter considering the algorithm.
  • MaxClustering - The maximum clustering filter considering the algorithm.
  • PrintOn - Print results in the message section.

Önerilen ürünler
The   Visual Volatility Clustering   indicator clusters the market based on volatility. The indicator does not redraw and gives accurate data, does not use closing prices. Uses the opening prices or the highs or lows of the previous completed bar. Therefore, all information will be clear and unambiguous. The essence of the indicator is to divide the price market into certain areas according to a similar type of volatility. This can be done in any way. In this example, the indicator is configure
Frato Vwap Bands
Francisco Felipe Alves Da Silva Rocha
Frato VWAP Bantları — Hacim Ağırlıklı Ortalama Fiyat ve Standart Sapma Frato VWAP Bantları, geleneksel VWAP'ı dinamik volatilite bantlarıyla birleştiren bir göstergedir. Hacim ağırlıklı ortalama fiyatın çok dönemli bir görünümünü sunar. Ana İşlevler: Gösterge, VWAP'ı (Hacim Ağırlıklı Ortalama Fiyat) hesaplar ve standart sapmaya bağlı olarak 3'e kadar üst ve alt bant çizer. Hesaplama, seçilen her yeni dönemin (Saatlik, H4, Günlük, Haftalık, Aylık) başında sıfırlanır ve gün içi ve uzun vadeli
FREE
KT Volume Profile MT5
KEENBASE SOFTWARE SOLUTIONS
Volume profile indicator that tells you which levels price is likely to reach today. Daily profiles with POC, VAH and VAL, naked POCs and a drag box for any range, and every level labelled with how often price reached a level at that distance on your own chart. What you see on the chart A profile for every day on M1 to H1 charts, with the value area in a stronger colour. Yesterday's POC, VAH and VAL across today, each with its odds for today, or "reached" once price gets there. Naked POCs: earli
Adaptive Volume Profile son çubukların Hacim Profilini doğrudan grafiğin üzerine çizer: Kontrol Noktası (POC), Değer Alanı (VAH / VAL), yüksek hacimli düğümler (HVN), düşük hacimli düğümler (LVN) ve isteğe bağlı hacim histogramı. Fiyat satırlarının boyutu mevcut volatiliteye (ATR) uyum sağlar, böylece profil her sembolde ve zaman diliminde okunabilir kalır. Özellikler POC - penceredeki en yüksek işlem hacmine sahip fiyat seviyesi Value Area (VAH / VAL) - hacmin seçilen payını içeren fiyat aralığ
FREE
IBI Vwap
Brahim Eljaziri
IBI Vwap draws the Volume-Weighted Average Price calculated on the real volume of the exchange , with ±1 and ±2 standard-deviation bands. What you see VWAP : the average price paid by all participants since the session start, weighted by real traded volume. Institutions use it as a benchmark: above it buyers are in control, below it sellers are. ±1 and ±2 standard-deviation bands : how far price stretches from its average. The ±2 band marks an extension zone. Short labels on the right: VWAP (wit
FREE
The indicator highlights the points that a professional trader sees in ordinary indicators. VisualVol visually displays different volatility indicators on a single scale and a common align. Highlights the excess of volume indicators in color. At the same time, Tick and Real Volume, Actual range, ATR, candle size and return (open-close difference) can be displayed. Thanks to VisualVol, you will see the market periods and the right time for different trading operations. This version is intended f
FREE
VWAP Daily
Anton Polkovnikov
Weighted average price indicator or VWAP. The well-known standard VWAP with the beginning of the day is added with the function of selecting the periodization. It can be calculated both every day and on other periods. Also the indicator allows to exclude the volume from the calculation, which will allow using it on the cryptocurrencies and forex. There is an alert for a VWAP price crossing. There are 1 and 2 standard deviation. Settings: Volume: turning volume on and off in the calculation mecha
Each VolumeProfile holds: The price range for a given period Buy/sell volume for each price level Calculated POC, VAH, VAL, Delta, and Imbalance Indicator Logic Summary Divide data by timeframe (e.g., one H1 profile per hour). Aggregate volumes for each price level. Separate buy and sell volumes using tick or trade direction. Compute Delta (Buy − Sell) and Imbalance (dominance ≥70%). Detect POC, VAH, VAL to outline the Value Area. Draw graphical profiles beside price candles using color-co
MTF VWAP Indicator - Quick Overview   This indicator shows you where institutional money is flowing across multiple timeframes using Volume Weighted Average Price (VWAP) to identify high-probability trading zones. New version has VWAP bands plotting capability if user enabled and display panel (whose background changes colour on confluence) can be toggled on/off.      What It Actually Does:     1. Tracks Smart Money Levels: - Shows Daily, Weekly, and Monthly VWAP lines where big players (banks,
Heiken Ashi Stacked Pro is a chart overlay indicator that combines smooth Heiken Ashi visual trend candles, a real-time bar completion timer, and an on-hover crosshair HUD for instant price and wick-to-body ratio diagnostics. Marketplace Description Overview Heiken Ashi Stacked Pro upgrades standard Heiken Ashi candle visuals with an interactive HUD. Designed for trend followers and price action traders, it filters out market noise using colored candles while supplying precise candle metric read
Big Us100 Us30
Cristiano Rodrigo Olegini
BigMoney Forex — Forex İçin Tam Otomatik Expert Advisor BigMoney Forex , TraderEA tarafından geliştirilen %100 otomatik bir Expert Advisor'dır (EA). Piyasa analizinden işlem açılışına, pozisyon yönetiminden otomatik kapanışa kadar tüm işlem sürecini manuel müdahale gerektirmeden yönetir. Duygusal kararları ortadan kaldırarak disiplinli ve tutarlı bir işlem deneyimi sunmak için tasarlanmıştır. Ayrıca grafik üzerinde kapsamlı bir kontrol paneli ile gelişmiş risk yönetimi ve sermaye koruma özellikl
Master Edition, piyasa yapısını hacim ve para akışı merceğinden görselleştirmek için tasarlanmış profesyonel kalitede bir analiz aracıdır. Standart hacim göstergelerinin aksine, bu araç doğrudan grafiğinizde bir Günlük Hacim Profili görüntüleyerek, fiyat keşfinin tam olarak nerede gerçekleştiğini ve "akıllı paranın" nerede konumlandığını görmenizi sağlar. Bu Master Edition, netlik ve hız için tasarlanmıştır ve yüklendiğinde grafik düzeninizi anında güzelleştiren benzersiz bir Otomatik Tema Senkr
TrendSync Risk Calculator
Juliano Guzlinki Pacheco
Stop guessing your lot size. Risk the same amount on every trade. Most traders blow accounts not because of bad entries, but because of inconsistent position sizing: fixed lots with variable stops means every trade risks a different — and unknown — amount of money. TrendSync Risk Calculator solves this in one drag. How it works Attach the indicator. It automatically anchors three draggable lines at the current price: Entry , SL at N×ATR and TP at your chosen R:R . Drag any line — or type a new A
FREE
VP hidden
Emr Aljnaby
4.33 (12)
The indicator works to convert normal volume into levels and determine financial liquidity control points. It is very similar in function to Fixed Volume Profile. But it is considered more accurate and easier to use than the one found on Trading View because it calculates the full trading volumes in each candle and in all the brokers present in MetaTrade, unlike what is found in Trading View, as it only measures the broker’s displayed prices. To follow us on social media platforms: telegram
FREE
The "MR Volume Profile 5" indicator is a charting tool that displays trading volume at different price levels rather than time intervals. A key concept in volume profile is the point of control (POC)—the price level with the highest volume traded during the session or time range. While tools like VWAP or OBV provide volume trends, the "MR Volume Profile 5" indicator offers granular detail about where the most market activity occurs at specific price levels. This makes it a more precise tool for
ZoneCore MT5
Frederic Jacques Collomb
ZONECORE — Volume Profile & Pivot Levels En çok işlem gören fiyat bölgelerini cerrahi hassasiyetle tespit edin. MT4 version ZONECORE nedir? ZONECORE, Hacim Profili (Volume Profile) ile yüksek hacimli Pivot Seviyeleri (Pivot Levels) birleştiren profesyonel düzeyde bir göstergedir. Piyasanın en uzun süre kaldığı ve en fazla hacmin gerçekleştiği fiyat bölgelerini açıkça ortaya koyar. Bu bölgeler fiyat için bir mıknatıs gibi davranır — bunları bilmek, destek, direnç ve yüksek olasılıklı dönüş bölge
Volume Profile Delta B3 PRO — her fiyattaki gerçek alış ve satış agresyonu, canlı ve Strateji Test Cihazında. Hacmin nerede işlem gördüğünü ve her fiyatta agresif tarafın kim olduğunu görün; fikirlerinizi canlıda gördüğünüz aynı gerçek verilerle geçmiş günlerde test edin. GERÇEK AGRESYON İLE BACKTEST Çoğu agresyon ve delta göstergesi Strateji Test Cihazında gerçek hiçbir şey göstermez. MT5 test cihazı, test başlangıç tarihinden önceki tickleri vermez ve B3'te, aracı kurumun 1 dakikalık barları
Deviation Trend Profile Overview Deviation Trend Profile is a MetaTrader 5 chart indicator that combines three visual layers in a single chart window: a moving average with momentum-based coloring, deviation bands calculated from volatility, and a horizontal distribution profile drawn to the right of the current price. The indicator is an analytical tool. It does not open, modify or close trades, and it is not a complete trading system. It is designed to help the user observe trend direction, mo
FREE
Boom Crash SMC
Israr Hussain Shah
Here   our more valuable tools SMC Trend Trading   ,  Easy SMC Trading  ,  Institutional SMC Architect Volume Analysis Tools  ,  Volume flow Profile  ,  Market volume profile  , FVG with Volume  , Liquidity Heatmap Profile  ,  Volume Spread Analysis Deriv boom and crash index spike killer system you can use it only on m5 timeframe  follow the structure and get signal with alert on phone open trade set sl tp and enjoy easy analysis and trading made simple 
Volume Anchor Levels: support & resistance anchored to traded volume Most support and resistance tools draw a line at the exact high or low of a swing. But price rarely turns at the exact tip of a wick. It turns where the market actually traded. Volume Anchor Levels builds a rolling volume profile and pulls each swing toward the strongest nearby volume node, so you get levels that sit where trading really happened. Each level gets a 0-100 score , so you can see right away which levels are worth
Here   our more valuable tools SMC Trend Trading   ,  Easy SMC Trading  ,  Institutional SMC Architect Volume Analysis Tools  ,  Volume flow Profile  ,  Market volume profile  , FVG with Volume  , Liquidity Heatmap Profile  ,  Volume Spread Analysis Boom: Take SELL signals only (price spikes up then crashes) Crash: Take BUY signals only (price drops then spikes up) SL goes beyond the line as labeled Interactive Market Watch Panel : A left-side sidebar showing real-time strength indicators (po
VWAP Level MT5
Francesco Lenza
4.5 (2)
The VWAP Level indicator is a technical analysis tool that calculates the weighted average price for the traded volumes of a specific asset. The VWAP provides traders and investors with the average price of an asset over a specific time frame. It is commonly used by investors to compare data on "passive" trading operations, such as pension funds and mutual funds, but also by traders who want to check if an asset has been bought or sold at a good market price. To calculate the VWAP level we us
FREE
Most Elliott Wave tools just draw lines. This one validates every pattern against the 3 cardinal rules — or rejects it. Elliott Wave analysis is one of the most powerful — and most difficult — methods in technical trading. Most indicators fake it. They draw zigzag lines and call them waves without checking a single Elliott Wave rule. Elliott Wave Detector Pro is different. It was built from the ground up to detect, validate, and project Elliott Wave patterns the way a professional analyst would
PropGuardian Risk Manager is a utility that watches your account in real time and enforces the hard risk rules that disqualify traders from prop-firm challenges and funded accounts. It does not open trades of its own. It sits on one chart and guards the entire account, whatever you or your other Expert Advisors are doing. One bad day, one oversized lot, or one forgotten position is enough to fail an objective. PropGuardian acts the instant a limit is reached: it closes every position, deletes p
Delta Profile Volume
Teresinha Moraes Correia
Technical Description of the Indicator – Delta Profile for MetaTrader 5 The Delta Profile is an indicator developed for MetaTrader 5 focused on detailed analysis of volume flow within a defined range of candles. It organizes and displays information about the imbalance of positive volumes (associated with upward movements) and negative volumes (associated with downward movements) at different price levels. The result is a clear view of the chart points where the highest concentration of trades o
VOLUME PROFILE SAF-XII MT5 için Profesyonel Market Profile Analizi (Grid tarzı yatırımcılar için rüya indikatör) VOLUME PROFILE (HACİM PROFİLİ) NEDİR? Volume Profile, hacmi zamana göre gösteren geleneksel hacim indikatörlerinin aksine, belirli fiyat seviyelerindeki işlem faaliyetlerini görüntüleyen profesyonel bir kurumsal araçtır. Seçtiğiniz pencere içinde işlemlerin NEREDE gerçekleştiğini ortaya çıkararak şunları belirlemenize yardımcı olur: ADİL DEĞER ALANLARI (VAH/VAL) – İşlemlerin çoğunun
Elevate Your Trading with Advanced Anchored Volume Weighted Average Price Technology Unlock the true power of price action with our premium Anchored VWAP Indicator for MetaTrader 5 - the essential tool for precision entries, strategic exits, and high-probability trend continuation setups. Write me a DM for a 7 day free trial.  Anchored VWAP Plus gives traders unprecedented control by allowing custom anchor points for Volume Weighted Average Price calculations on any chart. With support for 4 sim
FREE
Unlock the Precision of Market Movements with OrderBlock Precision Trader Welcome to the future of trading, where precision meets profitability. OrderBlock Precision Trader is not just an expert advisor; it's your personal trading ally designed to elevate your strategies and optimize your results. Packed with advanced features and a comprehensive trading approach, this EA opens the door to a new era of trading excellence. Are you ready to elevate your trading game and gain an edge in the finan
Anchored VWAP with Alert MT5
Trade The Volume Waves Single Member P.C.
5 (1)
What is the Volume Weighted Average Price (VWAP)? The volume weighted average price (VWAP) is a trading benchmark used by traders that gives the average price an instrument has traded at throughout the day, based on both volume and price.  It is important because it provides traders with insight into both the trend and value of the instrument. What is the Difference between VWAP and AVWAP? While VWAP is having as starting point the beggining of the day,week,month etc. in the AVWAP you can pla
Bu ürünün alıcıları ayrıca şunları da satın alıyor
Entry Points Pro, emri vermeden önce nereden gireceğinizi, stopu nereye koyacağınızı ve hangi lotla işlem yapacağınızı gösterir. FİYAT Şu anda 199 USD: bu fiyattan 10 kopya, sonra 249 USD. Nihai fiyat 349 USD. Paramı piyasalarda işlem yaparak kazanıyorum ve bunu gösteriyorum, bu yüzden bu indikatörü herkese satmak zorunda değilim. Bu, kendi kafasıyla düşünen traderlar için bir araç, sihirli bir düğme değil. Ok mum kapanışında belirir ve repaint olmaz. İki ayar: depozitonuz ve işlem başına riski
Ultra Indicator
Ihor Otkydach
5 (1)
ULTRA, “hepsi bir arada” prensibiyle çalışan bir teknik göstergedir; piyasayı bağımsız olarak analiz eder, işlem sinyalleri üretir, stop-loss emirlerinin verileceği seviyeleri gösterir ve kârı garantilemek ya da zararı en aza indirmek için işlemlerin ne zaman kapatılması gerektiğini önerir. Başka bir deyişle, piyasayı nasıl analiz edeceğinizi bilmeseniz, seviyeleri (stop-loss'unuzu nereye koyacağınızı) belirleyemeseniz ya da para yönetimi konusunda zorluk yaşasanız da fark etmez. ULTRA tüm bunla
Gann Made Easy , bay teorisini kullanarak ticaretin en iyi ilkelerine dayanan, profesyonel ve kullanımı kolay bir Forex ticaret sistemidir. WD Gann. Gösterge, Zararı Durdur ve Kâr Al Seviyeleri dahil olmak üzere doğru SATIN AL ve SAT sinyalleri sağlar. PUSH bildirimlerini kullanarak hareket halindeyken bile işlem yapabilirsiniz. Satın alma işleminden sonra, alım satım talimatlarını ve harika ek göstergeleri ücretsiz olarak almak için lütfen benimle iletişime geçin! Muhtemelen Gann ticaret yöntem
Boba Analysis Suite
Trade Ready Solutions LLC
5 (2)
Boba Analysis Suite Boba Analysis Suite, MetaTrader 5 için geliştirilmiş bir analiz göstergesidir. Piyasa yapısını, önemli fiyat bölgelerini ve genel piyasa bağlamını tek bir grafik görünümünde bir araya getirir. Trader ve trading eğitmeni olarak edinilen uygulamalı deneyimden yola çıkarak geliştirilmiştir. Piyasanın yönünü değerlendirme, önemli seviyeleri belirleme ve birden fazla zaman dilimini birlikte inceleme gibi adımlardan oluşan sistematik bir analiz sürecini destekler. Piyasa Bağlamını
M1 Sniper MT5
Oleg Rodin
5 (7)
M1 SNIPER   kullanımı kolay bir işlem göstergesi sistemidir. M1 zaman dilimi için tasarlanmış bir ok göstergesidir. Gösterge, M1 zaman diliminde scalping için bağımsız bir sistem olarak kullanılabilir ve mevcut işlem sisteminizin bir parçası olarak kullanılabilir. Bu işlem sistemi özellikle M1'de işlem yapmak için tasarlanmış olsa da, diğer zaman dilimleriyle de kullanılabilir. Başlangıçta bu yöntemi XAUUSD ve BTCUSD ticareti için tasarladım. Ancak bu yöntemi diğer piyasalarda işlem yaparken de
Sqn Max Indicator Sqn Max is an exclusive indicator to trade the market with high effectiveness. The indicator is based on price action, volatility and trend. This indicator is as simple as possible but not too simple. The indicator can generate alerts to ease the trading process. You don't have to stay all day in front of your screen. The indicator can be used with any class of assets and with any time frame. It is possible to achieve better results trading our list of selected assets. We achi
Scalper Vault, gün içi işlemlerde istikrar yakalamak isteyen yatırımcılar için tasarlanmış, güçlü ve tam donanımlı bir alım satım sistemidir. Bu yüksek hassasiyetli gösterge; hem Forex hem de İkili Opsiyon yatırımcıları için kurumsal düzeyde analizler sunan, bağımsız ve eksiksiz bir alım satım sistemi işlevi görür. SATIN ALIM İŞLEMİNDEN SONRA BENİMLE İLETİŞİME GEÇİN; ALIM SATIM İPUÇLARIMI VE HARİKA BİR BONUSU ALIN! Tahmin yürütme zorunluluğunu ve karmaşık manuel analiz süreçlerini ortadan kaldı
Çoklu Para Birimi Güç ve Momentum Göstergesi MT5 Dynamic Forex28 Navigator, uzun süredir popüler olan göstergelerimizin evrimidir ve beşinin gücünü bir arada sunar: Advanced Currency Strength28 Indicator (700 inceleme) Advanced Currency IMPULSE with ALERT (530 inceleme) Currency Strength EXOTICS GOLD Impulse with Alert CS28 Combo Signals (son Bonus) Dört gösterge satın alıp grafiklerinizde üst üste yığmanıza gerek yok. Hepsi tek bir güçlü göstergede birleşiyor: 28 Forex paritesinin gücü, onları
Azimuth Pro
Ottaviano De Cicco
5 (7)
Azimuth Pro V2: Synthetic Fractal Structure and Confirmed Entries for MT5 Overview Azimuth Pro is a multi-level swing structure indicator by Merkava Labs . Four nested swing layers, swing-anchored VWAP, ABC pattern detection, three-timeframe structural filtering, and closed-bar confirmed entries — one chart, one workflow from micro-swings to macro-cycles. This is not a blind signal product. It is a structure-first workflow for traders who care about location, context, and timing. Halloween P
Neuro Poseidon MT5
Daria Rezueva
4.68 (53)
Neuro Poseidon is a new indicator by Daria Rezueva. It combines precise trading signals with adaptive TP/SL levels - creating best possible trades as a result! Message me and get  Neuro Poseidon Assistant  as a gift to automize your trading process! What makes it stand out? 1. Proven profitability on all assets and timeframes 2. Only confirmed BUY and SELL signals present on the chart 3. Adaptive TP & SL levels generated by the software for each trade 4. Easy to understand - suitable for al
Protect against whipsaws: revolutionize your swing trading approach Swing Trading is the first indicator designed to detect swings in the direction of the trend and possible reversal swings. It uses the baseline swing trading approach, widely described in trading literature. The indicator studies several price and time vectors to track the aggregate trend direction and detects situations in which the market is oversold or overbought and ready to correct. [ Installation Guide | Update Guide | Tro
SkyHammer Signal Pro Entry, SL ve TP seviyeleri kilitlenen profesyonel no-repaint trend sinyal indikatörü SkyHammer Signal Pro, net, sabit ve doğrulanabilir sinyaller isteyen yatırımcılar için tasarlanmış yapılandırılmış bir trend ve momentum sinyal indikatörüdür. En iyi M1 ve M5 gibi düşük zaman dilimlerinde çalışır. İndikatör piyasanın tepe veya dip noktalarını tahmin etmeye çalışmaz. Bunun yerine sinyal üretmeden önce onaylanmış piyasa yapısı, trend yönü, momentum gücü, sağlıklı volatilite ve
Advance AI Scanner
Mohamed Samsudeen
5 (1)
Advance AI Scanner is a multi-symbol analysis indicator for MetaTrader 5. It scans Forex pairs, metals, energy, stock indices and cryptocurrencies at the same time and rates each instrument with its own self-training model. It explains in plain English what moved each market and why, and it estimates how far upcoming economic news usually moves each symbol, measured on your broker's own price history. $199 instead of $499. 10 copies left at this price. One time purchase  Installation and User
Apex Patterns PRO İndikatörü Satın Alın - Üzerine Kurulu Expert Advisor'a ÜCRETSİZ Sahip Olun. Kendini Optimize Eden Grafik Formasyonu ve Kırılım Zekası Geleneksel formasyon tarayıcıları sabit girdilere dayanır ve piyasa volatilitesi ile yapıları değiştiğinde genellikle düşük performans gösterir. Apex Patterns PRO, yapısal grafik formasyon tanımayı, momentum filtrelemeyi ve istatistiksel kendi kendini optimizasyonu tek bir analitik çerçevede birleştirerek değişen piyasa koşullarına uyum sağlama
Apollo SR Master , Destek/Direnç bölgelerinde alım satımı daha kolay ve güvenilir hale getiren özelliklere sahip bir Destek/Direnç göstergesidir. Gösterge, yerel fiyat zirvelerini ve diplerini tespit ederek Destek/Direnç bölgelerini herhangi bir gecikme olmadan gerçek zamanlı olarak hesaplar. Ardından, yeni oluşan Destek/Direnç bölgesini doğrulamak için, Destek/Direnç bölgesinin dikkate alınabileceğini ve gerçek bir SAT veya AL sinyali olarak kullanılabileceğini gösteren özel bir sinyal gösterir
Superhero
Ihor Otkydach
5 (3)
SUPERHERO göstergesi, "her şeyi kapsayan" bir temele dayalı olarak tasarlanmış çoklu para birimli bir işlem sistemidir. Gösterge, piyasayı bağımsız olarak analiz eder ve işlemlerin ne zaman açılıp kapatılacağına dair sinyaller verir. Stop Loss ve Take Profit emirlerini kullanır. R:R oranı 1:1'dir. Bu sistem akıllı telefonunuza anlık bildirimler gönderebilir; böylece bir bilgisayara bağlı kalmanıza gerek kalmadan "hareket halindeyken" işlem yapabilirsiniz. Bu, özel ticaret şirketleri için idealdi
Bill Williams Advanced
Siarhei Vashchylka
5 (11)
Bill Williams Advanced is designed for automatic chart analysis using Bill Williams' "Profitunity" system. The indicator analyzes four timeframes at once. Manual (Be sure to read before purchasing) Advantages 1. Analyzes the chart using Bill Williams' "Profitunity" system. Signals are displayed in a table in the corner of the screen and on the price chart. 2. Finds all known AO and AC signals, as well as zone signals. Equipped with a trend filter based on the Alligator. 3. Finds "Divergence Bar
TREND ÇİZGİLERİ PRO     Piyasanın gerçek yön değişimini anlamaya yardımcı olur. Gösterge, gerçek trend dönüşlerini ve büyük oyuncuların piyasaya yeniden girdiği noktaları gösterir. Anlıyorsun     BOS hatları  Daha yüksek zaman dilimlerindeki trend değişiklikleri ve önemli seviyeler, karmaşık ayarlar veya gereksiz gürültü olmadan gösterilir. Sinyaller yeniden çizilmez ve çubuk kapandıktan sonra grafikte kalır. VERSION MT 4     -    RFI LEVELS PRO  göstergesiyle birlikte kullanıldığında maksimum p
Naked Forex Kangaroo Tail Pro Indicator Kangaroo Tail Pro Indicator is a pattern recognition indicator for Forex, Stocks, Indices, Futures, Commodities and Cryptos. The Kangaroo Tail is a multi-bar pattern. The Kangaroo Tail pattern is very effective and is very simple to trade. The strategy that comes with the Kangaroo Tail is based on price action. The indicator does what it was designed for: displaying Kangaroo Tail patterns.     Don't expect to follow the up and down arrows and make mone
FootPrint Chart MT5
Gayathiri Gopalakrishnan
5 (1)
Turn every candle into a bid x ask footprint built from real tick data. See who is actually trading at each price, with delta, volume profile, imbalance zones and a scored setup engine that prints entry, stop and target Order Flow Footprint Chart Pro Most indicators tell you what price did. This one tells you who did it. Order Flow Footprint Chart Pro rebuilds every candle on your chart from raw tick data and shows you the volume that traded at each individual price inside it, split into the am
Volatility Master for MetaTrader is a real-time dashboard tool that scans up to  50 symbols  to identify high-volatility , trending markets instantly. With bullish/bearish signals, customizable alerts, and a user-friendly interface, it helps you avoid range-bound conditions and focus on high-probability trades. Clarity leads to confidence. Trade confidently and protect your capital effectively with this powerful dashboard. We don't offer free or bonus indicators in exchange of reviews from you.
Quantum TrendPulse
Bogdan Ion Puscasu
5 (26)
SuperTrend   ,   RSI   ve   Stochastic'in   gücünü tek bir kapsamlı göstergede birleştirerek işlem potansiyelinizi en üst düzeye çıkaran nihai işlem aracı olan   Quantum TrendPulse'u   tanıtıyoruz. Hassasiyet ve verimlilik arayan yatırımcılar için tasarlanan bu gösterge, piyasa trendlerini, momentum değişimlerini ve en uygun giriş ve çıkış noktalarını güvenle belirlemenize yardımcı olur. Temel Özellikler: SuperTrend Entegrasyonu:   Güncel piyasa trendlerini kolayca takip edin ve karlılık dalgası
Divergence Bomber
Ihor Otkydach
4.89 (94)
Bu göstergeyi satın alan herkese aşağıdaki ekstra içerikler ücretsiz olarak sunulmaktadır: Her işlemi otomatik olarak yöneten, Stop Loss ve Take Profit seviyelerini ayarlayan ve işlemleri strateji kurallarına göre kapatan özel yardımcı araç: "Bomber Utility" Göstergenin farklı varlıklar üzerinde kullanılmasına yönelik ayar dosyaları (set dosyaları) Bomber Utility için 3 farklı modda kullanım sunan ayar dosyaları: "Minimum Risk", "Dengeli Risk" ve "Bekle-Gör Stratejisi" Bu ticaret stratejisini
FX Sniper Orange Indicator FX Sniper Orange is an exclusive indicator to spot situations where market has gone too far and market could reverse soon after. The indicator displays arrows in your chart indicating probable future price action (see screenshot attached). FX Sniper Orange never repaints. Once candle is closed signal is confirmed and arrow will never disappear. Users of the indicator can setup alerts when new arrows are displayed in the chart. Inputs of the indicator are: Distanc
Currency Strength Wizard , başarılı ticaret için size hepsi bir arada çözüm sağlayan çok güçlü bir göstergedir. Gösterge, birden çok zaman dilimindeki tüm para birimlerinin verilerini kullanarak şu veya bu forex çiftinin gücünü hesaplar. Bu veriler, şu veya bu para biriminin gücünü görmek için kullanabileceğiniz, kullanımı kolay para birimi endeksi ve para birimi güç hatları biçiminde temsil edilir. İhtiyacınız olan tek şey, işlem yapmak istediğiniz tabloya göstergeyi eklemektir ve gösterge size
ARIPoint
Temirlan Kdyrkhan
1 (4)
ARIPoint is a powerful trading companion designed to generate high-probability entry signals with dynamic TP/SL/DP levels based on volatility. Built-in performance tracking shows win/loss stats, PP1/PP2 hits, and success rates all updated live. Key Features: Buy/Sell signals with adaptive volatility bands Real-time TP/SL/DP levels based on ATR Built-in MA Filter with optional ATR/StdDev volatility Performance stats panel (Success, Profit/Loss, PP1/PP2) Alerts via popup, sound, push, or email Cu
Advanced Supply Demand MT5
Bernhard Schweigert
4.53 (15)
Herhangi bir Acemi veya Uzman Tüccar için En İyi Çözüm! Bu gösterge benzersiz, yüksek kaliteli ve uygun fiyatlı bir ticaret aracıdır çünkü bir dizi tescilli özelliği ve yeni bir formülü bir araya getirdik. Bu güncelleme ile çift zaman dilimi dilimlerini gösterebileceksiniz. Yalnızca daha yüksek bir TF gösteremeyeceksiniz, aynı zamanda TF grafiğini ve ARTIK daha yüksek TF'yi de gösterebileceksiniz: YUVARLAK BÖLGELERİ GÖSTERMEK. Tüm Arz Talebi tüccarları buna bayılacak. :) Önemli Bilgiler Açıkland
CGE Trading Suite
Carl Gustav Johan Ekstrom
5 (3)
Institutional-Grade Analytics for MT5 The full analytical edge of a professional trading desk, built into your MT5 chart. A full guided tour walks you through every feature step by step. Standard retail platforms lack the depth required for professional market analysis. The CGE Trading Suite bridges this gap, transforming MetaTrader 5 into a comprehensive workspace. By integrating 18 proprietary modules into a single, unified chart interface, the suite eliminates fragmented analysis. It provide
Yeni Başlayanlar veya Uzman Tüccarlar için En İyi Çözüm! Bu gösterge benzersiz, yüksek kaliteli ve uygun fiyatlı bir ticaret aracıdır çünkü bir dizi tescilli özellik ve gizli bir formül ekledik. Yalnızca BİR grafikle 28 döviz çiftinin tümü için Uyarılar verir. Yeni bir trendin veya scalping fırsatının tam tetik noktasını belirleyebildiğiniz için ticaretinizin nasıl gelişeceğini hayal edin! Yeni temel algoritmalar üzerine inşa edilen bu sistem, potansiyel işlemlerin belirlenmesini ve onaylanma
Zain Gold Scalping
Ahmed Gamal Abdel Nasser Mohamed
A complete price-action analysis tool built around dual independent entry logic, each confirmed against a volatility band, combined with a configurable set of nine optional confirmation filters that let you shape exactly how conservative or aggressive the tool's signals behave. Core Strategy Two independent entry setups, each triggering only when price moves outside a dynamic volatility band — giving two distinct ways to spot potential reversal points, which can be used together or separately.
Yazarın diğer ürünleri
ForexTrendMT4
Andriy Sydoruk
5 (1)
ForexTrendMT4 Indicator: A Reliable Tool for Market Tracking The ForexTrendMT4 indicator offers reliable market trend tracking, filtering out sudden fluctuations and market noise. This tool helps identify trends and signals favorable entry points into the market using arrows. It is suitable for both scalping on shorter timeframes and long-term trading strategies. Based on the principles of technical analysis, ForexTrendMT4 takes into account the cyclical nature of the market. Key Features and A
Prophet
Andriy Sydoruk
Prophet is a trend indicator. Shows the direction of turning points. Can be used with an optimal risk-to-profit ratio. The arrows indicate favorable moments and directions for entering the market. Uses one parameter for setting (adjust from 1 to 3). The probability of a successful trend is very high. In the course of work, the take-profit is much larger than the stop-loss! Works on all currency pairs and on all timeframes.
Fortune
Andriy Sydoruk
3 (2)
Advisor (Fortune): Your Reliable Tool for High-Frequency Forex Trading The Fortune advisor is designed to be used on any timeframe, any currency pair, and on any broker's server. Its unique trading system makes it a versatile tool for traders. For optimal performance, it is recommended to trade liquid forex pairs, maintain a low spread, and use a VPS. You can start with a $100 deposit and a lot size of 0.01. Key Features and Benefits High-Frequency Trading : Utilizes two trading options: with v
Agile
Andriy Sydoruk
This is a professional Expert Advisor, which implements the strategy of trading using the Divergents and DivergentsPoint indicators, as wells as filters of the global trend on higher periods. Analyzing the indicators, the system enters the market with a limited martingale and the ability to open up to 8 orders in one direction. Each series of orders has mandatory TakeProfit and StopLoss levels. Also, a trailing stop based on the SAR indicator is activated for a series in breakeven. The robot aut
Divergents
Andriy Sydoruk
Indicator of divergences. It can help you identify the flat and trend areas. It can be applied as a trading filter. It has only one parameter - Period . The indicator does not show entry points, but only visualizes the information. Keep in mind that the approach to trading should be comprehensive, additional information is required for entering the market. Parameters Period - period of the indicator.
Trend indicator based on the price divergence. It can help you in finding the entry points during the analysis. It can be applied as a trading filter. It has two parameters: Period and Level . The Level parameter allows filtering out unnecessary signals. For example, the Level parameter can be set to 0.0001 for EURUSD. The indicator can work both as an entry point generator and as a filter. The indicator clearly visualizes the information. Keep in mind that the approach to trading should be comp

RaptorF4
Andriy Sydoruk
2.6 (5)
The Expert Advisor system works with ticks. Works with a deposit of $100! The elementary unit of analysis for an internal algorithm is a tick. Classical scalping trading method. The robot works well on any historic period with any currency pair. The key value is spread, with default settings can work with the spread up to 10. If the spread is greater than 10, you should use other parameter values. Testing was performed with the spread up to 10 on all ticks. Testing using open prices makes no sen
Carousel
Andriy Sydoruk
Carousel expert system compensates drawdowns. The main indicator is Divergents . The EA allows working in one direction (for example, sell order series), while another direction (for example, buy order series) is in drawdown (compensation mode). If series in both directions operate in normal mode, the system does not switch to compensation mode. If a drawdown is detected in one of the directions, the EA goes into the compensation mode and starts compensating the loss-making series by the profita
Versatile
Andriy Sydoruk
Versatile expert system follows the principle "stay in the market for as long as possible". The main indicators are Moving Average and Relative Strength Index. The EA supports working in two directions simultaneously both following a trend and against it depending on the settings. A limited number of orders LimitOrders is used for operation. The EA correctly handles errors and reliably works with a deposit 1000 USD and higher. M5 and higher timeframes are supported. The EA has very flexible sett
IdeaClassic
Andriy Sydoruk
Экспертная система IdeaClassic создана для спокойной торговли на рынке. Основная ее задача - работа с одни ордером без увеличения лота с обязательными стопами, причем стоп-лосс и тейк-профит должны быть одного порядка. Также есть возможность использовать трейлинг-стоп. Для формирования входного сигнала используется индикатор IdeaTrend . Для анализа данного индикатора используется функция, которая может анализировать данные индикатора комплексно. Анализируется до десяти последних сигналов от инди
IdeaIlan
Andriy Sydoruk
5 (1)
IdeaIlan expert system applies IdeaTrend indicator. The EA applies the martingale principle. The EA allows trading in two directions simultaneously. It also has a full set of tools allowing the EA to follow a trend and add to a position if the trend moves in unfavorable direction. The EA correctly handles errors and reliably works with a deposit of 10 000 USD and higher. M5 and higher timeframes are supported. Stop levels and trailing stop are applied. Parameters Magic - magic number; Requotes

PowerFlash
Andriy Sydoruk
PowerFlash - Советник реализует известную торговую стратегию на основе сетки. Это автоматическая торговая система. Вся работа автоматизирована. Бот использует минимум настроек.  Бот работает следующим образом. Выставляется, одновременно, сетка отложенных ордеров в обе стороны от текущей цены на дистанции, указанной пользователем. Размер сетки регулируется от 1 до 100. После чего, куда бы ни пошел рынок, отложенные ордера будут переходить в рыночные. Если рыночные ордера зайдут в общий профит, то
SpatialJump
Andriy Sydoruk
A unique expert system that works as without optimization, with the same settings (although it can be optimized if desired, especially for some brokers). You can test as you like, all ticks, control points, opening prices. The figure has an example. The potential result when testing an average of 100-500% over 3 years. It is recommended to make a multi-currency, if you choose a balanced combination, you can get results up to 500-1000% per annum with potential testing. Verified by EURUSD. The bot
Trendes
Andriy Sydoruk
The Trendes indicator works on all currency pairs and on all timeframes. The arrows indicate favorable moments and directions for entering the market. The probability of a successful trend is very high. Trendes can be used for both small pits and long-term trading. The indicator determines the entry points according to the methods described in the book "How to play and win on the stock exchange". Options LengthA  - The number of bars for calculating the first function; LengthB - The number of b
Martingal
Andriy Sydoruk
The indicator Martingal works on all currency pairs and on all timeframes. The arrows indicate the optimal input points for the future Martingale averaging, even with a zero exponent. The indicator shows the signal to close the series only if all the previous signals can be closed in the profit. After closing the series in profit, you must immediately open the order in the direction of the signal. Thus, the signal for closing is simultaneously the point of reverse opening to the other side of th
Spin
Andriy Sydoruk
If you do not yet have your trading strategy, you can take advantage of our ready-made trading strategy, which is most effective! The trend indicator Spin is created on the basis of price divergence. Will help in finding the entry points for analysis. Can be used as a filter in the trade. Has one Length parameter. The indicator can work for both entry points and filters. The indicator reflects information in a visual form. Do not forget that the approach to trading should be comprehensive, to en
Variator
Andriy Sydoruk
Intelligent algorithm indicator Variator with accuracy generates input signals and output levels. If the average price is blue, you should look for entry points to open long positions when the market is not overbought, and if the average price is red, you should look for entry points to open short positions when the market is not oversold. The rules can be summarized as follows. You should buy during an uptrend when the price reaches the average or oversold, and sell during a downtrend when the
Prognosticator
Andriy Sydoruk
This indicator shows not just a line of the price balance, but also forecasts it for the specified number of bars ahead. That is, the level of the probable balance of the price reflects on the chart in the future. The level of balancing is set by the Balance parameter, that is, it can be drawn at any level. Forecasting the future with the Shift parameter. The indicator reflects information in a visual form. Do not forget that the approach to trading should be comprehensive, to enter the market r
The algorithm of the Tic Tac Toe indicator differs from the usual indicators on the price charts in that it completely ignores the flow of time and reflects only changes in the price. Instead of displaying the time intervals on the X axis, and the price value on the Y axis, the Tic Tac Toe indicator displays price changes on both axes. The indicator displays in red if prices rise by a certain base value (TicTacToe) and blue if prices fall on the same value. If prices fell / rose by less than a c
FiboZag
Andriy Sydoruk
Indicator FiboZag - transfer the indicator to the chart and the Fibonacci levels will be built automatically on the last ZigZag turn. The main advantage lies in the correct construction of Fibonacci levels and markup of price levels. Simple, visual and effective use. The indicator is not redrawn and does not lag. Works on all currency pairs and on all timeframes.
TrendCloud
Andriy Sydoruk
Realization of trend movement indication with points for potential stops in the TrendCloud indicator. It can be easily used as an independent trading system. You can interpret this: the location of the course above or below the shadows show the presence of a trend. The transition to the shadow warns of a possible reversal. Entering the price inside the shadow speaks in a flat motion. The indicator tracks the market trend with unsurpassed reliability, ignoring sharp market fluctuations and noises

Doonchian
Andriy Sydoruk
The Doonchian channel consists of two channel displays. Channel lines are determined by a simple and reliable algorithm. The channel is preferably used for trading inside the channel. The indicator does not redraw and does not lag; simple algorithms are the basis of the work. It works on all currency pairs and on all timeframes. As always a warning, we must not forget that the approach must be comprehensive, the indicator signals require additional information to enter the market.

VictoryCPM
Andriy Sydoruk
The VictoryCPM (Currency Power Meter) indicator will show the strength of currency pairs. The indicator is created for those traders who prefer to trade several currency pairs at once. This tool is able to display on the trading chart data on the current strength of various currencies. The foreign exchange market has a dynamic structure, which is why different currencies affect each other. For this reason, in order to identify the optimal point for creating an order, it is necessary to familiari
Progressive
Andriy Sydoruk
The  Progressive  Expert System works using sharp tick movements. Works with a deposit of $ 100! The classic method of trading scalping. It is also worth noting that with the allowable spread level, the bot goes through any historical period on any currency pair. There is no point in testing at opening prices, either checkpoints or all tics. It is possible to work on accounts with a floating spread, entry into the market will occur only when the spread is lower than the level specified in the se
Element33
Andriy Sydoruk
Экспертная система Element33 работает, на любых типах счетов. Работает как в 4-х так и с 5-значными котировками. Спрэд и реквоты не критичны, подойдет любой брокер. Экспертная система разбивает историю на 4 квартала, для оптимизации рекомендовано три года на периоде H1 или H4. Оптимизацию можно проводить по ценах открытия, результаты мало отличаются от тестирования по реальным тикам, поскольку бот работает по ценам открытия. Оптимизировать достаточно один раз в месяц! Для получения более хороших
FiboPoint
Andriy Sydoruk
A trend indicator that shows the direction of pivot points. It can be used with an optimal risk to reward ratio. The probability of a success trend is very high. The indicator uses arrows to show favorable time to enter the market and market entry directions. Uses only one adjustable parameter (a value from 1 to 3). Take profit is much larger than stop loss! The indicator works on all currency pairs and time frames.
WiseBW
Andriy Sydoruk
The  WiseBW  indicator simplifies decision making by recognizing turns using the built-in algorithm, and then confirms signals at support / resistance levels. Thus, the indicator tracks the market trend with unsurpassed reliability, ignoring sharp market fluctuations and noise around the average price. The indicator can be used both for pipsing at small periods, and for long-term trading. Options: updown  - offset pips for indentation of icons; back  - how many bars to take into account; CountBa
TrendCross
Andriy Sydoruk
The indicator bounds the price according to a cyclic wave dependency using moving averages. Thus, all the crossing points, in which the movement is changed considering the indicator period, are the optimal ones. The crossing points can be used as the potential market reversal points. However, do not forget about the complex approach: the indicator signals require additional data to enter the market.
ComplexPulse - pulse indicator or signal. Sensitive and responsive to price movements. The indicator shows the interdependence of various currency pairs, namely: USD, EUR, GBP, CHF, JPY. Currencies are measured in relative units, so in each unit of time the sum of all currencies will be equal to zero. Hence, one of the main elements of cluster indicators is the zero line, or the balance line (zero line). If a currency is below the balance line, then it is said that the currency is oversold rela
Индикатор RegressionXP рассчитывает два типа регрессии и вычисляет среднеквадратичную девиацию цены на данном диапазоне. Важна прямая золотая линия (регрессия первой степени), показывающая направление и состояние текущего тренда на выбранном таймфрейме. Чем больше угол с горизонталью, тем сильнее тренд. Таким образом, мы имеем возможность делать выводы относительно состояния валютной пары по текущему расположению цены относительно линии регрессии. На расстоянии от золотой линии проходят параллел
Filtrele:
Değerlendirme yok
Değerlendirmeye yanıt