Proxy Footprint

ProxyFootprint — Panoramica

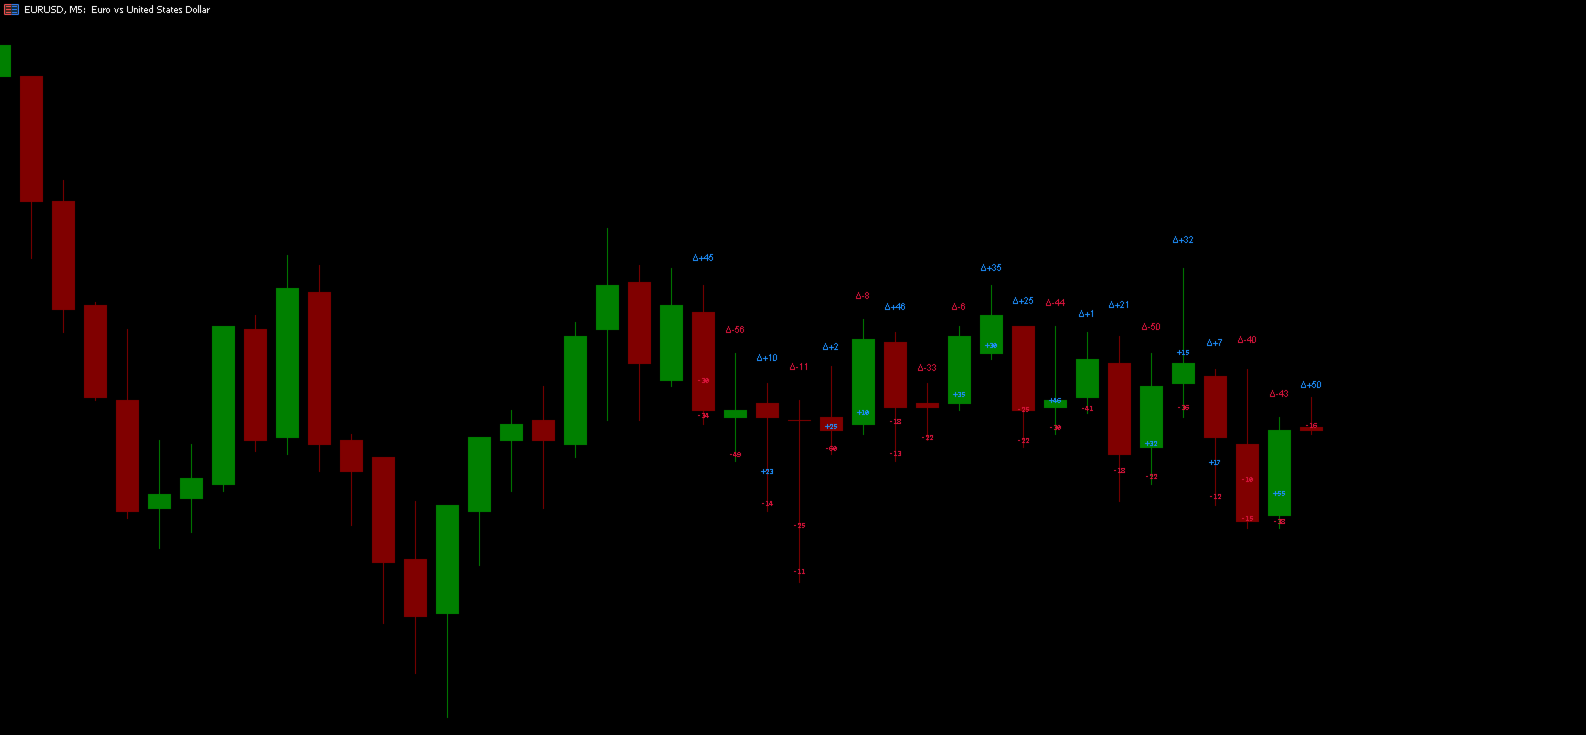
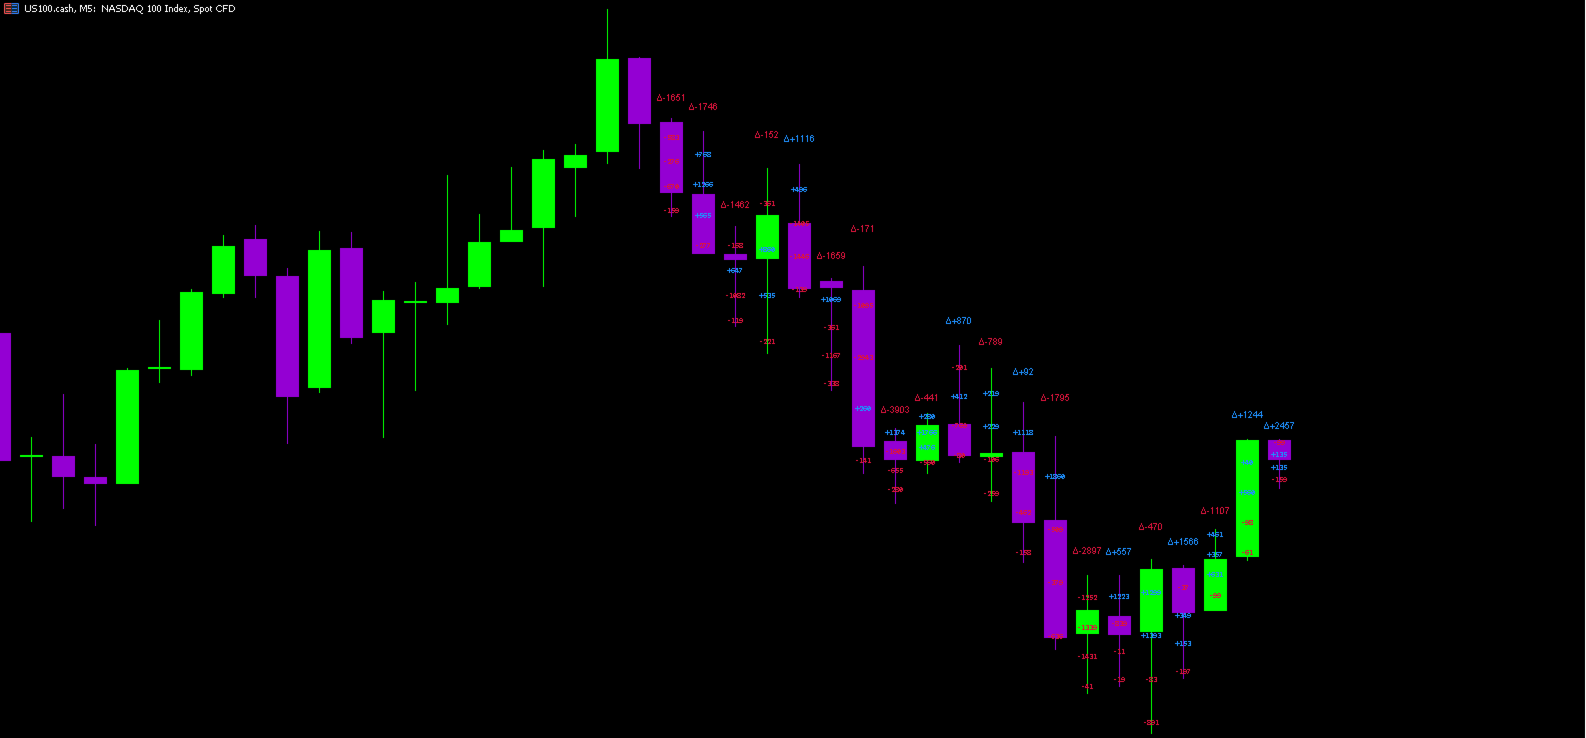
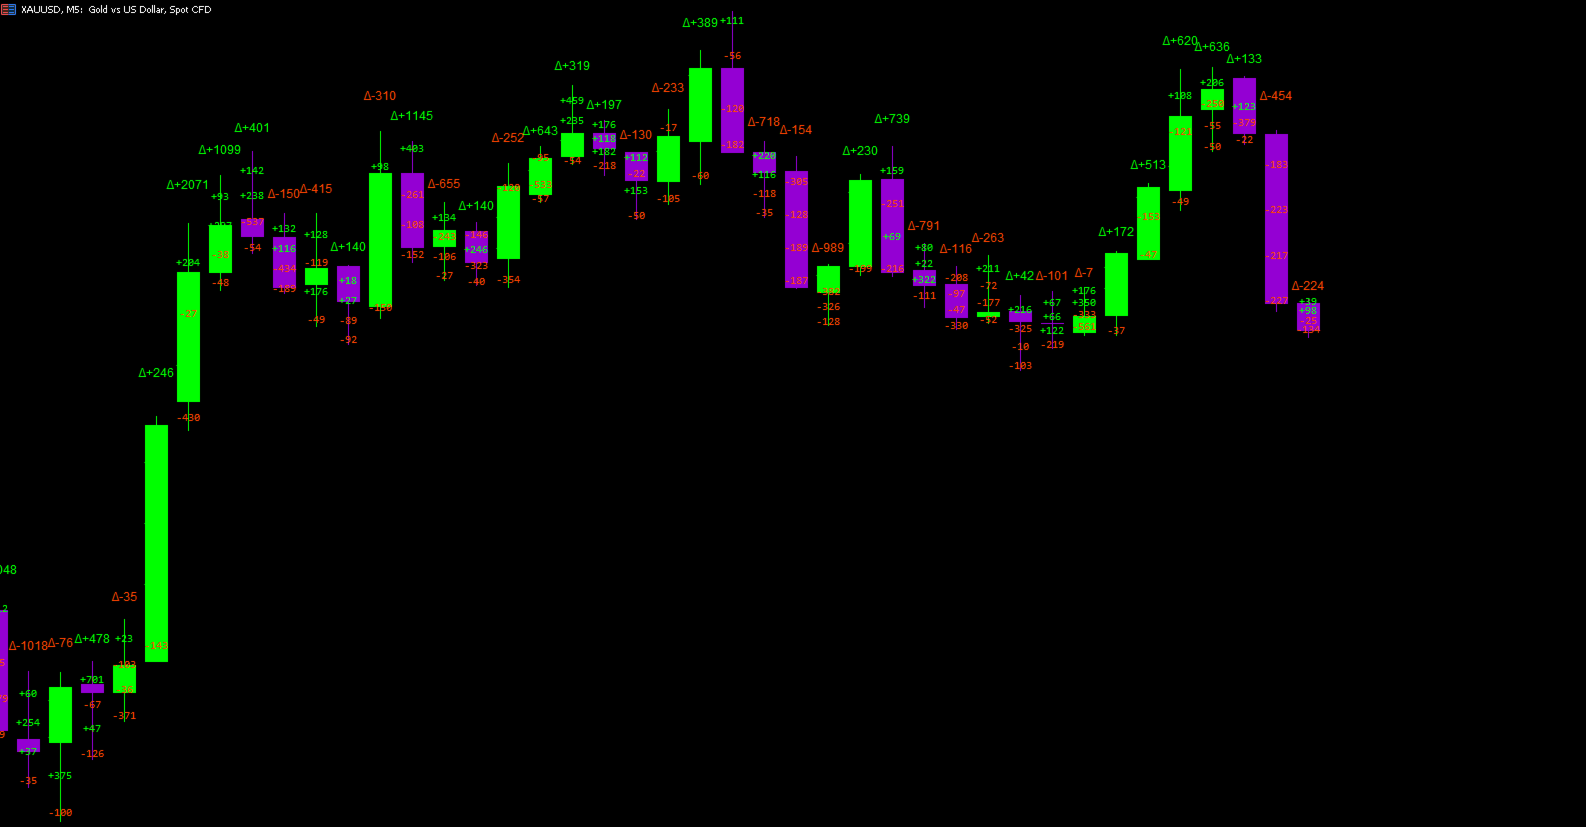
ProxyFootprint Advanced è un indicatore di visualizzazione del flusso degli ordini per MetaTrader 5, progettato per mostrare la pressione di acquisto e di vendita a diversi livelli di prezzo.

Cos’è (e cosa non è)

Importante: Questo non è un vero footprint chart.
I veri grafici footprint richiedono l’accesso ai dati reali del book ordini (volumi bid/ask a ciascun livello di prezzo) forniti da borse o provider specializzati.
Questo indicatore crea una approssimazione visiva, ispirata ai grafici footprint, utilizzando dati di tick pubblicamente disponibili.

Come funziona

L’indicatore analizza i movimenti di prezzo tick per tick per stimare la pressione di acquisto e vendita:

  • I tick al rialzo sono classificati come pressione d’acquisto

  • I tick al ribasso sono classificati come pressione di vendita

  • Il delta (volume acquisti − volume vendite) viene calcolato e visualizzato su diversi livelli di prezzo all’interno di ogni candela

Caratteristiche principali

  • Analisi multi-livello: mostra i valori del delta su fino a 8 livelli di prezzo configurabili per candela

  • Delta netto: mostra la pressione complessiva di acquisto/vendita per ogni barra

  • 6 temi visivi: Professional, Dark, Light, Vibrant, Classic e Custom

  • Filtro intelligente: visualizza solo i delta significativi per evitare confusione visiva

  • Aggiornamento in tempo reale: aggiorna ogni 2 secondi sulla candela corrente

  • Prestazioni ottimizzate: progettato per i timeframe M1, M5 e M15

Casi d’uso

Ideale per i trader che desiderano:

  • Visualizzare la pressione di acquisto/vendita senza disporre di dati istituzionali sul flusso degli ordini

  • Identificare potenziali livelli di supporto/resistenza basati sugli squilibri di volume

  • Confermare l’azione del prezzo tramite l’analisi dei volumi

  • Rilevare divergenze tra prezzo e delta

Limitazioni

  • Non si basa su dati reali del book ordini

  • La precisione dipende dalla qualità e disponibilità dei dati tick del broker

  • Funziona meglio con broker ECN/STP che offrono una cronologia tick completa

  • Il metodo di approssimazione potrebbe non catturare tutte le sfumature del mercato

Requisiti tecnici

  • Piattaforma: MetaTrader 5

  • Timeframe: M5, M15

  • Dati: richiede un broker con cronologia tick approfondita


Prodotti consigliati
Vwap Freeze
Ricardo Almeida Branco
5 (1)
The previous day's vwap is used by some traders as a support and resistance point, after all it is one of the ways to consider the fair price of that asset or that pair the day before. Possible defenses can occur in this region indicating a reversal, or triggering stops starting a new, more directional movement. It is a matter of analyzing how it will add to your operational. To avoid manually drawing the previous day's vwaps and saving time for your analysis, use the Vwap Freeze indicator, as
L'Anchored VWAP è una variazione del VWAP tradizionale, in cui il calcolo dell'indicatore inizia da un punto specifico nel tempo (l'ancora), invece di essere calcolato dall'inizio della sessione di negoziazione o da un intervallo di tempo fisso. Questo può essere utile per i trader che desiderano valutare il comportamento del prezzo in relazione al volume a partire da eventi specifici, come una notizia importante, l'inizio di una tendenza o un evento tecnico, come il superamento di un livello di
FREE
Zone vwap auto band
Anizio Donizete Dias De Moraes
It is an indicator used to identify support and resistance points from the daily VWAP and you can use it to check the best entry and exit points. The calculated value of the channel distance can be calculated in several ways: - Manual   Defining the value to be projected to calculate the distance of the channels. - Automatic   Select the timeframe to be used.   Regardless of the graphic time that is on the screen, if the parameter is changed to      H1(One hour candles), the system will calc
The   Visual Volatility Clustering   indicator clusters the market based on volatility. The indicator does not redraw and gives accurate data, does not use closing prices. Uses the opening prices or the highs or lows of the previous completed bar. Therefore, all information will be clear and unambiguous. The essence of the indicator is to divide the price market into certain areas according to a similar type of volatility. This can be done in any way. In this example, the indicator is configure
L'indicatore consente di determinare la direzione del prezzo corrente e la volatilità del mercato. Questa versione del Traders Dynamic Index ha eliminato il ridisegno dei dati storici, ottimizzata la velocità di calcolo dell'algoritmo, più parametri esterni per un aggiustamento più preciso e le sue funzionalità estese: aggiunta la selezione dell'oscillatore iniziale e le modalità di smoothing delle medie . Parametri: Mode Osc - stima della selezione dell'oscillatore Period Osc - il periodo di ca
The   Pivot Point indicator   automatically calculates and displays the pivot point line and support and resistance levels. Pivot can be calculated according to the Classic, Floor, Fibonacci, Woodie, Camarilla or DeMark formula. It is also possible to select the period for calculating the indicator. A trader can choose from daily, weekly, monthly, or user-defined periods. Types of pivots Classic Floor Fibonacci Woodie Camarilla DeMark Main features The indicator shows the current and historic
FREE
Initial Balance MT5
Ricardo Almeida Branco
The Initial Balance (Initial Balance / Initial Balance) is a concept related to the study of volume (to learn more, study about Market Profile and Auction Market Theory. You can find some videos in English when searching for "Initial Balance Market Profile"). The IB defines a range in which prices were negotiated in the first hour of trading.The amplitude of the range is important and the break in the range defined by the Initial Balance may have occurred due to the movement of several players
The   Real Flow Defense Levels   indicator is a proprietary tool designed to identify and plot   significant, high-conviction price zones   directly onto your main trading chart. It uses a dynamic, volume-based analysis to determine where the market has previously demonstrated the   strongest defense or concentration of activity . These plotted lines serve as   dynamic support and resistance levels , highlighting the prices where major participants are most likely to enter or defend their positi
What is VWAP? The Volume Weighted Average Price (VWAP) is a trading benchmark that reflects the average price of a security, weighted by volume, over a specific time period. It helps traders identify fair value and is used widely in intraday trading to assess price action relative to institutional trading levels. Key Features of Anchored VWAP PRO Anchored Calculation : Unlike traditional VWAP that resets daily, your indicator allows users to anchor VWAP to specific time frames or key points (e.g
VP hidden
Emr Aljnaby
4.33 (12)
The indicator works to convert normal volume into levels and determine financial liquidity control points. It is very similar in function to Fixed Volume Profile. But it is considered more accurate and easier to use than the one found on Trading View because it calculates the full trading volumes in each candle and in all the brokers present in MetaTrade, unlike what is found in Trading View, as it only measures the broker’s displayed prices. To follow us on social media platforms: telegram
FREE
Automatic Vwap Midas
Ricardo Almeida Branco
5 (1)
The 3 Automatic Vwap (Midas) Indicator can be used for Price and Volume studyers to map the movement of market drivers. It automatically plots 3 Vwaps, two of which are dynamic and will be updated throughout the day if new highs or new lows emerge. The third Vwap is daily and can help if the trend is up or down. Also, an auxiliary indicator that plots (also dynamic) points of interest with OHLC prices (Open, High and Low of the current day and Close of the previous day) was inserted. Success and
Trend Battle
Osmar Santiago
5 (1)
Trend Battle Indicator Overview The Trend Battle Indicator is a professional technical analysis tool that reveals the battle between buyers (Bulls) and sellers (Bears) in the market through a comprehensive dashboard. Using an intuitive visual interface, the indicator offers a unique perspective on market power dynamics by analyzing the last twenty bars to provide precise insights into momentum and directional strength. Additionally, the panel provides automatic real-time updates for bars in for
Anchored VWAP Bands
Alexandre Silva Diniz
L' Anchored VWAP Bands è uno strumento di precisione avanzata che permette di calcolare il Prezzo Medio Ponderato per il Volume (VWAP) a partire da qualsiasi punto specifico del grafico, utilizzando una logica di ancoraggio dinamico tramite clic . Il Vantaggio: Ancoraggio di Precisione (Click-Point Detection) A differenza delle VWAP comuni, questo indicatore rileva esattamente dove clicchi rispetto alla candela per definire la base di calcolo del prezzo: Clic sulla Parte Superiore (HIGH): Ancora
FREE
An anchored Vwap With Arrows is an indicator that includes a moving average weighted by volume that allows you to plot on a bottom or a top. Usually banks and institutions measure an average price, this average price is a price range where they agree to make a trade. Using the logic of anchored vwap with arrows it is possible to understand that if the price breaks the vwap it means that someone with enough buying and selling power has lost control. You can use vwap anchored with arrows in any ti
Anchored VWAP plus
Jesper Christensen
Elevate Your Trading with Advanced Anchored Volume Weighted Average Price Technology Unlock the true power of price action with our premium Anchored VWAP Indicator for MetaTrader 5 - the essential tool for precision entries, strategic exits, and high-probability trend continuation setups. Write me a DM for a 7 day free trial.  Anchored VWAP Plus gives traders unprecedented control by allowing custom anchor points for Volume Weighted Average Price calculations on any chart. With support for 4 sim
FREE
VWAP Daily
Anton Polkovnikov
Weighted average price indicator or VWAP. The well-known standard VWAP with the beginning of the day is added with the function of selecting the periodization. It can be calculated both every day and on other periods. Also the indicator allows to exclude the volume from the calculation, which will allow using it on the cryptocurrencies and forex. There is an alert for a VWAP price crossing. There are 1 and 2 standard deviation. Settings: Volume: turning volume on and off in the calculation mecha
Vwap Bar
Jean Jacques Huve Ribeiro
5 (1)
VWAP BAR  It´s power full indicator of candle by candle when lined up   with greate analysis, you have great opportunity, finder defense candle. Is a good ideia from order flow method, now your meta trader 5   inside you time frame chart .   What is the Volume Weighted Average Price (VWAP)? The volume weighted average price (VWAP) is a trading benchmark used by traders that gives the average price a security has traded at throughout the day, based on both volume and price. It is important be
FREE
The Market Structures Pro indicator finds and displays 5 (five) patterns of the Smart Money Concepts (SMC) system on the chart, namely: Break Of Structures (BoS)       Change of character (CHoCH) Equal Highs & Lows Premium, Equilibrium and Discount zones with Fibo grid High-high, Low-low, High-low and Low-high extremes Patterns are displayed for two modes - Swing and Internal and are easily distinguished by color on the chart. Internal mode features higher contrast colors, finer lines, and smal
Swiss VWAPsimple
Terence Gronowski
4.8 (5)
Swiss VWAPsimple Motivation Did not find free VWAP that works, the one that I found craseh. So I created a VWAP which calculates values only for the actual day. So computer resouces are not over stressed. What is VWAP, how is it used?  VWAP stands for Volume Weighed Average Price, it calculates the running sum of tick volume and the runnung sum of price times tickvolume. The division of these sums result in a weighed price (Sum P*V/Sum V). The calculation starts normally at midnight. The values
FREE
Each VolumeProfile holds: The price range for a given period Buy/sell volume for each price level Calculated POC, VAH, VAL, Delta, and Imbalance Indicator Logic Summary Divide data by timeframe (e.g., one H1 profile per hour). Aggregate volumes for each price level. Separate buy and sell volumes using tick or trade direction. Compute Delta (Buy − Sell) and Imbalance (dominance ≥70%). Detect POC, VAH, VAL to outline the Value Area. Draw graphical profiles beside price candles using color-co
Intraday Vwap Orion
Joao Paulo Botelho Silva
Theory VWAP is a volume-weighted moving average, bringing greater relevance to prices. The VWAP base calculation follows the classic formula described in Investopedia ( https://www.investopedia.com/terms/v/vwap.asp ). VWAP = sum(typical price[i]*volume[i]) / sum(volume[i]) Functionalities Orion Intraday VWAP innovates by allowing the user to choose between the conventional Daily, Weekly and Monthly periods, also having the option of calculating the Intraday indicator, as used in other platform
Auto Midas VWAP
Paulo Henrique Faquineli Garcia
AUTO MIDAS VWAP Volume Weighted Average Price (VWAP) is a trading benchmark commonly used by Big Players that gives the average price a Symbol has traded throughout the day. It is based on both Volume and price. Commonly, MIDAS VWAP damand you to determine the initial point of analysis. This indicator plots automatically based on ZigZag Approach. You will be able to use up to 3 HIGH MIDAS VWAP's and 3 LOW MIDAS VWAP's. Wish the best trade results!!
Auto Levels Pro
Oleksandr Sheyko
AutoLevelsPro — un indicatore che analizza i dati di prezzo e segna automaticamente zone di supporto e resistenza . È stato progettato appositamente per funzionare su timeframe bassi , in particolare sul grafico a 15 minuti , dove il mercato mostra le reazioni più dinamiche. Dati utilizzati: High — prezzo massimo della candela Low — prezzo minimo della candela Close — utilizzato per il calcolo dell’ATR Timestamp di ogni candela per posizionare correttamente le zone ️ Processo di
Avwap
Pablo Filipe Soares De Almeida
Avwap Caratteristiche principali: VWAP giornaliero automatico (si resetta perfettamente ogni giorno alle 00:00 ora server) 8 tipi di prezzo per il calcolo: Close, (H+L+C)/3, (H+L)/2, (O+C)/2, (O+H+L+C)/4 e altro Modalità VWAP Ancorato: basta trascinare la linea verticale in qualsiasi punto del passato e il VWAP viene ricalcolato istantaneamente da quel momento Colore, spessore e stile della linea verticale 100% configurabili (decidi tu come visualizzare l’ancora) Nessuna etichetta o testo nel gr
Advanced ORB Gold
Dodong Christian Arnon
Recommended Broker >>>  https://tickmill.link/3Y1QeAK&nbsp Check comments or my Bio for the proper & recommended settings          ADVANCED ORB Retest EA v4.3 - Advanced Recovery System LAUNCH PRICE: $299 | Increases 50% Every 5 Sales - Get Yours Now! Smart Trading System with Intelligent Protection Professional M30/H1 Opening Range Breakout strategy equipped with   #SmartRecovery   and   #AutoRecoverySystem   that doubles lot size on SL hits until profit is achieved - designed to re
Anchored VWAP with Alert MT5
Trade The Volume Waves Single Member P.C.
5 (1)
What is the Volume Weighted Average Price (VWAP)? The volume weighted average price (VWAP) is a trading benchmark used by traders that gives the average price an instrument has traded at throughout the day, based on both volume and price.  It is important because it provides traders with insight into both the trend and value of the instrument. What is the Difference between VWAP and AVWAP? While VWAP is having as starting point the beggining of the day,week,month etc. in the AVWAP you can pla
Supertrend Pro MTF Dashboard: Trade with Confidence Stop missing high-probability trades. The Supertrend Pro MTF Dashboard is the professional-grade tool designed to cut through market noise and instantly identify powerful, aligned trends across 8 timeframes (M1 to W1). Built for serious traders, this indicator delivers no-repaint signals and a clean, actionable dashboard, making multi-timeframe confirmation effortless. KEY FEATURES FOR PROFESSIONAL TRADERS 1. Multi-Timeframe Trend Alignment
TimeFrameLow milliseconds
Israel Goncalves Moraes De Souza
O indicador mostra o preço ou volume em milissegundos, ótimo para identificar padrões de entrada por agressão de preço ou volume e escalpelamento rápido. Características Período de tempo do WPR em milissegundos Oscilador de agressão de preço Tela personalizável O indicador pode indicar movimentos de entrada, como: Cruzamento da linha 0.0 Identificando padrões de onda A velocidade de exibição do gráfico dependerá do seu hardware, quanto menores os milissegundos, mais serão necessários do hardwar
FREE
Camarilla Pivot
Philip Thakadiyil George
Camarilla Pivot Pro EA is a fully automated trading robot built around the powerful Camarilla Pivot Point formula. The EA calculates intraday pivot levels (H1–H6 & L1–L6) and trades based on price reactions at major Camarilla reversal and breakout zones. It is designed for traders who want a clean, mechanical, and proven pivot-based strategy without repainting signals or complicated indicators.
Gli utenti di questo prodotto hanno anche acquistato
Se acquisti questo indicatore, riceverai il mio Trade Manager Professionale + EA  GRATUITAMENTE. Innanzitutto è importante sottolineare che questo sistema di trading è un indicatore Non-Repainting, Non-Redrawing e Non-Lagging, il che lo rende ideale sia per il trading manuale che per quello automatico. Corso online, manuale e download di preset. Il "Sistema di Trading Smart Trend MT5" è una soluzione completa pensata sia per i trader principianti che per quelli esperti. Combina oltre 10 indicat
Divergence Bomber
Ihor Otkydach
4.89 (81)
Ogni acquirente dell’indicatore riceverà inoltre gratuitamente: L’utilità esclusiva “Bomber Utility”, che gestisce automaticamente ogni operazione, imposta i livelli di Stop Loss e Take Profit e chiude le posizioni secondo le regole della strategia I file di configurazione (set file) per adattare l’indicatore a diversi asset I set file per configurare il Bomber Utility in tre modalità: “Rischio Minimo”, “Rischio Bilanciato” e “Strategia di Attesa” Una guida video passo-passo per installare, conf
Power Candles MT5
Daniel Stein
5 (5)
Power Candles – Segnali di ingresso basati sulla forza per tutti i mercati Power Candles porta l’analisi di forza collaudata di Stein Investments direttamente sul grafico dei prezzi. Invece di reagire solo al prezzo, ogni candela viene colorata in base alla reale forza di mercato, consentendo di identificare immediatamente accumuli di momentum, accelerazioni della forza e transizioni di trend pulite. Un’unica logica per tutti i mercati Power Candles funziona automaticamente su tutti i simboli di
Entry In The Zone and SMC Multi Timeframe è uno strumento di analisi di mercato in tempo reale sviluppato sulla base degli Smart Money Concepts (SMC). È progettato per aiutare i trader ad analizzare la struttura del mercato in modo sistematico e ottenere una visione più chiara della direzione generale del mercato. Il sistema analizza automaticamente i Punti di Inversione, le Zone Chiave e la Market Structure su più timeframe, mostrando Point of Interest (POI), segnali No Repaint e Auto Fibonacci
SuperScalp Pro
Van Minh Nguyen
5 (1)
SuperScalp Pro – Sistema avanzato di indicatore per scalping con filtri multipli SuperScalp Pro è un sistema avanzato di indicatore per scalping che combina il classico Supertrend con molteplici filtri di conferma intelligenti. L’indicatore funziona in modo efficiente su tutti i timeframe da M1 a H4 ed è particolarmente adatto per XAUUSD, BTCUSD e le principali coppie Forex. Può essere utilizzato come sistema stand-alone o integrato in modo flessibile nelle strategie di trading esistenti. L’indi
Azimuth Pro
Ottaviano De Cicco
5 (1)
LAUNCH PROMO Azimuth Pro price is initially set at 299$ for the first 100 buyers. Final price will be 499$ . THE DIFFERENCE BETWEEN RETAIL AND INSTITUTIONAL ENTRIES ISN'T THE INDICATOR — IT'S THE LOCATION. Most traders enter at arbitrary price levels, chasing momentum or reacting to lagging signals. Institutions wait for price to reach structured levels where supply and demand actually shift. Azimuth Pro maps these levels automatically: swing-anchored VWAP, multi-timeframe structure lines, an
Ottieni l’indicatore AUX GRATUITO e il supporto EA Download diretto — Clicca qui [ D.I.C.E ] The DICE Indicator  Divergence in Chaos Environment è uno strumento MT5 specializzato per trader che applicano la Teoria delle Onde di Elliott nel contesto delle tecniche di Trading Chaos. Identifica divergenze nascoste e regolari nell’azione dei prezzi, sincronizzate con l’ambiente di mercato caotico descritto da Bill Williams. Caratteristiche principali Divergenza allineata alle Onde di Elliott: rilev
Game Changer è un indicatore di tendenza rivoluzionario, progettato per essere utilizzato su qualsiasi strumento finanziario, per trasformare il tuo Metatrader in un potente analizzatore di trend. L'indicatore non ridisegna e non subisce ritardi. Funziona su qualsiasi intervallo temporale e aiuta a identificare i trend, segnala potenziali inversioni, funge da meccanismo di trailing stop e fornisce avvisi in tempo reale per risposte tempestive del mercato. Che tu sia un trader esperto, un profess
Trend Screener Pro MT5
STE S.S.COMPANY
4.84 (100)
Indicatore di tendenza, soluzione unica rivoluzionaria per il trading di tendenze e il filtraggio con tutte le importanti funzionalità di tendenza integrate in un unico strumento! È un indicatore multi-timeframe e multi-valuta al 100% non ridipingibile che può essere utilizzato su tutti i simboli/strumenti: forex, materie prime, criptovalute, indici e azioni. Trend Screener è un indicatore di tendenza che segue un indicatore efficiente che fornisce segnali di tendenza a freccia con punti nel gra
Smart Stop Indicator – Precisione intelligente dello stop-loss direttamente sul grafico Panoramica Smart Stop Indicator è la soluzione ideale per i trader che desiderano posizionare il loro stop-loss in modo chiaro e metodico, senza dover indovinare o affidarsi all’intuizione. Questo strumento combina la logica classica del price action (massimi e minimi strutturali) con un moderno riconoscimento dei breakout per identificare il prossimo livello di stop realmente logico. In trend, in range o i
Atomic Analyst MT5
Issam Kassas
4.07 (28)
Innanzitutto, vale la pena sottolineare che questo indicatore di trading non è repaint, non è ridisegno e non presenta ritardi, il che lo rende ideale sia per il trading manuale che per quello automatico. Manuale utente: impostazioni, input e strategia. L'Analista Atomico è un indicatore di azione del prezzo PA che utilizza la forza e il momentum del prezzo per trovare un miglior vantaggio sul mercato. Dotato di filtri avanzati che aiutano a rimuovere rumori e segnali falsi, e aumentare il pote
FX Power MT5 NG
Daniel Stein
5 (30)
FX Power: Analizza la Forza delle Valute per Decisioni di Trading Più Intelligenti Panoramica FX Power è lo strumento essenziale per comprendere la reale forza delle principali valute e dell'oro in qualsiasi condizione di mercato. Identificando le valute forti da comprare e quelle deboli da vendere, FX Power semplifica le decisioni di trading e rivela opportunità ad alta probabilità. Che tu segua le tendenze o anticipi inversioni utilizzando valori estremi di Delta, questo strumento si adatta
Top indicator for MT5   providing accurate signals to enter a trade without repainting! It can be applied to any financial assets:   forex, cryptocurrencies, metals, stocks, indices .  Watch  the video  (6:22) with an example of processing only one signal that paid off the indicator! MT4 version is here It will provide pretty accurate trading signals and tell you when it's best to open a trade and close it. Most traders improve their trading results during the first trading week with the help of
Super Signal – Skyblade Edition Sistema professionale di segnali di tendenza senza repaint / senza ritardo con tasso di vincita eccezionale | Per MT4 / MT5 Funziona meglio su timeframe più bassi, come 1 minuto, 5 minuti e 15 minuti. Caratteristiche principali: Super Signal – Skyblade Edition è un sistema intelligente di segnali progettato specificamente per il trading di tendenza. Utilizza una logica di filtraggio multilivello per identificare esclusivamente i movimenti direzionali forti, supp
L’indicatore evidenzia le zone in cui viene dichiarato interesse sul mercato , per poi mostrare la zona di accumulo degli ordini . Funziona come un book degli ordini su larga scala . Questo è l’indicatore per i grandi capitali . Le sue prestazioni sono eccezionali. Qualsiasi interesse ci sia nel mercato, lo vedrai chiaramente . (Questa è una versione completamente riscritta e automatizzata – non è più necessaria un’analisi manuale.) La velocità di transazione è un indicatore concettualmente nuo
FX Levels MT5
Daniel Stein
5 (12)
FX Levels: Supporti e Resistenze di Precisione Eccezionale per Tutti i Mercati Panoramica Rapida Cercate un modo affidabile per individuare livelli di supporto e resistenza in ogni mercato—coppie di valute, indici, azioni o materie prime? FX Levels fonde il metodo tradizionale “Lighthouse” con un approccio dinamico all’avanguardia, offrendo una precisione quasi universale. Basato sulla nostra esperienza reale con i broker e su aggiornamenti automatici giornalieri più quelli in tempo reale, FX
Innanzitutto, vale la pena sottolineare che questo Strumento di Trading è un Indicatore Non-Ridipingente, Non-Ridisegnante e Non-Laggante, il che lo rende ideale per il trading professionale. Corso online, manuale utente e demo. L'Indicatore Smart Price Action Concepts è uno strumento molto potente sia per i nuovi che per i trader esperti. Racchiude più di 20 utili indicatori in uno solo, combinando idee di trading avanzate come l'Analisi del Trader del Circolo Interno e le Strategie di Tradin
Grabber System MT5
Ihor Otkydach
4.82 (22)
Ti presento un eccellente indicatore tecnico: Grabber, che funziona come una strategia di trading "tutto incluso", pronta all’uso. In un solo codice sono integrati strumenti potenti per l’analisi tecnica del mercato, segnali di trading (frecce), funzioni di allerta e notifiche push. Ogni acquirente di questo indicatore riceve anche gratuitamente: L’utility Grabber: per la gestione automatica degli ordini aperti Video tutorial passo dopo passo: per imparare a installare, configurare e utilizzare
Shock Pullback
Suleiman Alhawamdah
5 (1)
Semplicemente, puoi iniziare a fare trading quando il movimento dei numeri bianchi — noti come "pips" — inizia ad apparire accanto alla candela corrente. I "pips" bianchi indicano che un'operazione di acquisto o vendita è attualmente attiva e si sta muovendo nella direzione corretta, come indicato dal colore bianco. Quando il movimento dei pips bianchi si interrompe e diventa di colore verde statico, questo segnala la fine della spinta attuale. Il colore verde dei numeri rappresenta il profitto
Market Structure Patterns
Samuel Manoel De Souza
4.47 (19)
Disponibile per   MT4   e   MT5 . Unisciti al canale Market Structure Patterns per scaricare materiale di studio e/o informazioni aggiuntive. Pubblicazioni correlate: Market Structure Patterns - Introduzione Acquistalo ora con 50% di sconto | Prezzo precedente $90 | Offerta valida fino al 31 dicembre | Un importante aggiornamento è in arrivo e il prezzo originale verrà adeguato. Market Structure Patterns   è un indicatore basato sui   Smart Money Concepts   che mostra gli   elementi SMC/ICT  
Trend indicator AI mt5
Ramil Minniakhmetov
5 (13)
Trend Ai indicator è un ottimo strumento che migliorerà l'analisi di mercato di un trader combinando l'identificazione della tendenza con punti di ingresso utilizzabili e avvisi di inversione. Questo indicatore consente agli utenti di navigare nelle complessità del mercato forex con fiducia e precisione Oltre ai segnali primari, l'indicatore Ai di tendenza identifica i punti di ingresso secondari che si presentano durante i pullback o i ritracciamenti, consentendo ai trader di capitalizzare le
Quantum TrendPulse
Bogdan Ion Puscasu
5 (20)
Ecco   Quantum TrendPulse   , lo strumento di trading definitivo che combina la potenza di   SuperTrend   ,   RSI   e   Stocastico   in un unico indicatore completo per massimizzare il tuo potenziale di trading. Progettato per i trader che cercano precisione ed efficienza, questo indicatore ti aiuta a identificare con sicurezza le tendenze di mercato, i cambiamenti di momentum e i punti di entrata e uscita ottimali. Caratteristiche principali: Integrazione SuperTrend:   segui facilmente l'andame
IX Power MT5
Daniel Stein
4.92 (12)
IX Power: Scopri approfondimenti di mercato per indici, materie prime, criptovalute e forex Panoramica IX Power è uno strumento versatile progettato per analizzare la forza di indici, materie prime, criptovalute e simboli forex. Mentre FX Power offre la massima precisione per le coppie di valute utilizzando i dati di tutte le coppie disponibili, IX Power si concentra esclusivamente sui dati di mercato del simbolo sottostante. Questo rende IX Power una scelta eccellente per mercati non correlat
ARICoins
Temirlan Kdyrkhan
ARICoin is a powerful trading companion designed to generate high-probability entry signals with dynamic TP/SL/DP levels based on volatility. Built-in performance tracking shows win/loss stats, PP1/PP2 hits, and success rates all updated live. Key Features: Buy/Sell signals with adaptive volatility bands Real-time TP/SL/DP levels based on ATR Built-in MA Filter with optional ATR/StdDev volatility Performance stats panel (Success, Profit/Loss, PP1/PP2) Alerts via popup, sound, push, or email Cust
Gold Sniper Scalper Pro
Ich Khiem Nguyen
3.5 (8)
Gold Sniper Scalper Pro è un indicatore professionale per MetaTrader 5, progettato per supportare i trader nell'identificare punti di ingresso e gestire il rischio in modo efficace. L'indicatore fornisce un set completo di strumenti analitici che include un sistema di rilevamento dei segnali, gestione automatica di Entry/SL/TP, analisi del volume e statistiche delle performance in tempo reale. Guida utente per comprendere il sistema   |   Guida utente per altre lingue CARATTERISTICHE PRINCIPALI
FX Dynamic MT5
Daniel Stein
5 (5)
FX Dynamic: Monitora volatilità e trend con un’analisi ATR personalizzabile Panoramica FX Dynamic è uno strumento potente che sfrutta i calcoli di Average True Range (ATR) per fornire ai trader informazioni impareggiabili sulla volatilità, sia giornaliera che intraday. Impostando soglie di volatilità chiare—ad esempio 80%, 100%, 130%—puoi individuare rapidamente opportunità di profitto o ricevere avvisi quando il mercato supera i range abituali. FX Dynamic si adatta al fuso orario del tuo brok
PZ Swing Trading MT5
PZ TRADING SLU
5 (5)
Protect against whipsaws: revolutionize your swing trading approach Swing Trading is the first indicator designed to detect swings in the direction of the trend and possible reversal swings. It uses the baseline swing trading approach, widely described in trading literature. The indicator studies several price and time vectors to track the aggregate trend direction and detects situations in which the market is oversold or overbought and ready to correct. [ Installation Guide | Update Guide | Tro
Introduction to X3 Chart Pattern Scanner X3 Cherart Pattern Scanner is the non-repainting and non-lagging indicator detecting X3 chart patterns including Harmonic pattern, Elliott Wave pattern, X3 patterns, and Japanese Candlestick patterns. Historical patterns match with signal patterns. Hence, you can readily develop the solid trading strategy in your chart. More importantly, this superb pattern scanner can detect the optimal pattern of its kind. In addition, you can switch on and off individu
ARIScalping
Temirlan Kdyrkhan
ARIScalp is a powerful trading companion designed to generate high-probability entry signals with dynamic TP/SL/DP levels based on volatility. Built-in performance tracking shows win/loss stats, PP1/PP2 hits, and success rates all updated live. Key Features: Buy/Sell signals with adaptive volatility bands Real-time TP/SL/DP levels based on ATR Built-in MA Filter with optional ATR/StdDev volatility Performance stats panel (Success, Profit/Loss, PP1/PP2) Alerts via popup, sound, push, or email Cus
Trend Forecaster
Alexey Minkov
5 (7)
The Trend Forecaster indicator utilizes a unique proprietary algorithm to determine entry points for a breakout trading strategy. The indicator identifies price clusters, analyzes price movement near levels, and provides a signal when the price breaks through a level. The Trend Forecaster indicator is suitable for all financial assets, including currencies (Forex), metals, stocks, indices, and cryptocurrencies. You can also adjust the indicator to work on any time frames, although it is recommen
Altri dall’autore
Pivot PDHL Levels
Vincent Jose Proenca
AutoPivot – Indicatore automatico dei punti pivot Indicatore MT4 che mostra i punti pivot (PP, R1/R2/R3, S1/S2/S3) e i livelli del giorno precedente (PDH/PDL). Caratteristiche principali: Adattamento automatico al timeframe del grafico (H4/D1/W1) Zone tra PDH/PDL e il livello di supporto/resistenza più vicino 8 temi di colore preconfigurati Personalizzazione completa di colori, stili di linea e opacità delle zone Etichette compatte con visualizzazione opzionale del prezzo Aggiornamenti automatic
Volume Profile Density V2.40 Mostra la distribuzione del volume per livello di prezzo, evidenziando le zone di interesse istituzionale. A differenza del volume tradizionale (nel tempo), indica dove il volume si è realmente concentrato. Principi base: Barre orizzontali = volume scambiato a ciascun prezzo Barra più lunga → volume maggiore Zone rosse = principali supporti/resistenze Utilizzi principali: Identificare supporti e resistenze reali Determinare il POC (Point of Control) Definire la Value
FREE
AMD Adaptive MA MT4
Vincent Jose Proenca
5 (1)
Media Mobile Adattiva AMD (AAMA) AAMA è un indicatore di media mobile adattiva per MetaTrader 4 che regola automaticamente la sua reattività in base alle condizioni di mercato. Caratteristiche principali: Media mobile adattiva basata sul Rapporto di Efficienza di Kaufman – reagisce rapidamente durante i trend e filtra il rumore nelle fasi laterali Rilevamento automatico delle 4 fasi di mercato AMD: Accumulazione, Markup (rialzo), Distribuzione, Markdown (ribasso) Adattamento alla volatilità tra
SmartBubbles MT5
Vincent Jose Proenca
Indicatore a Bolle — Rallentamento del Prezzo + Picco di Volume Uno strumento visivo semplice che mostra quadrati colorati sul grafico quando il prezzo rallenta improvvisamente accompagnato da un picco di volume. (Funzione di riempimento con effetto bolle concentriche) Aiuta a individuare i momenti chiave in cui il mercato si prepara a muoversi. Cosa fa l’indicatore: Rileva i momenti in cui il mercato “esita” prima di muoversi Mostra dove entra grande volume senza variazioni significative di pre
Proxy OrderFlow MT4
Vincent Jose Proenca
5 (1)
Indicatore basato sul disequilibrio del tick-spread. TF: Funziona su tutti i timeframe (da M1 a D1). Coppie: Compatibile con Forex, indici, oro e CFD (regolazione automatica per JPY, Oro e CFD). Impostazioni: TickWindow (200) – finestra di osservazione dei tick SpreadWeight (1.5) – peso dello spread NormalizationPeriod (20) – periodo di normalizzazione (z-score) Overbought / Oversold (±3.0) – soglie di allerta AlertCooldown (300s) – tempo di raffreddamento tra gli avvisi Conclusione: Proxy Or
MTF TREND DASHBOARD - Analizzatore di Trend Multi-Timeframe Un potente pannello visivo che mostra la direzione del trend su 7 timeframe simultaneamente (M1, M5, M15, M30, H1, H4, D1). === CARATTERISTICHE PRINCIPALI === Rilevamento del trend in tempo reale tramite incrocio delle EMA Valori RSI con codici colore per ipercomprato/ipervenduto Barre dinamiche di intensità del trend Segnale di bias del mercato (Strong Buy/Sell, Bias, Weak, Neutral) Visualizzazione in tempo reale di Spread, ATR, Bid/As
Iceblock Volume
Vincent Jose Proenca
Frase breve: Iceblock — indicatore MT4 che identifica cluster di alto volume con limitato movimento di prezzo (comportamento simile a iceberg). TF: Funziona su tutti i timeframe (M1–D1). Coppie: Compatibile con Forex, indici, oro e CFD. Impostazioni: VolumeLookback – numero di candele per la media del volume VolumeThreshold – moltiplicatore per considerare il volume anormale ClusterSize – numero di candele vicine per confermare un cluster RangeComparisonPeriod – periodo per la media degli int
FREE
SimpleCustomBox
Vincent Jose Proenca
SimpleCustomBox – Indicatore MT5 per Box di Sessione e Linee di Massimo/Minimo Panoramica: SimpleCustomBox è un indicatore potente e facile da usare per MetaTrader 5 che ti consente di evidenziare visivamente specifiche sessioni di trading sul grafico. Definisci intervalli di tempo personalizzati, visualizza immediatamente i massimi e i minimi della sessione e prendi decisioni di trading più intelligenti grazie a confini visivi chiari. Perfetto per day trader, scalper e per chi opera con patter
Mean Reversion Probability – Indicatore di Reversione Statistica Descrizione breve Indicatore istituzionale che calcola la probabilità statistica di un ritorno alla media mobile 200, basato sull’analisi delle sovra-estensioni storiche. Identifica con precisione quantitativa le zone di affaticamento del mercato. Caratteristiche principali Analisi statistica avanzata – Costruisce un database di oltre 500 estensioni storiche per calcolare probabilità reali Punteggio di probabilità 0–99% – Quantif
Spikes Signal
Vincent Jose Proenca
Spike Signal v1.2 — indicatore MT5 che rileva spike esplosivi Boom/Crash e genera segnali di scalping in tempo reale. TF: Funziona su tutti i timeframe (consigliato M1–M15). Coppie: Progettato per indici sintetici Boom/Crash (Deriv), adatto anche a mercati volatili. Impostazioni: SpikeSensitivity / MinSize – sensibilità e dimensione minima del picco EMA (8/21) – segnali di ingresso RSI (14) – filtro di tendenza TP/SL Points – take profit e stop loss Trailing Exit / Alerts – logica di uscita e
Personnal VWAP V2
Vincent Jose Proenca
PVWAP Improved MT5 – Indicatore avanzato del Volume Weighted Average Price PVWAP Improved MT5 e una versione migliorata e ottimizzata del mio indicatore VWAP personale. Mostra il prezzo medio ponderato per il volume insieme a diverse bande di deviazione standard, utili per identificare zone potenziali di supporto, resistenza e indebolimento del trend. Funziona su tutti i timeframe ed e leggero anche con grandi quantita di dati storici. Scopo dell indicatore Il VWAP rappresenta il prezzo medio al
CustomBreakout
Vincent Jose Proenca
Range Breakout EA – Simple Description Concept An automated trading robot for MetaTrader 5 that exploits range breakouts with two key periods: Features Automatic market hours management Customizable Stop Loss and Take Profit Smart Trailing Stop Built-in testing mode for simulation Detailed logs for monitoring How It Works Records extreme prices at the start of the day Waits for a breakout of the secondary range Opens a position in the breakout direction Automatically manages the trade (SL/TP/Tr
FREE
Liquidity Compression MT4
Vincent Jose Proenca
5 (1)
Indicatore Istituzionale di Compressione della Liquidità L’indicatore misura in tempo reale il restringimento della liquidità utilizzando la larghezza normalizzata delle Bande di Bollinger, il volume e lo spread medio, per individuare le fasi di compressione prima dei breakout di prezzo. Visualizzazione: Finestra separata in stile professionale, con istogramma “Compression Score” e linea di soglia (“Threshold”). Caratteristiche Principali Rilevamento precoce: Identifica le zone di contrazione p
VolumeSR MT4
Vincent Jose Proenca
his indicator automatically identifies key support and resistance levels by analyzing volume patterns. Unlike traditional S/R tools that rely only on price, Volume S/R finds levels where the market truly reacted.   DETECTION LOGIC: - High Volume Zones: Price levels where strong buying/selling occurred - Low Volume Zones: Areas of weak interest - potential breakout or reversal zones   SMART FILTERING: - Nearby levels are automatically merged to avoid chart clutter - Maximum levels limit keeps yo
FREE
VWAP Personnal Custom
Vincent Jose Proenca
VWAP_PC_MQL5 — a simple home-built VWAP indicator showing real-time volume-weighted price levels directly on your MT5 chart. TF: Works on all timeframes. Pair: Compatible with all symbols — Forex, indices, commodities, and stocks. Settings: Applied Price – price type used for VWAP calculation (Close, Typical, Weighted, etc.) Line Color / Width / Style – customize VWAP line appearance Session Reset – optional reset per day or continuous mode How it works (VWAP principle): VWAP (Volume Weighted
FREE
Dynamic Pivot Zones
Vincent Jose Proenca
Dynamic Pivot Zones – Your Level Assistant on the Chart This indicator is a bit like a GPS for your trading . It shows you where the price likes to hang out, where it gets nervous, and where it flies through. No more calculating pivots by hand or guessing support and resistance levels. What it does: Automatically plots H1, H4, and D1 pivots . Shows support and resistance zones : R1, R2, S1, S2. Lines are colored and easy to read , so you can instantly see what’s hot or cold. Why you’ll love it:
FREE
PDHL – simply displays the highs and lows of previous days directly on your chart, providing a quick and visual reference of past key levels. The indicator is lightweight and easily customizable , allowing you to adjust the number of days displayed, the colors, as well as the style and thickness of the lines to suit your preferences. It is designed to be simple and practical, but may not work on all instruments or platforms . Only teste Tested only with CFDs
FREE
Institutional Flow Indicator A smart volume-based tool that detects institutional activity zones through direct order flow patterns. It reveals where large institutions operate. An advanced volume indicator that filters out noise to identify probable institutional patterns. Key Features Smart cluster detection Automatic identification Signal classification: Violet / Yellow – Institutional Zone – Strong, sustained institutional activity Red / Green – Strong Signal – Significant buying/selling pre
VMS Oscillator
Vincent Jose Proenca
Volume & Move Strength (VMS) Indicator for MT5 The VMS Indicator displays the relationship between trading volume and price movement strength, helping traders assess how well market activity supports price action. How It Works: Measures tick volume as trading activity. Calculates move strength using a normalized True Range (%). Both values can be smoothed (default: 5) and optionally normalized (0–100) for consistency across markets. Plots two lines in a separate window: Blue (Volume) – trading a
FREE
Volume-to-Price Movement Oscillator (VP Oscillator) for MT5 The VP Oscillator highlights the balance (or imbalance) between trading volume and price movement, helping traders spot hidden accumulation, distribution, or weakening trends. How It Works: Calculates each bar’s price range (High–Low) and tick volume. Normalizes both values over a set period (default: 14). Plots the absolute difference between them ×100 — showing how closely price action aligns with trading activity. Interpretation: Hig
FREE
Adaptive Flow MAs
Vincent Jose Proenca
Adaptive Flow MAs is a moving average indicator designed to naturally adjust to market movements. Unlike traditional averages, it dynamically adapts its periods based on recent volatility and the current trend. The EMA closely follows rapid price swings to capture every impulse, while the SMA remains smoother, providing a stable and reliable reference. With a clean display showing the current adaptive periods, this tool helps traders feel the “flow” of the market without visual clutter. It’s cr
FREE
STRUCTURAL TREND LINES - MT4/MT5 Indicator Simple indicator that automatically draws trend lines based on market structure. Features: - 3 degrees of structure detection (short, medium, long term) - Configurable swing strength for each degree - Single color per degree for clean visualization - Adjustable number of lines per degree - Customizable colors and line widths How it works: The indicator identifies swing highs and lows based on the strength parameter, then connects these points to crea
FREE
Better Moving Average
Vincent Jose Proenca
STRUCTURAL TREND LINES - MT4 Indicator Simple indicator that automatically draws trend lines based on market structure. Features: - 3 degrees of structure detection (short, medium, long term) - Configurable swing strength for each degree - Single color per degree for clean visualization - Adjustable number of lines per degree - Customizable colors and line widths How it works: The indicator identifies swing highs and lows based on the strength parameter, then connects these points to create t
FREE
Custom Box CFDs
Vincent Jose Proenca
Range Box Indicator for Trading Sessions This indicator allows traders to visualize and analyze specific time ranges directly on their chart by drawing rectangular boxes for each trading session. Key Features: Customizable session interval: set your own session start and end times. Number of days displayed: choose how many past sessions are visible. Default color and special color for Monday: easily highlight weekly patterns. Adjustable border width: customize the appearance of the rectangles to
FREE
Daily Bar Number CFD
Vincent Jose Proenca
indicator that numbers the bars (candles) in a custom trading session. The indicator allows: Defining the session start time (StartHour and StartMinute) Displaying numbers only on odd bars (if AfficherUniquementImpairs is true) Displaying numbers on the last N days (NbJours) Customizing the color and font size of the text The indicator will loop through the bars of the last N days and, for each day, start counting from the session start time. It will display the bar number (starting at 1) belo
FREE
This indicator allows you to number bars within a trading session for CFDs. It works on GER40, UK100, US30, US100, and US500 and is fully customizable to fit your trading style and chart preferences. Key Features & Parameters: Customizable session interval: define your own session start and end times Option to hide even numbers for a cleaner chart Adjust number distance to position the bar numbers as you prefer Font size and color: choose the size and color that suit your chart Number of days di
FREE
The Candle Activity Visualizer turns your chart into a dynamic heatmap, giving you a clear view of buying and selling pressure. In-Depth Market Insight: Active Zone Detection: The algorithm highlights areas where high volume builds up within a narrow price range, revealing key pressure zones. Real-Time Intensity: Colors adjust in real time, shifting smoothly from cool tones to warmer shades as activity increases. Visual Customization: 5 Color Palettes: Choose from five professionally designed th
Rainbow Price Visualizer v1.21 See where the market really breathes. Turns your MT4 chart into an ultra-precise heatmap that highlights price zones favored by big players. Why it matters 300 price levels at 0.2‑pip resolution — microscopic detail. 8 visual themes (Rainbow, Fire, Ocean…) for instant readibility. Smart opacity: low noise fades, real zones pop. Lightweight rendering with automatic cleanup. Fully customizable: saturation, opacity, resolution, history depth. Bands project into the f
Indicatore a Bolle — Rallentamento del Prezzo + Picco di Volume Uno strumento visivo semplice che mostra quadrati colorati sul grafico quando il prezzo rallenta improvvisamente accompagnato da un picco di volume. (Funzione di riempimento con effetto bolle concentriche) Aiuta a individuare i momenti chiave in cui il mercato si prepara a muoversi. Cosa fa l’indicatore: Rileva i momenti in cui il mercato “esita” prima di muoversi Mostra dove entra grande volume senza variazioni significative di pre
STRUCTURAL TREND LINES - MT4 Indicator Simple indicator that automatically draws trend lines based on market structure. Features: - 3 degrees of structure detection (short, medium, long term) - Configurable swing strength for each degree - Single color per degree for clean visualization - Adjustable number of lines per degree - Customizable colors and line widths How it works: The indicator identifies swing highs and lows based on the strength parameter, then connects these points to create t
Filtro:
Nessuna recensione
Rispondi alla recensione