Proxy Footprint
- インディケータ
-
Vincent Jose Proenca
 私はトレーダーとして10年以上の経験があり、主にCFDを専門としています。トレーディングの魅力は、論理性・規律・そして意思決定を簡単にするツールを作り出すことにあります。自分の手法に合うインジケーターが見つからなかったため、必要に迫られて自作を始め、次第にそれが楽しみになりました。
最初に開発したツールの一部は、Custom Box と Daily Bar Number です。これらのインジケーターは理論上の試作品ではなく、日常使用を目的に設計され、実際の市場環境でテスト・改良を重ねてきました。その結果、実用的で統合しやすく、情報過多に陥ることなく素早い判断を支援するツールが生まれました。 - バージョン: 1.0
- アクティベーション: 5
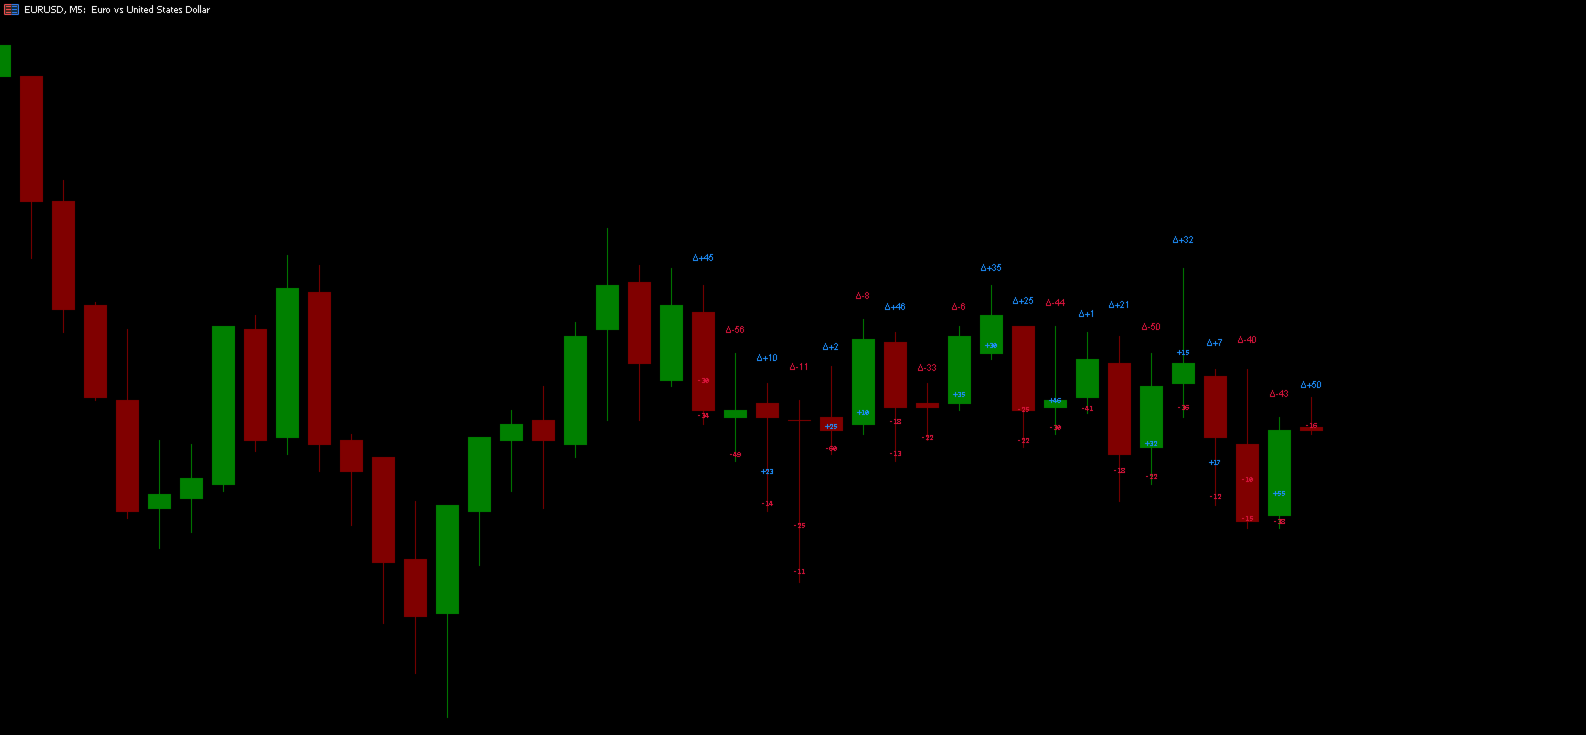
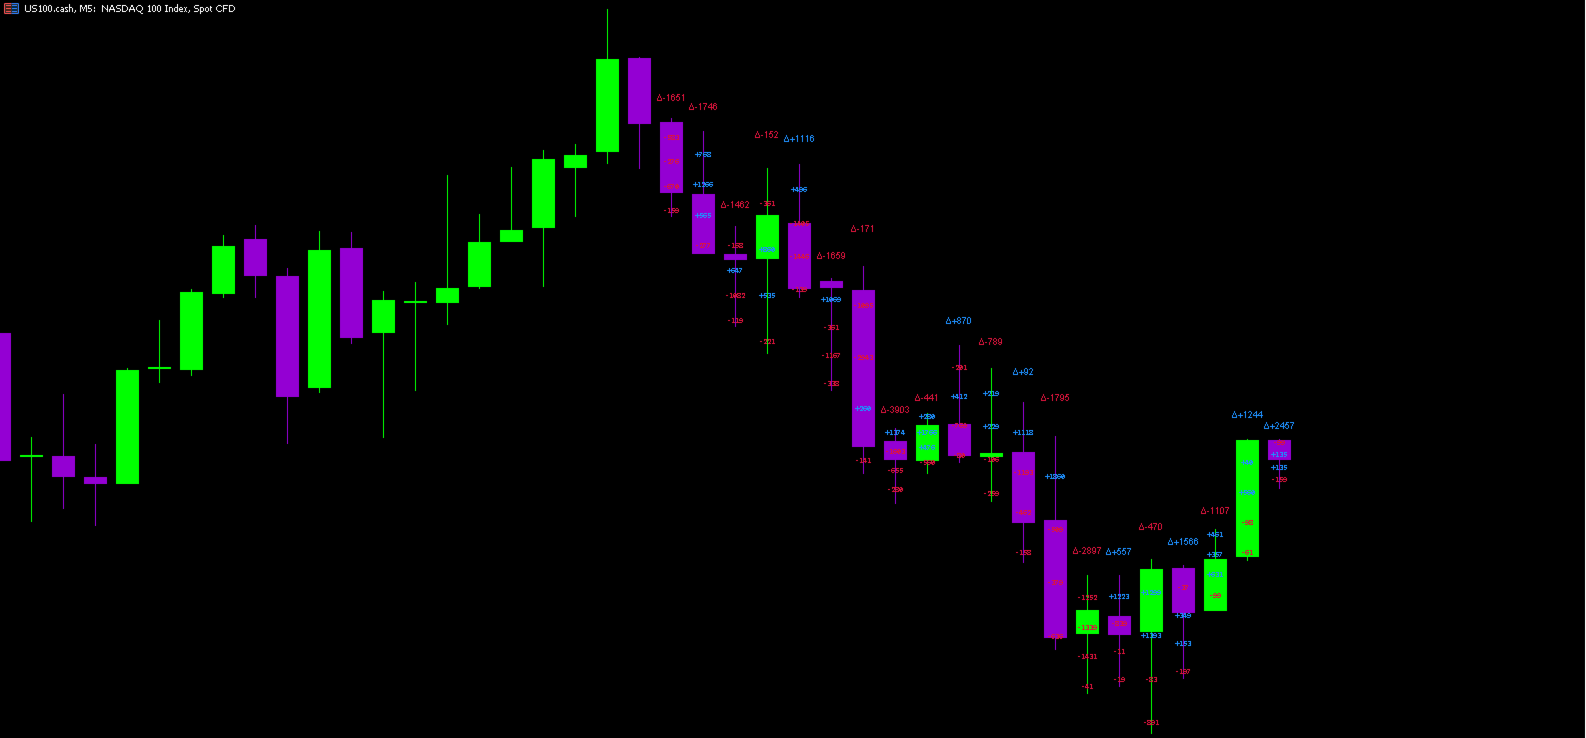
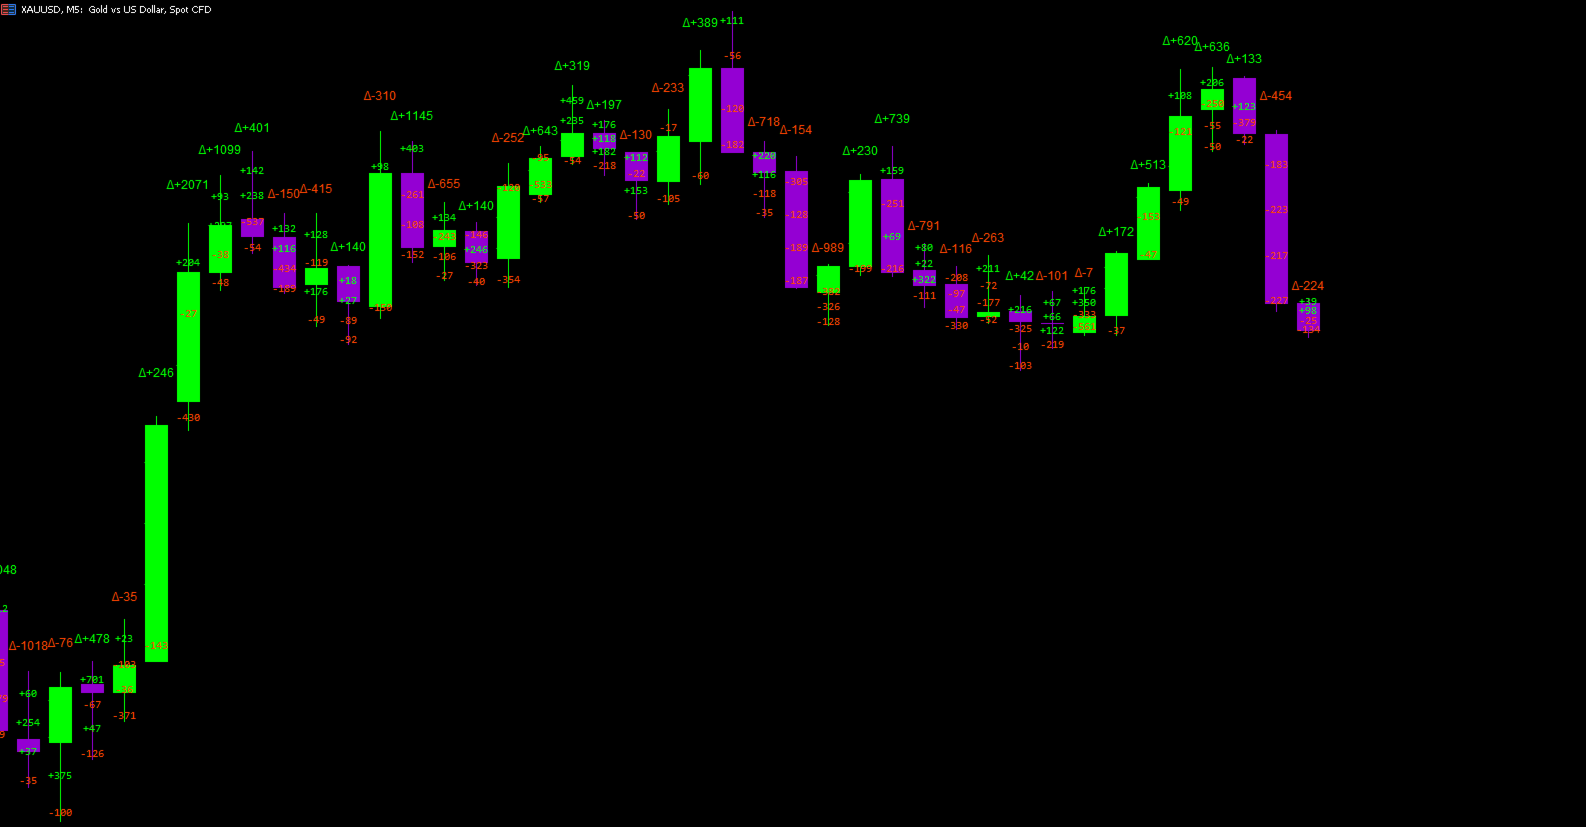
ProxyFootprint — 概要
ProxyFootprint Advanced は、MetaTrader 5 向けのオーダーフロー可視化インジケーターで、異なる価格レベルにおける買い圧力と売り圧力を分析・表示します。
これは何か(そして何ではないか)
重要: これは本物の フットプリントチャート ではありません。
本物のフットプリントチャートには、各価格レベルでの実際の注文板データ(買い/売りボリューム)へのアクセスが必要であり、それは取引所や専門データプロバイダーから提供されます。
本インジケーターは、公開されているティックデータを利用し、フットプリントチャートを模倣した視覚的な近似表現を作成します。
動作の仕組み
このインジケーターは、ティックごとの価格変動を分析して買い/売り圧力を推定します:
-
価格が上昇したティックは「買い圧力」として分類
-
価格が下落したティックは「売り圧力」として分類
-
各ローソク足内の複数の価格レベルで、デルタ(買い量 − 売り量)を計算・表示
主な機能
-
多層価格分析: 各ローソク足に最大8つのカスタマイズ可能な価格レベルでデルタを表示
-
ネットデルタ表示: 各バー全体の買い/売り圧力を表示
-
6つのビジュアルテーマ: Professional、Dark、Light、Vibrant、Classic、Custom
-
スマートフィルタリング: 視覚的なノイズを避けるために重要なデルタのみ表示
-
リアルタイム更新: 現在のローソク足を2秒ごとに更新
-
軽量設計: M1、M5、M15 タイムフレームに最適化
利用ケース
以下のようなトレーダーに最適です:
-
機関投資家向けのオーダーフローデータにアクセスできない環境で買い/売り圧力を可視化したい
-
ボリュームの不均衡をもとにサポート/レジスタンスレベルを特定したい
-
価格アクションをボリューム分析で確認したい
-
価格とデルタの乖離を検出したい
制限事項
-
実際の注文板データに基づくものではありません
-
精度はブローカーのティックデータの品質と提供範囲に依存します
-
ティック履歴が豊富な ECN/STP ブローカーで最も効果的
-
近似手法のため、市場のすべてのニュアンスを完全に反映できない場合があります
技術要件
-
プラットフォーム: MetaTrader 5
-
タイムフレーム: M5、M15
-
データ: 深いティック履歴を提供するブローカーが必要